Abstract
The deployment of autonomous robots is critical for advancing sustainable agriculture, but their effectiveness hinges on visual perception systems that can reliably operate in natural, real-world environments. Selecting an appropriate vision model for these robots requires a practical evaluation that extends beyond standard accuracy metrics to include critical deployment factors such as computational efficiency, energy consumption, and robustness to environmental disturbances. To address this need, this study presents a deployment-oriented benchmark of state-of-the-art You Look Only Once (YOLO)-based models for orange detection and segmentation. Following a systematic process, the selected models were evaluated on a unified public dataset, annotated to rigorously assess real-world challenges. Performance was compared across five key dimensions: (i) identification accurac, (ii) robustness, (iii) model complexity, (iv) execution time, and (v) energy consump-tion. The results show that the YOLOv5 variants achieved the most accurate detection and segmentation. Notably, YOLO11-based models demonstrated strong and consistent results under all disturbance levels, highlighting their robustness. Lightweight architectures proved well-suited for resource-constrained operations. Interestingly, custom models did not consistently outperform their baselines, while nanoscale models showed demonstra-ble potential for meeting real-time and energy-efficient requirements. These findings offer valuable, evidence-based guidelines for the vision systems of precision agriculture robots.
1. Introduction
Unsustainable agricultural practices are a major contributor to food waste, directly undermining the economic stability of farmlands, exacerbating environmental degradation, increasing greenhouse gas emissions, and threatening global food security [1,2,3]. In agricultural settings, food waste is primarily driven by human-related factors such as inefficient manual harvesting techniques, lack of automated yield estimation, non-standardised and unplanned production, labour shortage, and high labour cost [4]. As the world faces mounting challenges, such as hunger, increasing food demand, and resource scarcity, the need for sustainable food production systems has become more urgent than ever [1]. While conventional mechanisation is effective for robust crops like olives and wheat [5,6,7] to sustain food production, its broader role in precision agriculture is limited. These systems often lack autonomy and can damage delicate crops like strawberries and tomatoes [5,8,9].
In response to these limitations, the field of agricultural robotics has emerged over recent decades. This discipline applies automation and AI to farming practices, offering a promising pathway towards a more autonomous and precise farming future [5]. Compared with conventional practices, robotic systems have the potential to autonomously perform a variety of agricultural tasks such as delicately harvesting a wide range of crops without any fruit damage, plant monitoring, yield estimation, and targeted spraying [5,7]. These systems are typically equipped with robotic arms and various sensors including cameras and specialised end-effectors, enabling them to perform tasks with minimal latency, delicacy, and high efficiency [10,11,12,13]. However, despite their potential, many robotic solutions have yet to achieve commercial maturity, primarily due to the challenges posed by unpredictable outdoor environments that hinder sensing accuracy and operational performance [14,15,16].
Vision-based environmental challenges, such as variable illumination, cluttered backgrounds, and occlusion, directly impair the performance of agricultural tasks [17,18,19]. For instance, studies show that fruit occlusion alone can substantially decrease the precision of automated yield estimation, a key metric for farm management [20]. When such perception-related inefficiencies are scaled across major agricultural sectors, they can translate into billions in economic losses [21]. Therefore, overcoming these sensing challenges is not merely a technical objective; it is a critical step towards ensuring the economic viability and widespread adoption of agricultural robotics.
Addressing vision-based sensing challenges through advanced computer vision methods could directly enhance productivity and help mitigate food waste in agricultural lands [22,23]. To this end, crop detection and segmentation techniques have been widely employed to overcome these challenges. While detection techniques are effective for rough localisation and counting [20,24,25], the pixel-level masking of segmentation is essential for precision tasks like harvesting and targeted spraying, which require the accurate handling of individual crops [26,27,28,29,30,31,32]. However, semantic segmentation cannot differentiate between individual fruits or extract their spatial properties, making it unsuitable for tasks that require object-level precision. For many agricultural applications, for instance, segmentation [33,34], which identifies and separates individual crops, and amodal segmentation [18,35], which infers the overall shape of agricultural crops, plays a vital role in improving robotic vision in agricultural fields [22].
Detection and segmentation techniques in agriculture increasingly leverage deep learning (DL) models, which learn complex features from large-scale datasets to provide accurate and robust analysis under challenging conditions [15,17,25,26,35,36]. For example, an amodal segmentation approach combined with a U-Net architecture improved cucumber segmentation success rates by 4% compared with a baseline model [18]. Similarly, in the task of counting passion fruits, a detection method incorporating a multi-scale faster region-based convolutional neural network (MS-FRCNN) achieved an 8% higher precision than conventional Faster R-CNN models [37]. These DL models are typically evaluated by comparing their performance with baseline models in terms of identification accuracy.
While the real-time, single-stage YOLO architecture has become a standard in agricultural robotics, many academic model enhancements do not translate to practical viability, hindering commercial adoption. This creates a critical need for a systematic benchmark that evaluates state-of-the-art models on a unified dataset to assess their true deployment readiness. While existing studies offer valuable comparisons of identification accuracy [38,39,40], this single metric is insufficient for gauging real-world performance. Selecting a model for a robotic platform requires a deeper analysis of deployment-oriented factors including computational complexity, energy efficiency, processing speed, and robustness against environmental variations. The central problem this study addresses is the absence of a benchmark providing such a holistic evaluation. This gap is filled by systematically comparing YOLO models not only on their accuracy on the test data, but also on their practical viability for demanding agricultural scenarios.
To this end, the primary contributions of this study are as follows: (i) a systematic and deployment-oriented benchmark of state-of-the-art YOLO models for agricultural robotics; (ii) a multi-dimensional analysis of the trade-offs between accuracy and key deployment-critical aspects (e.g., robustness, computational complexity, and power consumption); and (iii) the formulation of a practical guide to assist practitioners in making evidence-based model selections for their specific application and hardware constraints. Through a systematic selection process, ten representative models were chosen and re-implemented using their original architectures to ensure consistent evaluation. Benchmarking was conducted on a dataset that was a publicly available and had environmental sensing challenges to facilitate fair and transparent comparison. The results show that among all evaluated models, only YOLOv5 derivatives surpassed a mAP@50:95 score of 0.64, highlighting their superior identification accuracy under natural conditions. However, their performance notably declined under increasing environmental disturbances such as illumination changes and cluttered background. In contrast, YOLO11 variants, such as base-YOLO11 and CO-YOLO, achieved the lowest mean drop ratios, 0.565 and 0.591, respectively, demonstrating greater robustness to disturbances commonly encountered in real-world agricultural settings. In terms of model complexity and computational efficiency, nano-sized models like TCAttn-YOLOv8, base-YOLO11, and CO-YOLO outperformed other models by offering fewer than 3 million parameters, execution times slightly above 5 milliseconds, and energy consumption below 1 joule. Conversely, YOLOv7-based models exhibited high computational demands, with giga floating point operations (GFLOPs) exceeding 130, which complicates their effective integration and operation on edge devices. These findings provide a practical guide for selecting models that balance identification accuracy, robustness, and efficiency to meet real-world operational constraints on farms, thus informing the development of autonomous agricultural robots capable of reliable performance in challenging environments.
The rest of the paper is organised as follows. Section 2 describes the model selection strategy used for benchmarking on an orange dataset. Addıtıonally, it introduces the selected model architectures with the proposed benchmarking methodology including data preparation, implementation details, hardware specifications, and evaluation metrics. Section 3 presents the experimental results along with a quantitative analysis of the key performance indicators. Section 4 discusses the findings with consideration for adaptation to task-specific conditions. Finally, Section 5 concludes the paper.
2. Materials and Methods
2.1. Model Selection
To ensure a structured and transparent model selection process, this benchmarking study followed the PRISMA [41] guidelines, commonly used in systematic literature reviews. This section outlines the search strategy, data preparation, and implementation details. The models were collected using the Web of Science Core Collection, which is an online bibliographic database for benchmarking. A three-part keyword query and filters were applied sequentially, as illustrated in Figure 1, resulting in the identification of 205 relevant studies. After applying filters, 188 papers were retrieved. In the relevance and scope check stage, 83 records were removed. After that, 66 records were included, and 39 records were excluded since their model architectures were not applicable for this study. Furthermore, the studies did not share enough sources for re-implementation, and comparisons were removed at this stage. Finally, six studies were included for benchmarking.
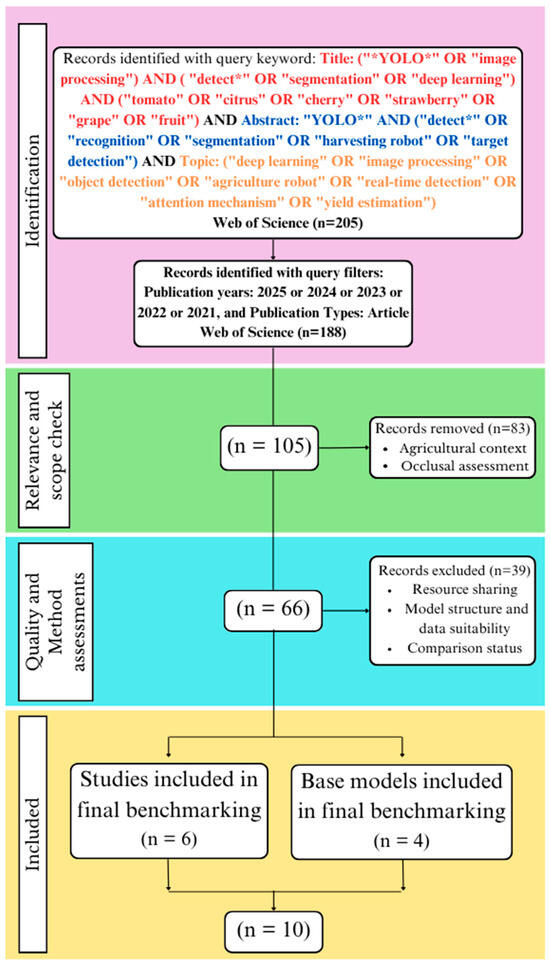
Figure 1.
PRISMA framework for model selection.
The chosen keywords targeted studies combining object detection, agriculture, and deep learning. Terms like “YOLO”, “detect”*, and “segmentation” focused on fast and accurate recognition models. Crop-specific words such as “tomato”, “citrus”, “cherry”, “strawberry”, and “grape” narrowed the scope to fruit-related applications. Including “image processing”, “deep learning”, and “object detection” ensured the coverage of core techniques, while “harvesting robot” and “attention mechanism” helped identify practical and architectural contributions. Overall, this combination effectively filtered the literature on YOLO-based methods for fruit detection and agricultural robotics.
To ensure a rigorous and practically reliable benchmarking evaluation, four additional baselines (YOLOv5, YOLOv7, YOLOv8, and YOLO11) were also incorporated into the study. These models were not directly identified through the literature search but were instead selected based on their wide adoption and proven effectiveness in real agri-tasks. Selection of these models was supported by publicly available metrics such as GitHub repository popularity (e.g., number of stars and community contributions), up-to-date release cycles, and their inclusion in widely used platforms including Roboflow and Ultralytics. Additionally, their inclusion was essential for a fair comparison, as they serve as the foundational architectures for several of the custom models selected via PRISMA. Overall, the benchmarking study was completed with ten distinct models.
2.2. Benchmarking Models
YOLO [42] is a convolutional neural network (CNN)-based object detection architecture that performs classification and localisation in a single forward pass, enabling real-time inference. Since 2016, the YOLO framework has undergone several iterations, each enhancing accuracy, robustness, and architectural efficiency [43]. Its single-stage design offers notable speed advantages over two-stage detectors, while its global context awareness improves the detection of agricultural products [44,45]. In this study, the focus was placed on YOLO-based models, with particular emphasis on their deployment-oriented performance in agricultural environments. The models selected for benchmarking are briefly introduced below.
2.2.1. YOLOv5
YOLOv5 [46], released by Ultralytics in 2020, is a fast and lightweight object detection model developed using the PyTorch (2.4.1) framework. It features CSPDarknet53 as its backbone, which enhances the original Darknet-53 by incorporating cross-stage partial (CSP) connections to improve feature extraction efficiency. A path aggregation network (PANet) was used as the neck to enable effective multiscale feature fusion. This architectural design aims to balance accuracy and speed, making YOLOv5 a versatile solution for real-time object detection tasks including those in agricultural settings [47]. In this study, the small-sized (s) version of YOLOv5 was used and referred to as base-YOLOv5.
2.2.2. GrapeDetectNet (GDN)
GDN [48] is a customised object detection model built on YOLOv5s, designed to enhance detection performance in unstructured (i.e., dynamic and unpredictable settings) vineyard environments. It integrates a dual-channel feature extraction attention (DCFE) module for improved feature representation and employs dynamic snake convolution (DS-Conv) in the backbone to better capture irregular object boundaries. GDN achieved consistent improvements over YOLOv5s, also demonstrating enhanced robustness in detecting grape clusters, further highlighting its suitability for agricultural scenarios.
2.2.3. Improved YOLOv5
The YOLOv5 [49] model used in this study integrates key neck components within both the backbone and head, creating a streamlined architecture. The backbone starts with a focus layer that preprocesses the input image by slicing and stacking channels, followed by BottleneckCSP and spatial pyramid pooling (SPP) layers to enhance multiscale feature extraction. This design aims to improve the localisation accuracy, thereby boosting the overall detection performance. The model was evaluated across various occlusion scenarios, such as unoccluded tomatoes, leaf-occluded, and branch-occluded instances, demonstrating its effectiveness in object detection tasks.
2.2.4. YOLOv7
YOLOv7 [50], introduced in 2022, represents some architectural advancements in the YOLO series. It incorporates extended efficient layer aggregation networks (E-ELANs) to improve both the accuracy and inference speed. Unlike its predecessors, YOLOv7 introduces model reparameterisation and auxiliary head supervision within a unified single-stage framework. These innovations enhance learning efficiency and contribute to improved robustness, particularly in real scenarios. The architecture is designed to strike a balance between computational efficiency and detection performance. For consistency, YOLOv7 is referred to as base-YOLOv7 in this study.
2.2.5. DSW-YOLO
As a customised object detection model built upon YOLOv7, DSW-YOLO [51] is specifically designed for detecting ripe strawberries and estimating their occlusion levels in the natural agri-scenes. It integrates a DCN-ELAN module, where Deformable Convolution v3 (DCNv3) is embedded into the ELAN structure to enhance feature extraction for irregularly shaped objects. Additionally, a shuffle attention (SA) mechanism is applied at the end of the backbone to improve focus on relevant features and boost detection accuracy.
2.2.6. YOLOv8
Ultralytics released YOLOv8 [52] in 2023 as a modular and efficient object detection model built on the PyTorch framework. It features a CSPDarknet backbone enhanced with optimised bottleneck and C2f modules, which improve feature extraction while maintaining computational efficiency. A PANet neck is employed for effective multiscale feature fusion. Unlike previous YOLO versions, YOLOv8 adopts an anchor-free detection head and a decoupled head structure, which together balance the accuracy and speed. This design enables the model to handle real-time visual tasks such as object detection, segmentation, and pose estimation across a range of applications. Its scalable architecture and lightweight variants support flexible deployment on both edge devices and high-performance computing platforms. In this study, the small-sized variant is referred to as base-YOLOv8.
2.2.7. NVW-YOLOv8
To tackle the challenges of tomato segmentation in complex environments, an improved YOLOv8s-based model, NVW-YOLOv8s, was proposed in [53]. This model introduces a novel C2f-N module derived from the original YOLOv8 C2f block, integrating three BottleneckCSP units and two Conv-BN-SiLU layers. Additionally, a normalisation-based attention module (NAM) is embedded within C2f-N to enhance salient feature extraction through sequential channel and spatial attention, improving feature representation. Architecturally, four C2f blocks in the neck and one in the backbone are replaced with C2f-N modules to reinforce multiscale feature aggregation. These enhancements collectively boost YOLOv8s’s detection and segmentation performance, especially for small targets.
2.2.8. TCAttn-YOLOv8
TCAttn-YOLOv8 [54] was proposed for tomato detection and counting based on YOLOv8s. It adds a new detection layer to the neck and head structure to better detect small tomatoes. The model includes ColBlock, a dual-branch module using transformer techniques to improve feature extraction and fusion. This helps focus on dense regions and reduces the loss of small object features in complex backgrounds. Also, C2fGhost and GhostConv modules in the neck reduce the model size and computation, making feature representation more efficient.
2.2.9. YOLO11
YOLO11 [55], released by Ultralytics, introduces several architectural innovations to improve object detection performance. It features the new C3k2 block (cross stage partial with kernel size 2), SPPF (spatial pyramid pooling-fast), and C2PSA (convolutional block with parallel spatial attention) components. These enhancements strengthen feature extraction in both the backbone and neck, enabling more precise detection in complex scenarios. YOLO11 also optimises its architecture and training pipeline for improved speed and efficiency. This balance of accuracy and performance makes YOLO11 suitable for real-time applications across various domains. Nano-sized (n) YOLO11 is hereafter referred to as base-YOLO11.
2.2.10. CO-YOLO
CO-YOLO [56] is a posture detection model based on the YOLO11n architecture. It replaces the original C3f2 module with the multiscale aggregation attention (MMA) module, which fuses feature information across multiple scales to improve perceptual capability and posture recognition accuracy. The model also introduces the depth pointwise convolutional (DPW) module in the backbone and neck, replacing standard convolutions. This enhances channel feature fusion, improves posture feature representation in target regions, and reduces the number of parameters. The improved architecture leads to more efficient training while maintaining high detection accuracy in complex agri-scenes.
2.3. Proposed Benchmarking
2.3.1. Dataset
The dataset used in this study consists of 1000 RGB images captured in outdoor environments within an orange orchard, reflecting natural challenges. The images were sourced from a publicly available dataset aimed at fruit detection applications [57]. To prepare the data for benchmarking, 3749 oranges were annotated manually in the Roboflow annotation platform using instance segmentation polygon masks that fully enclosed each orange object. After labelling, the dataset was divided into 700 images for training, 200 for validation, and 100 for testing. Any data augmentation method or post-processing operation was applied to the dataset. The dataset was formatted according to specific model types.
To evaluate the robustness of models under different levels of disturbance, the test set was further augmented to create four distinct subsets: original (without disturbance), low-level, medium-level, and high-level disturbance scenarios, as shown in Figure 2. These variations were designed with real-world sensing robustness challenges in mind, simulating common issues such as illumination variability, cluttered background, and colour and shape inconsistencies [15].
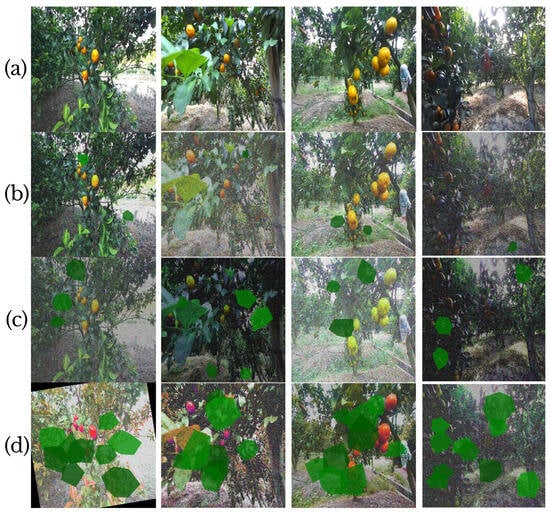
Figure 2.
Example images of test subsets with different disturbance levels: (a) original image without disturbance [57]; (b) low-level, (c) medium-level, and (d) high-level disturbances with severe distortions. These subsets were synthetically generated to simulate a range of real-world environmental challenges. The methodology for creating them, as detailed in the main text, involves a combination of controlled image transformations including adjustments to brightness, contrast, and hue as well as the addition of Gaussian noise and random rotations.
The disturbances were introduced through a set of controlled image transformations. Specifically, the brightness and contrast levels were randomly adjusted to simulate varying lighting conditions; Gaussian noise was added to mimic sensor noise and background complexity, and hue and saturation were altered to reflect the colour and shape variability. In the high-level disturbance setting, random rotations were also included to account for pose and orientation changes. Each level of disturbance was implemented using predefined transformation pipelines, ensuring a systematic and repeatable simulation of robustness conditions. The techniques and parameters applied for each disturbance level are presented in Table 1.

Table 1.
Disturbance dataset parameters for different levels.
2.3.2. Implementation Details
The models were rebuilt using their original architectures provided in the references. While backbone and neck structures were retained, the output heads were replaced with Segment and ISegment blocks (used only in YOLOv7 and DSW-YOLO) to enable mask generation. For base-YOLOv7 and DSW-YOLO, the segmentation setup followed the configuration in [58]. All models were trained and evaluated at an input resolution of 640 × 640. Minor structural adjustments were made to align the shared segmentation head with each model’s feature map outputs, limited to resolution or channel compatibility without altering the core architectural design. To isolate architectural performance, original loss functions were retained, and loss-specific modifications were excluded from benchmarking. Despite implementation differences across codebases (Ultralytics and YOLOv7), no changes were made to loss definitions. This setup ensured consistency and fairness in evaluating the models’ backbone and neck designs.
2.3.3. Experimental Setup
All models were implemented using Python 3.8.20 and PyTorch 2.4.1 with CUDA 12.1 support. The training and inference procedures were performed on a system equipped with an NVIDIA GeForce RTX 3060 GPU (12 GB VRAM). To ensure consistency across experiments, the batch size was fixed at 8, and all models were trained for 100 epochs using identical training, validation, and testing splits. A standard training procedure was applied without incorporating additional optimisation strategies. In this study, the optimiser selected was SGD, with an initial learning rate of 0.01, a momentum factor of 0.937, and a weight decay coefficient of 0.0005. The hardware and software configuration remained unchanged during the entire benchmarking process to provide a fair and controlled comparison among the evaluated models.
2.3.4. Evaluation Metrics
Identification accuracy was evaluated for both the bounding box (BB) and mask (M) outputs. The evaluation included precision (P), recall (R), mean average precision at an intersection over union (IoU) threshold of 50% (mAP@50), and mean average precision averaged over IoU thresholds from 50% to 95% (mAP@50:95). The corresponding performance metrics are defined in Equations (1)–(4).
where TP (true positives) refers to the number of correctly identified positive instances, FP (false positives) indicates negative instances misclassified as positive, FN (false negatives) denotes positive instances that were not detected by the model, AP represents the area under the precision–recall curve for a single class, and mAP corresponds to the mean of AP values across all classes.
To evaluate model robustness under varying levels of disturbance, a robustness scoring framework was introduced for both BB and M outputs, based on the relative drop in mAP@50 and mAP@50:95. For each model, the average drop across these four metrics was calculated and scaled to a 1–10 range, where higher values indicate greater robustness. The robustness score for model is defined in Equation (5).
where is the average proportional decrease in performance observed in model across all disturbance levels, and i is the set of all models’ mean drop ratios. Each drop ratio is computed as , where and are the metric values under the original and high disturbance conditions, respectively.
Model complexity is quantified using two metrics: GFLOPs and the number of parameters in the model. These are defined in Equations (6) and (7), respectively, as follows:
While model execution is directly measured by inference time tinf (ms), energy consumption is calculated using Equation (8).
where denotes the energy in joules, is the average power in watts, and is the total inference time in seconds
3. Results
3.1. Identification Accuracy
3.1.1. YOLOv5 Derivatives
In the BB(P) comparison (Table 2), improved-YOLOv5 emerged as the top-performing model with a success rate of 0.839. The second-best model, GDN, achieved 0.837, while base-YOLOv5 remained at 0.815. These notable improvements by custom models in BB(P) are attributed to advanced feature extraction strategies. In improved-YOLOv5, components such as the focus block, enhanced bottlenecks, and SPP contributed to a 0.024 increase in BB(P) compared with base-YOLOv5. Similarly, the DCFE and DS-Conv modules in GDN contributed to its strong performance, also surpassing base-YOLOv5.
Table 2.
Performance results of the YOLOv5 derivatives.
A similar trend was observed in M(P). GDN achieved 0.838, while improved-YOLOv5 led with 0.843. Notably, improved-YOLOv5 performed even better in M(P) than in its own BB(P) score, underscoring the effectiveness of its enhanced backbone for segmentation tasks.
Nevertheless, BB(R) and M(R) improvements in performance fell short of the BB(P) and M(P) improvements. For BB(R), improved-YOLOv5 yielded similar results to base-YOLOv5, and GDN achieved 0.836, underperforming by 0.011 compared with base-YOLOv5. In the M(R) comparison, base-YOLOv5 delivered the best results with 0.844, and performances of the improved-YOLOv5 and GDN were limited.
For BB (mAP@50), base-YOLOv5, improved-YOLOv5, and GDN achieved scores of 0.916, 0.920, and 0.915, respectively. Under the 0.50 IoU threshold, improved-YOLOv5 showed a slight performance gain, while base-YOLOv5 and GDN produced nearly identical results. A similar trend was observed in the M(mAP@50) scores, where improved-YOLOv5 achieved the highest performance with a score of 0.918.
Sensing challenges negatively impacted all mAP@50:95 scores, which is a more sensitive evaluation metric. For instance, improved-YOLOv5, the top-performing model among the YOLOv5 derivatives, achieved a BB (mAP@50:95) score of 0.742, representing an almost 18% decrease compared with its BB (mAP@50) score. Similarly, base-YOLOv5 scored 0.739 in BB (mAP@50:95), while GDN showed comparable performance with 0.738. For M(mAP@50:95), the scores also declined in line with the bounding box results. However, base-YOLOv5 led with 0.653, followed closely by improved-YOLOv5 at 0.649 and GDN at 0.642.
3.1.2. YOLOv7 Derivatives
When comparing the two YOLOv7-based models as shown in Table 3, base-YOLOv7 outperformed DSW-YOLOv7 by 0.011 in BB(P). Although base-YOLOv7 remained ahead in M(P) with a score of 0.855, the performance gap narrowed to just 0.006, as DSW-YOLO achieved 0.849. In contrast, the BB(R) comparison favoured DSW-YOLO, which scored 0.834, surpassing base-YOLOv7’s 0.82. A similar trend was observed in M(R), where DSW-YOLO led with 0.828 compared with base-YOLOv7’s 0.819.
Table 3.
Performance results of the YOLOv7 derivatives.
For both BB (mAP@50) and BB(mAP@50:95), the two models reported similar results. Their performances were also nearly identical for M(mAP@50), with both base-YOLOv7 and DSW-YOLO scoring 0.908. The primary difference appeared in M(mAP@50:95), where DSW-YOLO outperformed the base model. This improvement was attributed to the integration of the DCN-ELAN and shuffle attention modules, which enhanced DSW-YOLO’s ability to overcome challenges. Under the stricter IoU thresholds, DSW-YOLO achieved a score of 0.631, surpassing YOLOv7’s 0.623.
3.1.3. YOLOv8 Derivatives
In Table 4, base-YOLOv8 achieved a BB(P) score of 0.825, while the custom models NVW-YOLOv8 and TCAttn-YOLOv8 recorded 0.842 and 0.816, respectively. For M(P), NVW-YOLOv8 and TCAttn-YOLOv8 maintained the same scores as their BB(P) results. However, base-YOLOv8 improved slightly in M(P), achieving 0.835, which was 0.01 higher than its BB(P) score.
Table 4.
Performance results of the YOLOv8 derivatives.
In the BB(R) comparison, base-YOLOv8 achieved the highest performance with 0.838, followed by TCAttn-YOLOv8 at 0.824, and NVW-YOLOv8 with 0.806. For the M(R) metric, base-YOLOv8 and TCAttn-YOLOv8 showed similar success, while NVW-YOLOv8 scored 0.809, underperforming by 0.015 compared with the other two models.
Base-YOLOv8 was the most successful model in BB (mAP@50), achieving a score of 0.916. The custom models, NVW-YOLOv8 and TCAttn-YOLOv8, showed slightly lower performance, each with a score of 0.899. For M(mAP@50), base-YOLOv8 also led, while NVW-YOLOv8 and TCAttn-YOLOv8 scored 0.892 and 0.896, respectively.
The BB (mAP@50:95) results showed a significant drop compared with the BB (mAP@50) scores. Base-YOLOv8 led with a score of 0.738, outperforming NVW-YOLOv8 and TCAttn-YOLOv8, which scored 0.696 and 0.688, respectively. A similar pattern was observed in the M(mAP@50:95) results, where NVW-YOLOv8 maintained better performance compared with TCAttn-YOLOv8. Specifically, base-YOLOv8, NVW-YOLOv8, and TCAttn-YOLOv8 achieved 0.649, 0.638, and 0.61, respectively.
3.1.4. YOLO11 Derivatives
Among the YOLO11 derivatives, base-YOLO11 had a BB(P) score of 0.795, while CO-YOLO outperformed it with a score of 0.835, as can be seen in Table 5. Similarly, CO-YOLO improved upon base-YOLO11 by 0.04 in M(P) performance. However, CO-YOLO did not maintain this advantage in BB(R), scoring 0.836 compared with base-YOLO11’s higher 0.855. This trend was also reflected in the M(R) scores.
Table 5.
Performance results of the YOLO11 derivatives.
Base-YOLO11 achieved a BB (mAP@50) score of 0.904, while CO-YOLO slightly outperformed it with 0.91. The M(mAP@50) scores were slightly lower than the BB (mAP@50) scores, with 0.901 for base-YOLO11 and 0.907 for CO-YOLO. In the more stringent BB (mAP@50:95) evaluation, CO-YOLO again outperformed base-YOLO11, scoring 0.721 compared with 0.71. Similarly, for M(mAP@50:95), CO-YOLO scored 0.637, slightly higher than base-YOLO11’s 0.627.
3.2. Robustness
Model robustness was evaluated using datasets specifically constructed to simulate real-world disturbance scenarios, as detailed in the Dataset section. These datasets comprise four variants of the same data: original (undisturbed), and versions with low, medium, and high levels of disturbance. As illustrated in Figure 3, increasing the disturbance levels results in a clear decline in both mAP@50 and mAP@50:95 scores, highlighting the sensitivity of model performance to environmental variability.
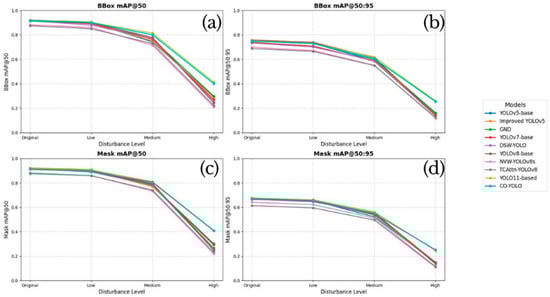
Figure 3.
Performance degradation of all models under increasing disturbance levels. The evaluation tracks robustness across both object detection and instance segmentation tasks, plotting four key metrics against each disturbance level (original, low, medium, high): (a) bounding box mAP@50, (b) bounding box mAP@50:95, (c) mask mAP@50, and (d) mask mAP@50:95.
Under original conditions, most models demonstrated high accuracy. CO-YOLO, base-YOLO11, base-YOLOv5, and GDN achieved top scores in both BB and M predictions. Notably, base-YOLOv8 attained the highest BB (mAP@50:95) value (0.758), reflecting precise localisation across multiple IoU thresholds. Similarly, CO-YOLO and base-YOLO11 exhibited strong and balanced scores across all tasks, with base-YOLO11 achieving 0.918 in both BB (mAP@50) and M(mAP@50), while CO-YOLO achieved 0.914 and 0.910, respectively.
When subjected to low-level disturbances, model performances remained relatively stable. The best-performing models in the original dataset (CO-YOLO, base-YOLO11, and GDN) experienced only minor declines. For example, CO-YOLO’s BB (mAP@50) dropped slightly from 0.914 to 0.899, while its M(mAP@50) decreased from 0.910 to 0.895. Similarly, base-YOLO11 maintained nearly all of its original performance, with scores of 0.902 (BB) and 0.905 (M). This level of stability suggests a strong generalisation ability in the presence of mild visual disturbances.
In the medium-level disturbance setting, performance variability became more pronounced. While most models experienced noticeable declines, CO-YOLO and base-YOLO11 continued to deliver strong results. Base-YOLO11 retained a BB (mAP@50) of 0.815 and M(mAP@50) of 0.811, closely followed by CO-YOLO with 0.801 (BB) and 0.805 (M). In contrast, models such as NVW-YOLOv8s and TCAttn-YOLOv8 showed greater performance degradation. For example, TCAttn-YOLOv8’s M(mAP@50) dropped from 0.875 to 0.741, while its M(mAP@50:95) fell from 0.614 to 0.495, indicating higher sensitivity to moderate visual disturbances.
The most challenging scenario, high-level disturbance, revealed various differences in model robustness. While many models experienced steep performance declines, particularly in segmentation tasks, CO-YOLO and base-YOLO11 maintained comparatively high accuracy. Base-YOLO11 achieved a BB (mAP@50) score of 0.415, with CO-YOLO scoring 0.402, clearly outperforming other models under the same conditions. In mask prediction, base-YOLO11 demonstrated a slightly better performance with a M(mAP@50) of 0.411 compared with 0.408 for CO-YOLO. However, under the more demanding M(mAP@50:95) metric, CO-YOLO retained a slight advantage, scoring 0.251 versus base-YOLO11’s 0.245. These results suggest that both models exhibit a strong resilience to high-level visual disturbances.
To quantitatively assess this aspect, the robustness scores of all models are summarised in Table 6. These scores highlight that base-YOLO11 (10.00) and CO-YOLO (9.45) exhibited the highest robustness under high-level disturbances, showing relatively minimal performance degradation across all metrics. On the other hand, models such as NVW-YOLOv8s (0.00), base-YOLOv8 (0.16), and DSW-YOLOv8 (0.67) demonstrated lower robustness, indicating greater sensitivity to disturbance-induced degradations.
Table 6.
Robustness ranking of the models according to different disturbance levels.
In addition to robustness across different disturbance levels, consistency between the BB and M results is another indicator of model stability. CO-YOLO and base-YOLO11 exhibited minimal divergence between these two tasks across all disturbance levels, reflecting a balanced detection and segmentation capability. In contrast, custom YOLOv8-based models, such as TCAttn-YOLOv8 and NVW-YOLOv8s, showed greater fluctuation between the BB and M outputs, especially under high disturbance.
In summary, while most models performed successfully under undisturbed or low-level disturbed conditions, only a select few, most notably CO-YOLO and base-YOLO11, consistently preserved high accuracy and robustness across all levels of visual disturbance. Their strong generalisation capabilities make them particularly well-suited for real-world agricultural applications, where challenging sensing environments are inevitable.
3.3. Computational Complexity
In terms of computational complexity, considerable variation was observed across the evaluated models. While minor differences in GFLOPs and parameter counts may arise due to re-implementation with segmentation heads, these variations are negligible and do not compromise the fairness or consistency of the comparison.
Among the YOLOv5-based architectures, base-YOLOv5 required 37.8 GFLOPs, while improved-YOLOv5 demanded slightly more at 41.5 GFLOPs. GDN, which is also derived from YOLOv5, exhibited a considerably higher complexity with 65.2 GFLOPs. Similarly, DSW-YOLO and base-YOLOv7, both belonging to the YOLOv7 family, demonstrated the highest computational loads at 137.3 and 142.6 GFLOPs, respectively. YOLOv8 variants such as base-YOLOv8 and NVW-YOLOv8 showed moderate complexity around 42.5 and 42.4 GFLOPs, while TCAttn-YOLOv8 had a relatively low GFLOP value of 16.0. Finally, lightweight models like base-YOLO11 and CO-YOLO stood out with only 10.2 and 12.0 GFLOPs, demonstrating strong efficiency for resource-constrained scenarios.
To contextualise these findings, the relationship between model complexity and hardware capability was analysed using GFLOPs-based comparisons. As shown in Table 7, each model’s computational demand was aligned with the corresponding device processing capacities, demonstrating that successful deployment requires matching the model complexity to device capabilities to ensure optimal performance and operational feasibility.
Table 7.
Evaluation of edge device support based on model GFLOPs.
A similar trend was observed in terms of parameter size. Base-YOLOv5 and improved-YOLOv5 contained 9.76 M and 9.93 M parameters, respectively, while GDN increased this figure to 15.98 M. The YOLOv8-based models held moderate parameter counts: base-YOLOv8 had 11.77 M, and NVW-YOLOv8 had 11.70 M. TCAttn-YOLOv8 stood out with its compact architecture at 2.96 M. In the higher range, base-YOLOv7 and DSW-YOLO required 37.86 M and 34.51 M parameters. Base-YOLO11 and CO-YOLO maintained their lightweight nature with 2.83 M and 2.70 M parameters, respectively, reinforcing their suitability for real-time applications.
3.4. Execution Time Analysis
In the execution time analysis, the real-time capability of each model was evaluated based on the total processing time per image, which includes preprocessing, inference, and postprocessing stages. All timing results were obtained using the validation set, as it provides a consistent and reproducible evaluation environment. While real-time deployment scenarios typically involve batch size = 1 to simulate frame-by-frame inference [59], all models were evaluated with batch size = 8 in this study. This setting was maintained across all experiments to ensure fairness and uniformity. As all models were tested under identical conditions, the comparison remains valid, and any minor variations due to batching are considered negligible.
The experimental results indicate that TCAttn-YOLOv8 achieved the lowest total processing time at 5.1 ms, followed closely by base-YOLO11 (5.5 ms) and CO-YOLO (5.9 ms). These three models are nanoscale architectures, which explains their superior speed and efficiency. The base-YOLOv5 model demonstrated consistent performance, with total times of 7.8 ms and 7.4 ms depending on the post-processing duration. Similarly, base-YOLOv8 and NVW-YOLOv8 delivered comparable results at 8.3 ms and 8.4 ms, respectively. The GDN model recorded a higher total time of 12.0 ms. On the other hand, models based on the YOLOv7 architecture, such as base-YOLOv7 and DSW-YOLO, exhibited the highest latencies at 23.3 ms and 20.8 ms, respectively. This was attributed to their larger and heavier model structures, which inherently require more computation. Overall, lightweight and attention-augmented nano models like TCAttn-YOLOv8 and CO-YOLO offer a clear advantage in runtime efficiency.
3.5. Energy Consumption
In terms of energy consumption, the evaluated models exhibited noticeable variation, largely influenced by their total inference durations and computational complexity. For energy estimation, the average power consumption of the NVIDIA GeForce RTX 3060 was assumed to be approximately 150 W, based on typical usage under computational workloads [60].
Base-YOLOv5 and improved-YOLOv5 demonstrated a relatively low energy consumption of approximately 1.17 J and 1.11 J, respectively. In contrast, GDN, despite sharing a similar architectural foundation, consumed 1.80 J due to its higher computational demand. Among the YOLOv7-based models, base-YOLOv7 and DSW-YOLO exhibited the highest energy usage, reaching 3.50 J and 3.12 J, respectively, consistent with their elevated GFLOP values.
YOLOv8 variants, including base-YOLOv8 and NVW-YOLOv8, displayed moderate consumption levels at around 1.25 J, reflecting a balance between detection performance and energy efficiency. Notably, lightweight models such as TCAttn-YOLOv8, base-YOLO11, and CO-YOLO achieved the lowest energy consumption, ranging from 0.76 J to 0.89 J. These results highlight their suitability for autonomous mobile robots, where energy efficiency is critical for extended operational time.
4. Discussion
Performing agricultural tasks in challenging, real-world environments demands models with high detection and segmentation precision. Among the evaluated models, improved-YOLOv5 [49] consistently stood out by delivering strong performance in both bounding box and mask accuracy metrics. While some custom variants like GDN [48] and CO-YOLO [56] outperformed their baselines, other models, particularly lightweight or attention-based designs, struggled at stricter evaluation thresholds like mAP@50:95. Interestingly, in several instances, base models such as base-YOLOv8 [52] and base-YOLOv7 [50] outperformed their modified versions, indicating that architectural enhancements do not always guarantee better precision, especially in demanding agricultural scenarios.
Robustness is a critical factor in evaluating models for challenging open-field agricultural conditions. Among the models assessed, those based on YOLO11, especially CO-YOLO and base-YOLO11 [55], consistently maintained a strong performance across varying disturbance levels. Their resilience to high-level visual challenges highlights their superior suitability for real-world deployment. In contrast, models such as NVW-YOLOv8 [53] and TCAttn-YOLOv8 [54] experienced notable performance declines, revealing limitations in their ability to generalise effectively under diverse and variable environmental conditions.
The trade-off between a model’s computational complexity and its practical feasibility is a central challenge in agricultural robotics. As demonstrated, heavy models like base-YOLOv7 and DSW-YOLO [51] can increase the power drain and thermal stress on robotic platforms, whereas lightweight architectures offer a more direct path to sustainable and energy-efficient solutions—a key factor for battery-dependent mobile systems [54,56].
Real-time performance must be considered at the system level in agricultural robotics, where models operate alongside sensors and robotic hardware [16]. Even if a model runs in real-time, lower inference times are still advantageous, as the entire system functions at the speed of its slowest component. For example, robotic manipulators can react within 1 ms, and a typical camera used in agricultural tasks has a frame time of 33.3 ms, so perception must keep pace. Lightweight models like TCAttn-YOLOv8, with an inference time of nearly 5 ms, meet this requirement, whereas slower models such as base-YOLOv7 may fail to satisfy real-time constraints on standard agricultural hardware. Thus, balancing model speed with hardware capabilities is essential for successful deployment in real farming scenarios.
The results highlight the importance of aligning model selection with the specific requirements of agricultural tasks, as detection and segmentation serve different purposes. Baseline models like base-YOLOv5 [46] and base-YOLOv8 provide accurate bounding boxes and reliable masks, making them well-suited for precision tasks like yield estimation and automated harvesting. Conversely, models like CO-YOLO and NVW-YOLOv8, while demonstrating strong bounding box accuracy, exhibit weaker segmentation performance. This limitation reduces their effectiveness in tasks requiring detailed contour information, but they remain good candidates for rough estimation applications like counting.
In addition to identification accuracy, agricultural vision models must demonstrate resilience to real-world disturbances [15], all while maintaining computational efficiency and low energy consumption. Balancing these factors is essential for seamless integration with fast robotic hardware and sensor systems, ensuring real-time responsiveness, operational stability, and compatibility with embedded platforms. This balance ultimately enables the development of adaptable, energy-efficient, and commercially viable systems for large-scale deployment in diverse agricultural fields.
4.1. A Practical Guide for Model Selection in Agricultural Robotics
The findings of this benchmark demonstrate that there is no single “best” model; instead, the optimal choice is a trade-off, contingent on the specific application’s priorities and the deployment hardware’s constraints. This section provides a practical guide for engineers and researchers to navigate these trade-offs based on common agricultural robotics scenarios.
For applications where maximum precision is the primary objective, such as in yield estimation, where accurately counting and sizing every fruit is critical, our findings indicate that models prioritising high accuracy are the superior choice. For instance, improved-YOLOv5 consistently delivered the highest performance across both detection (bounding box) and segmentation (mask) metrics, making it the benchmark for accuracy-driven tasks.
When robustness in unpredictable field conditions is paramount, models demonstrating high resilience are highly recommended. In our benchmark, the YOLOv11-based models (specifically CO-YOLO and base-YOLOv11) proved the most reliable, maintaining stability across varying disturbance levels and proving their suitability for deployment in environments with inconsistent lighting, shadows, and other visual noise.
For deployment on resource-constrained mobile robots, efficiency becomes the deciding factor, making lightweight architectures the optimal candidates. The low computational complexity (GFLOPs), fast inference times, and low energy consumption of models like TCAttn-YOLOv8 and the YOLOv11-based models, as detailed in Table 8, exemplify this category. These metrics directly translate to a longer battery life, enabling extended operational missions in the field. Furthermore, lower computational loads mitigate the risk of overheating—a critical safety and reliability concern for electronic components operating under continuous load in warm agricultural environments.
Table 8.
Practical deployment evaluation of the models.
Ultimately, this benchmark serves as a framework for practitioners to make informed, evidence-based decisions, balancing the trade-offs between a model’s accuracy and its practical viability for a specific agricultural task.
4.2. Limitations and Future Research Directions
A primary limitation of this study was its reliance on a single, custom-annotated dataset for the primary benchmarking analysis. This approach was necessitated by a significant challenge within the agricultural robotics domain: the scarcity of publicly available orange datasets that comprehensively encompass the full spectrum of real-world sensing challenges. While some datasets address specific issues like variable illumination or object classification, very few integrate multiple complexities such as dense occlusion, background clutter, and scale variation simultaneously in unstructured, in-field environments.
Crucially, the lack of datasets with high-quality amodal instance segmentation annotations, which are essential for properly evaluating model performance against sensing challenges including occlusion, remains a major bottleneck. Furthermore, even when datasets contain images with these challenges, they must be annotated effectively and correctly. The annotation process itself is a challenging, tedious, and repetitive task. For this reason, future dataset creation efforts present a significant opportunity to deepen research by placing these challenges at the core of the annotation strategy. For instance, creating challenge-specific labels or metadata, such as categorising images or instances based on illumination severity, degree of colour variability, or levels of background disturbance, would allow for a much more granular analysis of model strengths and weaknesses.
The performance and generalisability of deep learning models are fundamentally dependent on the quality and diversity of the data upon which they are trained and evaluated. While the community often focuses on advancing novel model architectures, our findings highlight that the development and curation of rich, meticulously and intelligently annotated datasets is an equally critical, yet often overlooked, area of contribution.
Therefore, we identify the creation of comprehensive, challenge-aware public benchmark datasets for agricultural perception as a vital research direction. Such resources would not only enable more robust and generalizable model evaluations, but also significantly accelerate progress in deploying autonomous systems in real-world agricultural environments.
5. Conclusions
This study presents an evaluation of ten YOLO-based models on an agricultural dataset characterised by visual disturbances, as shown in Figure 4. Beyond identification accuracy, the proposed analysis addresses critical deployment considerations for agricultural robotics including robustness, computational efficiency, and hardware compatibility. The results highlight the potential of lightweight, compact models that combine high accuracy, resilience to visual disturbances, and adaptability to specific agricultural tasks. These models demonstrate strong overall efficiency for real-time use by maintaining a balanced trade-off between accuracy, robustness, and computational cost, which are key performance factors for reliable operation in diverse farming environments. By introducing a structured evaluation framework and offering practical deployment insights, this work lays a strong foundation for the development of robust vision systems tailored to the demands of precision agriculture. Future work should address two key areas. First, there is a critical need for high-quality public datasets that comprehensively reflect the full spectrum of challenges in agricultural environments. Second, future benchmarks must evolve beyond fundamental perception tasks such as detection, segmentation, and localisation. To truly guide model selection, models should be evaluated and compared directly on their performance in downstream agricultural tasks such as harvesting, yield estimation, spraying, and planting. This also includes exploring more advanced detection and segmentation strategies and alternative sensing mechanisms for particularly challenging scenarios. Such holistic efforts will be essential for accelerating the commercial adoption of agricultural robotics through evidence-based, context-aware perception design and practical guidance for real-world deployment.
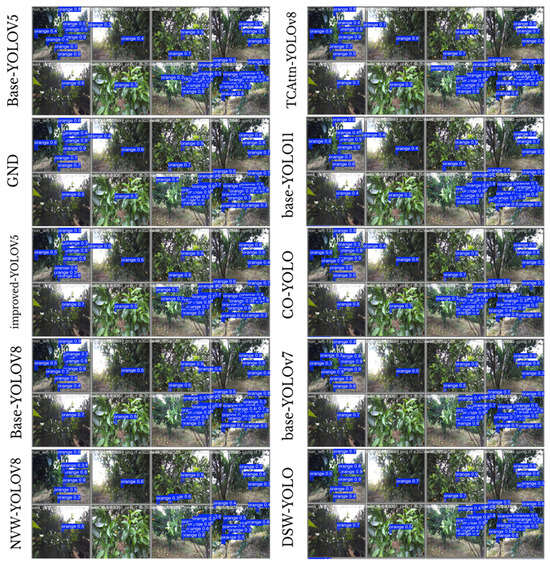
Figure 4.
Visual demonstration of the ten benchmarked models on the validation dataset.
Author Contributions
C.B.: Conceptualisation, Methodology, Software, Validation, Formal analysis, Investigation, Data curation, Writing—original draft, Visualisation. E.S.: Writing—review and editing, Supervision, Conceptualisation, Project administration. G.A.: Writing—review and editing, Supervision, Funding acquisition. All authors have read and agreed to the published version of the manuscript.
Funding
This research received no external funding.
Institutional Review Board Statement
This study involved only observational data and did not involve any handling of animals; therefore, ethical approval was not required.
Data Availability Statement
The dataset analysed during the current study was sourced from a publicly available repository, as cited [57].
Acknowledgments
The authors acknowledge that ChatGPT-3 (https://chat.openai.com/) was utilised to assist in editing the manuscript during its final preparation stage.
Conflicts of Interest
The authors declare no conflict of interest.
References
- United Nations. World Population Prospects 2019: Highlights—Ten Key Findings. Available online: https://population.un.org/wpp/Publications/Files/WPP2019_10KeyFindings.pdf (accessed on 19 April 2025).
- Ishangulyyev, R.; Kim, S.; Lee, S.H. Understanding Food Loss and Waste—Why Are We Losing and Wasting Food? Foods 2019, 8, 297. [Google Scholar] [CrossRef] [PubMed]
- Economou, F.; Chatziparaskeva, G.; Papamichael, I.; Loizia, P.; Voukkali, I.; Navarro-Pedreño, J.; Klontza, E.; Lekkas, D.F.; Naddeo, V.; A Zorpas, A. The Concept of Food Waste and Food Loss Prevention and Measuring Tools. Waste Manag. Res. 2024, 42, 651–669. [Google Scholar] [CrossRef]
- WWF-UK. Driven to Waste: The Global Impact of Food Loss and Waste on Farms. Available online: https://wwfint.awsassets.panda.org/downloads/wwf_uk__driven_to_waste___the_global_impact_of_food_loss_and_waste_on_farms.pdf (accessed on 19 April 2025).
- Silwal, A.; Davidson, J.R.; Karkee, M.; Mo, C.; Zhang, Q.; Lewis, K. Design, Integration, and Field Evaluation of a Robotic Apple Harvester. J. Field Robot. 2017, 34, 1140–1159. [Google Scholar]
- Homayouni, T.; Maharlooei, M.; Toudeshki, A.; Ferguson, L.; Ehsani, R. Simultaneous Trunk and Canopy Shaking Improves Table Olive Harvester Efficiency Versus Trunk Shaking Alone. Horticulturae 2023, 9, 640. [Google Scholar]
- Fountas, S.; Malounas, I.; Athanasakos, L.; Avgoustakis, I.; Espejo-Garcia, B. AI-Assisted Vision for Agricultural Robots. AgriEngineering 2022, 4, 674–694. [Google Scholar] [CrossRef]
- Ren, G.; Wu, T.; Lin, T.; Yang, L.; Chowdhary, G.; Ting, K.C.; Ying, Y. Mobile Robotics Platform for Strawberry Sensing and Harvesting within Precision Indoor Farming Systems. J. Field Robot. 2024, 41, 2047–2065. [Google Scholar] [CrossRef]
- Li, M.; Liu, P. A Bionic Adaptive End-Effector with Rope-Driven Fingers for Pear Fruit Harvesting. Comput. Electron. Agric. 2023, 211, 107952. [Google Scholar] [CrossRef]
- Yang, Q.; Du, X.; Wang, Z.; Meng, Z.; Ma, Z.; Zhang, Q. A Review of Core Agricultural Robot Technologies for Crop Productions. Comput. Electron. Agric. 2023, 206, 107701. [Google Scholar] [CrossRef]
- Li, T.; Xie, F.; Zhao, Z.; Zhao, H.; Guo, X.; Feng, Q. A Multi-Arm Robot System for Efficient Apple Harvesting: Perception, Task Plan and Control. Comput. Electron. Agric. 2023, 211, 107979. [Google Scholar] [CrossRef]
- Yu, X.; Fan, Z.; Wang, X.; Wan, H.; Wang, P.; Zeng, X.; Jia, F. A Lab-Customized Autonomous Humanoid Apple Harvesting Robot. Comput. Electr. Eng. 2021, 96, 107459. [Google Scholar] [CrossRef]
- Magalhães, S.A.; Moreira, A.P.; dos Santos, F.N.; Dias, J. Active Perception Fruit Harvesting Robots—A Systematic Review. J. Intell. Robot. Syst. 2022, 105, 14. [Google Scholar] [CrossRef]
- Zhou, H.; Wang, X.; Au, W.; Kang, H.; Chen, C. Intelligent Robots for Fruit Harvesting: Recent Developments and Future Challenges. Precis. Agric. 2022, 23, 1856–1907. [Google Scholar] [CrossRef]
- Beldek, C.; Cunningham, J.; Aydin, M.; Sariyildiz, E.; Phung, S.L.; Alici, G. Sensing-Based Robustness Challenges in Agricultural Robotic Harvesting. In Proceedings of the 2025 IEEE International Conference on Mechatronics (ICM), Wollongong, Australia, 25–27 February 2025; pp. 1–6. [Google Scholar]
- Sakai, H.; Shiigi, T.; Kondo, N.; Ogawa, Y.; Taguchi, N. Accurate Position Detecting during Asparagus Spear Harvesting Using a Laser Sensor. Eng. Agric. Environ. Food 2013, 6, 105–110. [Google Scholar] [CrossRef]
- Liu, M.; Jia, W.; Wang, Z.; Niu, Y.; Yang, X.; Ruan, C. An Accurate Detection and Segmentation Model of Obscured Green Fruits. Comput. Electron. Agric. 2022, 197, 106984. [Google Scholar] [CrossRef]
- Kim, S.; Hong, S.-J.; Ryu, J.; Kim, E.; Lee, C.-H.; Kim, G. Application of Amodal Segmentation on Cucumber Segmentation and Occlusion Recovery. Comput. Electron. Agric. 2023, 210, 107847. [Google Scholar] [CrossRef]
- Rathore, D.; Divyanth, L.G.; Reddy, K.L.S.; Chawla, Y.; Buragohain, M.; Soni, P.; Machavaram, R.; Hussain, S.Z.; Ray, H.; Ghosh, A. A Two-Stage Deep-Learning Model for Detection and Occlusion-Based Classification of Kashmiri Orchard Apples for Robotic Harvesting. J. Biosyst. Eng. 2023, 48, 242–256. [Google Scholar] [CrossRef]
- Íñiguez, R.; Palacios, F.; Barrio, I.; Hernández, I.; Gutiérrez, S.; Tardaguila, J. Impact of Leaf Occlusions on Yield Assessment by Computer Vision in Commercial Vineyards. Agronomy 2021, 11, 1003. [Google Scholar] [CrossRef]
- WineAmerica. Wine as Agriculture—WineAmerica. Available online: https://wineamerica.org/wine-as-agriculture (accessed on 12 June 2025).
- Lin, G.; Tang, Y.; Zou, X.; Li, J.; Xiong, J. In-Field Citrus Detection and Localisation Based on RGB-D Image Analysis. Biosyst. Eng. 2019, 186, 34–44. [Google Scholar] [CrossRef]
- Fujinaga, T.; Yasukawa, S.; Ishii, K. Evaluation of Tomato Fruit Harvestability for Robotic Harvesting. In Proceedings of the 2021 IEEE/SICE International Symposium on System Integration (SII), Iwaki, Fukushima, Japan, 11–14 January 2021; pp. 35–39. [Google Scholar]
- Li, X.; Pan, J.; Xie, F.; Zeng, J.; Li, Q.; Huang, X.; Liu, D.; Wang, X. Fast and Accurate Green Pepper Detection in Complex Backgrounds via an Improved YOLOv4-Tiny Model. Comput. Electron. Agric. 2021, 191, 106503. [Google Scholar] [CrossRef]
- Zu, L.; Zhao, Y.; Liu, J.; Su, F.; Zhang, Y.; Liu, P. Detection and Segmentation of Mature Green Tomatoes Based on Mask R-CNN with Automatic Image Acquisition Approach. Sensors 2021, 21, 7842. [Google Scholar] [CrossRef] [PubMed]
- Chen, W.; Lu, S.; Liu, B.; Chen, M.; Li, G.; Qian, T. CitrusYOLO: An Algorithm for Citrus Detection under Orchard Environment Based on YOLOv4. Multimed. Tools Appl. 2022, 81, 31363–31389. [Google Scholar] [CrossRef]
- Yang, J.; Deng, H.; Zhang, Y.; Zhou, Y.; Miao, T. Application of Amodal Segmentation for Shape Reconstruction and Occlusion Recovery in Occluded Tomatoes. Front. Plant Sci. 2024, 15, 1391963. [Google Scholar] [CrossRef]
- Chu, P.; Li, Z.; Zhang, K.; Chen, D.; Lammers, K.; Lu, R. O2RNet: Occluder-Occludee Relational Network for Robust Apple Detection in Clustered Orchard Environments. Smart Agric. Technol. 2023, 5, 100284. [Google Scholar] [CrossRef]
- Wang, Y.; Xiao, S.; Meng, X. Incoherent Region-Aware Occlusion Instance Synthesis for Grape Amodal Detection. Sensors 2025, 25, 1546. [Google Scholar] [CrossRef]
- Li, Y.; Liao, J.; Wang, J.; Luo, Y.; Lan, Y. Prototype Network for Predicting Occluded Picking Position Based on Lychee Phenotypic Features. Agronomy 2023, 13, 2435. [Google Scholar] [CrossRef]
- Yuan, Y.; Liu, H.; Yang, Z.; Zheng, J.; Li, J.; Zhao, L. A Detection Method for Occluded and Overlapped Apples under Close-Range Targets. Pattern Anal. Appl. 2024, 27, 12. [Google Scholar] [CrossRef]
- Kok, E.; Chen, C. Occluded Apples Orientation Estimator Based on Deep Learning Model for Robotic Harvesting. Comput. Electron. Agric. 2024, 219, 108781. [Google Scholar] [CrossRef]
- Gong, L.; Wang, W.; Wang, T.; Liu, C. Robotic Harvesting of the Occluded Fruits with a Precise Shape and Position Reconstruction Approach. J. Field Robot. 2021, 39, 69–84. [Google Scholar] [CrossRef]
- Chen, C.; Li, B.; Liu, J.; Bao, T.; Ren, N. Monocular Positioning of Sweet Peppers: An Instance Segmentation Approach for Harvest Robots. Biosyst. Eng. 2020, 196, 15–28. [Google Scholar] [CrossRef]
- Gené-Mola, J.; Ferrer-Ferrer, M.; Gregorio, E.; Blok, P.M.; Hemming, J.; Morros, J.-R.; Rosell-Polo, J.R.; Vilaplana, V.; Ruiz-Hidalgo, J. Looking behind Occlusions: A Study on Amodal Segmentation for Robust On-Tree Apple Fruit Size Estimation. Comput. Electron. Agric. 2023, 209, 107854. [Google Scholar] [CrossRef]
- Liang, J.; Huang, K.; Lei, H.; Zhong, Z.; Cai, Y.; Jiao, Z. Occlusion-Aware Fruit Segmentation in Complex Natural Environments under Shape Prior. Comput. Electron. Agric. 2024, 217, 108620. [Google Scholar] [CrossRef]
- Tu, S.; Deng, L.; Huang, Z.; Tang, Q.; Peng, L. Passion Fruit Detection and Counting Based on Multiple Scale Faster R-CNN Using RGB-D Images. Precis. Agric. 2020, 21, 1072–1091. [Google Scholar] [CrossRef]
- Chen, J.; Fu, H.; Lin, C.; Liu, X.; Wang, L.; Lin, Y. YOLOPears: A novel benchmark of YOLO object detectors for multi-class pear surface defect detection in quality grading systems. Front. Plant Sci. 2025, 16, 1483824. [Google Scholar] [CrossRef]
- Mirhaji, H.; Soleymani, M.; Asakereh, A.; Abdanan Mehdizadeh, S. Fruit detection and load estimation of an orange orchard using the YOLO models through simple approaches in different imaging and illumination conditions. Comput. Electron. Agric. 2021, 191, 106533. [Google Scholar] [CrossRef]
- Kamat, P.; Gite, S.; Chandekar, H.; Dlima, L.; Pradhan, B. Multi-class fruit ripeness detection using YOLO and SSD object detection models. Discov. Appl. Sci. 2025, 7, 931. [Google Scholar] [CrossRef]
- Page, M.; Tetzlaff, J.; Moher, D. The PRISMA 2020 Statement: An Updated Guideline for Reporting Systematic Reviews. Value Health 2021, 23, S312–S313. [Google Scholar]
- Redmon, J.; Divvala, S.; Girshick, R.; Farhadi, A. You Only Look Once: Unified, Real-Time Object Detection. arXiv 2015, arXiv:1506.02640. [Google Scholar]
- Badgujar, C.M.; Poulose, A.; Gan, H. Agricultural Object Detection with You Only Look Once (YOLO) Algorithm: A Bibliometric and Systematic Literature Review. Comput. Electron. Agric. 2024, 223, 109090. [Google Scholar] [CrossRef]
- Deng, L.; Luo, S.; He, C.; Xiao, H.; Wu, H. Underwater Small and Occlusion Object Detection with Feature Fusion and Global Context Decoupling Head-Based YOLO. Multimed. Syst. 2024, 30, 4. [Google Scholar] [CrossRef]
- Soviany, P.; Ionescu, R.T. Frustratingly Easy Trade-Off Optimization between Single-Stage and Two-Stage Deep Object Detectors. In Computer Vision—ECCV 2018 Workshops; Springer: Cham, Switzerland, 2018; pp. 366–378. [Google Scholar]
- Jocher, G. Ultralytics/Yolov5. Available online: https://github.com/ultralytics/yolov5 (accessed on 12 September 2025).
- Miao, Z.; Yu, X.; Li, N.; Zhang, Z.; He, C.; Li, Z.; Deng, C.; Sun, T. Efficient Tomato Harvesting Robot Based on Image Processing and Deep Learning. Precis. Agric. 2023, 24, 254–287. [Google Scholar] [CrossRef]
- Wang, W.; Shi, Y.; Liu, W.; Che, Z. An Unstructured Orchard Grape Detection Method Utilizing YOLOv5s. Agriculture 2024, 14, 262. [Google Scholar] [CrossRef]
- Zhao, J.; Bao, W.; Mo, L.; Li, Z.; Liu, Y.; Du, J. Design of Tomato Picking Robot Detection and Localization System Based on Deep Learning Neural Networks Algorithm of YOLOv5. Sci. Rep. 2025, 15, 6180. [Google Scholar] [CrossRef] [PubMed]
- Wang, C.Y.; Bochkovskiy, A.; Liao, H.Y.M. YOLOv7: Trainable Bag-of-Freebies Sets New State-of-the-Art for Real-Time Object Detectors. arXiv 2022, arXiv:2207.02696. [Google Scholar]
- Du, X.; Meng, Z.; Sapkota, R.; Ma, Z.; Cheng, H. DSW-YOLO: A Detection Method for Ground-Planted Strawberry Fruits under Different Occlusion Levels. Comput. Electron. Agric. 2023, 214, 108304. [Google Scholar] [CrossRef]
- Jocher, G.; Chaurasia, A.; Qiu, J. YOLOv8 by Ultralytics. 2023. Available online: https://github.com/ultralytics/ultralytics (accessed on 12 September 2025).
- Wang, A.; Qian, W.; Li, A.; Xu, Y.; Hu, J.; Xie, Y.; Zhang, L. NVW-YOLOv8s: An Improved YOLOv8s Network for Real-Time Detection and Segmentation of Tomato Fruits at Different Ripeness Stages. Comput. Electron. Agric. 2024, 219, 108833. [Google Scholar] [CrossRef]
- Tian, Z.; Hao, H.; Dai, G.; Li, Y. Optimizing Tomato Detection and Counting in Smart Greenhouses: A Lightweight YOLOv8 Model Incorporating High- and Low-Frequency Feature Transformer Structures. Netw. Comput. Neural Syst. 2024, 1–37. [Google Scholar] [CrossRef]
- Jocher, G.; Qiu, J. Ultralytics YOLO11. 2024. Available online: https://github.com/ultralytics/ultralytics (accessed on 12 September 2025).
- Jin, S.; Zhou, L.; Zhou, H. CO-YOLO: A Lightweight and Efficient Model for Camellia oleifera Fruit Object Detection and Posture Determination. Comput. Electron. Agric. 2025, 235, 110394. [Google Scholar] [CrossRef]
- Hou, C.; Zhang, X.; Tang, Y.; Zhuang, J.; Tan, Z.; Huang, H.; Chen, W.; Wei, S.; He, Y.; Luo, S. Detection and Localization of Citrus Fruit Based on Improved You Only Look Once v5s and Binocular Vision in the Orchard. Front. Plant Sci. 2022, 13, 937553. [Google Scholar] [CrossRef]
- Wong, K.Y. Yolov7/seg at u7. 2022. Available online: https://github.com/WongKinYiu/yolov7/tree/u7/seg (accessed on 12 June 2025).
- Meng, Z.; Du, X.; Sapkota, R.; Ma, Z.; Cheng, H. YOLOv10-Pose and YOLOv9-Pose: Real-Time Strawberry Stalk Pose Detection Models. Comput. Ind. 2025, 165, 104231. [Google Scholar] [CrossRef]
- TechPowerUp. NVIDIA GeForce RTX 3060 12 GB Specs. Available online: https://www.techpowerup.com/gpu-specs/geforce-rtx-3060-12-gb.c3682 (accessed on 12 June 2025).
Disclaimer/Publisher’s Note: The statements, opinions and data contained in all publications are solely those of the individual author(s) and contributor(s) and not of MDPI and/or the editor(s). MDPI and/or the editor(s) disclaim responsibility for any injury to people or property resulting from any ideas, methods, instructions or products referred to in the content. |
© 2025 by the authors. Licensee MDPI, Basel, Switzerland. This article is an open access article distributed under the terms and conditions of the Creative Commons Attribution (CC BY) license (https://creativecommons.org/licenses/by/4.0/).