Abstract
Collecting crop growth data in field environments is crucial for breeding research. The team’s current autonomous soybean phenotyping system requires manual control to start and stop data collection. To address the aforementioned issues, this study innovatively proposes an elliptical calibration rotating geofencing technique. Preprocess coordinates using Z-scores and mean fitting perform global error calibration via weighted least squares, calculate the inclination angle between the row direction and the relative standard direction by fitting a straight line to the same row of data, and establish a rotation model based on geometric feature alignment. Results show that the system achieves an average response time of 0.115 s for geofence entry, with perfect accuracy and Recall rates of 1, meeting the requirements for starting and stopping geographic fencing in soybean ridge trial plots. This technology provides the critical theoretical foundation for enabling a dynamic, on-demand automatic start–stop functionality in smart data collection devices for soybean field trial zones within precision agriculture.
1. Introduction
The intelligentization of agricultural machinery is an important part of the development of smart agriculture; autonomous driving assistance for agricultural operations using smart agricultural equipment is attracting increasing attention. Currently, Global Navigation Satellite Systems [1] (GNSSs), machine vision, Radio Frequency Identification [2] (RFID), and Ultra-Wide-Band [3] (UWB) sensor methods can enable smart equipment to start and stop within a specified range. Under field trial conditions, there are many varieties in the trial plots, requiring a large number of fences. Machine vision [4] can only establish a small number of virtual fence modules within the shooting range, and RFID [5] requires the installation of identification cards during actual use, which increases the workload later on. The identification cards need to be removed during subsequent cultivation, and environmental factors may cause the cards to be lost, which has a significant impact on the experiment. GNSSs [6] can establish multiple small-range fenced spaces at once, reducing the amount of testing work required without the need for physical calibration. In terms of accuracy, the accuracy can reach a centimeter level after combining it with network RTK [7,8], which meets the accuracy requirements of the test. Therefore, a GNSS combined with RTK can compensate for the shortcomings of these methods.
In recent years, scholars such as Barapatre [9], Nurkahfi [10], and Marini [11] have utilized GNSS positioning technology to establish virtual spatial scope applications in various fields. Marini et al. established virtual fences using the CSIRO algorithm, using collars to detect proximity to fence edges and emit warning sounds to enable spatial grazing management in non-traditional fencing situations. Algorithm innovation has improved, but positioning accuracy is greatly affected by the environment, which may lead to false positives or false negatives. This method is suitable for establishing a wide range of fencing that does not require high precision. Shevchenko [3] et al. proposed a method for establishing geofencing based on the Samply software (Software developed by the iScience research team) they developed, entering GPS coordinates and defining the radius of the fence on the website to generate a circular geofence directly on the map. This method simplifies the steps for defining geofences while reducing the risk of configuration errors, but the positioning error accuracy is relatively low. Cui [12] established a maritime electronic fence based on AIS data. The improved DBSCAN clustering algorithm is used to segment and clean the AIS data, and electronic fences are established using the minimum bounding rectangle method. This method achieves efficient automated clustering of data to generate fences, but DBSCAN has limited effectiveness in cleaning AIS signal drift and high-frequency noise, which may result in incorrect fence boundaries. The time complexity of combining DBSCAN clustering with MBR calculations is high, resulting in significant errors in real-time alerts. KUENZ A [13] receives raw GNSS data via mobile units, and boundary coordinates are obtained in real time via the GNSS to generate geographic fence boundaries. The use of deception algorithms ensures GNSSs’ reliability and enables dynamic and low-latency geofencing, but the method lacks adaptability and robustness. Therefore, we propose a method that combines a GNSS with network RTK to establish multiple small-scale geofences simultaneously while maintaining relatively high accuracy.
Coordinate calibration is an important step in improving test accuracy. Through coordinate calibration, the overall deviation caused by factors such as the Earth’s rotation on the accuracy of the geofence can be reduced. In recent years, scholars such as SELAMI Y [14], AUSTIN P C [15], and GHAFFARI A [16] have improved the accuracy of models by introducing calibration variables in different disciplines. Du [17] et al. proposed a new method based on a long short-term memory (LSTM) error correction recurrent neural network to reduce errors caused by multiple sources. Based on weighted least squares (WLSs) and Kalman filtering, the proposed LSTM-based algorithms’, WLS-LSTM and Kalman-LSTM, error correction methods are used to predict the positioning error for the next period, and the prediction results are used to correct the error for the next period. This method demonstrates a certain degree of innovation in positioning error predictions, but multi-source errors may be coupled in a nonlinear manner. LSTM only learns from historical sequences and is unable to completely decouple these errors, resulting in significant residual errors even after correction. FERRER-CID P [18] et al. established a multiple linear regression model using the least squares method, estimating compensation coefficients using temperature and humidity as covariates and updating calibration coefficients online through iterative recursive least squares to adapt to sensor drift. The algorithm improves the timeliness and accuracy of calibration coefficients, but the model’s generalization ability is limited. XU B [19] et al. solved the problem of the rapid estimation of DVL’s initial calibration parameters using the least squares method, providing reliable initial values for subsequent nonlinear filtering and enabling autonomous calibration without external references. The algorithm improves the calibration efficiency and calibration time, but it has high requirements for data quality. Noise or outliers can have a significant impact on the accuracy of subsequent calibrations. LIU C [20] et al. established a variable error (EIV) model and proposed a weighted total least squares (WTLSs) algorithm by utilizing the structure of the data received on the subarray. By dividing the ULA with M array elements into (formula presented) subarrays, the gain phase error of each subarray can be extracted individually, achieving efficient error estimation without an external source. The algorithm improves the efficiency and flexibility of error estimation, but its high computational complexity affects its real-time performance. LI Z [21] applied the Denavit–Hartenberg parameter model to calibrate the geometric errors of a robot and optimized the estimation of the compensation error using the least squares method. The algorithm improves the reliability of the model while increasing calibration accuracy by compensating for errors, but noise and other factors can cause significant parameter estimation deviations, resulting in numerous limitations. The methods studied by the above scholars mainly involve predicting calibration positioning errors or performing real-time corrections during movement, but there has been little research on the overall calibration of geofences using known positioning points. Therefore, we propose a method that can linearly calibrate global errors using a calibration point to achieve the overall calibration of global geofences.
The geographic fence rotation model is the most critical part of the entire experiment. Through this model, geographic fences can be effectively established and rotated to better align with the row direction. In recent years, scholars such as CHEN Z [22] and ZHAO H [23] have achieved matrix model rotation in different disciplines through methods such as quaternions and matrix rotation. Shen et al. [24] proposed a new neural network architecture that uses quaternion features to implement rotational transformations. Applying a specific rotational transformation to the input point cloud is equivalent to applying the same rotational transformation to all intermediate layer quaternion features. The algorithm improves the accuracy and stability of the rotation, but the quaternion method is less compatible with geographic coordinate systems and requires conversion, losing its advantage in terms of computational efficiency. Kim et al. [25] calculated the rotation formula in two-dimensional space by applying two-dimensional matrix-vector multiplication through rotation angles. By specifying the original vector, perpendicular vector, and rotation angle, they completed the conversion from the rotation angle to the rotation matrix. In terms of computation, the algorithm is more efficient as it does not have iteration convergence issues, while also improving stability in the calculation process. Grujić et al. [26] proposed a novel algorithm for the precise Givens rotation in QR matrix decomposition, which uses constant multipliers to execute multiple angle rotations in parallel. By constructing a rotation matrix, it achieves vector rotation in two-dimensional space, improving computational efficiency and accuracy. HUANG H et al. [27] proposed a coordinate transformation method using a homogeneous transformation matrix, which incorporates a rotation matrix and a translation vector. This establishes a conversion relationship between local and global coordinate systems, enabling the calculation of spatial trajectories for arbitrary points on petals during their unfolding process. The above methods primarily use rotation matrices to establish rotational models by rotating points or vectors. Rotation matrices offer high stability and fast computation speeds. However, the standard rotation matrix method requires users or external inputs to specify the rotation angle. To address this, we propose a least-squares fitting-based geometric feature alignment rotation method using rotation matrices, which improves automation while maintaining flexibility and accuracy.
According to existing research, methods such as rotation matrices and quaternion rotations have demonstrated strong performance in various scenarios. However, most of these approaches exhibit limitations that do not match our research objectives, as they predominantly rely on fixed rotation angles or externally specified parameters, lacking automated fitting and rotation capabilities for geometrically structured scenarios like farmland row directions.
This paper proposes a multi-fence system based on GNSS+network RTK high-precision positioning. By integrating a small number of reference points for global linear calibration and employing a geometric feature alignment rotation method based on least-squares fitting to achieve fence rotation, the system ultimately generates a model that meets the start–stop operation requirements for plot sampling vehicles. This solution can replace manual start–stop operations in the field.
2. Materials and Methods
2.1. Positioning Coordinate Acquisition Test
This study used soybeans as the research subject and was conducted at the Jiusan Farm in Heihe City, Heilongjiang Province, China (48°51′41.11″ N, 125°18′24.04″ E), for data acquisition during the experiment. Soybeans were planted in a single-row ridge cultivation pattern as shown in Figure 1. The ridge parameters are as follows: furrow bottom width is 70 cm, ridge-top width is 30 cm, ridge height is 25 cm, inter-ridge dihedral angle is 77.32°, and ridge-top inclination angle is 51.34°.
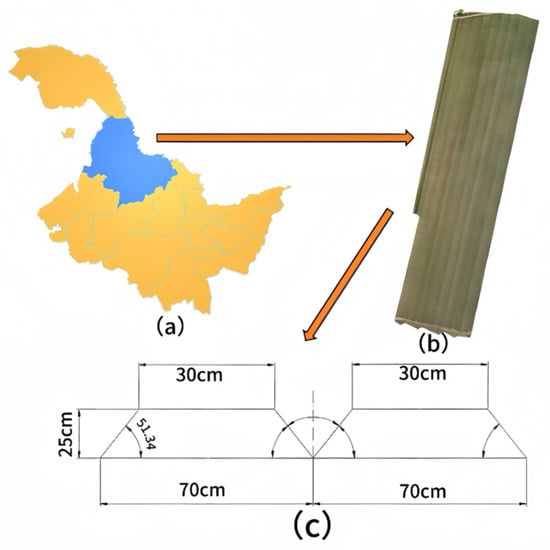
Figure 1.
Trial site and planting pattern: (a) geolocation map; (b) plot map; and (c) ridge as a schematic diagram.
To conduct coordinate acquisition for soybeans within the plot variety boundaries, geodetic data collection is performed using the CHC CGI-430 GNSS/INS integrated system, achieving centimeter-level accuracy. We install the equipment at the centerline position of the self-developed, third-generation self-propelled field crop phenotyping information collection system. Within the soybean planting area, coordinate data is collected at 1 m intervals. We then collect positioning coordinate data for thirty varieties, with three coordinate data points collected at each point. During data collection, we ensure the receiver status remains in steady-state (indicated by a steady yellow light) and that at least 45 satellites are acquired. At the same time, the trajectory of the collection process is exported for use in subsequent experimental verification. Figure 2 shows the placement of the integrated navigation system, with the red circle indicating the positioning terminal antenna.
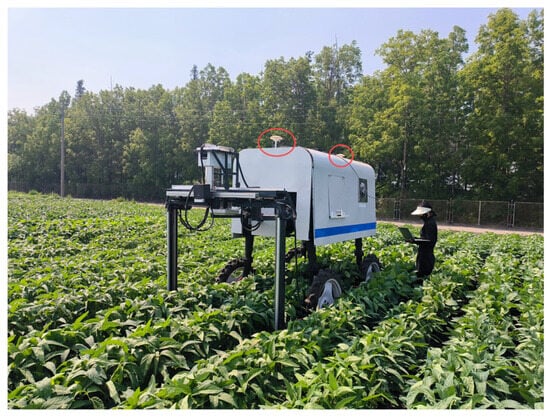
Figure 2.
The placement of the integrated navigation system.
2.2. Coordinate Positioning Calibration and Geofencing Model Establishment Algorithm
This study uses Pycharm for algorithm development, from coordinate positioning calibration to the implementation of automatic start/stop of the simulated data collection vehicle’s trajectory. The algorithm can be divided into six parts.
- (1)
- Collect coordinates for soybean test plots in the field environment.
- (2)
- Preprocess the coordinate data acquired by the equipment through format conversion to obtain decimal degree coordinate data. The Z-score algorithm is applied to eliminate outliers, followed by mean fitting of repeated measurements at the same point to derive the preprocessed coordinate dataset.
- (3)
- Store the coordinate data in the dataset.
- (4)
- Apply WLS with global error calibration to compensate for systematic coordinate errors.
- (5)
- Establish a geofence for the calibrated coordinate data.
- (6)
- Rotate the fence to create a rotational model. The flowchart is shown in Figure 3.
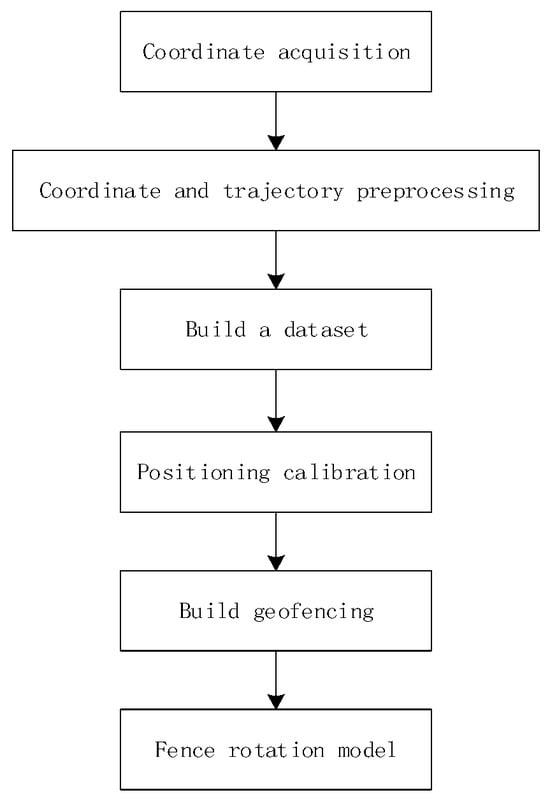 Figure 3. Geofencing model building flowchart.
2.3. Data Preprocessing
2.3.1. Research on Coordinate Outlier Elimination and Fitting
During the positioning data processing process, the purpose of removing outliers from coordinate data and fitting is to improve data accuracy and reduce errors. To simplify subsequent computations and enhance data storage and transmission efficiency, the acquired positioning coordinate data undergoes format conversion using Equation (1):
In Equation (1), D denotes the degree value in DMS format, M represents the minute value in DMS coordinates, and S denotes the second component in DMS coordinate notation. The coordinate data is converted into a decimal number format for subsequent mathematical calculations and statistical analysis. Remove duplicate values and outliers from the converted result coordinates. The statistical Z-score [28] method detects outliers by measuring how many standard deviations a data point deviates from the mean, and outlier detection enhances robustness against anomalous data, as formalized in Equation (2):
In Equation (2), let X denote a positioning coordinate data point, represent the mean of the coordinate dataset, and indicate the standard deviation of the coordinate dataset. The Z-score value obtained from the equation represents the distance between the data point and the mean, with the resulting Z-value expressed in standard deviation units.
This study sets a threshold of |Z| > 2.5 for outlier exclusion. This selection represents the optimal balance for small sample data (n = 90) and high-precision GNSS (centimeter-level) characteristics. Within small sample sets, outliers exert a more pronounced influence on mean and standard deviation estimates. The |Z| > 2.5 threshold enables more sensitive detection, effectively capturing statistically significant anomalies. This criterion ensures precise filtering of statistically and physically anomalous points while preserving the integrity of core data.
For each group of remaining data points, the average values of latitude and longitude are calculated separately to fully utilize the effective information from all points and facilitate subsequent computations. This step aims to further reduce random errors in the data by averaging, thereby obtaining more representative coordinate points to enhance accuracy and reliability. The preprocessed data results are obtained through the aforementioned steps.
2.3.2. Research on Trajectory Preprocessing Methods
During data collection in the test area, a GNSS positioning device installed in the collection vehicle records the entire route traveled by the vehicle. Store the raw data containing timestamp, latitude/longitude coordinates, and elevation values, and load the ridge trajectory visualization image via GIS software (Version 10.8.2) as shown in Figure 4a.
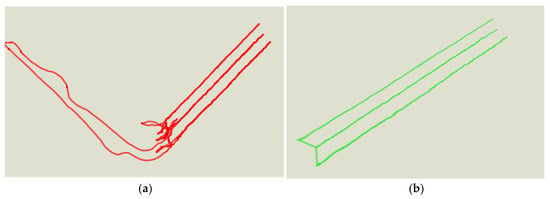
Figure 4.
Visualization image of the ridge trajectory: (a) uncensored trajectory visualization and (b) visualization image of the trajectory after deletion processing.
Since the device records the complete trajectory, but some segments are non-ridge trajectory data from experimental plots, invalid trajectory segments are identified and removed. Import the experimental plot e-fences into GIS software and eliminate extra-fence trajectory points using spatial query functions. Mark point clusters with displacement < 2 m within a sliding time window (60 s) as parking states, and remove the identified parking-state trajectory data. Perform topological optimization on the cleaned trajectory to identify gaps caused by signal loss. Then apply B-spline interpolation for completion. Apply the Douglas–Peucker [29] algorithm with a 5 cm threshold to compress trajectory points, generating the ridge trajectory visualization shown in Figure 4b. The processed data retains the microscopic motion characteristics of agricultural machinery during precision operations while eliminating non-research-related noise, providing high-purity foundational data for subsequent operational quality analysis.
2.4. Positioning Coordinate Calibration
Using Python (version 3.7) and MySQL (version 5.7), the preprocessed positioning data is stored and organized into a relational dataset. The MySQL database table structure is designed with fields including id (soybean cultivar name in experimental plots), longitude, and latitude. The processed data is then batch inserted into the MySQL database [30].
The R-tree index algorithm is implemented to enable efficient longitude/latitude filtering in the established dataset. By parameterizing ellipses, each ellipse is converted into multiple discrete points, with each point stored as an object in the R-tree’s leaf nodes. The R-tree processes the coordinates of each point as spatial query ranges, thereby achieving cultivar-specific sampling control through input of cultivar names.
Positioning coordinates collected during the early sowing phase are subject to deviations caused by factors such as temporal drift and Earth’s rotation, significantly impacting the accuracy of experimental plot geofences. When systematic coordinate bias occurs, equipment carrying positioning terminals may fail to accurately trigger geofence events when crossing boundaries. Moreover, such bias causes misalignment between the actual and predefined geofence boundaries, compromising experimental accuracy and reliability. To prevent such occurrences, study calibrating positioning coordinates by mapping temporal reference point deviations to the entire geofence system, thereby providing reliable foundational support for subsequent analysis and decision-making.
To further enhance the precision and robustness of positioning data, we propose a weighted least squares method with global error calibration (WLS-GEC), which improves model accuracy and stability through the incorporation of a global error calibration mechanism. This method builds upon the traditional WLS [31] method by further considering the impact of the global error, significantly improving the overall accuracy and feasibility of the study.
To prevent random deviations in single positioning data while ensuring that the fixed point remains in the same position, take the average of three positioning data points as a reference point for error offset comparison. When the front and rear coordinates are (x1, y1) and (x2, y2), respectively, the offset formula is
The error (x, y) is calculated as the offset between the two coordinates. Combine measurement uncertainty, variance estimates, and temporal correlation into a composite weighting factor at a ratio of 6:3:1. The least squares method is used to calibrate the error of all data points based on the calculated deviation. The coordinates after error calibration are as follows:
To obtain the global error calibration values (Δx, Δy), it is necessary to minimize a target function, which represents the total error of all points. The target function is expressed as
In Equation (5), , represents the calibrated positioning coordinates, , represents the positioning coordinates before calibration, and represents the global error calibration value. The results of evaluating the optimal error calibration amount through error calibration values are as follows:
Obtain the globally optimal error calibration values (Δx, Δy) and map the calibration amount to all coordinate data in the dataset to obtain the calibrated dataset.
To provide a more intuitive understanding of how process superposition affects coordinate calibration, a conceptual diagram is used for illustration, as shown in Figure 5.
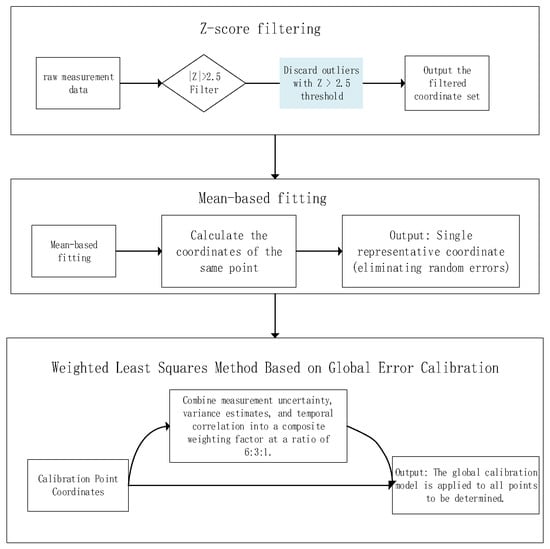
Figure 5.
Calibration concept diagram.
2.5. Geofencing Model Construction
We investigate the shape of the geographical fence established on the ridges of soybean experimental plots, to ensure that the trajectory does not miss the fence range when passing through the variety community and explore the establishment of the virtual fence space shape. This experiment mainly studies three shapes: circular, elliptical, and rectangular. The preprocessed coordinates are used as the center point to establish geofences of different shapes using Pycharm programming.
- (1)
- Circular geofence
After determining the center point of the geofence, a circular area is formed on the map based on the center point and radius using a variant of the Haversine [32] formula. Since the Earth is spherical, it is not possible to use the circle equation in plane geometry for calculations. Therefore, spherical geometry equations must be used to calculate points on the sphere.
In Equation (7), (lat, lon) represents points on the circumference of the geofence, (lat0, lon0) represents the center point of the geofence, R represents the radius of the circular geofence, and represents the azimuth angle. When calculating, the effect of the Earth’s curvature on the fence must be taken into account. Convert the latitude and longitude to radians and introduce the Earth’s radius (approximately 6371 km) parameter. Calculate the points on the circumference using Formula 7. The visualized image is shown in Figure 6a.
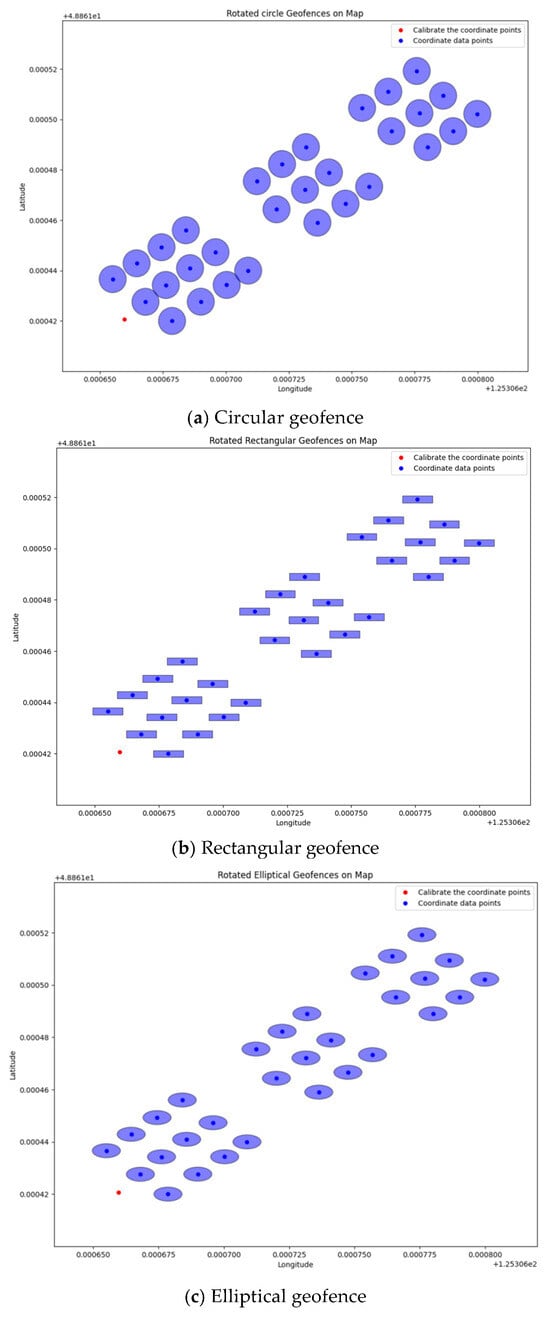
Figure 6.
Visualization image of different shapes of geofences.
- (2)
- Rectangular geofence
Using the coordinate points obtained from preprocessing as the center, define a rectangular area by specifying the maximum and minimum values of latitude and the maximum and minimum values of longitude as the four boundary values for the given length and width dimensions.
In Equation (8), height is the length of the long axis of the given rectangle boundary, and width is the length of the short axis of the given rectangle boundary. The minimum latitude min_lat, maximum latitude max_lat, minimum longitude min_lon, and maximum longitude max_lon are calculated using Formula 8. A rectangular geographic fence spatial range is drawn, and the visualized image is shown in Figure 6b.
- (3)
- Elliptical Geofence
Establish an elliptical geofence using the preprocessed coordinates as the center point of the ellipse. The standard equation for the ellipse is as follows:
In Equation (9), (x0, y0) are the center coordinates of the ellipse, the preprocessed coordinate data. a is the radius of the ellipse in the horizontal direction, the semi-major axis of the ellipse, and b is the radius of the ellipse in the vertical direction, the semi-minor axis of the ellipse. Obtain the coordinates of the point on the ellipse (x, y) through the formula and draw a visual graph of the spatial range of the elliptical geofencing, as shown in Figure 6c.
Figure 5 shows visual images of geographical fences for three different types of test plots. During the trial, to ensure that vehicles do not miss stops or stop at the wrong stops after the fence is established, it is necessary to reduce the amount of data stored in the subsequent dataset to improve the running speed of the algorithm. Measure the ridge length and width data for individual cultivar plots in the experimental field, then apply buffer margins as the major and minor axes for geofence establishment. In the three types of geofence shape comparison procedures, when establishing a circular geofence for a single variety in a field trial plot, the circle will cover adjacent plots or unplanted areas, affecting data accuracy. Rectangular geofences require more data storage than elliptical geofences, so we ultimately choose to establish elliptical geofences.
Using the coordinate point as the center of the ellipse, establish an elliptical geofence with a major axis of 0.7 and a minor axis of 0.3 based on the row width and planting density.
When planting soybeans, the choice of ridge direction varies depending on the climate, soil conditions, and farm layout of different regions. Since the row direction is non-standard, to prevent false stops and missed stops, the major axis of the geofence ellipse must remain perpendicular to the row direction. We propose defining the major axis orientation through rotation angles. The rotation angle of the fence is the angle formed by the straight line fitted to the ridge row positioning coordinates relative to the standard direction straight line, which ensures that the direction of the ellipse is consistent with the actual geographical shape.
Fit each row of 10 positioning coordinates and calculate the slope and intercept using the coordinate data of the ten points, using the following formula:
In Equation (10), k is the slope, b is the intercept, n is the number of points, and (xi, yi) are the coordinates of this set of points. The slope k and intercept b of the straight line equation are calculated using the above formula. Using the straight line equation formula , three straight line equations are further obtained by fitting all points on the same row:
Calculate the average angle difference between the straight line equation and the standard direction as the rotation angle to obtain the overall rotation angle of the elliptical geographic fence. Take the angles between the three fitted straight lines and the straight line in the north direction, calculate the average of the three angles as the rotation angle, and use a two-dimensional rotation matrix to calculate the new position of the fence points. The rotation matrix rotates the elliptical geofence as a whole by combining the coordinates of each point of the fence with the rotation angle. The rotation matrix formula is as follows:
In Equation (11), is the rotation angle of the geofence. By rotating the original coordinate system by this angle , a new coordinate system is obtained that is aligned with the ridge line.
2.6. Research on Geofencing Trajectory Detection
2.6.1. Trajectory Visualization
Use the gpxpy library to deconstruct the XML tree of the GPX file after shear processing, locate key nodes through XPath to extract latitude and longitude attributes, and generate an ordered sequence of track points. Calculate the instantaneous velocity based on adjacent points in the track to remove outliers and improve the quality of the track data. The formula is as follows.
In Equation (12), (xi, yi) and (xi+1, yi+1) are the coordinates of adjacent points, and ti and ti+1 are the corresponding timestamps. If vi > vmax, then the point is determined to be a noise point and is removed.
Read the stored location coordinate dataset from MYSQL as the center point coordinates of the elliptical geofence and convert it to array format. Since the half-axis lengths are defined in kilometers during the creation of geofences, it is necessary to standardize the coordinate units and convert the half-axis lengths of geofences into degrees, as shown in Formula 13, to ensure that all spatial calculations are performed under the same measurement system.
Dynamically update trajectory points to create a visually coherent motion trajectory. Set the trajectory point sequence to , where N is the total number of frames. The historical trajectory points displayed at frame k are a subset consisting of the first k points . Maintain two dynamic arrays, Xhistory and Yhistory, which store the latitudes and longitudes that have been drawn and append the current point to each frame, as shown in Formula 14.
Draw the trajectory curve using the linear interpolation function L{X,Y}. Update the trajectory data every frame. Use O(1) computational complexity to update only the pointer without re-rendering the entire curve, ensuring smooth animation. At the same time, a timing module is established to anchor the timing device to the image coordinate system through affine transformation Taxes, using dynamic changes in time as an indicator for recording and identifying trajectories entering the geofence.
2.6.2. Elliptic Inclusion Testing Algorithm
Use the ellipse containment test algorithm to determine whether the current trajectory point is inside the rotating model. Translate the test point P(x, y) to a coordinate system with the ellipse center C(xc, yc) as the origin to eliminate the influence of the ellipse center position on the detection. Rotate the coordinate system counterclockwise by degrees, with the rotation angle opposite to the direction of rotation of the ellipse, so that the major axis of the ellipse aligns with the coordinate axis. As shown in Formula 15, use the rotation matrix formula in Formula 11 to eliminate the tilt of the ellipse.
Use elliptical inclusion inequalities to detect whether the current trajectory point is inside the ellipse in the rotated coordinate system. In Equation (16), a is the semi-major axis length corresponding to the major axis of the ellipse, b is the semi-minor axis length corresponding to the minor axis of the ellipse, and (x, y) are the current real-time trajectory latitude and longitude coordinates. When the result of the formula is less than or equal to 1, it proves that the current trajectory point is inside the ellipse; when the result is greater than 1, it is outside the ellipse.
To improve operating speed, quickly screen for ellipses that may intersect with the target point, avoiding brute force traversal of all ellipses, and add an R-tree spatial index. For each rotating ellipse, calculate the boundaries of the minimum bounding rectangle (MBR). Determine the boundaries using the extreme values of the ellipse parameter equation in Formula 17, and further determine the coordinates of the bounding rectangle boundaries as shown in Formula 18.
Insert the MBR[min_x,min_y,max_x,max_y] of each ellipse into the R-tree. The R-tree will automatically organize itself into a hierarchical structure, with each node storing the aggregated MBR of its child nodes. This allows for efficient filtering of irrelevant ellipses with O(logN) space complexity. During queries, the target point (x, y) is treated as a zero-area rectangle [x, y, x, y], and the R-tree is recursively searched, quickly obtaining a list of candidate ellipses {Ei}. The candidate ellipses are then precisely evaluated to determine whether the real-time trajectory point is inside the fence.
3. Results and Discussion
3.1. Soybean Trial Plot Coordinate Collection
This study acquires ridge-top coordinate data in soybean experimental plots using an integrated navigation system. Figure 7 shows the visualized coordinate data including calibration points (displayed in red) and ridge-top coordinates (displayed in blue). The collected coordinate data achieves centimeter-level accuracy, meeting experimental requirements.
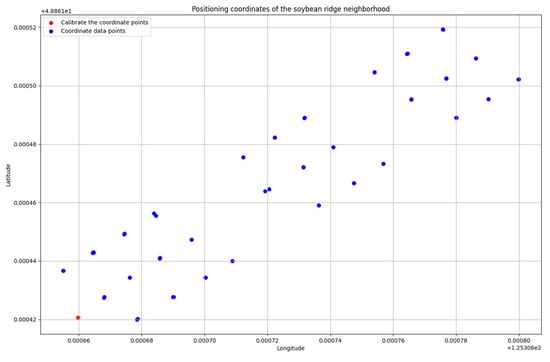
Figure 7.
Coordinate data visualization image.
3.2. Coordinate Data Preprocessing
We preprocessed the raw coordinate data by collecting three coordinate measurements per experimental point along the ridges, followed by outlier removal to enhance the trial accuracy, Figure 8a shows the visualized coordinate data obtained by stripping the offset data from the original data using the Z-score algorithm. Figure 8b shows the visualized coordinate data obtained by fitting the stripped data using the mean fitting method.
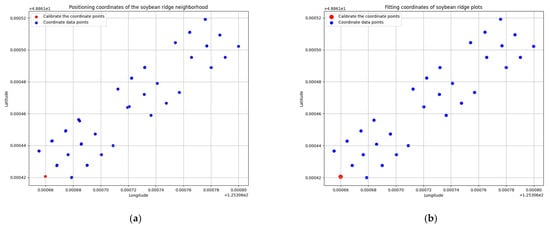
Figure 8.
Coordinate data preprocessing results: (a) outlier culling process visualization images and (b) mean fitting visualization image.
Due to natural factors such as the Earth’s rotation, satellite signal errors, and environmental interference, positioning coordinates may exhibit slight deviations even when stationary, which can affect the accuracy of subsequent trials. Therefore, further positioning calibration processing of the coordinates is required.
3.3. Coordinate Positioning Calibration and Geofencing Model Establishment Algorithm
3.3.1. Coordinate Positioning Calibration
To address the impact of positioning errors on test accuracy by processing coordinate global errors we use weighted least squares based on the global error calibration. Figure 9 visualizes the global coordinate calibration process using calibration points. The original calibration points are displayed in red, raw data points are in blue, and in orange are the calibration points (derived from the mean of three newly collected coordinates at identical geographic locations). A globally optimal error calibration vector is computed based on the displacement between the original and new calibration points, establishing a coordinate mapping relationship for the global adjustment. The resulting calibrated coordinates are shown in green.
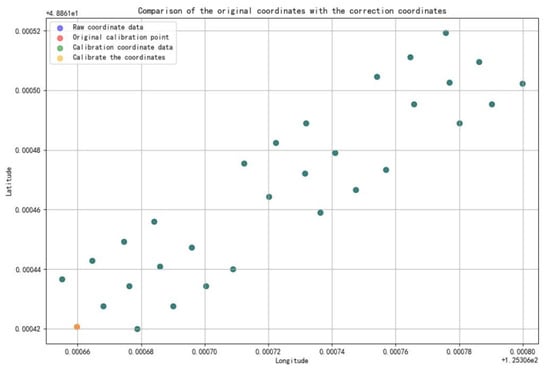
Figure 9.
Calibrated coordinates vs. visualization image.
Through observation, the error calibration amount calculated based on the calibration points does not show obvious results after the global coordinate calibration, but it can be seen that the distance between the points before and after calibration is very small or even overlaps, showing blue–green points. To more intuitively observe the calibration results, the calibration data was verified, and a displacement distribution histogram was plotted, as shown in Figure 10. To analyze the effectiveness of the calibration coordinates, a displacement heat map was plotted, as shown in Figure 10, and a coordinate calibration analysis report was generated.
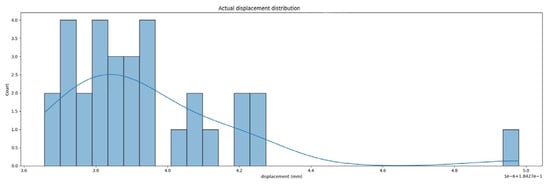
Figure 10.
Calibrating the displacement distribution histogram.
The histogram of the displacement distribution calibrated in Figure 10 is drawn through verification. The bar chart in the figure shows the number of occurrences of different displacement values, and the height of the bars indicates the number of occurrences of that displacement value. As can be seen from Figure 10, the displacement values are mainly concentrated between 3.8 and 4.0 mm, and the frequency of occurrence gradually decreases as the displacement values increase or decrease. The distribution of the actual displacement shows a roughly normal distribution trend, with an average value of 3.9 mm and most measurements concentrated around the average value. The smooth curve in the figure represents the distribution trend of the displacement values and is also a normal distribution curve fitted to the histogram data. The shape of the curve roughly matches the bar distribution of the histogram.
Figure 11 shows the displacement distribution within the 95th percentile range using a coordinate displacement heat map. The color intensity of the coordinate points in the figure represents the magnitude of the displacement, with darker colors indicating higher density and lighter colors indicating lower density. As can be seen from the figure, the distribution of the displacement does not show obvious clustering or dispersion, and there are no obvious outliers—no points with particularly dark or light colors. At the same time, the color changes in the displacement points are not very dramatic, indicating that the calibrated displacement values are relatively consistent across different locations. As shown in Table 1, the RMSE of 0.325 matches the standard deviation, further confirming the range of the error fluctuation. The small mean absolute deviation indicates that the average distance between each data point and the median is minimal, demonstrating excellent consistency. The error between the calibrated coordinates and the actual coordinates is very small, falling within the reasonable error range for latitude and longitude coordinates collected at the same location due to factors such as the geographical environment or Earth’s rotation, proving that the calibration effect is good.
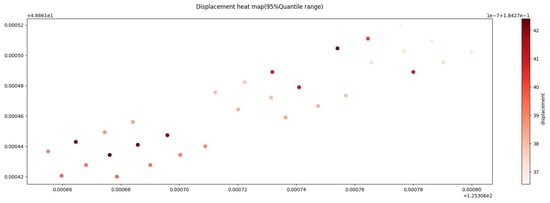
Figure 11.
Displacement heat map.

Table 1.
Coordinate calibration analysis report.
3.3.2. Geofencing Model
By selecting the shape of the geographic fence in the preliminary stage, a standard elliptical geographic fence is established. To investigate the rotation angle of the elliptical geofence, a straight line is fitted to all points on the same row. The visualized result of the fitted straight line is shown in Figure 12, with different points on the three rows represented by different colors. From the fitting results, it can be seen that the points on the same row are uniformly distributed near the fitted straight line.
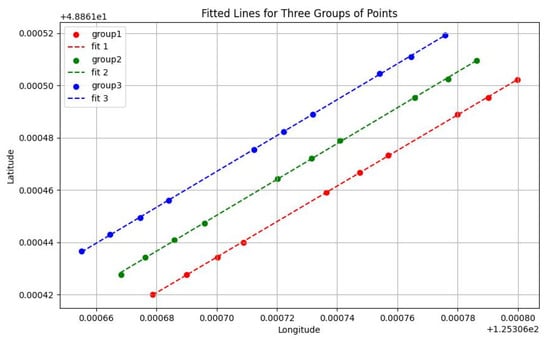
Figure 12.
Visualization of linear fitting coordinates on soybean ridges.
The fitted lines were validated as shown in Figure 13. The residual distribution histograms in Figure 13a demonstrate the error distributions of the three line groups. All three groups exhibit near-normal residual distributions with means closely approaching zero, indicating excellent model fitting performance characterized by small and uniformly distributed residuals.
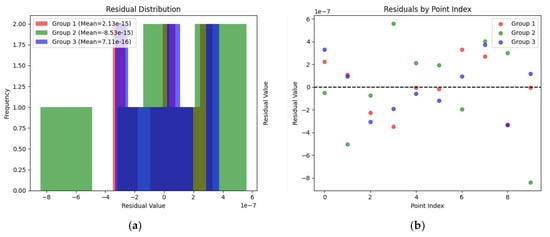
Figure 13.
Image for linear fitting validation of soybean row positioning coordinates: (a) residual distribution histogram and (b) residual scatter plot.
As evidenced by the linear fitting validation results in Table 2, the R2 values all approach 1, with both RMSE and maximum deviations at the 10−7 magnitude. The absolute residuals are all below 1 × 10⁻⁶ and show concentrated distributions. The three sets of slopes are very similar, all falling between 0.680 and 0.686, consistent with the slope pattern of soybean field ridges. The 95% CI of the slope and the 95% CI of the intercept confidence intervals for the three fitted lines are narrow, indicating precise parameter estimation, while the mean residuals asymptotically approach zero, conforming to normal distribution patterns without systematic bias. Group 2 may exhibit minor individual outliers, but their deviations are sufficiently small to not compromise the overall linear fitting quality. Validation results confirm excellent fitting performance.

Table 2.
Straight line fit analysis report.
As shown in Figure 14a, the average of all angular deviations between the fitted lines and the standard direction is calculated to determine the final rotation angle. The mean is 34.3576°, with a standard deviation of 0.1301°. The error range is ±0.2807°, and the 95% confidence interval is [34.0769°, 34.6383°]. The elliptical geofence is then rotated as a whole based on this angle, with the post-rotation visualization displayed in Figure 14b.
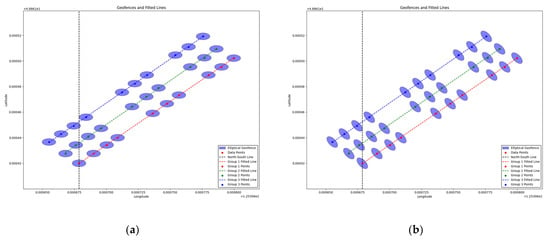
Figure 14.
Elliptical geofence model: (a) visualization of an elliptical geofence without rotation and (b) visualization of an elliptical geofence after rotation.
3.4. Experimental Results of Geofence Trajectory Validation in Test Plots
As shown in Figure 15, the visualized processed trajectory data on ridge-tops demonstrates effective simulation performance, with the path accurately following the ridge-top data collection points. The green points indicate trajectory starting positions.
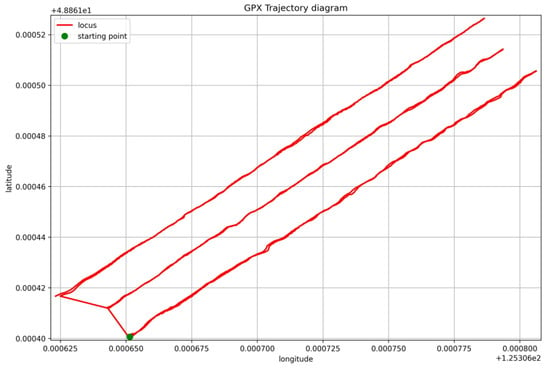
Figure 15.
Trajectory visualization image.
The trajectory data is simulated for movement, as shown in Figure 16. The system continuously monitors whether the trajectory enters the geofence boundaries over time. Upon the detection of the geofence entry, the current model response speed is calculated. A manual ‘continue’ button is implemented to resume movement when the trajectory stops within the geofence. Figure 16 displays a randomly sampled visualization of trajectory entries during the simulation. Post-simulation results output an average response time of 0.107401 s and a maximum response time of 0.115193 s. To quantify performance stability and consistency, we calculate a standard deviation of 0.0028 s for response times. Additionally, we provide a 95% confidence interval for the mean response time of [0.1067 s, 0.1081 s].
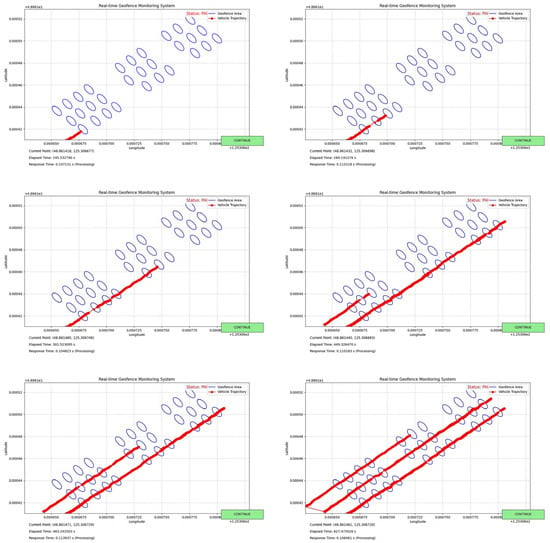
Figure 16.
Trajectory verification visualization image.
The performance verification analysis of the model for the fence detection of trajectories yielded the confusion matrix shown in Figure 17.
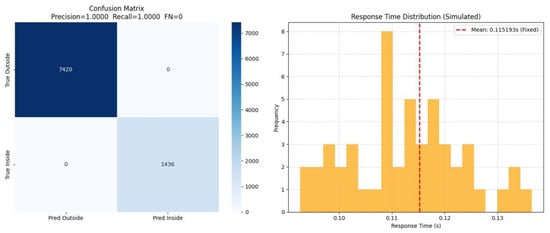
Figure 17.
Experimental verification effect verification.
The validation metrics calculated through indicator formulas are presented in Table 3, including the Precision, Recall, accuracy, and F1 score. The Precision formula contains no false positives (FP = 0), while the Recall formula contains no false negatives (FN = 0).

Table 3.
Test validation analysis report.
After the linear calibration and coordinate system rotation, the estimated endpoint of the vehicle trajectory lies within the geofence. However, considering various system errors (calibration error ±3.9 mm, angular uncertainty ±0.28°), we calculated a 95% confidence interval for the endpoint. This confidence interval is entirely contained within the geofence boundary. Therefore, we conclude with high confidence that the vehicle successfully parked within the designated area.
Finally, we established 90 variety plots in a new field at the Heihe Farm experimental site to validate the model’s accuracy. In the field environment, the soybean phenotyping system operated at three speeds—high (5 km/h), medium (3 km/h), and low (1 km/h)—while traversing the soybean field. At all speeds, the stop command was triggered promptly and accurately, with no significant boundary violations caused by system delays. Response times at all three speeds remained under 1 s. When recognizing a stop within the geofence, the distance between the vertical point of the receiving antenna (mounted directly above the vehicle’s data acquisition unit) and the geofence boundary ranged between 5 and 10 cm.
3.5. Discussion
This study addresses the insufficient automation of soybean phenotyping data collection in field environments by proposing an automated acquisition method that integrates geofence start–stop strategies with coordinate calibration and rotation calibration. This approach significantly enhances the automation level and positioning accuracy of the data collection. In validation experiments, the system achieved an average response time of 0.115 s, meeting real-time field control requirements. Both the accuracy and Recall reached 1.0, demonstrating high reliability in target recognition and start–stop decision-making.
However, despite the promising experimental results, this study presents several limitations and challenges warranting further exploration. First, the system exhibits high dependency on the GNSS positioning quality. Under extreme weather conditions or in areas with severe signal obstruction, positioning accuracy may decline, potentially compromising system stability. Future work could explore integrating multi-source information, such as inertial measurement units and visual sensors, to build a redundant positioning system, thereby enhancing robustness in complex environments. Second, the current fence model relies on static calibration. If field ridge configurations change due to mechanical operations like tillage or land preparation, the model requires recalibration, limiting its long-term applicability. Introducing online learning mechanisms or dynamic boundary detection algorithms could enable the system to adapt to changing field structures.
Additionally, this research holds potential for improvement in system scalability and agricultural scenario integration. On one hand, while the current method is designed for soybean phenotyping, its automated control logic based on coordinate calibration and error compensation could potentially be extended to phenotype monitoring for other crops like corn and wheat, demonstrating cross-crop applicability. On the other hand, the system has yet to integrate with other agricultural smart equipment, such as farm management systems, smart irrigation systems, and variable rate fertilizer application devices. Future research could explore integrating the system into agricultural IoT platforms to achieve closed-loop control from data collection to decision execution, thereby enabling a broader application within smart agriculture ecosystems.
4. Conclusions
This study proposes a stop method for soybean field trial plots based on geofencing. The approach integrates data preprocessing, coordinate calibration, elliptical geofence modeling, sub-centimeter navigation, and weighted least squares optimization to achieve high fitting accuracy (R2 ≈ 1), low errors (root mean square error ~10−7), and real-time responsiveness (~0.1 s).
This method provides a robust theoretical and technical foundation for autonomous start–stop control during data collection by self-driving vehicles in soybean fields, while also signifying the further exploration of intelligent collection vehicle technology. Future applications can extend to intelligent soybean cultivation systems, supporting full-machine operations and adaptive data collection through real-time geofence adjustments. Intelligent driving technology for agricultural machinery plays a crucial role in advancing smart agricultural equipment development and driving the transformation and upgrading of modern agriculture, providing a theoretical basis for applying intelligent driving systems throughout the mechanized soybean cultivation process.
Author Contributions
Conceptualization, J.L.; Data curation, J.L., B.Z. and C.C.; Formal analysis, J.L. and B.Z.; Funding acquisition, B.Z., B.C. and Y.M.; Investigation, J.L., B.Z. and H.C.; Methodology, J.L. and H.C.; Resources, B.Z., B.C. and Y.M.; Software, J.L.; Supervision, C.C., H.C., Y.M. and B.C.; Validation, J.L. and H.C.; Writing—original draft, J.L.; Writing—review and editing, B.Z. All authors have read and agreed to the published version of the manuscript.
Funding
This study was funded in part by the Key Research and Development Plan of Heilongjiang Province (2024ZXDXB45) and the Postdoctoral Research Launch Project of Heilongjiang Province (2032030267) and the Natural Science Foundation Project of Heilongjiang Province (LH2024E004).
Institutional Review Board Statement
This research does not require ethical approval.
Data Availability Statement
The data presented in this study are available on request from the corresponding author. The data are not publicly available due to ongoing research utilizing the same dataset for future publications.
Conflicts of Interest
The authors declare that they have no known competing financial interests or personal relationships that could have appeared to influence the work reported in this paper.
References
- Ou, G.; Chen, Y.; Han, Y.; Sun, Y.; Zheng, S.; Ma, R. Design and Experiment of an Internet of Things-Based Wireless System for Farmland Soil Information Monitoring. Agriculture 2025, 15, 467. [Google Scholar] [CrossRef]
- Siddiqui, M.M.; Valsalan, P.; Shajanah, H.A.; Baraami, M.S.A.; Baraami, H.S.A. IoT Based RFID Attendance System. In Proceedings of the 2024 International Conference on Signal Processing and Advance Research in Computing (SPARC), Lucknow, India, 12–13 September 2024. [Google Scholar]
- Shevchenko, Y.; Reips, U. Geofencing in location-based behavioral research: Methodology, challenges, and implementation. Behav. Res. Methods 2024, 56, 6411–6439. [Google Scholar] [CrossRef]
- Yu, X.; Ying, H.; Zheng, K.; Wang, B.; Ou, L. Low-latency industrial robot monitoring and debugging system combining virtual and real elements. High-Tech. Commun. 2022, 32, 1273–1282. [Google Scholar]
- Zhang, N. Research on the Application of Electronic Fences in Coal Mine Underground Based on UWB Positioning Technology. Chin. Inf. Ind. 2024, 3, 240–243. [Google Scholar]
- Deng, C.; Ma, H. A Sustainable Dynamic Capacity Estimation Method Based on Bike-Sharing E-Fences. Sustainability 2024, 16, 6210. [Google Scholar] [CrossRef]
- Ren, H.; Wu, J.; Lin, T.; Yao, Y.; Liu, C. Research on an Intelligent Agricultural Machinery Unmanned Driving System. Agriculture 2023, 13, 1907. [Google Scholar] [CrossRef]
- Huang, Y.; Fu, J.; Xu, S.; Han, T.; Liu, Y. Research on Integrated Navigation System of Agricultural Machinery Based on RTK-BDS/INS. Agriculture 2022, 12, 1169. [Google Scholar] [CrossRef]
- Barpatre, M.; Deshmukh, C. Design & Development of Network Geo-Fencing Model for User Monitoring and it’s Alertness in a Security Applications. Int. J. Res. Advent Technol. 2019, 7, 149–153. [Google Scholar] [CrossRef]
- Nurkahfi, G.N.; Armi, N.; Mardiana, V.A.; Dinata, M.M.M.; Mitayani, A.; Setiarini, A.; Prawara, B.; Kurniawan, D.; Firmansyah, R.; Sudirja, S. Development of a low-cost wearable device for COVID-19 self-quarantine monitoring system. Public Health Pract. 2022, 4, 100299. [Google Scholar] [CrossRef]
- Marini, D.; Llewellyn, R.; Belson, S.; Lee, C. Controlling Within-Field Sheep Movement Using Virtual Fencing. Animals 2018, 8, 31. [Google Scholar] [CrossRef]
- Cui, Z.; Zhang, Y.; Zhang, F.; Gao, S. Maritime Electronic Fence Location Based on AIS Data. J. Navig. Position. 2023, 11, 49–55. [Google Scholar] [CrossRef]
- Kuenz, A.; Lieb, J.; Rudolph, M.; Volkert, A.; Geister, D.; Ammann, N.; Zhukov, D.; Feurich, P.; Gonschorek, J.; Gessner, M.; et al. Live Trials of Dynamic Geo-Fencing for the Tactical Avoidance of Hazard Areas. IEEE Aerosp. Electron. Syst. Mag. 2023, 38, 60–71. [Google Scholar] [CrossRef]
- Selami, Y.; Tao, W.; Lv, N.; Zhao, H. Precise Robot Calibration Method-Based 3-D Positioning and Posture Sensor. IEEE Sens. J. 2023, 23, 7741–7749. [Google Scholar] [CrossRef]
- Austin, P.; Steyerberg, E. The Integrated Calibration Index (ICI) and related metrics for quantifying the calibration of logistic regression models. Stat. Med. 2019, 38, 4051–4065. [Google Scholar] [CrossRef]
- Ghaffari, A. Analytical Design and Experimental Verification of Geofencing Control for Aerial Applications. IEEE-ASME Trans. Mechatron. 2021, 26, 1106–1117. [Google Scholar] [CrossRef]
- Du, L.; Ji, J.; Pei, Z.; Chen, W. A Novel Error Correction Approach to Improve Standard Point Positioning of Integrated BDS/GPS. Sensors 2020, 20, 6162. [Google Scholar] [CrossRef]
- Ferrer-Cid, P.; Barcelo-Ordinas, J.; Garcia-Vidal, J.; Ripoll, M.; Viana, A. Multisensor Data Fusion Calibration in IoT Air Pollution Platforms. IEEE Internet Things J. 2020, 7, 3124–3132. [Google Scholar] [CrossRef]
- Xu, B.; Guo, Y. A Novel DVL Calibration Method Based on Robust Invariant Extended Kalman Filter. IEEE Trans. Veh. Technol. 2022, 71, 9422–9434. [Google Scholar] [CrossRef]
- Liu, C.; Tang, X.; Zhang, Z. A New Gain-Phase Error Pre-Calibration Method for Uniform Linear Arrays. Sensors 2023, 23, 2544. [Google Scholar] [CrossRef]
- Li, Z.; Li, S.; Luo, X. An overview of calibration technology of industrial robots. IEEE-CAA J. Autom. Sin. 2021, 8, 23–36. [Google Scholar] [CrossRef]
- Chen, Z.; Ren, H.; Fan, W.; Zhou, P. A new recursive geometrically exact formulation for three-dimensional Euler-Bernoulli beams with large deformations. Nonlinear Dyn. 2025, 113, 4671–4701. [Google Scholar] [CrossRef]
- Zhao, H.; Wu, X.; Xie, Y.; Du, Y.; Zhang, Z.; Li, Y. Rotation matrix-based finite-time attitude synchronization control for flexible spacecrafts with unknown inertial parameters and actuator faults. Isa Trans. 2022, 128, 276–289. [Google Scholar] [CrossRef] [PubMed]
- Shen, W.; Zhang, B.; Huang, S.; Wei, Z.; Zhang, Q. 3D-Rotation-Equivariant Quaternion Neural Networks. In European Conference on Computer Vision; Springer International Publishing: Cham, Switzerland, 2020. [Google Scholar]
- Kim, S.; Kim, M. Rotation Representations and Their Conversions. IEEE Access 2023, 11, 6682–6699. [Google Scholar] [CrossRef]
- Grujic, D.; Saranovac, L. Multi-angle Constant Multiplier Givens Rotation Algorithm. Circuits Syst. Signal Process. 2019, 38, 4229–4244. [Google Scholar] [CrossRef]
- Huang, H.; Cheng, Q.; Zheng, L.; Yang, Y. Development for petal-type deployable solid-surface reflector by uniaxial rotation mechanism. Acta Astronaut. 2021, 178, 511–521. [Google Scholar] [CrossRef]
- Wang, R.; Feng, J.; Zhang, W.; Liu, B.; Wang, T.; Zhang, C.; Xu, S.; Zhang, L.; Zuo, G.; Lv, Y.; et al. Detection and Correction of Abnormal IoT Data from Tea Plantations Based on Deep Learning. Agriculture 2023, 13, 480. [Google Scholar] [CrossRef]
- Tang, C.; Wang, H.; Zhao, J.; Tang, Y.; Yan, H.; Xiao, Y. A method for compressing AIS trajectory data based on the adaptive-threshold Douglas-Peucker algorithm. Ocean. Eng. 2021, 232, 109041. [Google Scholar] [CrossRef]
- MHM, K.; Zaini, N.; Mazalan, L.; Ahamad, A.H. Online attendance system based on facial recognition with face mask detection. Multimed. Tools Appl. 2023, 82, 34437–34457. [Google Scholar] [CrossRef]
- Liu, L.; Ou, Y.; Zhao, Z.; Shen, M.; Zhao, R.; Liu, L. The Development of a Sorting System Based on Point Cloud Weight Estimation for Fattening Pigs. Agriculture 2025, 15, 365. [Google Scholar] [CrossRef]
- Athakorn, K.; Chawantorn, C. Design of a machine learning using wind vortex circulation patterns and Haversine for predicting the rescue area of sea unrest situation: An empirical study of the Thai Seas. Comput. Ind. Eng. 2025, 206, 111218. [Google Scholar] [CrossRef]
Disclaimer/Publisher’s Note: The statements, opinions and data contained in all publications are solely those of the individual author(s) and contributor(s) and not of MDPI and/or the editor(s). MDPI and/or the editor(s) disclaim responsibility for any injury to people or property resulting from any ideas, methods, instructions or products referred to in the content. |
© 2025 by the authors. Licensee MDPI, Basel, Switzerland. This article is an open access article distributed under the terms and conditions of the Creative Commons Attribution (CC BY) license (https://creativecommons.org/licenses/by/4.0/).