Abstract
Properly designed crop rotation enriches the diversity of the agroecosystem, which has a favorable effect on the environmental properties and crop yield. The experiment assessed winter wheat cultivated under the following crop rotations: A. winter rape + catch crop − spring barley − field pea − winter wheat; B. winter rape − winter wheat + catch crop − field pea − winter wheat; C. winter rape + catch crop − field pea − winter wheat − winter wheat; D. winter rape − winter wheat + catch crop − spring barley − winter wheat. The aim of the study was to investigate: (i) whether the cultivation of wheat in crop rotations following forecrops of rape, pea, barley, and wheat will affect its foliage and photosynthesis; (ii) how the photosynthetic process will affect the wheat yield. At the stem elongation stage (BBCH 36) and at the heading stage (BBCH 58), the following were investigated: foliage features, photosynthetic parameters, and the above-ground biomass; while at the BBCH 89 stage, the grain yield was investigated. It was demonstrated that photosynthesis was most intense under crop rotation A (the highest stomatal conductance, transpiration, intercellular CO2 concentration, and net assimilation rate ranged from 13.1–29.7 μmol CO2∙m−2·s−1). This was reflected in the above-ground biomass volume (1245–1634 g m−2) and grain yield (4.58–7.65 t ha−1). The cultivation of wheat following wheat under crop rotation C and following barley under D had a negative effect on both the foliage and photosynthetic parameters.
Keywords:
forecrops; field pea; winter rape; spring barley; growth stage; foliage; gas exchange; yield 1. Introduction
Due to the nutritional qualities of wheat, coupled with the possibility of cultivating it under various climatic and soil conditions, it ranks first in the world in terms of the area under its cultivation, and second in terms of grain yield. The global grain harvest for this cereal in 2020 was 766 million tons, with 266 million tons harvested in Europe, and 10.8 million tons in Poland [1].
One of the crop production technique factors that affects the volume of produced plant biomass is crop rotation [2,3,4]. A properly designed crop rotation guarantees obtaining high and qualitatively good yields, as well as environmental equilibrium [5]. Meanwhile, the large proportion of grains in the sown crop structure (in Poland oscillating around 70%) makes it difficult to plan the proper crop rotation or select the best forecrop for cereals, particularly for winter wheat [6]. Wheat is a cereal with high crop rotation requirements [7]. When designing crop rotation, it is important to place the cereal after an appropriate (good) forecrop and to maintain a sufficiently long break in its return to the same field [8]. The best forecrops for wheat include legumes, sugar beet, potato, and rape [9]. Legumes (including pea) and rape have a beneficial effect on the physical, chemical, and biological properties of the soil [10]. They improve soil structure, enrich the soil with N and other nutrients, and reduce the growth of cereal pathogens in the soil, which has a positive effect on successive crops [11]. Following these forecrops, wheat exhibits better development, which translates into the volume of the yield obtained [8,12].
The forecrops that are unsuitable for wheat include cereals, particularly wheat. The cultivation of the same cereals in succession results in the accumulation of harmful metabolites in the soil [2], which disturbs the biological equilibrium in the soil [13], resulting in excessive weed infestation, the development of pathogens and pests, unilateral depletion of the soil of nutrients [2,14], and deterioration of the physical and chemical properties of the soil [15]. These unfavorable environmental changes lead to a reduction in plant density and deterioration of their morphological characteristics. This results in lower grain yield and deterioration in grain quality [16]. The literature on the effect of crop rotation on wheat morphological traits, yield, and environmental changes is extensive. However, it lacks information on how the location of wheat in crop rotation will affect its physiological characteristics, including the course of photosynthesis.
The fundamental process of plant metabolism is photosynthesis, which influences plant growth, the amount of biomass produced, and the yield achieved. The course of photosynthesis is significantly influenced by the environmental factors, crop production techniques applied, the crop species, and the stage of crop growth [3,17,18,19,20,21]. Crops are exposed to many environmental stresses, such as drought, inadequate temperature, nutrient deficiency, soil contamination, and the accumulation of harmful secondary plant metabolites in the soil due to growing the same crop species in succession [2,19,22,23]. The course of photosynthesis is also affected by endogenous factors, i.e., those related to the anatomy and morphology of plants (particularly the leaves), their structure, and physiological and biochemical characteristics [24,25,26].
Research into gas exchange taking place in the leaves is of great importance due to its significant role in crop yields. As demonstrated by Richards [27], more than 90% of the biomass produced comes from assimilation. The effect of leaf characteristics on photosynthesis has not yet been sufficiently understood, particularly in cereals [23]. The leaf characteristics that influence the absorption of chemical energy and its use in photosynthesis include the surface area, weight, nitrogen and chlorophyll levels, and temperature [25,28,29,30,31,32,33,34,35,36,37].
A cereal cultivated in a field following an unsuitable forecrop is under stress. Photosynthesis is among the physiological processes of plants that are most sensitive to environmental stress [18,20,38]. Under unfavorable conditions, the stomata are partly or completely closed, which protects the plant against water loss while reducing the absorption of carbon from the atmosphere [3,24]. Under conditions unfavorable to plants, a reduction in the nitrogen content and changes in the chloroplast morphology and structure in the leaves are noted, which reduces the chlorophyll content and leads to its degradation; and reduces the Rubisco activity, which results in decreased assimilation [18,26,31]. Nitrogen and chlorophyll control the supply of CO2 to the leaf interior [39]. The intercellular CO2 concentration and the mesophyll conductance then decrease, which decreases assimilation [34]. In their study, Wanic and Treder [3] found a decrease in stomatal activity, transpiration, intercellular CO2 concentration, and mesophyll conductance, and a simultaneous increase in photosynthetic water use efficiency when cultivating wheat after barley or wheat. Similarly, Orzech et al. [31] observed similar results when cultivating maize after maize. This translated into a decrease in the net assimilation rate and, ultimately, the yield volume. However, there are no comprehensive studies to show how changes in the environment (induced by crop rotation) affect the photosynthetic process.
Therefore, the current study is a novelty, and supplements and extends the knowledge on the subject.
To date, research into photosynthesis focused mainly on the plant generative development stage and its effect on yield. However, plant yield is affected by the photosynthetic process that also occurs at earlier stages (of vegetative plant development). It is, therefore, important to learn about changes in the photosynthetic process caused by the crop rotation factor (the selection and succession of plants) both in the vegetative (the stem elongation stage) and generative (the heading stage) development periods.
This current paper proposes the hypothesis that the selection and succession of plants under crop rotation will have an effect on the plant characteristics (in the current study, the foliage) and their physiology (gas exchange) through a change in environmental characteristics, which will translate into the volume of the yield obtained. The current study is one of the first to address this particular issue. It is essential to understand the role of crop rotation in shaping the physiological characteristics of plants. It was hypothesized that incorporating winter wheat into crop rotations following winter rape and field pea, with proportions of 25% and 50%, would enhance photosynthesis and yield. In contrast, incorporating winter wheat into crop rotations with a 75% cereal proportion following spring barley, or in a 50% proportion where winter wheat is grown successively, was expected to limit these processes.
The aim of the study was to investigate: (i) how the cultivation of winter wheat under crop rotations with 50% and 75% of cereals, following forecrops of winter rape, field pea, spring barley, and winter wheat, will affect its foliage and photosynthesis; (ii) whether the foliage characteristics and photosynthetic parameters, under the crop rotations under assessment, will change depending on the developmental stage; (iii) how the photosynthetic process will affect the wheat yield under crop rotations.
2. Materials and Methods
2.1. Site, Soil and Climate
The study was based on a field experiment conducted in north-eastern Poland at the research center of the University of Warmia and Mazury in Olsztyn, located in Bałcyny (53°35′47″ N, 19°51′20″ E) in the years 2011–2018. This paper presents the results obtained in the years 2016–2018, i.e., the 6th, 7th, and 8th years of the field experiment.
Soil experimental fields were classified as Luvisoil. The soil in the 0–30 cm layer contains 64.7% sand, 15.4% coarse silt, 16.5% fine silt, and 3.4% clay. The soil is characterized by a slightly acid relation (KCl pH 6.25), SOC content 8.1 g·kg−1, the total N content 0.83 g·kg−1, an average P (68.3 mg·kg−1) and K content (115.4 mg·kg−1), and a low Mg content (39.6 mg·kg−1).
During the winter wheat growth period (from October to July), the average air temperature was in the 2015/2016 period +6.3 °C; in the 2016/2017 period + 6.5 °C; and in the 2017/2018 period it was +7.7 °C (Figure 1). Precipitation during this period was: season of 2015/2016—470.0 mm; 2016/2017—663.7 mm; and 2017/2018—602.2 mm. The highest amount of precipitation was noted: in the season of 2015/2016 in July (17.3% of the total amount); in 2016/2017 in June and July (32.5% of the total amount); and in 2017/2018 in October and June (26.6 and 23.4%, respectively). The following factors were not conducive to wheat growth: in the 2015/2016 period—very high precipitation in July (the ripening stage); in the 2016/2017 period—a very low rainfall in May (during this period, the wheat was at the stem elongation stage), and a very high rainfall in July (the ripening stage); and in the 2017/2018 period—a very wet October (which prevented the sowing of wheat and delayed it significantly). In all years of the study, the air temperature was sufficient for the growth of wheat.
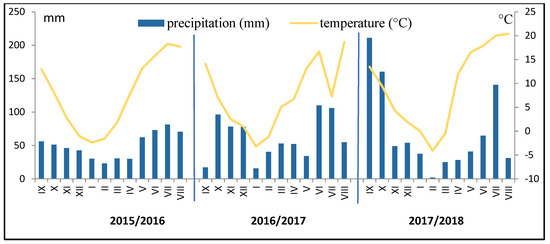
Figure 1.
Total monthly precipitation and average monthly temperature for the growing seasons of winter wheat.
During the period of measurements of plant characteristics and photosynthesis, the daily temperature and precipitation at the BBCH 36 stage were as follows, respectively: in 25 April 2016, they were low (6.9 °C and 9.1 mm); in 2nd May 2017, they were moderate (8.5 °C and 27.5 mm); and in 3rd May 2018 the temperature was relatively high (14.9 °C), while precipitation was very low (6.0 mm). At the BBCH 58 stage in 2nd June 2016, the daily precipitation was very low (12.1 mm), and the air temperature was moderate (14.1 °C); in 8th June 2017, moderate precipitation (22.8 mm) and a high temperature (17.1 °C) were noted; in 7th June 2018, low precipitation (9.0 mm) and a high air temperature (20.1 °C) were noted.
The average annual photosynthetically active radiation (PAR) in the area under study is 8079.2 mol photon m−2·s−1 (approximately 50% are per June, July, and August). The number of sunshine hours per year is 1746, including 1413 h in the period from April to September (average for years 1970–2020).
2.2. Experimental Design
The experiment was established as a single-factorial experiment in 4 replicates. The experimental design is provided in the Supplementary material (Table S1). The experiment assessed four crop rotations:
- A.
- winter rape + catch crop (blue tansy) − spring barley − field pea − winter wheat (50% cereals including 25% wheat);
- B.
- winter rape − winter wheat + catch crop (blue tansy) − field pea − winter wheat (50% wheat);
- C.
- winter rape + catch crop (blue tansy) − field pea − winter wheat − winter wheat (50% wheat);
- D.
- winter rape − winter wheat + catch crop (blue tansy) − spring barley − winter wheat (75% cereals including 50% wheat).
The research was carried out on the plots sown with wheat (Julius cultivar): in crop rotation A on the field with wheat cultivated following pea (AP-W); in crop rotation B on the fields with wheat cultivated following: rape (BR-W) and pea (BP-W); in crop rotation C on the fields with wheat following: pea (CP-W) and wheat (CW-W); and in crop rotation D on the fields with wheat cultivated following rape (DR-W) and barley (DB-W).
In each year, the experiment was carried out on all crop rotation fields simultaneously. It comprised 64 plots with an area of 16 m2 (Table S1).
In 2015 and 2016, winter wheat was sown in autumn at optimal agrotechnical dates (12th September and 19th September), while in 2017, due to unfavorable weather conditions (very heavy rainfalls), the sowing was performed later (20th October). The wheat was sown at a germinating kernel density of 450 plants∙m−2. Most NPK mineral fertilization doses were determined based on the soil abundance, estimated values of their uptake by the wheat and for N, and depending on the forecrop. For wheat, they amounted to N: 160 kg·ha−1—on the fields following rape, wheat, and barley, and 130 kg·ha−1—following pea. Doses of P (superphosphate) and K (potassium salt) for all the plots sown with wheat were identical (they were not differentiated according to forecrop). These were applied in the autumn, several days prior to wheat sowing, in the following amounts: K—91.3 kg·ha−1 and P—35.2 kg·ha−1. The entire nitrogen dose (ammonium nitrate NH4NO3 34%) was divided into four parts and applied: before sowing (20 kg·ha−1), at the tillering stage—BBCH 25–29 (80 kg·ha−1), at the stem elongation stage—BBCH 30–31 (40 kg·ha−1), and at the heading stage BBCH 56 (20 kg·ha−1). The grains were harvested at the full kernel ripeness stage (BBCH 89): in 2016, on 28th July; in 2017, on 3rd August; and in 2018, on 24th July.
2.3. Measurements
2.3.1. Foliage Characteristics
The measurements of the wheat leaf area were carried out at the BBCH 36 stage (stem elongation) and BBCH 58 stage (heading) using a leaf area meter (CI—202 Portable Laser Leaf Area Meter). The measurements were performed on all the leaves set on 4 stems from each plot. The leaves were counted on the same stems. The leaves were separated from the stems, dried to air-dry weight, and weighed. In the laboratory, the N concentration in the leaves was determined by the Kjeldahl method. The leaf area index (LAI) was calculated by dividing the assimilative surface area of all the leaves of 1 stem by the area it occupied. The leaf mass per area (LMA) was calculated by dividing the weight of the leaves by their area, and Narea by dividing the N content by the area of the leaves. At the same stages (BBCH 36 and 58), the chlorophyll content in the wheat leaves was determined using a SPAD 502 chlorophyll meter (Minolta). The measurements were conducted on the middle part of the three uppermost leaves on ten stems from each plot.
2.3.2. Leaf Gas Exchange
The measurements of gas exchange in the wheat leaves were conducted at stages BBCH 36 and BBCH 58. For the measurements, five stems were randomly selected from each plot. Four measurements were conducted on each stem on a fully developed, undamaged flag leaf. The tests were performed on cloudless days before noon (between 10:00 AM and 12:00 AM). Gas exchanges were measured using a compact photosynthesis system (ADC BioScientific LCi Analyzer Serial No, 32568, Hoddesdon, UK). The photosynthetic photon flux density (PPFD) was 1500 μmol photon m−2·s−1, the CO2 concentration in the atmosphere was from 351 µmol·mol−1 to 363 µmol·mol−1 (ca), the vapor pressure was 9.9–10.5 kPa, and the chamber temperature ranged from 20.6 to 23.8 °C.
The testing involved the determination of atmospheric CO2 concentration (ca), stomatal conductance (gs), intercellular CO2 concentration (ci), net assimilation rate (An), and transpiration rate (E). The device was also used to determine the leaf temperature (T). Based on the measurements, the following indices were calculated: stomatal limitation value (ls) as 1-ci/ca [40], instantaneous water use efficiency in the photosynthetic process (WUE) as A/E [41], and intrinsic water use efficiency in the photosynthetic process (WUE1) as A/gs [42].
2.3.3. Above-Ground Biomass Yield, Crop Growth Rate, and Grain Yield of Wheat
At the BBCH 36 and BBCH 58 stages, all plants were collected from 2 randomly selected sites from each plot (with an area of 0.5 m2). These were dried to air-dry weight and then weighed. This provided the basis for calculating the above-ground biomass from an area of 1 m2. At the BBCH 89 stage, the wheat grain yield from each plot was determined (at a 12% water content in the grains). The results were converted to an area of 1 ha. Based on the measurements of the above-ground biomass, the wheat growth rate between the BBCH 36 and BBCH 58 stages was calculated using the following formula [43]:
where:
CGR = (dWc/dt) × (1/P),
CGR—crop growth rate (g·m−2·day−1)
dWc—crop above-ground biomass increment (g)
dt—time period during which the above-ground biomass increment occurred
P—area (m2).
2.4. Statistical Analysis
In the statistical processing of the results, a one-way analysis of variance (ANOVA) was applied with p < 0.05. Homogeneous groups were then determined using Tukey’s test (HSD) at a significance level of α = 0.05. Based on Spearman’s rank correlation, the strength of the relationship between the net assimilation rate and leaf features, above-ground biomass, and grain yield was assessed. The analysis was conducted using the Statistica 13.3 program (Dell, Inc., Aliso Viejo, CA, USA).
3. Results and Discussion
3.1. Winter Wheat Foliage Characteristics
3.1.1. Stem Elongation Stage (BBCH 36)
At the BBCH 36 stage, the crop rotation sites had different impacts on the area of 1 leaf (LA) of wheat in the years of the study (Table 1). In 2016, leaves with a significantly smaller area (by 4.0–15.1%) were noted on the field under crop rotation C—at the site of wheat cultivation following wheat (CW-W), and under D—at the site of wheat cultivation following barley (DB-W), in relation to the other fields which did not differ significantly from one another. In 2017, the leaves with a significantly larger area (by 6.6–13.9%) were observed on the plants on the fields following pea under crop rotations A (AP-W) and C (CP-W); meanwhile, in 2018, also following pea under crop rotation A (AP-W) and on both crop rotation fields B: following rape (BR-W) and following pea (BP-W) (by 7.1–16.4%), in relation to the other crop rotations which exhibited no significant differences between one another. The leaf area index (LAI) reached the lowest value on the fields of wheat cultivation following wheat (CW-W) and following barley (DB-W), and additionally on the field following pea (CP-W) in 2016, in relation to the site following rape (DR-W) (Table 1). At the other crop rotation sites, LAI was significantly higher (in 2016 by 15.8–88.5%, in 2017 by 11.5–33.2%, and in 2018 by 13.2–33.9%). A deterioration in the morphological parameters of the maize leaves in the field where they was cultivated in succession at the BBCH 36 stage was also noted by Orzech et al. [31].

Table 1.
Selected features of the foliage at the BBCH 36 stage.
The highest leaf mass per area (LMA) values were reached for wheat cultivated following wheat (CW-W) and following barley (DB-W). In relation to other fields, it was significantly higher by 9.6–52.6% (Table 1). The highest relative chlorophyll content (SPAD) was noted in the leaves of wheat cultivated on the AP-W field (Table 1). In addition, in 2018, it was at a similar level (no significant differences) on both fields under crop rotation B (following rape, BR-W, and following pea, BP-W), under crop rotation C—following pea (CP-W), and under crop rotation D—following rape (DR-W). In the years 2016 and 2018, the lowest chlorophyll content was noted in the leaves of wheat cultivated on CW-W and DB-W fields. Its content was significantly lower than that on AP-W by 4.4–6.9%. In 2017, the chlorophyll content of the wheat leaves in crop rotations B, C, and D was significantly lower than that under crop rotation A by 5.3–9.3%. In 2016 and 2018, the most N per leaf area unit (Narea) was found in the plants of wheat cultivated on the AP-W and BR-W fields. In these years, significantly lower Narea was found in wheat cultivated following wheat (the CW-W field) and following barley (DB-W). This reduction, in relation to the AP-W and BR-W, amounted to: 12.5–20.8% in 2016, and 26.8–35.7% in 2018. The crop rotation sites remained with no significant impact on this index value in 2017. The leaves of wheat cultivated on the CW-W and DB-W fields were characterized by a significantly higher T than those on the other fields (Table 1) in all the years of the study (by 0.9–2.6 °C).
3.1.2. Heading Stage (BBCH 58)
At the BBCH 58 stage, the wheat leaf area was most favorably influenced by the sites on which wheat was cultivated following pea: in 2016, on the AP-W field; in 2017 on the BP-W and CP-W fields; and in 2018, on the AP-W and CP-W fields (Table 2). In addition, in 2018, the leaves with a significantly greater area were noted following rape cultivated under crop rotations B and D (BR-W and DR-W). At these sites, the wheat leaf area was larger as compared to the least favorable sites, which included fields: following wheat (CW-W) by 6.1–36.3%, and following barley (DB-W) by 7.1–28.7%. In 2016, the highest leaf area index (LAI) was noted for the fields following pea (AP-W) and following rape (DR-W); in 2017, for the fields following pea (BP-W, CP-W) and following rape (DR-W); and in 2018, for the fields following pea (AP-W, BP-W, CP-W) and following rape (BR-W, DR-W) (Table 2). The cultivation of wheat following cereal forecrops wheat (CW-W) and barley (DB-W) resulted in a significant (the largest) reduction in its value (with the exception of the site following barley in 2018). In relation to the sites with the highest LAI, this reduction was by 18.5–43.1%. In the years 2016 and 2017, the leaf mass per area (LMA) reached the significantly highest values on the field with wheat cultivated following wheat (CW-W) and following barley (DB-W) (Table 2). In 2018, no significant differences were demonstrated in the parameter under study between the fields BR-W, BP-W, CP-W, CW-W, and DB-W. During the entire 3-year period under assessment, the lowest LMA values were reached on the AP-W field and (with the exception of 2017) on the DR-W field. In relation to CW-W and DB-W, this reduction ranged from 15.2% (2017) to 31.7% (2016).
Table 2.
Selected features of the foliage at the BBCH 58 stage.
As forecrops, pea and rape leaves crops’ residues are rich in N and other elements, and form a well-developed root system. After the cultivation of these crops, the soil is enriched with nutrients. It is characterized by a good structure and sustainable biological life [10,11,44]. The beneficial effect of N fertilization on LAI was confirmed by studies by Ma et al. [45] and Liu et al. [46].The greater leaf area allowed more PAR to be intercepted and converted in the photosynthetic process into chemical energy. Rape, while favorably influencing the soil environment, eliminated in it the adverse effects resulting from the triple successive cultivation of cereals under crop rotation (D). The inclusion of the blue tansy forecrop in this crop rotation might also have been a mitigating factor in this “triple successive cereal cultivation”. On the fields where wheat was cultivated following wheat and other cereals, soil degradation occurred due to the accumulation of harmful secondary accumulation in it, resulting in a biological imbalance in the soil, deterioration of soil structure, and nutrient depletion. This led to a lower uptake of water and nutrients from the soil, manifesting itself in poorer growth of both the above-ground parts and the roots [2,44]. Water deficiency in the plant contributed to a reduction in LAI and an increase in LMA. A larger LMA means that the leaves were thicker (as a result of the plant’s greater investment in structural and conductive tissues), which hindered the inflow of solar energy into their interior [35]. On the other hand, it provided protection against water loss and drying out [36,37]. The difference in the LMA value between sites with wheat cultivated following wheat and following barley and the other crop rotation sites in both periods under study (BBCH 36 and BBCH 58) was similar (Table 1 and Table 2). This indicates that the adverse effect of these sites on the wheat leaves started earlier and did not intensify over time (between these stages). In contrast, significantly lower LMA (irrespective of crop rotation) was noted at the sites of cultivation following pea and following rape. There, the leaves were larger and thinner, making it easier for sunlight to reach their interior [21,36,47].
At the BBCH 58 stage, similar to BBCH 36, significantly more chlorophyll was found in the leaves of wheat cultivated on the AP-W field, and additionally on CP-W in 2018, than on the other fields (Table 2). Its lowest content was found in wheat cultivated under crop rotation, with a 75% proportion of cereals in succession following barley (DB-W), and (with the exception of 2016) under crop rotation with 50% wheat on the field on which it was successively cultivated following wheat (CW-W). The content of this component was lower by 6.4–11% than that on the AP-W field. A significantly smaller Narea (except for the year 2017) was noted for the field with wheat cultivated following wheat and following barley (CW-W, DB-W). It was smaller than that on the other fields: in 2016, by 23.1–28.6%, and in 2018 by 11.1–28.6% (Table 2). In 2017, only on the AP-W field, significantly more Narea was found in the leaves of wheat than on the other fields (by almost 30%). Greater Narea following pea (especially under crop rotation A) and following rape was a result of greater N accumulation in the soil following these forecrops [45]. In addition, the arrangement of plants under crop rotation A with the provision of a 3-year break in the cultivation of wheat on the same field supported the activity of soil microorganisms and organic matter decomposition, including the release of elements such as N. Nitrogen is an essential plant nutrient. A sufficiently high content of this element in the leaves has a positive effect on the photosynthetic process [48] by increasing the chlorophyll content [49,50]. Chlorophyll plays an important role in photon absorption and transmission, and is closely related to the net assimilation rate [51]. A considerable proportion of this element is utilized for synthesizing the photosynthetic apparatus, particularly Rubisco [52]. In the current study, and in a study by Zhang et al. [50], higher N uptake had a positive effect on the chlorophyll content. Pan et al. [38] reported that under unfavorable conditions, the chlorophyll content and photosynthetic capacity are significantly reduced due to damage to both chloroplast morphology and the functional leaf structure.
The leaves of wheat cultivated on the fields CW-W and DB-W were characterized by a significantly higher T than that on the other fields: in 2016, by 0.7–2.1 °C, and in 2017 by 0.8–2.2 °C (Table 2). The leaf temperature on all crop rotation fields in 2018 was similar (no significant differences). Increasing T on fields CW-W and DB-W was due to a reduction in leaf transpiration rates [53]. On the one hand, this protected the plant from water loss, while on the other hand, it reduced water and nutrient uptake [54].
3.2. Leaf Gas Exchange
3.2.1. Stem Elongation Stage (BBCH 36)
In 2016, due to the long-lasting drought (12 days), the stomata in the wheat leaves on all crop rotation fields were almost completely closed (Table 3), and consequently, no significant differences occurred in their conductance (gs). In the years 2017 and 2018, the highest gs was noted for the AP-W field, and in 2018, additionally for the DR-W field. This was higher in relation to the least active stomata on the CW-W field (by 1.4–2.1 times) and on the DB-W (by 1.3–2.4 times). The differences noted between the above-mentioned fields were greater in 2017 than in 2018. In 2016, although the stomata closure reduced transpiration (E), significant differences between the fields under assessment were noted. In all the years of study, the highest E was exhibited by wheat cultivated on the AP-W field, while the lowest was exhibited by wheat cultivated on the CW-W and (with the exception of 2017) DB-W fields. On these fields, the reduction in E in relation to the AP-W amounted to: 42.9% in 2016, 63.8% in 2017, and 43.9% and 44.4% in 2018, respectively. The highest intercellular CO2 concentration (ci) was found in the leaves of wheat cultivated on the AP-W field in the years 2016 and 2017, and in 2018 on the CW-W field. On the AP-W field, its concentration was significantly higher than on the field with its lowest concentration, namely the DB-W: by 17.7% in 2016, and by 75% in 2017. In 2018, the advantage of CW-W over DB-W amounted to 48.1%. The highest net assimilation rate (An) was noted for the leaves of wheat cultivated on the AP-W field in all the years of the study, and additionally for the DR-W in 2018. In 2016, it was on an equally high level (no significant differences) on both the BR-W and BP-W fields. The An took the lowest value on the DB-W field in the years 2016 and 2018 (a reduction, in relation to AP-W, by 30.3% and 34.9%, respectively), and on the CW-W field in 2017 (a reduction, in relation to AP-W, by 43.4%). The results obtained in the experiment are confirmed by studies by Orzech et al. [31] conducted at an early maize development stage (BBCH 36), as well as by Janusauskaite et al. [48] and Wang et al. [18]. They demonstrated that physiological processes proceeded better under conditions favorable to cereals. However, Zhao et al. [55] demonstrated that under conditions unfavorable to wheat, a reduced photosynthesis rate was already noted at the early stages of the development of this cereal.
Table 3.
Parameters of gas exchange in winter wheat leaves at the BBCH 36 stage.
WUE significantly higher than that on the other fields was observed for CW-W, and additionally for CP-W, DR-W, and DB-W in 2018 (Table 2). The WUE reached the lowest values in 2016 on the AP-W field, in 2017 on the CP-W field, and in 2018 on the AP-W and BR-W fields. In relation to the fields with the highest WUE, this reduction ranged from 34.1% (2016) to 118% (2017). The higher WUE in the field with the wheat crop following wheat (CW-W) was due to the partial closure of the stomata and reduced transpiration [55]. The highest WUE1 was noted in 2017 on the DB-W field, and in 2018 on the AP-W and CW-W fields. This index took the lowest value in 2017 on the BR-W field (a reduction of 43.9% in relation to DB-W) and the CP-W field (a reduction of 40.5% in relation to DB-W). In 2018, the lowest WUE1 was noted on the BP-W and DB-W fields (a reduction of 13.1% in relation to AP-W). In 2016, the differences in the value of the analyzed index between the fields under assessment were the same as those for An due to the identical gs values for all fields. In the years 2016 and 2017, the least resistance to the CO2 flow (ls) was noted for the stomata in the leaves of wheat cultivated on the AP-W field, and also on DR-W in 2017. The greatest limitations in terms of ls were noted in 2016 on the DR-W field, and in 2017 on both crop rotation B fields (the BR-W and BP-W fields). In 2018, no significant differences in the value of this index were observed between the fields.
3.2.2. Heading Stage (BBCH 58)
In all the years of the study, the highest gs was exhibited by the leaves of wheat cultivated on the AP-W and DR-W fields, and additionally on the BP-W field in 2016 (Table 4). In the years 2016 and 2017, the lowest gs was observed for crop rotations C and D on the fields with wheat cultivated following wheat (CW-W) and following barley (DB-W). As compared to the AP-W field, gs was significantly lower on: the CW-W field by almost 50%, and the DB-W field by a value ranging from 55.3% (2017) to 71% (2016). In 2018, gs was significantly lower on the other fields (by 12.5–37.5%). In the years 2016 and 2017, E took the highest values on the AP-W field. In addition, in 2016, it was significantly higher on both fields under crop rotation B (BR-W, BP-W). In 2018, no significant differences were observed between the fields under crop rotations A, B, C, and D—on the field following rape (DR-W). In all the years, the lowest E was noted on the field with wheat cultivation following barley (DR-W), and additionally following wheat (CW-W) in 2017. On these fields, E was lower than that on AP-W by 35–45.5%. The highest ci in the years 2016 and 2017 was noted for fields following pea on the AP-W and CP-W fields, while in 2018, also following pea on CP-W and on both fields under crop rotation B (BP-W, BR-W). Significantly lowest ci was found in the leaves of wheat cultivated following barley on the DB-W field, and in 2016, additionally under crop rotation B following rape (BR-W) and following pea (BP-W). This reduction, in relation to the AP-W field, amounted to: 19.4–22.1% in 2016; 37.8% in 2017; and 17.1% in 2018. The net assimilation rate (An) on the AP-W field in all the years of study, and on the BR-W field in 2018, was significantly higher than on other fields. On the AP-W field, it was higher in relation to the fields with the lowest An: CW-W (in 2016 by 14.9%; in 2017 by 90.2%; and in 2018 by 70.1%) and DB-W (by 11.5%, 71.2%, and 77%, respectively).
Table 4.
Parameters of gas exchange in winter wheat leaves at the BBCH 58 stage.
The higher values of gs, E, ci, and An in crop rotation A were confirmed by the literature data, according to which a properly designed crop rotation with a sufficiently long break in the cultivation of wheat on the same field has a beneficial effect on both the growth and development of the cereal under analysis and the course of physiological processes [5]. Chapagain and Riseman [56] proved that the N taken up by the plants (it was present in higher amounts following pea thanks to biological synthesis) was effective in enhancing photosynthetic intensity, which was confirmed by the authors’ own study. At the site of this crop rotation, the assimilation apparatus functioned smoothly. The opening of the stomata enabled more rapid CO2 diffusion from the atmosphere (gs) and its concentration in the intercellular spaces (ci), followed by transport to the carboxylation site. This resulted in the highest net assimilation rate (An) of all the fields being compared. The more intensive gas exchange course under this crop rotation (AP-W field) is also indicated by the increase in E in relation to the other crop rotation sites at the BBCH 36 stage. The higher E was associated with a greater opening of the stomata and a greater uptake of water from the soil by plants. While emphasizing the favorable effect of crop rotation A on gas exchange, it should, however, be noted that in the experiment under analysis—in certain years, in the other crop rotations, and at other development stages—gas exchange was favorably influenced by the sites where wheat was cultivated following pea and following rape, with no clear predominance of either.
The authors’ own study documented that the successive cultivation of wheat following wheat under crop rotation C (despite the reinforcement of the site with the earlier cultivation of two very good forecrops, rape and pea, successively, and the blue tansy forecrop) and following barley under crop rotation with 75% of cereals resulted in limited photosynthesis and a reduced yield. Wheat plants are under stress when growing in such an environment. This manifests itself in poorer emergence, canopy thinning, less developed roots, and deterioration of the morphological characteristics of the above-ground parts, including the formation of leaves with a smaller area and lower chlorophyll and N contents. This was documented by the authors’ original study, as well as studies by Sieling and Christen [11], and Kirkegaard and Ryan [14]. The stomatal apparatus exhibits great sensitivity to changes in the environment. Where the environment fails to support plant growth (e.g., drought), one of the first responses is the closing of the stomata, which protects the plant against water loss while reducing the CO2 inflow to the leaf interior [57]. In our study, partial stomata closure reduced E and ci (but only on the field where wheat was cultivated following barley, DB-W) while increasing T, which slowed down the photosynthetic process. This had a negative effect on the An [54,58]. The magnitude of the An reduction on the fields where wheat was cultivated following wheat (CW-W) and following barley (DB-W) in both periods under study (BBCH stages 36 and 58) was similar, which is consistent with the results obtained by Setter et al. [59].
No effect of the crop rotation fields on the WUE was unequivocally demonstrated. Depending on the year of the study, its value varied from site to site. WUE1 reached a significantly higher value on the DB-W field in the years 2016 and 2017, and additionally on CP-W in 2017 and 2018, in relation to the other fields (especially in 2016). As for WUE, it was due to a greater reduction in E than in An, while for WUE1, it was due to a greater reduction in gs than in An on these fields. The differences between gs, E, and An between the other fields were not large enough to have a significant effect on the water management of wheat. In the years 2017 and 2018, the stomata offered the greatest resistance to the CO2 flow (ls) on the fields of wheat cultivated following wheat (CW-W) and following barley (DB-W). A different situation was noted in 2016, when the ls index reached the highest values on the BR-W field.
3.3. Above-Ground Biomass and Grain Yield
3.3.1. Above-Ground Biomass
At the BBCH 36 stage, the greatest above-ground biomass was produced by wheat cultivated on the AP-W field, and additionally on the DR-W field in 2016, on the CP-W field in 2017 and 2018, and on both fields under crop rotation B (BR-W, BP-W) in 2018 (Figure 2). The smallest biomass was noted on the field with wheat cultivated following wheat under crop rotation C (CW-W) and following barley—under D (DB-W). As regards the above-mentioned (most favorable) sites, biomass was significantly smaller here: by 10.3% and 16.3% in 2016, in 2017, by 15.4% and 16.8% in 2017, and by 6.7% and 8.9% in 2018. At the BBCH 58 stage (similarly to the previous period), the growth of wheat was supported at the site following pea under crop rotation A (AP-W), while in 2018, additionally following rape and following pea under crop rotation B (BR-W and BD-W), and following rape—under D (DR-W) (Figure 3). The smallest biomass was noted for the fields with wheat cultivated following wheat under crop rotation C (CW-W) and following barley—under D (DB-W) (with the exception of 2018). As compared to the sites with the greatest biomass, the reduction in the above-ground mass on these fields was as follows: 20.6% and 27.5% in 2016, 16.4% and 16.9% in 2017, and 5.4% and 6.0% in 2018.
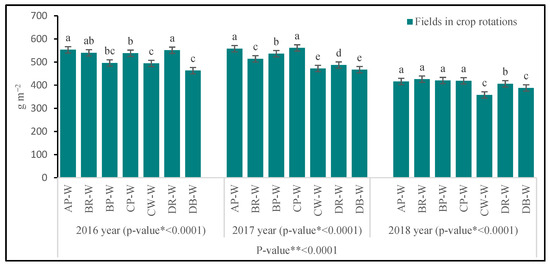
Figure 2.
Above-ground biomass of winter wheat at BBCH 36 stage. Abbreviations: * p-value for fields in crop rotations, ** p-value for years; AP-W—crop rotation A, forecrop pea; BR-W—crop rotation B, forecrop rape; BP-W—crop rotation B, forecrop pea; CP-W—crop rotation C, forecrop pea; CW-W—crop rotation C, forecrop wheat; DR-W– crop rotation D, forecrop rape; DB-W—crop rotation D, forecrop barley. Different letters indicate significant differences between fields in crop rotation (p < 0.05); n = 4.
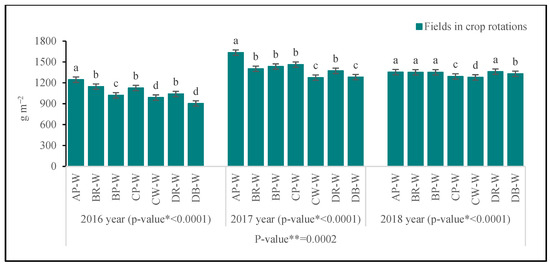
Figure 3.
Above-ground biomass of winter wheat at BBCH 58 stage. Abbreviations: * p-value for fields in crop rotations, ** p-value for years; AP-W—crop rotation A, forecrop pea; BR-W—crop rotation B, forecrop rape; BP-W—crop rotation B, forecrop pea; CP-W—crop rotation C, forecrop pea; CW-W—crop rotation C, forecrop wheat; DR-W– crop rotation D, forecrop rape; DB-W—crop rotation D, forecrop barley. Different letters indicate significant differences between fields in crop rotation (p < 0.05); n = 4.
3.3.2. Wheat Growth Rate between BBCH 36 and BBCH 58
In the years 2016 and 2017, the highest daily increment of the above-ground wheat biomass was noted on the AP-W field, while the lowest daily increment was noted on the DB-W field in 2016, and on the CW-W and DB-W fields in 2017 (Figure 4). The reduction in the growth rate on these fields, in relation to AP-W, was as follows: in 2016, by 36.5% in 2016, and by 17.7% and 16.5% in 2017. In 2018, no significant differences in the canopy growth rate were demonstrated between the crop rotation sites under assessment.
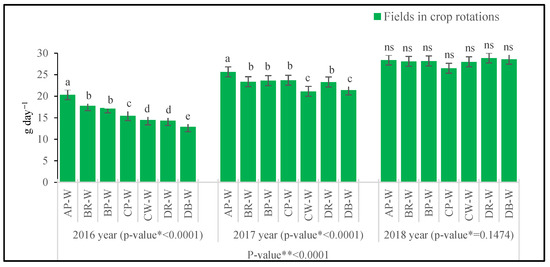
Figure 4.
Crop (wheat) growth rate (CGR) between BBCH 36 and BBCH 58 (g·m−2·day−1). Abbreviations: * p-value for fields in crop rotations, ** p-value for years; AP-W—crop rotation A, forecrop pea; BR-W—crop rotation B, forecrop rape; BP-W—crop rotation B, forecrop pea; CP-W—crop rotation C, forecrop pea; CW-W—crop rotation C, forecrop wheat; DR-W– crop rotation D, forecrop rape; DB-W—crop rotation D, forecrop barley. Different letters indicate significant differences between fields in crop rotation; ns – non significant (p < 0.05); n = 4.
3.3.3. Grain Yield
In all years of the study, a significantly greater grain yield was obtained from the field following pea under crop rotation A (AP-W) (Figure 5). Moreover, in 2017, it was at a similar level on the fields following rape and following pea under crop rotation B (BR-W, BP-W) and following pea under crop rotation C (CP-W). The successive cultivation of wheat following wheat (CW-W) and following barley (DB-W) significantly reduced the yield (the most). This reduction, in relation to crop rotation A, amounted to the following values, respectively, following wheat: 2016—32.4%; 2017—15.2%; and 2018—18.8%; and following barley: 2016—41.5%; 2017—12.5%; and 2018—23.9%.
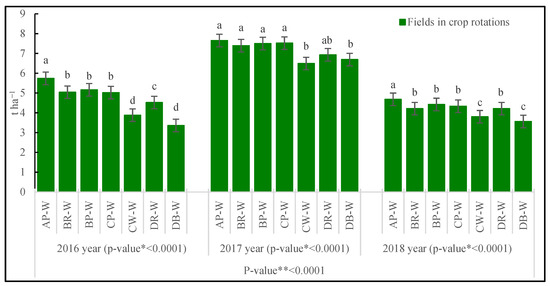
Figure 5.
Yield of wheat grain (t·ha−1). Abbreviations: * p-value for fields in crop rotations, ** p-value for years; AP-W—crop rotation A, forecrop pea; BR-W—crop rotation B, forecrop rape; BP-W—crop rotation B, forecrop pea; CP-W—crop rotation C, forecrop pea; CW-W—crop rotation C, forecrop wheat; DR-W—crop rotation D, forecrop rape; DB-W—crop rotation D, forecrop barley. Different letters indicate significant differences between fields in crop rotation (p < 0.05); n = 4.
The wheat yield is largely determined by the course of photosynthesis lasting for the entire growing season [27,45]. This process is adversely affected by an unfavorable site in crop rotation [3,31], which was documented by the authors’ study. The design of crop rotation A, under which every year a different species was cultivated on the same field with the additionally introduced forecrop of blue tansy, a 3-year break maintained in the wheat cultivation, and placing the wheat following pea provided good conditions for wheat growth. Under this crop rotation, the yield of the above-ground biomass (including the grains) was the greatest. The increment of biomass was also faster between these stages. The beneficial effect of the species-diversified crop rotation on wheat yield was confirmed in a study by Agomoh et al. [60], and Darguza and Gaile [61]. The successive cultivation of wheat following wheat (CW-W field), despite the previous cultivation of two very good forecrops at this site, namely rape and pea, and its reinforcement with the forecrop, did not prevent the reduction in biomass, the slowing of its increment, or the grain yield. The reduction in the above-ground biomass and grain yield on this field was similar to that following barley in crop rotation D, with 75% cereals. The reasons include a smaller area of the leaves, lower LAI, higher LMA, and lower Cl and N contents in the leaves, which considerably reduced the photosynthetic process, slowed the canopy growth, and ultimately reduced the grain yield. Therefore, the fields with crop rotation involving wheat following wheat and wheat following barley reduced photosynthesis, which influenced biomass, its accumulation rate, and the grain yield volume. The reduction in wheat yield on the field following wheat and on the field following other cereals was also found by Bennett et al. [2], Woźniak [7], Lepiarczyk et al. [9], and Wanic et al. [16].
3.4. The Relationship between Assimilation and the Foliage Characteristics and Wheat Yield
The relationship noted between the An and the foliage characteristics, and the above-ground biomass was stronger at the BBCH 58 stage than it was at the BBCH 36 stage (Table 5).
Table 5.
Correlations between the net assimilation rate and the foliage characteristics, above-ground biomass and yield of grain (n = 28).
At the BBCH 36 stage, a negative relationship between An and LMA and T was demonstrated for all the years of the study, while a positive relationship between An, LAI, Cl, Narea, and the above-ground biomass was demonstrated for two out of three years of the study. At the BBCH 58 stage, An exhibited a positive relationship with LAI, Cl, and the above-ground biomass; and a negative relationship with LMA and T throughout the 3-year period under study; and in 2 out of 3 years, a positive relationship with Narea and the grain yield.
This paper demonstrates a significant correlation between assimilation and the above-ground biomass yield, both in the period of vegetative (BBCH 36) and generative (BBCH 58) development. This relationship was similar in both periods under study. The weakest relationship between the net assimilation rate and the above-ground biomass was noted in 2018, which stood out as the most unfavorable conditions for wheat growth. Meanwhile, Ahmad et al. [22] reported that under unfavorable environmental conditions, the reduction in dry biomass and the net photosynthetic rate occur to a similar extent.
4. Conclusions
Gas exchange in the leaves was most favorably influenced by crop rotation, with a 3-year break in the cultivation of this cereal, following the pea forecrop. Here, the wheat leaves were characterized by the highest stomatal conductance, transpiration intercellular CO2 concentration, net assimilation rate, and a lower temperature. This was due to the greater assimilation area of the leaves and their higher nitrogen and chlorophyll contents. It had an effect on the volume of the above-ground mass produced, the canopy growth rate, and the grain yield. This is why crop rotation is the best solution recommended for use under sustainable farming systems. The net assimilation rate decreased with the shortening of the breaks in wheat cultivation on the same field and the deterioration of the forecrop, reaching the lowest values under crop rotation as a result of the cultivation of wheat following wheat and barley. At these sites, the foliage, above-ground biomass, and grain yield were the smallest. The effect of crop rotation sites on the foliage characteristics and gas exchange at the stem elongation stage (BBCH 36) and the heading stage (BBCH 58) was similar. The authors’ own study indicates that the diversity of plants cultivated under crop rotation, and maintaining a sufficiently long break in the cultivation of wheat on the same field ensure the smooth course of physiological processes and a high yield. Further research is needed into the role of crop rotation in shaping the gas exchange parameters under different soil and climate conditions, as well as in-depth research into changes in the leaf anatomy and the generation and distribution of photosynthetic products. What is also recommended is in-depth research into the causes of disruption of the physiological processes of plants and their poorer growth at their cultivation sites under shortened crop rotations and when the same crop is cultivated twice in a row. Understanding the role of crop rotation in shaping the physiological processes of plants under different habitat conditions will enable the selection of the best sites in crop rotation for winter wheat.
Supplementary Materials
The following supporting information can be downloaded at: https://www.mdpi.com/article/10.3390/agriculture13050958/s1, Table S1: Experimental design; Abbreviations.
Author Contributions
Conceptualization, M.W.; methodology, M.W.; software, M.W.; formal analysis, M.W.; investigation, M.W. and M.P.; resources, M.W. and M.P.; data curation, M.W. and M.P.; writing—original draft preparation, M.W.; writing—review and editing, M.W. and M.P.; visualization, M.W.; project administration, M.W.; funding acquisition, M.W. All authors have read and agreed to the published version of the manuscript.
Funding
This research was funded by the University of Warmia and Mazury in Olsztyn, Faculty of Agriculture and Forestry, Department of Agroecosystems and Horticulture (grant No. 30.610.015-110).
Institutional Review Board Statement
Not applicable.
Data Availability Statement
Data is contained within the article or supplementary material.
Conflicts of Interest
The authors declare no conflict of interest.
References
- FAO. FAO Statistical Yearbook—Word Food and Agriculture; FAO: Rome, Italy, 2022; p. 382. [Google Scholar]
- Bennett, A.J.; Bending, G.D.; Chandler, D.; Hilton, S.; Mills, P. Meeting the demand for crop production: The challenge of yield decline in crops grown in short rotations. Biol. Rev. 2012, 87, 52–71. [Google Scholar] [CrossRef] [PubMed]
- Wanic, M.; Treder, K. Effect of forecrops crops on gas exchange and selected agronomic characteristics of wheat and spelt. J. Elem. 2020, 25, 607–619. [Google Scholar] [CrossRef]
- Pramanick, B.; Kumar, M.; Naik, B.M.; Singh, S.K.; Maitra, S.; Naik, B.; Rajput, V.D.; Minkina, T. Long-Term Conservation Tillage and Precision Nutrient Management in Maize-Wheat Cropping System: Effect on Soil Properties, Crop Production, and Economics. Agronomy 2022, 12, 2766. [Google Scholar] [CrossRef]
- Ball, B.C.; Bingham, I.; Rees, R.M.; Watson, C.A.; Litterick, A. The role of crop rotations in determining soil structure and crop growth conditions. Can. J. Soil Sci. 2005, 85, 557–577. [Google Scholar] [CrossRef]
- Babulicova, M. The influence of fertilization and crop rotation on the winter wheat production. Plant Soil Environ. 2014, 60, 297–302. [Google Scholar] [CrossRef]
- Wozniak, A. Effect of Crop Rotation and Cereal Monoculture on the Yield and Quality of Winter Wheat Grain and on Crop Infestation with Weeds and Soil Properties. Int. J. Plant Prod. 2019, 13, 177–182. [Google Scholar] [CrossRef]
- Gill, K.S. Crop rotations compared with continuous canola and wheat for crop production and fertilizer use over 6 yr. Can. J. Plant Sci. 2018, 98, 1139–1149. [Google Scholar] [CrossRef]
- Lepiarczyk, A.; Kulig, B.; Stepnik, K. The influence of simplified soil cultivation and forecrop on the development LAI of selected cultivars of winter wheat in cereal crop rotation. Fragm. Agron. (Pol.) 2005, 2, 98–105. [Google Scholar]
- Faligowska, A.; Szymanska, G.; Panasiewicz, K.; Szukala, J.; Koziara, W.; Ratajczak, K. The long-term effect of legumes as forecrops on the productivity of rotation (winter rape-winter wheat-winter wheat) with nitrogen fertilization. Plant Soil Environ. 2019, 65, 138–144. [Google Scholar] [CrossRef]
- Sieling, K.; Christen, O. Crop rotation effects on yield of oilseed rape, wheat and barley and residual effects on the subsequent wheat. Arch. Agron. Soil Sci. 2015, 61, 1531–1549. [Google Scholar] [CrossRef]
- Sieling, K.; Stahl, C.; Winkelmann, C.; Christen, O. Growth and yield of winter wheat in the first 3 years of a monoculture under varying N fertilization in NW Germany. Eur. J. Agron. 2005, 22, 71–84. [Google Scholar] [CrossRef]
- Aslam, F.; Khaliq, A.; Matloob, A.; Tanveer, A.; Hussain, S.; Zahir, Z. Allelopathy in agro-ecosystems: A critical review of wheat allelopathy-concepts and implications. Chemoecology 2017, 27, 1–24. [Google Scholar] [CrossRef]
- Kirkegaard, J.A.; Ryan, M.H. Magnitude and mechanisms of persistent crop sequence effects on wheat. Field Crops Res. 2014, 164, 154–165. [Google Scholar] [CrossRef]
- Feng, H.; Abagandura, G.O.; Senturklu, S.; Landblom, D.G.; Lai, L.; Ringwall, K.; Kumar, S. Soil quality indicators as influenced by 5-year diversified and monoculture cropping systems. J. Agric. Sci. 2020, 158, 594–605. [Google Scholar] [CrossRef]
- Wanic, M.; Denert, M.; Treder, K. Effect of forecrops on the yield and quality of common wheat and spelt wheat grain. J. Elem. 2019, 24, 369–383. [Google Scholar] [CrossRef]
- Vitale, L.; Arena, C.; Carillo, P.; Di Tommasi, P.; Mesolella, B.; Nacca, F.; De Santo, A.V.; Fuggi, A.; Magliulo, V. Gas exchange and leaf metabolism of irrigated maize at different growth stages. Plant Biosyst. 2011, 145, 485–494. [Google Scholar] [CrossRef]
- Wang, X.B.; Wang, L.F.; Shangguan, Z. Leaf Gas Exchange and Fluorescence of Two Winter Wheat Varieties in Response to Drought Stress and Nitrogen Supply. PLoS ONE 2016, 11, e0165733. [Google Scholar] [CrossRef]
- Lalarukh, I.; Ashraf, M.A.; Azeem, M.; Hussain, M.; Akbar, M.; Ashraf, M.Y.; Javed, M.T.; Iqbal, N. Growth stage-based response of wheat (Triticum aestivum L.) to kinetin under water-deficit environment: Pigments and gas exchange attributes. Acta Agric. Scan. Sect. B Soil Plant Sci. 2014, 64, 501–510. [Google Scholar] [CrossRef]
- Todorova, D.; Aleksandrov, V.; Anev, S.; Sergiev, I. Photosynthesis Alterations in Wheat Plants Induced by Herbicide, Soil Drought or Flooding. Agronomy, 2022; 12, 390. [Google Scholar] [CrossRef]
- de la Riva, E.G.; Olmo, M.; Poorter, H.; Ubera, J.L.; Villar, R. Leaf Mass per Area (LMA) and Its Relationship with Leaf Structure and Anatomy in 34 Mediterranean Woody Species along a Water Availability Gradient. PLoS ONE 2016, 11, e0148788. [Google Scholar] [CrossRef]
- Ahmad, M.I.; Shah, A.N.; Sun, J.Q.; Song, Y.H. Comparative Study on Leaf Gas Exchange, Growth, Grain Yield, and Water Use Efficiency under Irrigation Regimes for Two Maize Hybrids. Agriculture 2020, 10, 369. [Google Scholar] [CrossRef]
- Perdomo, J.A.; Conesa, M.A.; Medrano, H.; Ribas-Carbo, M.; Galmes, J. Effects of long-term individual and combined water and temperature stress on the growth of rice, wheat and maize: Relationship with morphological and physiological acclimation. Physiol. Plant. 2015, 155, 149–165. [Google Scholar] [CrossRef]
- Bhusal, N.; Lee, M.; Lee, H.; Adhikari, A.; Han, A.R.; Han, A.; Kim, H.S. Evaluation of morphological, physiological, and biochemical traits for assessing drought resistance in eleven tree species. Sci. Total Environ. 2021, 779, 146466. [Google Scholar] [CrossRef] [PubMed]
- Bhusal, N.; Bhusal, S.J.; Yoon, T.M. Comparisons of physiological and anatomical characteristics between two cultivars in bi-leader apple trees (Malus x domestica Borkh.). Sci. Hortic. 2018, 231, 73–81. [Google Scholar] [CrossRef]
- Ren, B.Z.; Liu, W.; Zhang, J.W.; Dong, S.T.; Liu, P.; Zhao, B. Effects of plant density on the photosynthetic and chloroplast characteristics of maize under high-yielding conditions. Sci. Nat. 2017, 104, 1–11. [Google Scholar] [CrossRef] [PubMed]
- Richards, R.A. Selectable traits to increase crop photosynthesis and yield of grain crops. J. Exp. Bot. 2000, 51, 447–458. [Google Scholar] [CrossRef] [PubMed]
- Ewert, F. Modelling plant responses to elevated CO2: How important is leaf area index? Ann. Bot. 2004, 93, 619–627. [Google Scholar] [CrossRef] [PubMed]
- Tshikunde, N.M.; Odindo, A.; Shimelis, H.; Mashilo, J. Leaf gas exchange and water-use efficiency of dry-land wheat genotypes under water stressed and non-stressed conditions. Acta Agric. Scan. Sect. B Soil Plant Sci. 2018, 68, 738–748. [Google Scholar] [CrossRef]
- Asner, G.P.; Martin, R.E.; Tupayachi, R.; Emerson, R.; Martinez, P.; Sinca, F.; Powell, G.V.N.; Wright, S.J.; Lugo, A.E. Taxonomy and remote sensing of leaf mass per area (LMA) in humid tropical forests. Ecol. Appl. 2011, 21, 85–98. [Google Scholar] [CrossRef]
- Orzech, K.; Wanic, M.; Zaluski, D. Gas Exchanges in the Leaves of Silage Maize Depending on the Forecrop and Maize Development Stage. Agronomy 2022, 12, 396. [Google Scholar] [CrossRef]
- Hangs, R.D.; Van Rees, K.C.J.; Schoenau, J.J.; Guo, X. A simple technique for estimating above-ground biomass in short-rotation willow plantations. Biomass Bioenergy 2011, 35, 2156–2162. [Google Scholar] [CrossRef]
- Hikosaka, K. Leaf canopy as a dynamic system: Ecophysiology and optimality in leaf turnover. Ann. Bot. 2005, 95, 521–533. [Google Scholar] [CrossRef] [PubMed]
- Liu, Y.; Li, M.X.; Xu, J.S.; Liu, X.Y.; Wang, S.Y.; Shi, L.X. Physiological and metabolomics analyses of young and old leaves from wild and cultivated soybean seedlings under low-nitrogen conditions. BMC Plant Biol. 2019, 19, 1–15. [Google Scholar] [CrossRef]
- Cheng, T.; Rivard, B.; Sanchez-Azofeifa, A.G.; Feret, J.B.; Jacquemoud, S.; Ustin, S.L. Deriving leaf mass per area (LMA) from foliar reflectance across a variety of plant species using continuous wavelet analysis. Isprs J. Photogramm. Remote Sens. 2014, 87, 28–38. [Google Scholar] [CrossRef]
- Wright, I.J.; Reich, P.B.; Westoby, M.; Ackerly, D.D.; Baruch, Z.; Bongers, F.; Cavender-Bares, J.; Chapin, T.; Cornelissen, J.H.C.; Diemer, M.; et al. The worldwide leaf economics spectrum. Nature 2004, 428, 821–827. [Google Scholar] [CrossRef]
- Poorter, H.; Niinemets, U.; Poorter, L.; Wright, I.J.; Villar, R. Causes and consequences of variation in leaf mass per area (LMA): A meta-analysis (vol 182, pg 565, 2009). New Phytol. 2009, 183, 1222. [Google Scholar]
- Pan, X.; Lada, R.R.; Caldwell, C.D.; Falk, K.C. Water-stress and N-nutrition effects on photosynthesis and growth of Brassica carinata. Photosynthetica 2011, 49, 309–315. [Google Scholar] [CrossRef]
- Ohsumi, A.; Hamasaki, A.; Nakagawa, H.; Yoshida, H.; Shiraiwa, T.; Horie, T. A model explaining genotypic and ontogenetic variation of leaf photosynthetic rate in rice (Oryza sativa) based on leaf nitrogen content and stomatal conductance. Ann. Bot. 2007, 99, 265–273. [Google Scholar] [CrossRef] [PubMed]
- Yin, C.Y.; Berninger, F.; Li, C.Y. Photosynthetic responses of Populus przewalski subjected to drought stress. Photosynthetica 2006, 44, 62–68. [Google Scholar] [CrossRef]
- Zhang, S.R.; Dang, Q.L. Effects of carbon dioxide concentration and nutrition on photosynthetic functions of white birch seedlings. Tree Physiol. 2006, 26, 1457–1467. [Google Scholar] [CrossRef]
- Ahmadi, A.; Siosemardeh, A. Investigation on the physiological basis of grain yield and drought resistance in wheat: Leaf photosynthetic rate, stomatal conductance and non-stomatal limitation. Int. J. Agric. Biol. 2005, 7, 807–811. [Google Scholar]
- Radford, P.J. Growth Analysis Formulae—Their Use and Abuse1. Crop Sci. 1967, 7, 171–175. [Google Scholar] [CrossRef]
- Kirkegaard, J.; Christen, O.; Krupinsky, J.; Layzell, D. Break crop benefits in temperate wheat production. Field Crops Res. 2008, 107, 185–195. [Google Scholar] [CrossRef]
- Ma, P.; Lan, Y.; Lyu, T.F.; Zhang, Y.J.; Lin, D.; Li, F.J.; Li, Y.; Yang, Z.Y.; Sun, Y.J.; Ma, J. Improving Rice Yields and Nitrogen Use Efficiency by Optimizing Nitrogen Management and Applications to Rapeseed in Rapeseed-Rice Rotation System. Agronomy 2020, 10, 1060. [Google Scholar] [CrossRef]
- Liu, Z.X.; Gao, F.; Yang, J.Q.; Zhen, X.Y.; Li, Y.; Zhao, J.H.; Li, J.R.; Qian, B.C.; Yang, D.Q.; Li, X.D. Photosynthetic Characteristics and Uptake and Translocation of Nitrogen in Peanut in a Wheat-Peanut Rotation System Under Different Fertilizer Management Regimes. Front. Plant Sci. 2019, 10, 86. [Google Scholar] [CrossRef]
- Reich, P.B.; Walters, M.B.; Ellsworth, D.S. Leaf life-span in relation to leaf, plant, and stand characteristics among diverse ecosystems. Ecol. Monogr. 1992, 62, 365–392. [Google Scholar] [CrossRef]
- Janusauskaite, D.; Feiziene, D.; Feiza, V. Nitrogen-induced variations in leaf gas exchange of spring triticale under field conditions. Acta Physiol. Plant. 2017, 39, 1–12. [Google Scholar] [CrossRef]
- DaMatta, F.M.; Loos, R.A.; Silva, E.A.; Loureiro, M.E.; Ducatti, C. Effects of soil water deficit and nitrogen nutrition on water relations and photosynthesis of pot-grown Coffea canephora Pierre. Trees-Struct. Funct. 2002, 16, 555–558. [Google Scholar] [CrossRef]
- Zhang, X.C.; Yu, X.F.; Ma, Y.F. Effect of nitrogen application and elevated CO2 on photosynthetic gas exchange and electron transport in wheat leaves. Photosynthetica 2013, 51, 593–602. [Google Scholar] [CrossRef]
- Baig, M.J.; Anand, A.; Mandal, P.K.; Bhatt, R.K. Irradiance influences contents of photosynthetic pigments and proteins in tropical grasses and legumes. Photosynthetica 2005, 43, 47–53. [Google Scholar] [CrossRef]
- Sugiharto, B.; Miyata, K.; Nakamoto, H.; Sasakawa, H.; Sugiyama, T. Regulation of expression of carbon-assimilating enzymes by nitrogen in maize leaf. Plant Physiol. 1990, 92, 963–969. [Google Scholar] [CrossRef]
- Hirayama, M.; Wada, Y.; Nemoto, H. Estimation of drought tolerance based on leaf temperature in upland rice breeding. Breed. Sci. 2006, 56, 47–54. [Google Scholar] [CrossRef]
- Lehmann, P.; Or, D. Effects of stomata clustering on leaf gas exchange. New Phytol. 2015, 207, 1015–1025. [Google Scholar] [CrossRef]
- Zhao, W.H.; Liu, L.Z.; Shen, Q.; Yang, J.H.; Han, X.Y.; Tian, F.; Wu, J.N. Effects of Water Stress on Photosynthesis, Yield, and Water Use Efficiency in Winter Wheat. Water 2020, 12, 2127. [Google Scholar] [CrossRef]
- Chapagain, T.; Riseman, A. Nitrogen and carbon transformations, water use efficiency and ecosystem productivity in monocultures and wheat-bean intercropping systems. Nutr. Cycl. Agroecosyst. 2015, 101, 107–121. [Google Scholar] [CrossRef]
- Reddy, A.R.; Chaitanya, K.V.; Vivekanandan, M. Drought-induced responses of photosynthesis and antioxidant metabolism in higher plants. J. Plant Physiol. 2004, 161, 1189–1202. [Google Scholar] [CrossRef]
- Saeidi, M.; Abdoli, M. Effect of Drought Stress during Grain Filling on Yield and Its Components, Gas Exchange Variables, and Some Physiological Traits of Wheat Cultivars. J. Agr. Sci. Technol. 2015, 17, 885–898. [Google Scholar]
- Setter, T.L.; Flannigan, B.A.; Melkonian, J. Loss of kernel set due to water deficit and shade in maize. Crop Sci. 2001, 41, 1530–1540. [Google Scholar] [CrossRef]
- Agomoh, I.V.; Drury, C.F.; Phillips, L.A.; Reynolds, W.D.; Yang, X.M. Increasing crop diversity in wheat rotations increases yields but decreases soil health. Soil Sci. Soc. Am. J. 2020, 84, 170–181. [Google Scholar] [CrossRef]
- Darguza, M.; Gaile, Z. Yield and quality of winter wheat, depending on crop rotation and soil tillage. Res. Rural Dev. 2019, 2, 29–35. [Google Scholar] [CrossRef]
Disclaimer/Publisher’s Note: The statements, opinions and data contained in all publications are solely those of the individual author(s) and contributor(s) and not of MDPI and/or the editor(s). MDPI and/or the editor(s) disclaim responsibility for any injury to people or property resulting from any ideas, methods, instructions or products referred to in the content. |
© 2023 by the authors. Licensee MDPI, Basel, Switzerland. This article is an open access article distributed under the terms and conditions of the Creative Commons Attribution (CC BY) license (https://creativecommons.org/licenses/by/4.0/).