Abstract
Biodiversity of red clover is changing. It is become more difficult to find new breeding material. Moreover, populations with predominant morphological features of cultivars are more frequently found in wild habitats. Therefore, it is important to identify genetic structure and diversity within and among wild populations and cultivars worldwide. During this research, seed samples from wild red clover (Trifolium pratense L.) habitats were collected in different Lithuanian sites in nemoral environmental zone. Subsequently, samples were germinated in greenhouse and randomly taken for genetic analyses. ISSR fingerprints of 339 genotypes from 13 populations and 5 varieties were analysed. Analysis of molecular variance (AMOVA) has shown high genetic variation within populations (83%). The highest polymorphism was identified in population pop2887 (PPL = 82.28%). Interestingly the polymorphism of varieties was high and ranged from 64.56 (‘Vytis’) to 83.54 (‘Liepsna’). Meanwhile, variance among populations was low—17%. Fixation index FST = 0.182 revealed high differentiation of the populations while gene flow was high with an exchange of 2.2474 migrants per generation. This revealed a high genetic diversity within populations and high gene flow between wild populations and cultivars in Lithuania.
1. Introduction
Red clover is one of the most widely grown species of the Fabaceae family for animal feed in nemoral environmental zone [1,2,3]. The name of Trifolium, translated from Latin means: three from “tres” and leaf from “folium”. This indicates the main distinguishing feature of this genus—trifoliate foliage; however, four-leaf- or even five-leaf red clovers may be found [4,5]. It has been reported that four-leaf clover plants occur at a frequency of 1:6000, while five-leaf clovers could be found in 1 of 10,000 wild populations [5]. Another original feature of Trifolium pratense L. is its V-shape white mark on the leaves [5,6]. Those triangular markings are distinguishing characteristics that allow us to identify species within the genus Trifolium [5,7,8]. Nevertheless, more phenotypic characteristics assist in identifying species from the same genus. However, excluding cultivars among their wild relatives is more difficult, especially at the full seed maturity stage or when plants are defoliated. Therefore, genetic analyses are indispensable for better taxonomy identification.
The abundance of red clover varieties bred in recent decades reveals high demand for this species. During modern breeding they became more productive and more resistant to pests and abiotic stress. However, new varieties remain more or less the same feature—to produce high-quality fodder yield. In addition, red clover is appreciated as an excellent intercrop and crop rotation species for sustainable farming or “greening” programs implementation [9,10]. Moreover, symbiosis with root-nodule bacteria allows red clover to capture atmospheric nitrogen and accumulate it in the soil, which makes this species so tempting to farmers [4,10,11].
Red clover is a diploid species by its nature, and cells of autochthonous red clover have a diploid chromosome set (2n = 2x = 14), while the breeders present cultivars that are modified to have a tetraploid set of chromosomes (2n = 4x = 28) [4,12,13]. Different inhibitors (colchicine, amiprophos-methyl, trifluralin, or oryzalin) may induce polyploidisation [14,15]. However, the methods of breeding are gradually changing. The process has become more diversified compared to the last century. Recently, red clover has been used in the food industry as a bioactive supplement. Moreover, this species is cherished by beekeepers and landscapers [16,17]. This shows a wide application of Trifolium pratense L.
New breeding directions demand deeper knowledge of the genetic structure of the species. Moreover, plant genetic resources are an important element of biodiversity and national assets that must be preserved. It is crucial to know where genetic resources that meet breeding aims can be found. The process of losses and fragmentation of natural habitats has been particularly intensified over the last century. Researchers have noticed that biodiversity is declining in different species, including red clover [18,19]. The gene flow of domesticated red clover likely causes some changes in the genetic diversity of wild populations. In addition, it leads to changes in allele frequencies and a decrease in the gene pool size [20]. Moreover, crop wild relatives (CRWs) are suppressed by inbreeding with cultivars [21,22]. As a result, productivity and resistance to diseases decrease in relation to plants’ genetic diversity.
It is important to identify whether there are autochthonous red clover populations in wild grasslands in Lithuania. Moreover, it is crucial to identify the types of populations that currently predominate in natural habitats and the structure of those populations. This knowledge would be useful for understanding gene flow dynamics between cultivars and their wild relatives. Moreover, it would be useful to identify a new gene donor for breeding because new genetic material is the basis for breeding programs.
This study aimed to determine the genetic structure of wild red clover populations and local cultivars in Lithuania, which is in the nemoral environmental zone. The genotypic diversity of red clover populations collected across Lithuania was compared with locally bred varieties. Furthermore, the links between genetic diversity and gene flow were evaluated.
2. Materials and Methods
At the beginning of the research, seeds from wild red clover populations were collected across Lithuania in 2016. Those seeds were collected from 32 wild and semiwild populations and two from Plant Gene Bank (Figure 1). Five red clover varieties bred in Lithuania were also included in the project.
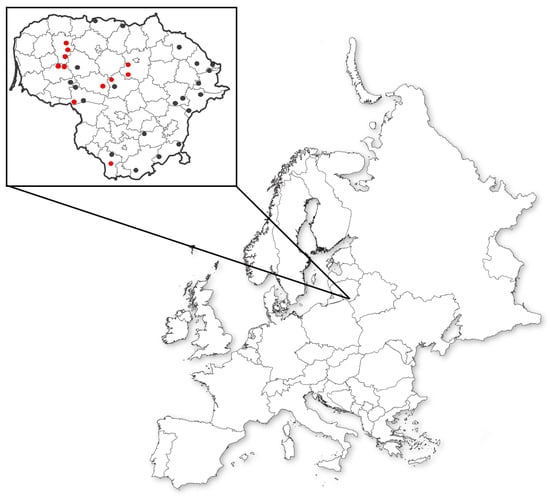
Figure 1.
Seeds collected for the research: red dots—genotyped populations; black dots—only phenotyped populations.
In the second step, seeds of red clover populations and varieties germinated in the greenhouse on 18 April 2017. Each population was composed of at least 45 individual plants. Samples for genetic analysis were taken randomly from 24 plants in each population. Each sample for at least 100 mg was taken from young and fresh red clover leaves. The samples were frozen in a deep freezer at −80 °C and stored till genetic analysis in the laboratory was started. Finally, red clover plants of each population and variety were transplanted into the field trial ex situ on 10 July 2017.
Based on phenotypic differences, all the populations were divided into three groups: cultivars, wilds, and semiwilds (Figure A1) [23].
Populations for further genetic analysis were chosen randomly from each of those three groups. The ISSR technique analysed a total of 13 populations and 5 Lithuanian-bred varieties (Table A1). Genomic DNA was extracted from 100 mg of thawed leaves based on the CTAB method [24].
DNA concentration and quality were evaluated using NanoDrop 2000 spectrophotometer (Thermo Scientific, Waltham, MA, USA). Only samples with DNA concentrations of at least 50 ng μL−1 and quality between 1.7 and 1.9 spectrophotometer laser wavelength ratios (A260/A280) were used for further research.
Polymerase chain reactions (PCR) were repeated at least twice. A reaction mixture of 10 μL was used to perform ISSR-PCR for each genotype. Only vivid and well-reproducing DNA fragments were evaluated.
ISSR-PCR was performed using Mastercycler® and Mastercycler Gradient® (Eppendorf, Germany) thermocyclers. The most efficient primers with clarity and repeatability and an abundance of fragments were selected from 30 primers and used for further analyses according to previous research [25,26]. All populations were analysed by using five primers (Table 1).

Table 1.
Sequences of ISSR primers.
Amplification of ISSR fragments: initial DNA denaturation at 95 °C for 3 min followed by 30 cycles: DNA denaturation at 95 °C for 30 s, next step annealing of primers for 30 s at 49–55 °C. In the penultimate step, DNA was synthesised at 72 °C for 60 s, and the final synthesis was performed at 72 °C for 5 min. ISSR-PCR products were run on 1.5% agarose gel. Finally, gels were analysed under UV light using the MiniBIS pro (DNA Bio-Imaging Systems) documentation system.
Statistical Analysis
Several specific programs were used for data processing and statistical analyses. The unweighted pair group method with arithmetic mean (UPGMA) was used to determine phylogenetic affinity. Population polymorphism, F-statistics, Nei’s genetic distances, and molecular genetic diversity analysis (AMOVA) were performed using the GenAlEx 6.503 program. Principal component analysis (PCA) was performed using SAS 9.4 software [27]. Nei’s genetic diversity (h), Shannon diversity index (I), and percentage of polymorphic fragments (PPL) were calculated using the Popgene v1.32 computer program.
The genetic structure of the populations was analysed by Structure v2.3.4 software using the Markov Chain Monte Carlo (MCMC) algorithm. The value of the selected number of groups (K) was not lower than the number of analysed populations (K = 1–18). The procedure used the Admixture model, and the test repetition period was 100,000 and 100,000 MCMC iterations with three independent runs. The structure Harvester program determined the optimal K value based on the maximum ΔK value. The genetic structure model was developed by the Clumpak program based on the results of Bayesian analysis [28].
The fixation index FST was calculated to assess the genetic differentiation of populations:
where HT is expected heterozygosity and HS—observed heterozygosity [29].
FST = (HT − HS)/HT,
The value of polymorphism information content (PIC) was calculated according to the formula:
where pi and pj are the population frequency of the i-th and j-th alleles [30,31].
PIC = 1 − Σ pi2 − Σ Σ pi2 pj2,
3. Results and Discussion
3.1. Genetic Structure of Red Clover Populations
Fingerprinting of Inter Simple Sequence Repeats (ISSR) was used to reveal the DNA diversity of red clover. Overall, 79 fragments were amplified by using five different primers (Table 2). Those fragments ranged from 450 bp to 2500 bp. ISSR2 primer amplified the most fragments (18), and 77.8% were polymorphic. Meanwhile, primer UBC857 amplified only 13 fragments, of which ten were polymorphic. However, the lowest yield of polymorphic fragments (73.3%) was identified by using the ISSR1 primer. This indicated that all primers were highly specific for polymorphism detection in red clover. The high quality of ISSR primers for red clover polymorphism analysis was also confirmed by polymorphic information content (PIC) values that ranged from 0.4882 (ISSR1) to 0.4922 (ISSR2), with an average of 0.4906. The closer PIC value to 0.5, the more informative and more selective primer is for DNA fingerprinting. In most cases, researchers choose primers with a PIC value close to 0.5 in order to reduce costs and reveal polymorphism with a smaller number of primers [32]. For instance, Gholami et al. [33] analysed different orchid species by using ISSR primers who has narrow range of informativeness, and average PIC value range from 0.391 up to 0.488. Therefore, obtained PIC value was in range to use ISSR markers for Orchidaceae species. However, if the PIC value is below 0.25 it should not be used for DNA fingerprinting, because of its low informativeness [32].
Table 2.
The amplification results of ISSR primers.
Analysis of molecular variance (AMOVA) revealed that the differentiation of genetic diversity was higher within populations than among them and reached 83% (Table 3). This indicated that the majority of the populations were dominated by high genetic diversity within plants and that those populations were heterogeneous. Moreover, the variation in molecular diversity among populations was only 17%. Our results supported previous findings of other researchers. Ulloa et al. (2003) analysed 400 red clover individuals collected in Chile. They found that variation within populations was 80.4%, while between populations, it was 14.1% based on AMOVA results [34]. A more extensive analysis was performed by Jones et al. (2020). Researchers reported that the variation within red clover populations was 56.3%, while between populations, it was 22.9% [20]. All these results support the hypothesis that the high distribution of genetic diversity within populations is independent of geographic location [20,34,35]. However, high genetic variation within red clover populations could be justified by the prevalence of seeds [20,36]. It is also likely that most of such populations are not isolated by environmental barriers [37]. Therefore, can crossbreed with different populations (interpopulation crosses), which leads to low genetic diversity among those populations [22,37].
Table 3.
Analysis of molecular variance (AMOVA) in red clover populations.
Wright (1978) claims, that if the FST value of the population is between 0.15 and 0.25, it is highly differentiated [38]. We have indicated FST = 0.182 among populations and the value of the interpopulation indicator PhiPT = 0.173 (p < 0.001). Therefore, it is likely that the exchange of genetic information among populations is extensive. Meanwhile, gene flow between populations was confirmed by the gene flow index (Nm) value, which indicates the flow of migrants per generation (Nm = 2.2474). In this case, the index is greater than one (Nm > 1); therefore, gene flow is high but enough to negate the effects of genetic drift [38,39]. Our findings suggest that the genetic diversity of red clover is declining due to constant gene flow. As a result, some alleles encoding unique traits may already be lost.
The genetic structure of local cultivars and wild populations of red clover has also provided important information about gene flow. The results of Bayesian clustering showed that the populations of T. pratense best fit two genetic groups when the delta K value was K = 2 (Figure 2).
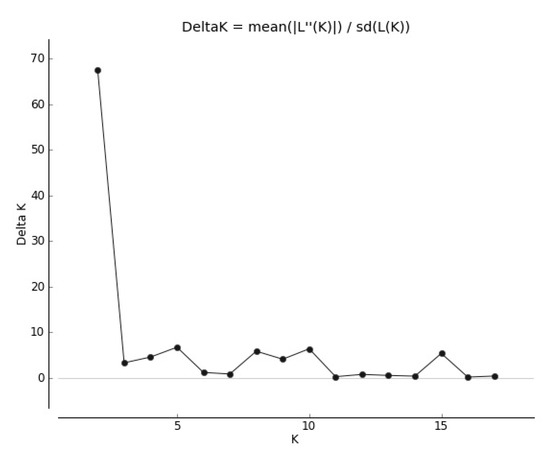
Figure 2.
Delta K values for different numbers of populations assumed in STRUCTURE.
Analysis of the population’s genetic structure revealed that most wild populations tended to cluster in the light blue group, while cultivars were clustered in the orange group (Figure 3). However, several populations have had genetic structures common to both clusters. For instance, individual plants specific to the cultivars were found in wild-type populations. The distribution of such plants was quite diverse among populations. Interestingly, two populations, pop2880 and pop2890, were different from all others. Those two populations were closely related to the cultivars by their genetic structure. Meanwhile, ‘Vytis’ was closely related to the wild type. Such results reveal that the genetic structure of populations and cultivars is not homogeneous. Some cultivars are closely related to populations by their genetic structure, which suggests that cultivars may have spread to wild populations over the years. Gupta et al. (2017) provided similar insights into the genetic structure and diversity of red clover. Researchers have analysed red clover germplasm from the GenBank of the National Temperate Forage Legume Germplasm Unit (USA). They found 91% within and 9% among population genetic variation [40]. Moreover, the structure of the analysed populations revealed the idea that some populations show considerable admixture in individuals within clusters [40,41].
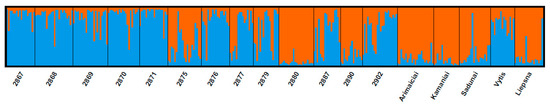
Figure 3.
Bayesian analysis (K = 2) of red clover populations by using Structure software. Different colours represent main population groups.
3.2. Genetic Diversity within Populations
The per cent of polymorphic loci (PPL) was determined by Popgene v1.32 software, which allows us to estimate polymorphism within populations [42]. The results revealed that population pop2887 was divergent from the others by its high polymorphism per cent (PPL = 82.28%), while the lowest polymorphism (PPL = 69.62%) was established in two populations (pop2870 and pop2890) (Table 4). Meanwhile, ‘Liepsna’ was distinguished by the highest polymorphism (PPL = 83.54%), and ‘Vytis’ stood out by the lowest percentage of polymorphic loci (PPL = 64.56%) among varieties. It is important to note that ‘Vytis’ was bred and listed on the National List of Plant Varieties in 1996, while ‘Liepsna’ was bred in 1957. This assumes that ‘Liepsna’ encountered more random crossbreeds and stronger gene flow interactions over the years.
Table 4.
Genetic diversity of red clover populations based on ISSR analysis.
Nei’s genetic diversity (h) varied from 0.2233 (pop2868) to 0.3008 (pop2887) within populations. The highest Shannon index value (I = 0.4476) was also identified in population pop2887. As a result, this population was dominated by the highest genetic diversity among individual plants. The opposite trend was found in the population pop2868, which had the lowest value of Shannon’s index (I = 0.2233). Therefore, pop2868 was more homogeneous than the rest of the populations, and consequently, the richness of genetic diversity was lower. Osterman et al. (2021) revealed similar results, while analysing Nordic red clover populations. According to Osterman et al. (2021), the percentage of polymorphic loci ranged from 48.2% to 75.9%, but on average, 64.2% [35].
3.3. Genetic Diversity among Populations
Nei’s genetic distances were calculated to assess the phylogenetic relationship among populations (Table 5) [43]. Meanwhile, UPGMA was used to group populations into clusters and to draw a dendrogram. Nei’s genetic distances ranged from 0.041 (pop2887 and pop2879) to 0.141 (pop2875 and pop2870). Populations with the highest Nei’s genetic distance (pop2875 and pop2870) were the least related to all the other populations. Interestingly, pop2870 was very closely related to pop2902 (0.061) and the variety ‘Vytis’ (0.066) according to Nei’s genetic distance. However, pop2902 was closer to the varieties ‘Vytis’ and ‘Sadūnai’ (0.56). This suggests common affinity among varieties and populations (pop2870 and pop2902). However, it is difficult to tell whether those populations and varieties had a common ancestor or whether they had domesticated plants within populations.
Table 5.
Pairwise population matrix of Nei’s genetic distance of red clover.
UPGMA distinguished two main groups and a few subgroups with short genetic distances from each other. Subgroup IA comprised pop2867 and pop2870 (Figure 4). Those two populations were assigned to the phenotypic group of semiwilds and did not differ significantly by many of the analysed morphological traits among each other. The following subgroup was composed of two populations (pop2875 and pop2880) and denoted as IC on the UPGMA dendrogram. Neither population pop2875 nor pop2880 produced a second seed yield during the same season and were assigned to the wild phenotypic group.
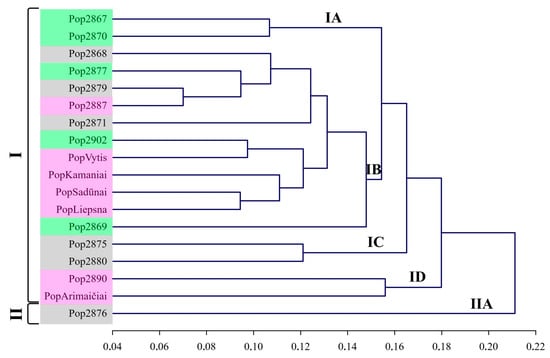
Figure 4.
UPGMA dendrogram of red clover populations based on Nei’s genetic distances. Notes: Phenological groups are denoted by Roman numerals, while numbers and letters denote subgroups; colour represents phenotypes according to morphological traits: pink—cultivars, grey—wilds, green—semiwilds.
The largest subgroup was denoted as IB and combined seven populations, as well as four Lithuanian-origin cultivars ‘Liepsna’, ‘Sadūnai’, ‘Kamaniai’, and ‘Vytis’. It is likely that during the breeding process of those Lithuanian-origin cultivars, genotypes of local wild populations could be used. Alternatively, those seven populations have been exposed to gene flow from cultivars.
The cultivar ‘Arimaičiai’ and pop2890 were assigned to subgroup ID. Pop2890 likely has been highly affected by gene flow from cultivars because morphological traits assigned this population to the cultivars’ phenotypic group. In addition, pop2890 stood out by having a higher 1000 seed weight than the other populations [44]. The wild-type phenotype characterised a separate group of population pop2876. Even though population pop2876 was not unique by its genetic diversity, it was distinguished among other populations by genetic distance. This suggests this population was isolated from random inbreeding with other populations and cultivars. As a result, inbreeding leads to an increase in homozygosity and lethal mutations [37].
PCA grouped all populations into two distinct groups (Figure 5). The component axes explained 28.25% of the variation from the data set and showed a partial overlap of these two groups. Resembling results were obtained by Kölliker et al. (2003). The only difference was that the researchers also distinguished a third group of semiwilds [45]. Although ISSR molecular markers allow us to separate cultivars from populations, they did not provide sufficient information on grouping populations into wild and semiwild populations. This may likely be due to interpopulation crossing, which leads to low genetic distances among cultivars and populations. Either reason may be the relatively small geographical distances between habitats of red clover populations [20]. Therefore, genotype sequencing for more accurate results should be used to analyse small site populations.
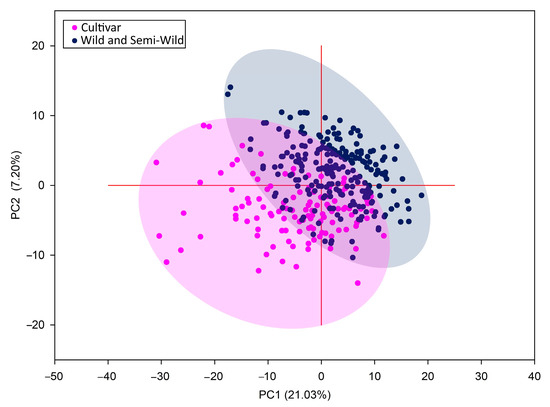
Figure 5.
Principal component analysis (PCA) of genetic diversity in red clover populations and cultivars.
Different opinions prevail among scientists about the relationship of genotypes with their geographical origin. It is likely that the populations analysed in our research were not highly isolated and did not maintain their genetic homogeneity. Therefore, red clover populations and cultivars of local origin were phylogenetically close to each other. Genetic differences mostly depended on the local isolation of populations by natural barriers and the farming type in natural habitats [46,47,48].
4. Conclusions
High genetic diversity was found within red clover populations and local varieties. Meanwhile, genetic distances among populations were low. A high affinity of local red clover varieties with wild populations was also found, especially with the oldest variety, ‘Liepsna’. This shows that there is an interpopulation crossbreeding between populations and cultivars. Moreover, the exchange of genetic information among red clover populations and cultivars is extensive in small site areas like Lithuania. As a result, high differentiation and high gene flow are dominant among populations.
Author Contributions
Conceptualization, G.P. and E.N.; methodology, G.P. and E.N.; software, G.P.; validation, G.P., E.N. and L.B.-H.; formal analysis, G.P.; investigation, G.P.; resources, G.P. and E.N.; data curation, E.N.; writing—original draft preparation, G.P.; writing—review and editing, G.P., E.N. and L.B.-H.; visualization, G.P. All authors have read and agreed to the published version of the manuscript.
Funding
This study was funded by the Lithuanian Research Centre for Agriculture and Forestry’s long-term research program “Genetic determination of the traits of agricultural and forest plants, development of modern cultivars” no. V-585.
Data Availability Statement
Not applicable.
Acknowledgments
The authors would like to Thank the staff of the Laboratory of Genetics and Physiology and the Department of Grass Breeding of LAMMC.
Conflicts of Interest
The authors declare no conflict of interest.
Appendix A
Table A1.
Origin, sampling size, population code and location of Trifolium pratense L. populations and cultivars.
Table A1.
Origin, sampling size, population code and location of Trifolium pratense L. populations and cultivars.
| Pop. Code | Pop. Size., No | Origin | Latitude (N) | Longitude (E) |
|---|---|---|---|---|
| ‘Arimaičiai’ | 23 | Variety (LT) | – | – |
| ‘Kamaniai’ | 16 | Variety (LT) | – | – |
| ‘Liepsna’ | 18 | Variety (LT) | – | – |
| ‘Sadūnai’ | 20 | Variety (LT) | – | – |
| ‘Vytis’ | 15 | Variety (LT) | – | – |
| pop2867 | 18 | Raseiniai distr., Maslauskiškiai. | 55.36811° | 23.32267° |
| pop2868 | 24 | Šilalė distr., Karūziškės II, Medvėgalis mound. | 55.62802° | 22.39114° |
| pop2869 | 22 | Šilalė distr., Paršežeris. | 55.64130° | 22.30454° |
| pop2870 | 20 | Telšiai distr., Mažieji Burbiškiai, Moteraitis mound. | 55.76428° | 22.49596° |
| pop2871 | 18 | Jurbarkas distr., Greičiai. | 55.05878° | 22.64937° |
| pop2875 | 21 | Telšiai distr., Šatrija mound. | 55.87134° | 22.55596° |
| pop2876 | 18 | Telšiai distr., Badmakiai. | 55.96160° | 22.52041° |
| pop2877 | 15 | Kėdainiai distr., Čystapolis. | 55.47403° | 23.66135° |
| pop2879 | 16 | ,Panevėžya distr., Butrimoniai. | 55.49606° | 24.12171° |
| pop2880 | 22 | Panevėžiys distr., Vadatkėliai. | 55.64402° | 24.12658° |
| pop2887 | 17 | Population from plant gene bank. | – | – |
| pop2890 | 14 | Population from plant gene bank. | – | – |
| pop2902 | 22 | Lazdijai distr., Veisiejai region park. | 54.12698° | 23.66182° |

Figure A1.
A few examples of phenotypic diversity of analysed red clover populations: (a) differences in flowering time; (b) differences in stem coloration; (c) double flower heads; (d) differences in flowers coloration.
Figure A1.
A few examples of phenotypic diversity of analysed red clover populations: (a) differences in flowering time; (b) differences in stem coloration; (c) double flower heads; (d) differences in flowers coloration.

References
- Dluhošová, J.; Ištvánek, J.; Nedělník, J.; Řepková, J. Red clover (Trifolium pratense) and Zigzag clover (T. medium)—A picture of genomic similarities and differences. Front. Plant Sci. 2018, 9, 724. [Google Scholar] [CrossRef] [PubMed]
- Casler, M.D.; Undersander, D.J. Identification of Temperate Pasture Grasses and Legumes, in Horse Pasture Management; Elsevier: Amsterdam, The Netherlands, 2019; pp. 11–35. [Google Scholar]
- Lizarazo, C.I.; Tuulos, A.; Jokela, V.; Mäkelä, P.S.A. Sustainable mixed cropping systems for the boreal-nemoral region. Front. Sustain. Food Syst. 2020, 4, 103. [Google Scholar] [CrossRef]
- Gillet, J.M. Taxonomy and morphology. In Clover Science and Technology; Taylor, N.L., Ed.; American Society of Agronomy: Madison, WI, USA, 1985; Volume 25, pp. 7–69. [Google Scholar]
- Taylor, N.L.; Quesenberry, K.H. Red Clover Science; Kluwer Academic Publishers: Dordrecht, The Netherlands, 1996; 226p, ISBN 978-0-7923-3887-1. [Google Scholar]
- Brewbaker, J.L.; Carnahan, H.L. Leaf marking alleles in white clover: Uniform nomenclature. J. Hered. 1956, 47, 103–104. [Google Scholar] [CrossRef]
- Bortnem, R.; Boe, A. Frequency of the No Mark Leaflet Allele in Red Clover. Crop Sci. 2002, 42, 634–636. [Google Scholar] [CrossRef]
- Tashiro, R.M.; Han, Y.; Monteros, M.J.; Bouton, J.H.; Parrott, W.A. Leaf trait coloration in white clover and molecular mapping of the red midrib and leaflet number traits. Crop Sci. 2010, 50, 1260–1268. [Google Scholar] [CrossRef]
- Ergon, A.; Bakken, A.K. Breeding for intercropping: The case of red clover persistence in grasslands. Euphytica 2022, 218, 98. [Google Scholar] [CrossRef]
- McKenna, P.; Cannon, N.; Conway, J.; Dooley, J. The use of red clover (Trifolium pratense) in soil fertility-building: A review. F. Crop. Res. 2018, 221, 38–49. [Google Scholar] [CrossRef]
- Schipanski, M.E.; Drinkwater, L.E. Nitrogen fixation of red clover interseeded with winter cereals across a management-induced fertility gradient. Nutr. Cycl. Agroecosystems 2011, 90, 105–119. [Google Scholar] [CrossRef]
- De Vega, J.; Ayling, S.; Hegarty, M.; Kudrna, D.; Goicoechea, J.L.; Ergon, Å; Rognli, O.A.; Jones, C.; Swain, M.; Geurts, R.; et al. Red clover (Trifolium pratense L.) draft genome provides a platform for trait improvement. Sci. Rep. 2015, 5, 17394. [Google Scholar] [CrossRef] [PubMed]
- Egan, L.M.; Hofmann, R.W.; Ghamkhar, K.; Hoyos-Villegas, V. Prospects for trifolium improvement through germplasm characterisation and pre-breeding in New Zealand and Beyond. Front. Plant Sci. 2021, 12, 653191. [Google Scholar] [CrossRef]
- Dabkevičienė, G.; Statkevičiūtė, G.; Mikaliūnienė, J.; Norkevičienė, E.; Kemešytė, V. Production of Trifolium pratense L. and T. hybridum L. tetraploid populations and assessment of their agrobiological characteristics. Zemdirb.-Agric. 2016, 103, 377–384. [Google Scholar] [CrossRef]
- Rauf, S. Induced polyploidy: A tool for forage species improvement. Agriculture 2021, 11, 210. [Google Scholar] [CrossRef]
- Jakubczyk, K.; Łukomska, A.; Gutowska, I.; Kochman, J.; Janił, J.; Janda, K. Edible flowers extracts as a source of bio-active compounds with antioxidant properties—In vitro studies. Appl. Sci. 2021, 11, 2120. [Google Scholar] [CrossRef]
- Jing, S.; Kryger, P.; Markussen, B.; Boelt, B. Pollination and plant reproductive success of two ploidy levels in red clover (Trifolium pratense L.). Front. Plant Sci. 2021, 12, 720069. [Google Scholar] [CrossRef]
- Solberg, S.O.; Yndgaard, F.; Palmè, A. Morphological and phenological consequences of ex situ conservation of natural populations of red clover (Trifolium pratense L.). Plant Genet. Resour. 2017, 15, 97–108. [Google Scholar] [CrossRef]
- Cardinale, B.J. Biodiversity loss and its impact on humanity. Nature 2012, 486, 59–67. [Google Scholar] [CrossRef]
- Jones, C. Population structure and genetic diversity in red clover (Trifolium pratense L.) germplasm. Sci. Rep. 2020, 10, 8364. [Google Scholar] [CrossRef]
- Egan, L.M.; Hofmann, R.W.; Ghamkhar, K.; Hoyos-Villegas, V. Identification of founding accessions and patterns of relatedness and inbreeding derived from historical pedigree data in a red clover germplasm collection in New Zealand. Crop Sci. 2019, 59, 2100–2108. [Google Scholar] [CrossRef]
- Walisch, T.J.; Colling, G.; Poncelet, M.; Matthies, D. Effects of inbreeding and interpopulation crosses on performance and plasticity of two generations of offspring of a declining grassland plant. Am. J. Bot. 2012, 99, 1300–1313. [Google Scholar] [CrossRef]
- Petrauskas, G.; Stukonis, V.; Norkevičienė, E. Defining a phenotypic variability and productivity in wild type red clover germplasm. J. Agric. Sci. 2020, 12, 52–61. [Google Scholar] [CrossRef]
- Doyle, J.J.; Doyle, J.L.; Doyle, J.A.; Doyle, J.K. A rapid total DNA preparation procedure for fresh plant tissue. Focus 1990, 12, 3–15. [Google Scholar]
- Paplauskienė, V.; Dabkevičienė, G. Genetic variability determination using ISSR-PCR markers in red clover varieties. Biologija 2008, 54, 56–59. [Google Scholar] [CrossRef]
- Paplauskienė, V.; Dabkevičienė, G.; Pašakinskienė, I. Molecular characterization of interspecific clover hybrids using ISSR markers. Zemdirb.-Agric. 2007, 94, 111–119. [Google Scholar]
- The Data Analysis for This Paper Was Generated Using SAS Software; Version [9.4] for Windows; SAS Institute Inc.: Cary, NC, USA, 2017.
- Kopelman, N.M.; Mayzel, J.; Jakobsson, M.; Rosenberg, N.A.; Mayrose, I. Clumpak: A program for identifying clustering modes and packaging population structure inferences across K. Mol. Ecol. Resour. 2015, 15, 1179–1191. [Google Scholar] [CrossRef]
- Nagylaki, T. Fixation indices in subdivided populations. Genetics 1998, 148, 1325–1332. [Google Scholar] [CrossRef] [PubMed]
- Khan, M.M.H.; Rafii, M.Y.; Ramlee, S.I. DNA fingerprinting, fixation-index (Fst), and admixture mapping of selected Bambara groundnut (Vigna subterranea [L.] Verdc.) accessions using ISSR markers system. Sci. Rep. 2021, 11, 14527. [Google Scholar] [CrossRef] [PubMed]
- Botstein, D.; White, R.L.; Skolnick, M.; Davis, R.W. Construction of a genetic linkage map in man using restriction fragment length polymorphisms. Am. J. Hum. Genet. 1980, 32, 314–331. [Google Scholar]
- Serrote, C.M.L. Determining the polymorphism information content of a molecular marker. Gene 2020, 726, 144175. [Google Scholar] [CrossRef]
- Gholami, S.; Vafaee, Y.; Nazari, F.; Ghorbani, A. Molecular characterization of endangered Iranian terrestrial orchids using ISSR markers and association with floral and tuber-related phenotypic traits. Physiol. Mol. Biol. Plants 2021, 27, 53–68. [Google Scholar] [CrossRef]
- Ulloa, O.; Ortega, F.; Campos, H. Analysis of genetic diversity in red clover (Trifolium pratense L.) breeding populations as revealed by RAPD genetic markers. Genome 2003, 46, 529–535. [Google Scholar] [CrossRef]
- Osterman, J.; Hammenhag, C.; Ortiz, R.; Geleta, M. Insights into the genetic diversity of Nordic red clover (Trifolium pratense) revealed by SeqSNP-based genic markers. Front. Plant Sci. 2021, 12, 748750. [Google Scholar] [CrossRef]
- Vleugels, T.; Amdahl, H.; Roldán-Ruiz, I.; Cnops, G. Factors underlying seed yield in red clover: Review of current knowledge and perspectives. Agronomy 2019, 9, 829. [Google Scholar] [CrossRef]
- Fernández-Otero, C.I.; Ramos-Cabrer, A.M.; López-Díaz, J.E.; Pereira-Lorenzo, S. Evaluating the diversity of ecotypes of red clover (Trifolium pratense L.) from Northwestern Spain by phenotypic traits and microsatellites. Agronomy 2021, 11, 2275. [Google Scholar] [CrossRef]
- Curnow, R.N.; Wright, S. Evolution and the genetics of populations. Variability within and among Natural Populations; University of Chicago Press: Chicago, IL, USA, 1978; Volume 4. [Google Scholar] [CrossRef]
- Wright, S. Evolution in mendelian populations. Genetics 1931, 16, 97–159. [Google Scholar] [CrossRef]
- Gupta, M.; Sharma, V.; Singh, S.K.; Chahota, R.K.; Sharma, T.R. Analysis of genetic diversity and structure in a gene bank collection of red clover (Trifolium pratense L.) using SSR markers. Plant Genet. Resour. 2017, 15, 376–379. [Google Scholar] [CrossRef]
- Shi, J.; Joshi, J.; Tielbörger, K.; Verhoeven, K.J.F.; Macel, M. Costs and benefits of admixture between foreign genotypes and local populations in the field. Ecol. Evol. 2018, 8, 3675–3684. [Google Scholar] [CrossRef]
- Hou, Y.; Lou, A. Population genetic diversity and structure of a naturally isolated plant species, Rhodiola dumulosa (Crassulaceae). PLoS ONE 2011, 6, e24497. [Google Scholar] [CrossRef] [PubMed]
- Nei, M. Genetic distance between populations. Am. Nat. 1972, 106, 283–292. [Google Scholar] [CrossRef]
- Petrauskas, G.; Norkevičienė, E.; Stukonis, V.; Kemešytė, V. Phenotypic traits for wild red clover seed yield under drought conditions. Czech. J. Genet. Plant Breed. 2020, 56, 140–149. [Google Scholar] [CrossRef]
- Kölliker, R.; Herrmann, D.; Boller, B.; Widmer, F. Swiss mattenklee landraces, a distinct and diverse genetic resource of red clover (Trifolium pratense L.). Theor. Appl. Genet. 2003, 107, 306–315. [Google Scholar] [CrossRef] [PubMed]
- Collins, R.P.; Helgadóttir, A.; Frankow-Lindberg, B.E.; Skøt, L.; Jones, C.; Skøt, K.P. Temporal changes in population genetic diversity and structure in red and white clover grown in three contrasting environments in northern Europe. Ann. Bot. 2012, 110, 1341–1350. [Google Scholar] [CrossRef] [PubMed]
- Osterman, J.; Hammenhag, C.; Ortiz, R.; Geleta, M. Discovering candidate SNPs for resilience breeding of red clover. Front. Plant Sci. 2021, 13, 997860. [Google Scholar] [CrossRef] [PubMed]
- Zanotto, S. Trait characterization of genetic resources reveals useful variation for the improvement of cultivated Nordic red clover. J. Agron. Crop Sci. 2021, 207, 492–503. [Google Scholar] [CrossRef]


Disclaimer/Publisher’s Note: The statements, opinions and data contained in all publications are solely those of the individual author(s) and contributor(s) and not of MDPI and/or the editor(s). MDPI and/or the editor(s) disclaim responsibility for any injury to people or property resulting from any ideas, methods, instructions or products referred to in the content. |
© 2023 by the authors. Licensee MDPI, Basel, Switzerland. This article is an open access article distributed under the terms and conditions of the Creative Commons Attribution (CC BY) license (https://creativecommons.org/licenses/by/4.0/).