Abstract
(1) Background: Vermicompost is enriched with plant essential nutrients and has been shown to suppress the incidence of pests; however, its potential is affected by its food sources. (2) Methods: Earthworms were fed cabbage or pig manure to produce two vermicomposts enriched in sulfur and nutrients, respectively. A pot experiment and a feeding experiment were then conducted to determine whether the application of the vermicomposts and sulfur could increase soil fertility, promote the growth of Brassica chinensis L., and inhibit the growth of Spodoptera litura Fabricius larvae. (3) Results: The characteristics of the vermicomposts were mainly affected by the food sources, and vermicomposted cabbage was found to have a higher sulfur content than vermicomposted pig manure. The application of the vermicomposts enhanced the concentrations of organic matter and available phosphorus, as well as the exchange concentrations of potassium, cadmium, and magnesium in the soil. Moreover, the growth of and the accumulated phosphorus and sulfur in the B. chinensis L. samples significantly increased when the plants were grown in soils treated with the two vermicomposts. Hence, the addition of vermicomposted cabbage and sulfur fertilizers can decrease the relative growth rate, total consumption, efficiency of conversion of ingested food, and relative consumption rate of S. litura larvae, possibly due to the increase in leaf sulfur concentration.
1. Introduction
Large amounts of agricultural waste are produced by the agricultural activities that are required to meet the needs of the increasing human population. Agricultural waste can be converted into vermicompost (VC) when earthworms and microorganisms cooperate, and, due to the lower temperatures at which vermicomposting takes place, there is generally a greater amount and diversity of microorganisms present during vermicomposting than during composting [1]. Given that higher macronutrient concentrations have been reported in VC compared with compost [2,3], it is not surprising that the application of VC has been demonstrated to preserve and restore soil quality and plant growth [4,5,6]. In addition to a beneficial effect on plant yield, a number of studies have also reported that VC application induces biological resistance in plants against diseases and pests due to the presence of actinomycetes and antibiotics [7,8,9]. A meta-analysis conducted by Blouin et al. [10] found that the application of VC enhances commercial crop production, total biomass, shoot biomass, and root biomass by 26%, 13%, 78%, and 57%, respectively. Furthermore, VC has potential as an environmentally friendly alternative for the control of pests and diseases. Many chemicals used in conventional agriculture to suppress pests and diseases have been shown to decrease the population of beneficial soil organisms and to have negative effects on environmental quality [11]. Therefore, the development of environmentally friendly alternatives, such as VC, is crucial.
Vermicomposting is a degradation process mediated by interactions between earthworms and microorganisms that results in the conversion of organic matter (OM) into VC. Only 5–10% of the OM is metabolized by the earthworms during this process; consequently, VCs have a high OM content [12]. Many studies have demonstrated that the application of VC can enhance aggregate stability and aeration [13,14,15], improve soil quality, and promote plant growth [4,5,6]. Since vermicomposting is conducted at ambient temperature, the VC microbial population is richer than that of the raw material [16] and can include nitrogen-fixing bacteria, phosphorus-solubilizing bacteria, mycorrhizal fungi, and actinomycetes [4,17]. This enriched microbial population has led to VC being used as a biological control material to suppress pests, parasitic nematodes, and many diseases [18,19]. The possible mechanisms employed to suppress pest attacks include the release of phenolic and toxic substances, an increase in the number and diversity of active microbes and pathogenic nematodes, and an increase in the availability of nutrients [11,20]. In addition, it has been reported that Brassicaceae family members utilize sulfur (S) to synthesize glucosinolate and suppress the growth of many insects [21,22]. Field and greenhouse experiments have also demonstrated that the application of VC significantly reduced pest damage to tomato and cucumber plants [23].
According to the experimental results of our previous study [24], the characteristics of VC are affected by food supplements, and amendments to VC can improve soil fertility and the growth of pak choi (Brassica chinensis L.). Moreover, increasing the soil and leaf S content can decrease the relative growth rate (RGR) of tobacco cutworm (Spodoptera litura) larvae. Therefore, in this study, and in accordance with the experimental results of Fong et al. [24], two VCs were selected and then applied to the soil used to grow pak choi. The leaves of mature pak choi were infested with S. litura larvae to assess the suppressive potential of the two VCs using four nutritional indexes. The objectives of this study included assessing (I) the effect of the VCs on soil fertility and pak choi growth, and (II) the influence of the different VC and S treatments on the secondary metabolite content, antioxidant capacity, and resistance to S. litura larvae of pak choi.
2. Materials and Methods
2.1. VC, Crop, Soil, and Larvae
A combination of two species of epigeic earthworms, red wiggler (Eisenia andrei or Eisenia foetida) and Indian blue worm (Perionyx excavates), were used in this study. Used shiitake mushroom sawdust was used as the primary medium for the growth of the earthworms, and they were fed either pig manure or cabbage. In total, 5.0 kg of used shiitake mushroom sawdust was placed in an opaque rectangular polypropylene box (L 47 cm × W 33 cm × H 18 cm), the moisture content was adjusted to 70–75% by adding deionized water (DI water), and 0.5 kg of earthworms was added. The top of each box was covered with a 32-mesh nylon net to avoid both the escape of earthworms and predation by animals. After one week of incubation, 50 g of fresh pig manure or cabbage was added every two days, and residual food was removed if necessary. The moisture content during vermicomposting was adjusted to 70–75% by weighing the box and adding DI water every two to three days. The supply of food and DI water was stopped on day 53, and the VCs produced were collected seven days later. The VC produced by feeding the earthworms pig manure was termed VPM, and the VC produced by feeding the earthworms cabbage was termed VCM. The two VCs were air-dried and then used in the S treatment and pot experiments described in Section 2.2 and Section 2.3, respectively.
Pak choi (Brassica chinensis L. var. Chinensis), a leafy vegetable commonly found in Taiwanese markets and whose leaf is usually consumed by S. litura larvae, was used as the target crop. The surface layer (0–30 cm) of an important soil series, Erhlin, located in central Taiwan, was selected as the study soil. Soil samples were air-dried, ground, sieved with a 5-mesh stainless sieve, and then used in the pot experiment. Second-instar S. litura larvae were bought from the Taiwan Agricultural Chemicals and Toxic Substances Institute, and third-instar S. litura larvae were used in the infesting experiments. Two separate experiments, the details of which are given in Section 2.2 and Section 2.3, were conducted, and the recommended doses (RDs) of nitrogen (N), phosphoric oxide (P2O5), and potassium oxide (K2O) for pak choi recommended by the Agriculture and Food Agency of the Council of Agriculture were 250, 150, and 180 kg ha−1, respectively.
2.2. Sulfur Treatment Experiment
VPM and VCM were selected because in previous experiments they were found to be the best promoter of pak choi growth and to have the highest content of S, respectively [24]. Higher amounts of S fertilizer and VC were applied in this experiment compared to previous experiments to increase the S content in the soil and in the pak choi, and their effect on decreasing the nutritional indexes of S. litura larvae was assessed. The following nine treatments were tested with four replicates each: CK (control): no amendments; CF (1×): chemical fertilizers CO(NH2)2, Ca(H2PO4)2·H2O, and KCl at the RDs; CF (1.5×): the same chemical fertilizers as CF (1×) at 1.5 times the RDs; CF + S (1×): ammonium sulfate ((NH4)2SO4), Ca(H2PO4)2·H2O, and KCl at the RDs; CF + S (1.5×): the same chemical fertilizers as CF + S (1×) at 1.5 times the RDs; VPM (1×); VPM (1.5×); VCM (1×); and VCM (1.5×). Unlike chemical fertilizers, VC has to be mineralized to release inorganic N so that it can be taken up by plants. Therefore, in the VPM (1×), VPM (1.5×), VCM (1×), and VCM (1.5×) treatments, VC was added at 2.5 times (1×) or 3.75 times (1.5×) the RD for N according to the N content of the two VCs.
2.3. Pot Experiment
The sieved soil samples prepared as outlined in Section 2.1 were homogeneously mixed with the different chemical fertilizers or VCs prepared as described in Section 2.2, and then 1.0 kg of mixture was added to each pot. The pot experiment was conducted in a growth chamber (14 h of light, temperature of 25.16 ± 1.66 °C, and relative humidity of 60.83 ± 17.17%) and 30 pak choi seeds were sown in each pot. The soil moisture during the pot experiment was controlled at 50–70% of the water-holding capacity by weighing and adding DI water every two to three days. Only five pak choi seedlings with similar shoot heights were left for seven days after germination and the others were removed.
For the infesting experiment (described in Section 2.1), two pak choi plants from each treatment were randomly selected and two separate sub-experiments were conducted. In the first sub-experiment, one of the pak choi replicates was infested with four third-instar S. litura larvae for one week, and the whole pak choi was covered with 32-mesh nylon during the experiment. In the second sub-experiment, three third-instar S. litura larvae were placed on individual Petri dishes and fed with the third and fourth leaves of the second pak choi replicate. The leaves were first washed with DI water, and the stems were placed in 2 mL centrifuge tubes, which were then filled with DI water and sealed with paraffin film. The second sub-experiment lasted for one week with four replicates, and the pak choi leaf was renewed every two days.
After growing for seven weeks, the shoots of the pak choi grown with the different treatments were harvested and washed with tap water and DI water, and then shoot height and fresh weight were determined. The relative chlorophyll content (i.e., the SPAD reading) of the most extended leaf of each pak choi replicate was determined using a chlorophyll meter (SPAD-502, Konica Minolta, Osaka, Japan). Plant tissues were oven-dried at 70 °C for 72 h or freeze-dried for 48 h in preparation for the property analyses.
2.4. VC, Soil, Plant, and Larvae Analyses
The moisture content, pH (w/v = 1/5) [25], electrical conductivity (EC; w/v = 1/5) [26], total nitrogen content (TN) [27], and OM [28] of the two VCs were analyzed. In addition, each VC was digested with nitric acid and perchloric acid (v/v = 4/1) [29], filtered through Whatman No. 42 filter paper, and quantitated. The P concentration in the filtered digestants was determined in accordance with Murphy and Riley [30]. The K and S concentrations in the filtered digestants were determined with a flame photometer (Sherwood 410, Sherwood Scientific Ltd., Cambridge, UK) and an ion chromatography system (930 Compact IC Flex, Metrohm, Herisau, Switzerland), respectively. The concentrations of calcium (Ca) and magnesium (Mg) in the digestants were determined using an atomic absorption spectrometer (Z-2000, Hitachi, Tokyo, Japan), and the cadmium (Cd), chromium (Cr), copper (Cu), nickel (Ni), lead (Pb), and zinc (Zn) concentrations in the digestants were determined using an inductively coupled plasma atomic emission spectrometer (ICP-OES Avio 200, Perkin Elmer, MA, USA).
Soil samples were collected after the pot experiment, air-dried, ground, and passed through 10-mesh or 80-mesh sieves according to the properties analyzed. The pH, EC, and OM of the soil samples were analyzed using the methods described above. Other properties analyzed included: concentrations of available N [30], available P [31], and available S [32]; exchangeable concentrations of K, Ca, and Mg [33]; and wet aggregate stability (WAS) [34]. The oven-dried plant tissue was ground, digested with nitric acid and perchloric acid (v/v = 4/1) [29], filtered through Whatman No. 42 filter paper, and quantitated. The concentrations of N, P, K, Ca, Mg, and S in the filtered digestant were then determined using the method outlined above. The freeze-dried plant tissue was used to determine the 1,1-diphenyl-2-picrylhydrazyl (DPPH) free radical scavenging ability and the concentrations of total phenolics and total flavonoids in accordance with Hatano et al. [35].
In the sulfur treatment experiment described in Section 2.2, the nutritional indexes used by Farrar et al. [36] and Nawaz et al. [37] were calculated using Equations (1)–(4) to identify the effect of the treatments on the suppression of S. litura larval growth.
2.5. Statistical Analysis
Statistical analysis was performed using the Statistical Analysis System (SAS) v9.4 software. A one-way analysis of variance (ANOVA) was performed using a generalized linear model (GLM) across the treatments. Fisher’s protected least significant difference (LSD) test was used to identify significant differences between means, and p < 0.05 denoted statistical significance.
3. Results and Discussion
3.1. The Properties of the Two VCs
The basic properties of the two VCs used in this study are shown in Table 1. Relative to VPM, VCM had a higher pH value, which possibly resulted from the difference in the food source and OM mineralization rate. The release of organic acids (i.e., fulvic acid and humic acid) during the degradation of OM can decrease the pH value [38]; however, the pH of VC increases when salts are released during the degradation of OM [39]. Huang et al. [5] reported that more leachate was produced by earthworms when the food had a high water content. Therefore, the lower EC of VCM compared to that of VPM possibly resulted from cabbage having a higher water content than pig manure, which may have led to more soluble salts leaching out of VCM during vermicomposting. The OM content of VPM and VCM was 68.3% and 70.2%, respectively, and the C/N ratio for both was between 16 and 24. The C/N ratio was regressed as an important index in the assessment of compost maturation and quality [40]. Immobilization is preferred, and a N depression period might have occurred during the degradation of the OM when material with a high C/N ratio was applied [39].

Table 1.
The characteristics 1 of two vermicomposts 2.
Compared to VCM, VPM had higher concentrations of total N and P2O5. In agreement with the findings of Fahey et al. [41], the S content of VCM (0.51%) was higher than that of VPM (0.33%). Cd, Cu, Ni, and Pb were not detectable in the two VCs. Cr and Zn were detected in the two VCs at concentrations of <1 mg kg−1 and 10–12 mg kg−1, respectively.
3.2. Sulfur Treatment
3.2.1. The Effect of Sulfur on Soil Properties
The eight additive treatments resulted in a significantly lower soil pH (p < 0.05) than the CK treatment, especially the two CF + S treatments; however, all the pH values were in the alkaline range (Table 2). This was due to sulfate ammonium being used to supply N and S in the CF + S treatment and H+ being secreted by roots and produced during nitrification. In agreement with the results described above, soils amended with VPM and VCM had a lower pH than the CK soil, which was possibly due to the release of organic acids during VC degradation [38,42]. Relative to the CK soil, soils amended with the other eight treatments had significantly (p < 0.05) higher EC, particularly those that received the two CF + S treatments, which reached 19–31 mS m−1. This phenomenon was possibly the result of the chemical fertilizer treatments having higher NH4+, SO42−, K+, and Cl− contents. Moreover, the additional H+ ions in the CF + S treatments (which resulted in the low pH values) possibly acted as exchangeable cations, replacing the exchangeable sites of the soil and thus increasing the EC. As the two VCs were 68–71% OM (Table 1), the addition of different amounts of the two VCs significantly increased the soil OM content from 2.7% (CK treatment) to 3.7–5.0% (p < 0.05). High soil OM content is helpful in increasing crop yield; for example, the humic acid released during VC degradation has been shown to promote crop growth and yield [43,44]. The enhancing effect of VC on WAS [13,14,15] was not observed in this study because the pot experiment was conducted for only a short period of seven weeks.
Table 2.
The soil properties 1 after the pot experiment, in which soil was subjected to different treatments 2.
At the end of the pot experiment, the concentration of available N was higher or significantly higher in the soils amended with the CF (1.5×) and CF + S (1.5×) treatments than in the CK soil (p < 0.05) (Table 2). This might have been due to a faster release rate and the higher amount of fertilizer applied. The concentration of available P significantly increased from 6.6–8.0 mg kg−1 (CK treatment) to 14–50 mg kg−1 with the CF, CF + S, and two VC treatments (p < 0.05). As the two VCs were 1.4–2.5% P2O5 (Table 1), the concentration of available P was higher in soils treated with VPM and VCM than in soils treated with CF and CF + S. Among the nine treatments used, the concentration of available P was less than 10 mg kg−1 only in CK-treated soil; this is the level considered sufficient for plant growth [31]. As SO42− is released through the dissolution of applied (NH4)2SO4, the two CF + S treatments significantly increased the available S content in the soil from 1.8–5.0 mg kg−1 (CK and two CF treatments) to 107–225 mg kg−1 (p < 0.05). In agreement with the findings of Ramawtar et al. [45], the application of the two VCs increased the general available S content in the soil, which was the result of VC mineralization. The available S content in the soils amended with the two VCs was in the range of 2.6–9.6 mg kg−1. The concentrations of exchangeable K, exchangeable Ca, and exchangeable Mg were significantly higher in the soils treated with the two VCs compared with the CK soil (p < 0.05), which resulted from the high content of K2O, CaO, and MgO in the two VCs (Table 1). In soils treated with CK, CF, and CF + S, the mole ratio of exchangeable Ca to exchangeable Mg was 8.3–8.8, which is higher than the value recommended (6.0) for plant growth [46,47]. In soils treated with VPM (1×) and VCM (1×), the mole ratio decreased to a much more suitable level, 5.1–5.5, due to a significant increase in exchangeable Mg content.
3.2.2. The Effect of Sulfur on Pak choi Growth
Table 3 shows the effects of the nine treatments on different aspects of pak choi growth. It was found that the SPAD reading, shoot height, and fresh weight of pak choi increased or significantly increased after the CF, CF + S, and VC treatments compared to the CK treatment (p < 0.05). The pak choi grown in soil that received CF and CF + S treatments also exhibited generally better growth than those grown in soils with VC treatments. The supply of N in the soil has a drastic influence on the growth of short-term crops, and N could be readily released from the urea and (NH4)2SO4 present in the CF and CF + S treatments; however, organic N must be mineralized to inorganic N before uptake by plants. Of the two VCs used, the two VPM treatments resulted in better pak choi growth than the two VCM treatments, which was possibly due to the higher TN and P2O5 contents (Table 1) and the higher concentrations of other nutrients not analyzed in this study. As a result of the different foods used to produce VPM and VCM, the population of microorganisms and thus the mineralization rates were quite different [48], and this might help explain the experimental results.
Table 3.
The SPAD readings, shoot heights, and fresh weights of the Brassica chinensis samples grown in soils that received different treatments 1.
The concentrations of N, P, K, S, Mg, and Ca were determined in the leaves of pak choi plants grown in the treated soils. Only the N, P, K, and S concentrations were significantly higher in the leaves of pak choi grown in soil treated with CF, CF + S, and the two VCs compared to those grown in CK-treated soil (p < 0.05). The CF and CF + S treatments significantly increased the N and P concentrations to 1.8–4.2% and 0.32–0.56%, respectively, compared with CK treatment (p < 0.05) (Table 4). These results were due to the higher concentrations of available N and available P in the soils compared with the other treatments (Table 2). As the two VCs were 1.4–2.5% P2O5 and the concentration of available P after VC treatment was significantly higher than after CK, CF, and CF + S treatment, the pak choi P concentration also increased to 0.34–0.55% when the different VC treatments were applied. Regarding the S concentration, the leaves of pak choi grown in the soils treated with CF + S (1×), CF + S (1.5×), VCM (1×), and VCM (1.5×) had significantly higher S concentrations than leaves from plants grown in CK-treated soil (p < 0.05). The high concentrations of available S in the soil (Table 2) most likely contributed to the highest concentrations of S being recorded in the pak choi grown in soil treated with the two CF + S treatments (0.28–0.48%). The concentration of S in the pak choi grown in soil treated with the two VCM treatments also significantly increased from approximately 0.01–0.03% (CK treatment) to 0.05–0.08% (p < 0.05). Even though the infection of S litura induced an increase in S content in the leaves of pak choi under VCM treatments, the differences were not significant.
Table 4.
The concentrations of nitrogen, phosphorous, potassium, calcium, magnesium, and sulfur in the leaves of Brassica chinensis grown in soils that received different treatments 1.
The CF and CF + S treatments resulted in pak choi that had a higher DPPH free radical scavenging ability and total flavonoid content than the other treatments (Table 5); however, the additive treatments did not significantly influence total phenolic content compared with the CK treatment. Total flavonoid content increased from 7.7–12.4 mg-QE g-DW−1 in pak choi grown in CK-treated soil to 12.7–28.5 and 16.7–35.3 mg-QE g-DW−1 in pak choi grown in CF- and CF + S-treated soil, respectively. This was in contrast to the C–N balance theory [49] and the growth–differentiation balance hypothesis [50], which state that the application of N could inhibit the synthesis of C-containing secondary metabolites. In agreement with the results of previous studies [51,52], all treatments increased the DPPH free radical scavenging ability of pak choi to 58–88% compared with the 41–53% of pak choi grown in CK-treated soil.
Table 5.
The concentrations of total phenolics, total flavonoids, and DPPH scavenging ability in the leaves of Brassica chinensis grown in soils that received different treatments 1.
There were no statistically significant differences in the concentrations of the six essential elements assessed, the total phenolic content, the total flavonoid content, and the DPPH free radical scavenging ability of the pak choi infested with S. litura larvae compared with those not infested. Some plants can avoid being consumed by insects by lowering their nutrient concentrations [53]. The activation and strength of this defense mechanism have been determined not only by testing the saliva composition of insects [54,55] but also by detecting enzymes in insect saliva [56]. Here, infesting S. litura larvae did not significantly affect the antioxidant ability or secondary metabolite content of pak choi in general. Since pak choi grown in soil treated with VCM has a higher S content in its leaves (Table 4), another secondary metabolite, glucosinolate, might be responsible for the defense mechanism of pak choi [21].
3.2.3. The Effect of Sulfur on S. litura Larvae
The S. litura larvae that infested the pak choi grown in the soils treated with CF + S (1×), VCM (1×), and VCM (1.5×) treatments had significantly lower RGRs than those that infested the pak choi grown in the soils that received the other treatments, except for CK (p < 0.05) (Figure 1). This aligns with the findings presented in Section 3.2.2, which revealed that the CF + S and VCM treatments increased the S content in the leaves of pak choi and therefore inhibited the growth of S. litura larvae. The larval RGR decreased when the larvae were fed pak choi grown in soil that received the VCM treatments; the RGR was 10.4–11.3 mg mg−1 d−1 when the soil was treated with CF and 7.7–8.9 mg mg−1 d−1 when the soil was treated with VCM. Although the S could inhibit the growth of larvae and the CF + S (1.5×) treatment resulted in the highest S content in the leaves of pak choi among treatments, the resultant RGR was not the lowest. In addition to S, N might also have an influence on the RGR of S. litura larvae. The above phenomenon possibly resulted from the higher N content in the leaves resulting from the CF + S (1.5×) treatment, which may have promoted the growth of larvae, although the higher S content could have inhibited growth. Apart from the VCM (1×) and VCM (1.5×) treatments, the CK treatment also resulted in a lower RGR compared with other treatments. S. litura larvae require N-rich foods for growth [57,58]. Thus, the lower RGR associated with plants from CK-treated soil may have been due to the N content being insufficient to support S. litura larvae growth.
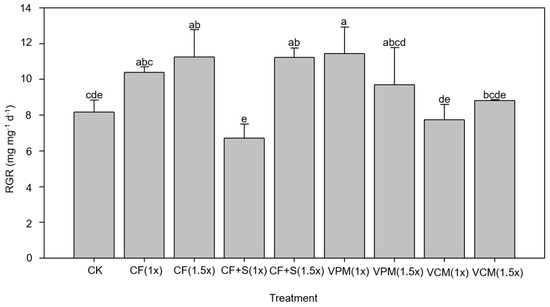
Figure 1.
The relative growth rate (RGR) of the Spodoptera litura larvae were assessed in the sulfur treatment test. (The meanings of the codes are the same as in Table 2. Means within a column followed by the same letter are not significantly different at p < 0.05.)
3.2.4. Short-Term Feeding Experiment
In addition to directly infesting pak choi with S. litura larvae, a short-term feeding experiment was conducted for one week, as described in Section 2.3. Three third-instar S. litura larvae were grown in individual Petri dishes and then fed two pak choi leaves from plants grown in soils that received different treatments with four replicates. After the one-week experiment, the TC, ECI, RGR, and RCR were calculated using the change in fresh weight of larvae and fresh weight of leaves determined during the experiment, using Equations (1)–(4) [58].
It was found that larvae fed with pak choi grown in soils treated with CK, VCM (1×), and VCM (1.5×) had lower or significantly lower (p < 0.05) TC and ECI compared to those fed with pak choi grown in soils that received other treatments (Figure 2). This possibly resulted from the higher leaf S content found in the plants grown in soils that received the two VCM treatments and the lower N content in the plants grown in CK-treated soil, as illustrated in Section 3.2.3. Although the highest S content was observed after the two CF + S treatments, the TC and ECI of the larvae fed the resulting leaves were not the lowest recorded. However, the TC resulting from the two CF + S treatments was lower than that resulting from the two CF treatments, which revealed that raising the S content in the feeding leaves of pak choi decreased larvae consumption. Nawaz et al. [37] recently showed that the ECI based on the dry weight of S. litura larvae fed okra was 30–60%, which was higher than that in this study and possibly resulted from the difference in the food source and in the experimental period.
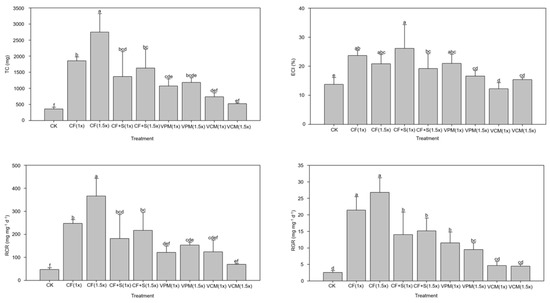
Figure 2.
The total consumption (TC), efficiency of conversion of ingested food (ECI), relative consumption rate (RCR), and relative growth rate (RGR) of Spodoptera litura larvae in the short-term feeding trial. (The meanings of the codes are the same as in Table 2. Means within a column followed by the same letters are not significantly different at p < 0.05.)
In addition to the TC and ECI, the RCR and RGR of larvae that were fed leaves from pak choi grown in soils treated with CK, VCM (1×), and VCM (1.5×) were generally lower than those resulting from other treatments (Figure 2). In agreement with the TC and ECI results, the CF + S (1×) and CF + S (1.5×) treatments significantly decreased the RCR and RGR compared with the CF (1×) and CF (1.5×) (p < 0.05) treatments. A previous study reported that the RCR and RGR of second-instar S. litura larvae fed cabbage and okra were 2–3 mg mg−1 d−1 and 0.6–0.9 mg mg−1 d−1, respectively [37]. The higher S. litura larval RGR, 3–25 mg mg−1 d−1, found in this study possibly resulted from the difference in the food source and the age of the larvae used.
3.2.5. The Potential of the VCs to Suppress the Growth of S. litura Larvae
The results presented in Section 3.2.3 and Section 3.2.4 show that S. litura larval growth was determined not only by the S content in the pak choi leaves but also by the N content. This finding is identical to those of previous studies [57,58]. A linear regression was developed using the total N taken up through the consumption of pak choi (x) and the corresponding fresh weight increase in S. litura larvae (y) for the non-S treatments (i.e., CK, CF, and VPM treatments) (Figure 3). The theoretical values for fresh weight increase in the S treatments (i.e., CF + S and VCM treatments) were obtained using the total N intake by the S. litura larvae and the regressing equation (y = 37.081x + 40.976). The actual values for fresh weight increase in the two CF + S and two VCM treatments were all 16–35% lower than the theoretical values. This revealed that the leaves of the pak choi grown in the S-treated soils (i.e., with CF + S and VCM treatments) had a higher S content, which decreased the food intake and growth of the S. litura larvae. High S content in Brassicaceae family members could promote glucosinolate synthesis and thus strengthen the defense against insects [21,22]; the experimental results of this study support this notion. Besides S, enrichment in the number and diversity of microorganisms [18,19] or the release of toxic substances from VC [11,20] may also have contributed to suppressing the growth of S. litura larvae; however, these mechanisms were not evidenced in this study using current data. Nevertheless, this study has demonstrated the potential of VCM for the suppression of S. litura larval growth.
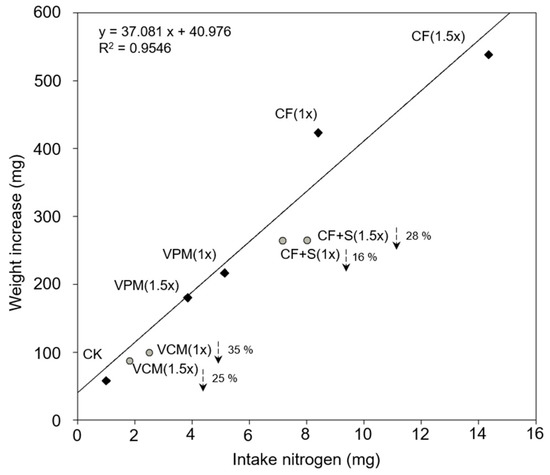
Figure 3.
The relationship between intake nitrogen weight (x) and weight increase (y) in Spodoptera litura larvae in the short-term feeding trial. (The meanings of the codes are the same as in Table 2.)
The CF treatment was included in this study because chemical fertilizers are commonly used in conventional agriculture, and the effects of the CF + S and two VC treatments were compared with those of the CF (1×) treatment. Different relative nutritional indexes were lower after the CF + S, VPM, and VCM treatments than after the CF treatment (Table 6). The two VCM treatments had significantly (p < 0.05) lower relative nutritional indexes among the CF, CF + S, and VC treatments, which possibly resulted from the higher S content in the leaves of the pak choi. Due to the low mobility of S in the plant, approximately 90–94% of S accumulates in the old leaves of plants [21]. Two major organic S-containing amino acids, cysteine and methionine, are synthesized using SO42− taken up from the soil and are affected by plant maturity [22]; therefore, the parts of the plant fed to the S. litura larvae might have also influenced their growth. In the short-term feeding experiment (Section 3.2.4), the third and fourth leaves of the pak choi were fed to the larvae; however, the entire plant was used as the food source in the infesting experiment (Section 3.2.3). Although the leaves consumed by the larvae might have been quite different, the results revealed that raising the S content in the leaves could restrict the growth of S. litura larvae.
Table 6.
The relative nutritional indexes 1,2 of Spodoptera litura larvae in the short-term feeding experiment.
4. Conclusions
Agricultural waste can be recycled into vermicompost through the interaction of earthworms and microorganisms. In this study, it has been shown that vermicompost properties can be determined by the food source and that adding vermicompost to soil increases soil fertility and pak choi growth. Moreover, it was found that adding vermicomposted cabbage reduces the growth indexes of S. litura larvae consuming pak choi, which is possibly due to the higher S content of vermicomposted cabbage and pak choi leaves. Although the potential of vermicomposted cabbage to reduce the growth of S. litura larvae was demonstrated in this study, the presence of parasites and pathogens which may affect human health was not considered in this study. Other mechanisms besides S content must be examined and confirmed in further studies.
Author Contributions
Conceptualization, C.-J.F. and H.-Y.L.; methodology, C.-J.F., Y.-Y.C. and H.-Y.L.; resources and project administration, H.-Y.L.; investigation, C.-J.F.; writing—original draft preparation, C.-J.F. and H.-Y.L.; writing—review and editing, H.-Y.L. All authors have read and agreed to the published version of the manuscript.
Funding
The authors would like to thank the Ministry of Science and Technology of the Republic of China for financially supporting this research under Contract No. MOST 110-2313-B-005-022 and the Ministry of Education of the Republic of China for partial support through the Higher Education Sprout Project.
Acknowledgments
We would like to thank the members of the Soil Survey and Remediation Laboratory in the Department of Soil and Environmental Sciences at National Chung Hsing University for their assistance during the pot experiments and analyses.
Conflicts of Interest
The authors declare no conflict of interest.
References
- Hernandez, T.; Chocano, C.; Moreno, J.L.; Garcia, C. Towards a more sustainable fertilization: Combined use of compost and inorganic fertilization for tomato cultivation. Agric. Ecosyst. Environ. 2014, 196, 178–184. [Google Scholar] [CrossRef]
- El-Haddad, M.E.; Zayed, M.S.; El-Sayed, G.A.; Abd EL-Satar, A.M. Efficiency of compost and vermicompost in supporting the growth and chemical constituents of salvia officinalis L. cultivated in sand soil. Int. J. Recycl. Org. Waste Agric. 2020, 9, 49–59. [Google Scholar]
- Joshi, T.N.; Nepali, D.B.; Sah, R.; Bhattarai, T.; Midmore, D.J. A comparison of composting and vermicomposting for the disposal of poultry waste. Anim. Prod. Sci. 2020, 60, 986–992. [Google Scholar] [CrossRef]
- Sinha, R.K. Earthworms: The miracle of nature (Charles Darwin’s ‘unheralded soldiers of mankind & farmer’s friends’). Environmentalist 2009, 29, 339. [Google Scholar]
- Huang, K.; Xia, H.; Cui, G.; Li, F. Effects of earthworms on nitrification and ammonia oxidizers in vermicomposting systems for recycling of fruit and vegetable wastes. Sci. Total Environ. 2017, 578, 337–345. [Google Scholar] [CrossRef] [PubMed] [Green Version]
- Sharma, K.; Garg, V.K. Comparative analysis of vermicompost quality produced from rice straw and paper waste employing earthworm Eisenia foetida (Sav.). Bioresour. Technol. 2018, 250, 708–715. [Google Scholar] [CrossRef] [PubMed]
- Arancon, N.Q.; Edwards, C.A.; Bierman, P.; Metzger, J.D.; Lucht, C. Effects of vermicomposts produced from cattle manure, food waste and paper waste on the growth and yield of peppers in the field. Pedobiologia 2005, 49, 297–306. [Google Scholar] [CrossRef]
- Edwards, C.A.; Arancon, N.; Greytak, S. Effects of vermicompost teas on plant growth and disease. Biocycle 2006, 47, 28–31. [Google Scholar]
- Munroe, G. Manual of on-Farm Vermicomposting and Vermiculture; Publication of Organic Agriculture Centre of Canada: Truro, NS, Canada, 2007. [Google Scholar]
- Blouin, M.; Barrere, J.; Meyer, N.; Lartigue, S.; Barot, S.; Mathieu, J. Vermicompost significantly affects plant growth. A meta-analysis. Agron. Sust. Dev. 2019, 39, 34. [Google Scholar] [CrossRef]
- Yatoo, A.M.; Ali, M.N.; Baba, Z.A.; Hassan, B. Sustainable management of diseases and pests in crops by vermicompost and vermicompost tea. A review. Agron. Sustain. Dev. 2021, 41, 7. [Google Scholar] [CrossRef]
- Edwards, C.A.; Dominguez, J. Biology and ecology of earthworm species used for vermicomposting. In Vermiculture Technology: Earthworms, Organic Waste and Environmental Management; Edwards, C.A., Arancon, N.Q., Sherman, R.L., Eds.; CRC Press Publishing: Boca Raton, FL, USA, 2010; pp. 25–37. [Google Scholar]
- Blouin, M.; Hodson, M.E.; Delgado, E.A.; Baker, G.; Brussaard, L.; Butt, K.R.; Dai, J.; Dendooven, L.; Peres, G.; Tondoh, J.E.; et al. A review of earthworm impact on soil function and ecosystem services. Eur. J. Soil Sci. 2013, 64, 161–182. [Google Scholar] [CrossRef]
- Zhu, F.; Hou, J.T.; Xue, S.G.; Wu, C.; Wang, Q.L.; Hartley, W. Vermicompost and gypsum amendments improve aggregate formation in bauxite residue. Land Degrad. Dev. 2017, 28, 2109–2120. [Google Scholar] [CrossRef] [Green Version]
- Liu, M.L.; Wang, C.; Wang, F.Y.; Xie, Y.J. Vermicompost and humic fertilizer improve coastal saline soil by regulating soil aggregates and the bacterial community. Arch. Agron. Soil Sci. 2019, 65, 281–293. [Google Scholar] [CrossRef]
- Domínguez, J.; Aira, M.; Gómez-Brandón, M. Vermicomposting: Earthworms enhance the work of microbes. In Microbes at Work; Insam, H., Franke-Whittle, I., Goberna, M., Eds.; Springer: Berlin/Heidelberg, Germany, 2010; pp. 93–114. [Google Scholar]
- Yatoo, A.M.; Rasool, S.; Ali, S.; Majid, S.; Rehman, M.U.; Ali, M.N.; Eachkoti, R.; Rasool, S.; Rashid, S.M.; Farooq, S. Vermicomposting: An ecofriendly approach for recycling/management of organic wastes. In Bioremediation and Biotechnology; Springer: Cham, Switerland, 2020; pp. 167–187. [Google Scholar]
- Edwards, C.A.; Subler, S. Comparison of vermicomposting and composting. Biocycle 1997, 38, 57–59. [Google Scholar]
- Basco, M.J.; Bisen, K.; Keswani, C.; Singh, H.B. Biological management of Fusarium wilt of tomato using biofortified vermicompost. Mycosphere 2017, 8, 467–483. [Google Scholar] [CrossRef]
- Sedaghatbaf, R.; Samih, M.A.; Zohdi, H.; Zarabi, M. Vermicomposts of different origins protect tomato plants against the sweetpotato whitefly. Econ. Entomol. 2018, 111, 146–153. [Google Scholar] [CrossRef]
- Falk, K.L.; Tokuhisa, J.G.; Gershenzon, J. The effect of sulfur nutrition on plant glucosinolate content: Physiology and molecular mechanisms. Plant Biol. 2007, 9, 573–581. [Google Scholar] [CrossRef]
- Ahuja, I.; Rohloff, J.; Bones, A.M. Defence mechanisms of Brassicaceae: Implications for plant-insect interactions and potential for integrated pest management. A review. Agron. Sustain. Dev. 2010, 30, 311–348. [Google Scholar] [CrossRef] [Green Version]
- Yardim, E.N.; Arancon, N.Q.; Edwards, C.A.; Oliver, T.J.; Byrne, R.J. Suppression of tomato hornworm (Manduca quinquemaculata) and cucumber beetles (Acalymma vittatum and Diabotrica undecimpunctata) populations and damage by vermicomposts. Pedobiologia 2006, 50, 23–29. [Google Scholar] [CrossRef]
- Fong, C.J.; Chuang, Y.Y.; Lai, H.Y. Effects of amendment with various vermicomposts on the soil fertility, growth of Brassica chinensis L., and resistance of Spodoptera litura Fabricius larvae. Sustainability 2021, 13, 9441. [Google Scholar] [CrossRef]
- Thomas, G.W. Soil pH and soil acidity. In Methods of Soil Analysis: Part 3, SSSA Book Series No. 5, SSSA and ASA; Sparks, D.L., Page, A.L., Helmke, P.A., Loeppert, R.H., Soltanpour, P.N., Tabatabai, M.A., Johnston, C.T., Sumner, M.E., Eds.; SSSA Inc.: Madison, WI, USA; ASA Inc.: Madison, WI, USA, 1996; pp. 475–490. [Google Scholar]
- Rhoades, J.D. Salinity: Electrical conductivity and total dissolved solids. In Methods of Soil Analysis. Part 3. Chemical Methods; Sparks, D.L., Page, A.L., Helmke, P.A., Loeppert, R.H., Soltanpour, P.N., Tabatabai, M.A., Johmston, C.T., Sumner, M.E., Eds.; SSSA Inc.: Madison, WI, USA; ASA Inc.: Madison, WI, USA, 1996; pp. 417–435. [Google Scholar]
- Bremner, J.M. Nitrogen-Total. In Methods of Soil Analysis. Part 3. Chemical Methods; Sparks, D.L., Page, A.L., Helmke, P.A., Loeppert, R.H., Soltanpour, P.N., Tabatabai, M.A., Johmston, C.T., Sumner, M.E., Eds.; SSSA Inc.: Madison, WI, USA; ASA Inc.: Madison, WI, USA, 1996; pp. 1085–1121. [Google Scholar]
- Nelson, D.W.; Sommers, L.E. Total carbon, organic carbon, and organic matter. In Methods of Soil Analysis. Part 3. Chemical Methods; Sparks, D.L., Page, A.L., Helmke, P.A., Loeppert, R.H., Soltanpour, P.N., Tabatabai, M.A., Johmston, C.T., Sumner, M.E., Eds.; SSSA Inc.: Madison, WI, USA; ASA Inc.: Madison, WI, USA, 1996; pp. 961–1010. [Google Scholar]
- Jones, J.B.; Case, V.W. Sampling, handling and analyzing plant tissue samples. In Soil Testing and Plant Analysis, 3rd ed.; Westerman, R.L., Ed.; SSSA Inc.: Madison, WI, USA, 1990; pp. 389–427. [Google Scholar]
- Murphy, J.; Riley, J.P. A modified single solution method for the determination of phosphate in natural waters. Anal. Chim. Acta 1962, 27, 31–36. [Google Scholar] [CrossRef]
- Sparks, D.L.; Page, A.L.; Helmke, P.A.; Loeppert, R.H.; Soltanpour, P.N.; Tabatabai, M.A.; Johmston, C.T.; Sumner, M.E. (Eds.) Methods of Soil Analysis. Part 3. Chemical Methods; SSSA Inc.: Madison, WI, USA; ASA Inc.: Madison, WI, USA, 1996; pp. 869–919. [Google Scholar]
- Tabatabai, M.A. Sulfur. In Methods of Soil Analysis. Part 3. Chemical Methods; Sparks, D.L., Page, A.L., Helmke, P.A., Loeppert, R.H., Soltanpour, P.N., Tabatabai, M.A., Johmston, C.T., Sumner, M.E., Eds.; SSSA Inc.: Madison, WI, USA; ASA Inc.: Madison, WI, USA, 1996; pp. 921–960. [Google Scholar]
- Sumner, M.E.; Miller, W.P. Cation exchange capacity and exchange coefficients. In Methods of Soil Analysis. Part 3. Chemical Methods; Sparks, D.L., Page, A.L., Helmke, P.A., Loeppert, R.H., Soltanpour, P.N., Tabatabai, M.A., Johmston, C.T., Sumner, M.E., Eds.; SSSA Inc.: Madison, WI, USA; ASA Inc.: Madison, WI, USA, 1996; pp. 1201–1230. [Google Scholar]
- Kemper, W.D.; Rosenau, R.C. Aggregate stability and size distribution. In Methods of Soil Analysis: Part 1. Physical and Mineralogica Methods; Klute, A., Campbell, G.S., Jackson, R.D., Mortland, M.M., Nielsen, D.R., Eds.; SSSA Inc.: Madison, WI, USA; ASA Inc.: Madison, WI, USA, 1986; pp. 425–442. [Google Scholar]
- Hatano, T.; Kagawa, H.; Yasuhara, T.; Okuda, T. Two new flavonoids and other constituents in licorice root: Their relative astringency and radical scavenging effects. Chem. Pharm. Bull. 1988, 36, 2090–2097. [Google Scholar] [CrossRef] [Green Version]
- Farrar, R.R.; Barbour, J.D.; Kennedy, G.G. Quantifying food consumption and growth in insects. Ann. Entomol. Soc. Am. 1989, 82, 593–598. [Google Scholar] [CrossRef]
- Nawaz, A.; Ali, H.; Sufyan, M.; Gogi, M.D.; Arif, M.J.; Ali, A.; Qasim, M.; Islam, W.; Ali, N.; Bodla, I.; et al. In-vitro assessment of food consumption, utilization indices and losses promises of leafworm, Spodoptera litura (Fab.), on okra crop. Asia Pac. Entomol. 2020, 23, 60–66. [Google Scholar] [CrossRef]
- Edwards, C.A. Vermicomposting organic wastes: A review. Soil Zool. Sustain. Dev. 21st Century 2004, 1, 369–395. [Google Scholar]
- Negi, R.; Suthar, S. Degradation of paper mill wastewater sludge and cow dung by brown-rot fungi Oligoporus placenta and earthworm (Eisenia foetida) during vermicomposting. Clean. Prod. 2018, 201, 842–852. [Google Scholar] [CrossRef]
- Moral, R.; Paredes, C.; Bustamante, M.A.; Marhuenda-Egea, F.; Bernal, M.P. Utilisation of manure composts by high-value crops: Safety and environmental challenges. Bioresour. Technol. 2009, 100, 5454–5460. [Google Scholar] [CrossRef] [PubMed]
- Fahey, J.W.; Zalcmann, A.T.; Talalay, P. The chemical diversity and distribution of glucosinolates and isothiocyanates among plants. Phytochemistry 2001, 56, 5–51. [Google Scholar] [CrossRef]
- Kaviraj, S.S. Municipal solid waste management through vermicomposting employing exotic and local species of earthworms. Bioresour. Technol. 2003, 90, 169–173. [Google Scholar] [CrossRef]
- Maji, D.; Misra, P.; Singh, S.; Kalra, A. Humic acid rich vermicompost promotes plant growth by improving microbial community structure of soil as well as root nodulation and mycorrhizal colonization in the roots of Pisum sativum. Appl. Soil Ecol. 2017, 110, 97–108. [Google Scholar] [CrossRef]
- Scaglia, B.; Nunes, R.R.; Rezende, M.O.O.; Tambone, F.; Adani, F. Investigating organic molecules responsible of auxin-like activity of humic acid fraction extracted from vermicompost. Sci. Total Environ. 2016, 562, 289–295. [Google Scholar] [CrossRef] [PubMed]
- Shivran, A.C.; Yadav, B.L. Effect of NP fertilizers, vermicompost and sulphur on growth, yield and quality of clusterbean Cymopsis tetragonoloba (L.) and their residual effect on grain yield of succeeding wheat Triticum aestivum (L). Legum. Res. 2013, 36, 74–78. [Google Scholar]
- Kopittke, P.M.; Menzies, N.J. A review of the use of the basic cation saturation ratio the ideal soil. Soil Sci. Soc. Am. J. 2007, 71, 259–265. [Google Scholar] [CrossRef]
- Osemwota, I.O.; Omued, J.A.I.; Ogboghodo, A.I. Effect of calcium/magnesium ratio in soil on magnesium availability, yield, and yield components of maize. Comm. Soil Sci. Plant Anal. 2007, 38, 2849–2860. [Google Scholar] [CrossRef]
- Hussain, N.; Singh, A.; Saha, S.; Venkata, S.K.M.; Bhattacharyya, P.; Bhattacharya, S.S. Excellent N-fixing and P-solubilizing traits in earthworm gut-isolated bacteria: A vermicompost based assessment with vegetable market waste and rice straw feed mixtures. Bioresour. Technol. 2016, 222, 165–174. [Google Scholar] [CrossRef] [PubMed]
- Bryant, J.P.; Chapin, F.S.; Klein, D.R. Carbon nutrient balance of boreal plants in relation to vertebrate herbivory. Oikos 1983, 40, 357–368. [Google Scholar] [CrossRef] [Green Version]
- Herms, D.A.; Mattson, W.J. The dilemma of plants: To grow or defend. Q. Rev. Biol. 1992, 67, 283–335. [Google Scholar] [CrossRef] [Green Version]
- Lakhdar, A.; Falleh, H.; Ouni, Y.; Oueslati, S.; Debez, A.; Ksouri, R.; Abdelly, C. Municipal solid waste compost application improves productivity, polyphenol content, and antioxidant capacity of Mesembryanthemum edule. J. Hazard. Mater. 2011, 191, 373–379. [Google Scholar] [CrossRef] [PubMed]
- Wang, D.H.; Shi, Q.H.; Wang, X.F.; Wei, M.; Hu, J.Y.; Liu, J.; Yang, F.J. Influence of cow manure vermicompost on the growth, metabolite contents, and antioxidant activities of Chinese cabbage (Brassica campestris ssp chinensis). Biol. Fertil. Soils 2010, 46, 689–696. [Google Scholar] [CrossRef]
- Hansen, A.K.; Moran, N.A. The impact of microbial symbionts on host plant utilization by herbivorous insects. Mol. Ecol. 2014, 23, 1473–1496. [Google Scholar] [CrossRef]
- Sambangi, P.; Rani, P. Induction of phenolic acids and metals in Arachis hypogea L. plants due to feeding of three Lepidopteran pests. Arthropod-Plant Interact. 2013, 7, 517–525. [Google Scholar] [CrossRef]
- Alba, J.M.; Glas, J.J.; Schimmel, B.C.J.; Kant, M.R. Avoidance and suppression of plant defenses by herbivores and pathogens. Plant Interact. 2011, 6, 221–227. [Google Scholar] [CrossRef]
- Kant, M.R.; Jonckheere, W.; Knegt, B.; Lemos, F.; Liu, J.; Schimmel, B.C.J.; Villarroel, C.A.; Ataide, L.M.S.; Dermauw, W.; Glas, J.J.; et al. Mechanisms and ecological consequences of plant defence induction and suppression in herbivore communities. Ann. Bot. 2015, 115, 1015–1051. [Google Scholar] [CrossRef]
- Deans, C.A.; Sword, G.A.; Behmer, S.T. Revisiting macronutrient regulation in the polyphagous herbivore Helicoverpa zea (Lepidoptera: Noctuidae): New insights via nutritional geometry. Insect Physiol. 2015, 81, 21–27. [Google Scholar] [CrossRef]
- Schoonhoven, L.; Van Loon, J.; Dicke, M. Insect-Plant Biology; Oxford University Press Publishing: Oxford, UK, 2005; pp. 48–127. [Google Scholar]
Publisher’s Note: MDPI stays neutral with regard to jurisdictional claims in published maps and institutional affiliations. |
© 2022 by the authors. Licensee MDPI, Basel, Switzerland. This article is an open access article distributed under the terms and conditions of the Creative Commons Attribution (CC BY) license (https://creativecommons.org/licenses/by/4.0/).