Abstract
In a warming climate, drought events are projected to increase in many regions across the world, which would have detrimental impacts on water resources for agriculture activity and human life. Thus, projecting drought changes, especially the frequency of future drought events, is very important for the African continent. This study investigates the future changes in drought events based on the France Centre National de Recherches Météorologiques (CNRM-CM6) model in the Coupled Model Intercomparison Project phase six (CMIP6) datasets for four shared socio-economic pathways (SSP): SSP1-2.6, SSP2-4.5, SSP3-7.0, and SSP5-8.5; and three time slices: near future (2020–2039), mid-century (2050–2069), and end-of-century (2080–2099), relative to a historical baseline period (1995–2014). The interannual variability and trends of the self-calibrating Palmer Drought Severity Index (scPDSI) based on the Penman–Monteith methods for measuring potential evapotranspiration (PET) are used to estimate future droughts. The temporal analysis shows that the drought frequency, intensity, and affected area will increase throughout the 21st century. Among the scenarios, SSP3-7.0 and SSP5-8.5 project a larger upward trend in drought characteristics than SSP1-2.6 and SSP2-4.5. The spatial pattern shows drought frequency decreases in humid regions and increases in non-humid regions across Africa. For all SSP scenarios, the projected wetting trend per decade ranges from 0.05 to 0.25, while the drying trend per decade ranges from −0.05 to 0.25. A regional trend analysis revealed key differences in spatial pattern, with varied trend projections of wetter and drier conditions in humid and non-humid regions under all SSP scenarios. Drier conditions are expected to intensify in Southern Africa under all SSP scenarios but are projected to be more intense under either SSP3-7.0 and SSP5-8.5. In general, the projected wetter trends in humid areas may favor agricultural production and ecological conservation, and drier trends in non-humid regions may call for the possible adoption of tailor-made drought adaptation strategies and development programmes to minimize impacts.
1. Introduction
Under a warming climate, the frequency of droughts is expected to increase in many regions due to the increase in projected temperature (TEMP) [1]. Drought is a complex natural process with adverse effects that ripple through multiple sectors of society, especially water resources for agricultural activities and human livelihood [2]. Droughts may be classified as meteorological, hydrological, agricultural, or socio-economic, based on their physical characteristics (see [2,3] for more details).
An increase in TEMP is expected to significantly affect hydrological processes [1,4] and may considerably change regional climates, leading to more frequent extreme events (e.g., droughts, heat stress) [1]. Skoulikaris et al. [4], among others, investigated the heat stress on agriculture due to climate change. Drought indices are commonly used to quantify drought events at any spatial–temporal scale. According to the World Meteorological Organisation (WMO), there are over 50 indices designed to compute droughts [2,3]. However, the most widely used and recommended drought indices are the Standardized Precipitation Index (SPI) [5], the Standardized Precipitation Evapotranspiration Index (SPEI) [6], the Palmer Drought Severity Index (PDSI) [7], and the self-calibrating PDSI (scPDSI) [8]. In a historical context, a wide range of studies based on independent observation data sets has examined drought indices and characterized drought parameters, such as the frequency, intensity, and spatial extent over the last three decades [2]. Among the indices mentioned above, the SPEI and the PDSI/scPDSI are the most widely used because their design incorporates two key components of the water cycle—precipitation (i.e., water supply) and evapotranspiration (i.e., water demand)—to represent a drought condition [2,3].
When comparing SPEI and scPDSI, the latter is preferred due to its better physical representation of drought condition in tropical regions, particularly in non-humid regions [9,10,11,12]. The advantage of using scPDSI, for example in a tropical region such as Africa, is its ability to represent drought conditions in non-humid regions (e.g., the Saharan or Kalahari deserts) and humid regions (e.g., the equatorial regions of Africa). In scPDSI, the change in the water balance is based on the difference between precipitation (PRE) and potential evapotranspiration (PET) together with parameters related to the soil/surface characteristics at each geographic region [8]. For example, the response to actual ET in water-limited regions (such as arid or semi-arid climates) is related to PRE changes rather than PET. On the contrary, in an energy-limited region (such as the equatorial region of Africa), PET, rather than PRE, is a driver to actual ET changes [13,14]. Thus, the scPDSI has been suggested by many studies [8,15,16], despite the index not being multi-scalar [15]. However, characterizing drought events at an interannual scale makes scPDSI comparable to SPEI at similar timescales [13], thus improving our understanding of drought events over the past century [16,17] and those documented in [8,16,18,19]. Recently, the scPDSI based on the Penman–Monteith methods for calculating PET, provided reasonable estimates of drought characteristics over the tropical climates of Africa compared to the Thornwaite method [20], a pattern which is well documented in historical drought study literature [15,17,21].
Good knowledge of the evolution of drought characteristics in the near and distant future can assist in early and efficient preparation for a drought event. Outputs from global climate models (GCMs) used in the Coupled Model Intercomparison Project (CMIP) framework allow us to understand the evolution of the climate under different emission scenarios [1]. Many studies have delved into drought characteristics using older CMIP versions. The effect of climate warming on drought intensifications (aridity) is also well studied and reported in [1,18,19,22]. The release of the new CMIP datasets [21,23] with improved quality and resolution makes further drought studies [24] of great interest, as updates in CMIP6 large-scale physics and dynamics are expected to introduce differences in how they perform in different climate regions. A typical example is presented by Voldoire et al. [25], where updates of several schemes, such as those in the France Centre National de Recherches Météorologiques (CNRM-CM) model, improved the simulation outputs of tropical climates, which is of great interest to Africa’s climate studies.
Also, an understanding of interannual variability and long-term changes in future droughts is further motivated by recent studies [26,27], which demonstrate potential shifts in climate zones under a future global warming scenario. According to these studies, different climate regions are likely to be influenced by a warming climate at the end of the century. This could suggest that in a future climate, an altered energy/water-limited regional response to actual ET will be related to PRE (PET) changes rather than PET (PRE) [14,28]. The new demarcation of the African sub-regions based on climate zones largely puts this study into proper context [29], thus providing meaningful information needed to achieve effective regional drought mitigation strategies under climate warming. However, knowledge of future droughts interannual variability and long-term changes based on the CMIP6 data is limited. A review of previous studies showed that relatively significant studies have used the CMIP3 or the CMIP5 to study drought in different African regions [30,31,32,33,34].
In a multiplicity of global datasets coupled with improved data representation, many studies have adopted the multi-mean ensemble (MME) technique to study drought events. On the other hand, single model studies have gained significant attention and have advanced in recent times [25,35,36,37,38,39,40]. Most single model studies compared the two different versions of the same models [25,36,37,38,39,40]. Unlike those studies, the focus of the present study is to examine the climatology of drought events and their parameters based on the CNRM-CM6 GCM. This study follows a related study [35] that examined the future ET climatology for different SSP scenarios using the CNRM-CM6 model across climate regions and indicated that the ET variability may likely influence the distribution of extreme events, such as droughts, in both space and time, especially across Africa. This study investigates the temporal variability of future drought characteristics under four emissions scenarios. Moreover, the spatial pattern of drought event frequency and the wetting and drying trends from the CNRM-CM6 model using the scPDSI is examined based on the Penman-Monteith (PM) methods for measuring PET to identify droughts. The choice of scPDSI to represent future drought is documented in CMIP (phase 5 and 6 based drought analysis) [1,24,26].
The remainder of the paper is structured as follows: Section 2 describes the study area, and introduces the data and methods used in the study. Section 3 presents the results of the projected change in drought characteristics and projected trends in wetting and drying conditions. The discussions are presented in Section 4 and the conclusion in Section 5.
2. Data and Methods
2.1. Study Area
Africa is located between 32° N and 35° S and 14° W and 52° E (Figure 1). The entire African land area is nearly 30.37 million km2, and the equator divides the continent into two, with more states in the Northern than in the Southern Hemispheres. Africa is the second-largest continent after Asia, in land size and population growth. Its vulnerability to climate variabilities is highly noticeable when extreme events occur, as three-quarters of the continent’s Gross Domestic Product is heavily dependent on rain-fed agriculture [41], which is tied to climate variability [41]. As climate change is expected to reshape the spatiotemporal pattern of climate zones in the future climate [26,27], we present a Köppen–Geiger map overlaid on the latest Intergovernmental Panel on Climate Change (IPCC) regional demarcations for Africa region [29] (Figure 1). The IPCC regional demarcations for Africa [29] is divided into seven regions: the Sahara (SAH), West Africa (WAF), Central Africa (CAF), Northern East Africa (NEAF), Southern East Africa (SEAF), Western South Africa (WSAF), and Eastern South Africa (ESAF) (Figure 1) and are used in [42,43].
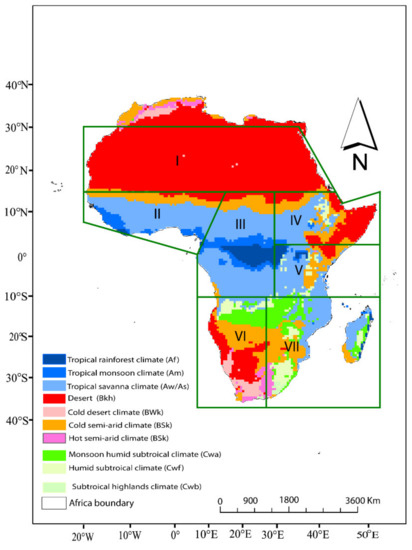
Figure 1.
Map of Köppen–Geiger climate classification for 2071–2100 [27] overlaid with the updated IPCC sub-regions for Africa climate studies [29]. Abbreviations: (I) SAH: Sahara, (II) WAF: West Africa, (III) CAF: Central Africa; (IV) NEAF: Northern East Africa, (V) SEAF: Southern East Africa; (VI) WSAF: Western South Africa, (VII) ESAF: Eastern South Africa.
2.2. Data
Following the recommendation from a previous study of the region [35], the present study uses the France Centre National de Recherches Météorologiques (CNRM-CM6) dataset produced by [25,44]. The dataset is jointly developed by the Centre National de Recherches Météorologiques—Groupe d’Étude de l’Atmosphère Météorologique (CNRM-GAME) and the Centre Européen de Recherche et de Formation Avancée en Calcul Scientifique (CERFACS). In CNRM, the atmosphere model is represented by ARPEGE-Climat (v6.3) [45], which incorporates the land surface scheme ISBA-CTRIP [46,47]. The lake areas uses the revised FLAKE model, which is incorporated in the SURFES v8.0 [48] externalized surface system as well as being fully-coupled with the NEMO version 3.6 ocean model [49]. The sea ice model GELATO scheme [50] through the OASIS-MCT coupling system [51,52] and the Total Runoff Integrating Pathways (TRIP) river routing scheme [53] were used. An output system called the XIOS server is added to the system to allow online output processing [54]. Readers are directed to Voldoire et al. [25] for more details of the CNRM-CM6 GCM. The CNRM-CM selection was influenced partly as a result of past studies on PRE [55,56], ET [35] and TEMP [55]. Further, an evaluation of CNRM-CM5 and CNRM-CM6 by Voldoire et al. [25] highlighted significant improved simulation of tropical climates.
The spatiotemporal resolution of CNRM-CM6 is 1.4° × 1.4° and extends from 1995–2014 for historical data and 2015–2100 for projections. The study considered projections for three time slices: near future (2020–2039), mid-century (2050–2069), and end-of-century (2080–2099). We use the first ensemble member (r1i1p1f1 (r1: realization index; i1: initialization index; p1: physics index; and f1: forcing index). The CNRM-CM6 datasets are publicly available at [57]. The projections are studied for four Shared Socio-economic Pathway (SSP): SSP1-2.6, SSP 2-4.5, SSP3-7.0, and SSP5-8.5, representing the low forcing (i.e., sustainability pathway), medium forcing (i.e., middle-of-the-road pathway) medium-to-high forcing pathway (i.e., a medium challenge to mitigation and adaptation pathway) and high-end forcing pathway (i.e., the worst possible scenario), respectively [58].
2.3. Methods
2.3.1. Potential Evapotranspiration (PET) Computation Using the Penman–Monteith Model
PET is a key component of the scPDSI. We used the Penman–Monteith (PM) model to compute PET based on the Food and Agriculture (FAO) recommendation [41]. The choice of PM is based on a previous study in the region [20] and it has been documented in many studies across the globe [15,16,18,19]. The PET computation with the PM model uses relative humidity, wind, temperature, and short and long-wave radiation. See for more details about the PM approach [59].
2.3.2. Self-Calibrated Palmer Drought Severity Index (scPDSI) Model
The scPDSI is widely used to quantify future droughts [60]. We computed the scPDSI with PRE, PET, and available water capacity (AWC) following Wells et al. [8] and Dai [59]. The drought is computed for the baseline (1995–2014) and future (2015–2100) periods. To compute the projected drought for each time window, the difference between the future time window and the baseline period is estimated and projected from 2015 to 2100 under the four SSP scenarios following [60]. Details of scPDSI formulations and calculation is found in [59] and others related studies [15,16,18,19,61].
2.3.3. Drought Characteristics
The run theory is used [62] to extract drought events and describe their basic characteristics (i.e., drought frequency (DF), drought intensity (DI) and mean drought-affected area (DA)). For each month, grids with scPDSI values lower than −2 are considered as a drought event.
The mathematical expression below (Equation (1)) is used to calculate drought frequency (DF). DF is the ratio of the number of drought months to the total number of months.
where DF denotes the frequency of droughts, n denotes the number of drought months, and the N represents the total number of months.
Drought area is the total area of grids affected by droughts. The drought area coverage (DA) is expressed as (Equation (2)):
where DA represents the drought area coverage, i is a month, n is the nth month, na is the total number of pixels under drought condition, and da denotes the number of pixels with for a specific intensity in month i.
Drought intensity is the average drought index of grids experiencing droughts. Drought intensity is computed by the averaging the intensity of all drought events on each grid during the reference period and the three future periods (Equation (3)):
where DI represents the drought intensity and n denotes the total number of grids with drought conditions in months with scPSDI < −2.
2.3.4. Mann–Kendall Test and Theil–Sen’s Slope Test
The trends in drought are examined using the Mann–Kendall tau-b nonparametric technique [63,64]. The study also used the Theil–Sen formula, to estimate and characterize linear trends [65]. The mathematical formulation for both the Mann–Kendall tau-b nonparametric technique and the Theil–Sen formula is well known in the literature. The computation procedures are presented in many studies [61,66,67].
2.3.5. Unit of Analysis
The unit of analysis used in this study is based on annual and decadal scales for future climate change analysis. A flowchart of the paper is illustrated in Figure S1. In addition, to better characterize the drought events over the African region, the projected drought changes are performed for six spatial domains defined by Iturbide et al. [29] and are adopted in the IPCC AR6 [1] and other studies [42,43]. The new demarcation provides a possible scientific basis for describing drought events under different climate zones and proposing tailormade adaptations and mitigation policies for different regions.
Based on lessons from past studies [16,18,68], this work defines drought episodes as periods with a monthly drought index (less than −2) under the thresholds shown in Table 1. Thus, we calculate the drought index for each grid and the four SSP scenarios of the CNRM-CM6 data. The drought properties are then spatially averaged for each 20-year period. The projected droughts are computed by subtracting the historical mean (1995–2014) from the entire projected time series: near future (2020–2039), mid-century (2050–2069), and end-of-century (2080–2099). All data processing is performed using the Climate Data Operation (CDO).

Table 1.
Classifications of droughts based on scPDSI.
3. Results
3.1. Projected Climatological Changes in Drought Characteristics
Figure 2 illustrates the projected drought frequency for the four SSPs scenarios during 2015–2100 relative to the baseline period (1995–2014). In general, the frequency of future drought events shows an increasing trend for all SSP scenarios. Moreover, the magnitude of the trend increases with an increase in radiative forcing.
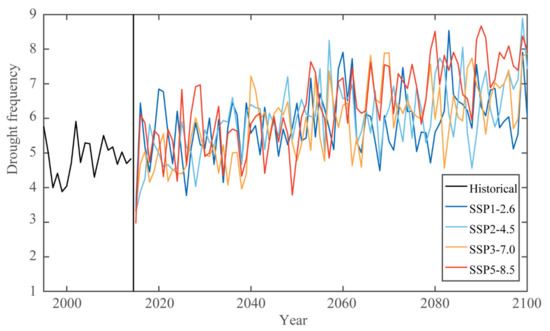
Figure 2.
Annual drought frequency averaged over Africa during the baseline (1995–2014; black line) and future (2015–2100) periods. The colored lines represent results under the four SSP: SSP1-2.6, SSP2-4.5, SSP3-7.0, and SSP5-8.5.
SSP5-8.5 (red) and SSP3-7.5 (orange) illustrate an increasing trend throughout the century, with the frequency of drought events estimated to range between 3–8 yr−1. The magnitude of the frequency of drought events is slightly lower (3–6 yr−1) in SSP1-2.6 (deep blue) and SSP2-4.5 (light blue). Overall, all the SSP scenarios show an increasing trend in drought frequency throughout the century.
Figure 3 illustrates the time series of projected drought intensity for the four SSP scenarios. The projected time series presents different drought intensities for the different SSPs. Overall, the projected intensity varies significantly across all SSP scenarios with values ranging from −2.5 to −4 for different periods. These changes in drought intensities are more distinguishable in the mid- (2050–2069) to end-of-century (2080–2099), as projected intensity changes from severe (i.e., −2.5–−3.5) to extreme (i.e., ≥3.5) droughts under SSP3-7.0 (orange) and SSP5-8.5 (red) at the end of the century. In the SSP1-2.6 (deep blue) and SSP2-4.5 (light blue) scenarios, the drought intensities are moderate (i.e., ≤2.5) in the near future (2020–2039), changing to severe in the mid-century (2050–2069), and back to moderate drought intensity at the end of the century (2080–2099).
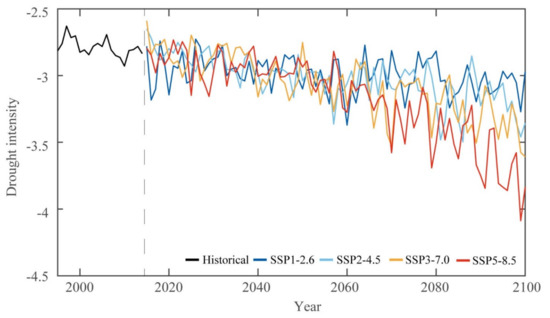
Figure 3.
Annual drought intensity averaged over Africa during the baseline (1995–2014, black line) and future (2015–2100) periods. The color lines represent the results under the four SSP: SSP1-2.6, SSP2-4.5, SSP3-7.0, and SSP5-8.5.
Figure 4 shows the time series of the projected drought-affected area for the different SSP scenarios during the 21st century. The figure shows mixed upward and downward trends during the different time periods. Quantitatively, the affected areas range from 900–1800 (104 km−2) in the near future (2020–2039) under all SSP scenarios, followed by an increase in coverage from 2000 (104 km−2) in the 2060s and a decrease to 1700 (104 km−2) at the end of mid-century (i.e., 2070). The end-of-century projects upwards trends for all SSP scenarios from 1600 to 2099 (104 km−2). The affected areas for SSP3-7.0 (orange color) and SSP5-8.5 (red) are slightly closer to each other in magnitudes, while SSP1-2.5 (deep blue) and SSP 2-4.5 (light blue) scenarios show a similar increase in range of magnitudes.
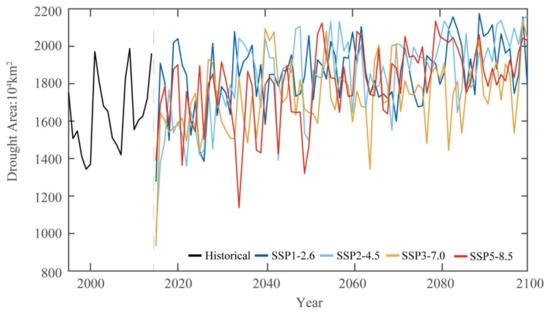
Figure 4.
Annual drought spatial coverage averaged over Africa during the baseline (1995–2014; black line) and future (2015–2100) periods. The color lines represent the results under the four SSP: SSP1-2.6, SSP2-4.5, SSP3-7.0, and SSP5-8.5.
3.2. Projected Changes in Drought Frequency
Figure 5 illustrates the spatial distributions of climatological drought frequency across Africa for the different SSPs scenarios during 2020–2099. The drought frequency is computed by subtracting each grid of the baseline period from that of the future periods. Overall, the spatial pattern of drought frequency is projected to increase for different periods and SSP scenarios. The spatial trend of drought frequency across Africa complements the temporal trend by indicating the regions of possible increase or decrease in drought frequency.
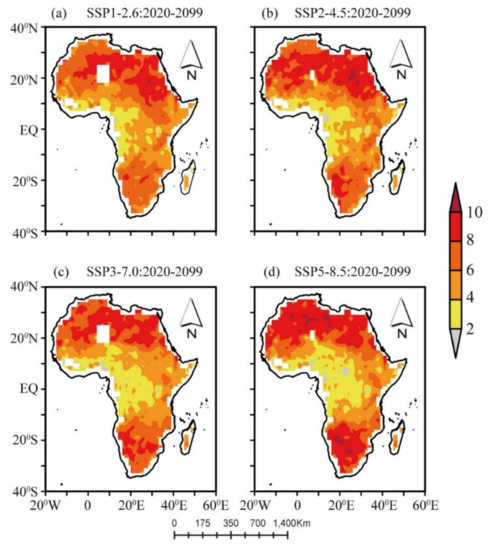
Figure 5.
Geographic distribution of projected annual mean drought frequency (yr−1) during 2020–2099 under the four SSP scenarios. (a) SSP1-2.6; (b) SSP2-4.5; (c) SSP3-7.0; and (d) SSP5-8.5. The anomaly is calculated as projection minus baseline period. The white background shows areas with no values.
The analysis of the projected drought frequency across the continent shows striking differences in spatial patterns. Regional differences are observed when considering the different sub-regions (Figure 5). In SAH, high drought frequency values (6 to >10) are observed for each scenario (Figure 5). The drought frequency is projected to increase with an increase in radiative forcing scenarios in this region over the period. Similar patterns are noted for WSAF and ESAF, with the drought frequency varying from 6 to >10. However, we observed higher frequency values over the arid regions of WSAF than over the semi-arid region of ESAF, except under SSP5-8.5. The drought frequency pattern of SAH and WSAF is related to the similarity in PRE pattern and the amount of the regions.
In contrast, the equatorial region shows different drought frequencies under each scenario. In WAF, the drought frequency is relatively lower and ranges from 2 to 4, with the frequency slightly reducing with increasing scenarios. In CAF, drought frequency varies from <2 to 6 and the value reduces from SSP1-2.6 to SSP5-8.5. We observe values of <2 in drought frequency in CAF, especially over the Congo Basin. In the EAF, we observe slightly mixed results. For example, NEAF presents slightly higher drought frequency values ranging from 2 to >8, while SEAF shows values ranging from 2 to 6. Drought frequency of 4–6 yr−1 is observed over parts of Sudan and Ethiopia but reduces from 6 to 2 over the Somalia and Eritrea region for each scenario. In summary, drought frequency is projected to decrease in CAF and WAF and slightly in SEAF for each scenario while an increase is expected in SAH, WSAF, and ESAF.
We further investigate the spatial distributions of projected climatological changes in drought frequency in the three time slices (Figure 6). Overall, the spatial pattern shows nearly similar value ranges in drought frequencies across the continent. However, sub-regional analysis shows an interesting pattern with a distinguishable reduction in the number of drought occurrences in WAF and CAF. WAF shows progressively decreasing values in drought frequency throughout the century. The number of drought occurrences decreases at a much lower rate, with a sharper decrease noted in CAF. In general, in WAF and CAF, drought frequencies is lower under SSP3-7.0 and SSP5-8.5 than under SSP1-2.5 and SSP2-4.5.
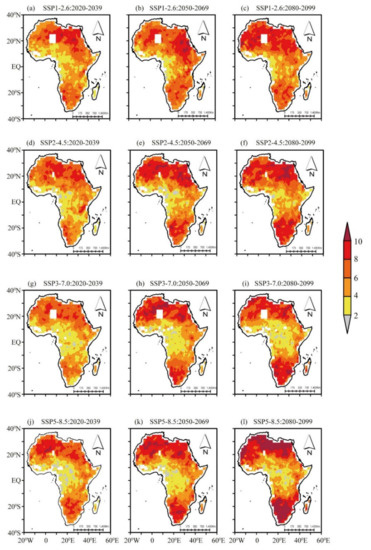
Figure 6.
Geographic distribution of projected mean drought frequency (yr−1) for the near future (2020–2039), mid-century (2050–2069), and end-of-century (2080–2099) under (a–c) SSP1-2.6, (d–f) SSP2-4.5, (g–i) SSP3-7.0, and (j–l) SSP5-8.5 scenarios. The white background shows areas with no values.
On the contrary, an increase in the number of drought occurrences is noted in SAH, WSAF, and ESAF. On the other hand, the drought frequency in NEAF and SEAF is relatively similar for each scenario. The drought frequency is likely to increase in SAH, WSAF, and ESAF under SSP3-7.0 and SSP5-8.5 than under SSP1-2.5 and SSP2-4.5.
3.3. Projected Wetting and Drying Trends
This section focuses on the projected scPDSI trends for the different scenarios during the 2020–2099. For this purpose, we consider an event as dry and wet when scPDSIPM is <−2 and scPDSIPM >+2, respectively. Figure 7 illustrates the spatial distribution of scPDSIPM linear trends based on the Mann–Kendall test. The results are tested at 5% significance level.
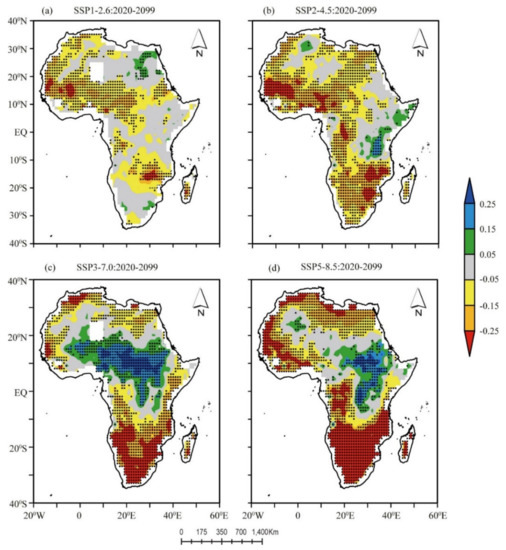
Figure 7.
Pixel-wise linear trends for <(−2.0, during 2020–2099. (a) SSP1-2.6, (b) SSP2-4.5, (c) SSP3-7.0, and (d) SSP5-8.5 scenarios. The values are expressed in changes per decade (the dots denote passing a 5% significance test). The white background shows areas with no values.
The spatial patterns clearly illustrate that those mixed drying and wetting signals are likely to dominate many parts of Africa throughout the 21st century. The spatially complex trends show that drying conditions are likely to increase from 0.05 to 0.25 decade−1 under SSP1-2.5 and SSP2-4.5 across Africa, with packets of wetting conditions scattered in the continent (Figure 7a,b).
In contrast, the spatial patterns in Figure 7c,d, clearly show that wetting conditions are likely to increase throughout the 21st century, with distinguished variations observed in the equatorial region (i.e., WAF and CAF), with trends of SSP3-7.0 and SSP5-8.5 scenarios increasing from 0.05 to 0.25 decade−1. Moreover, a clear distinction is observed in SAH, WSAF, and ESAF, showing that future drying conditions are likely to increase from −0.05 to −0.25 decade−1 for SSP3-7.0 and SSP5-8 scenarios. It is worth observing that NEAF and SEAF present mixed results of wetting and drying in different scenarios.
The spatial distribution in SEAF shows a slightly larger increase in wetting than in NEAF under all scenarios. In SEAF, a striking pattern is the wetting trends before 30–40° E and the drying trend along 40–45° E in the SSP3-7.0 and 5–8.5 scenarios. However, in Figure 7a,b, a distinct spatial pattern between the two scenarios in NEAF and SEAF shows no trends in SSP1-2.5 and wetting trends in SSP 2-4.5 along 40–45° E. In WSAF and ESAF, a drying trend gradually increases from SSP1-2.5 to the SSP5-8.5 scenario. Our analysis shows more pronounced drying conditions in SSP3-7.0 and SSP5-8 scenarios over WSAF and ESAF.
Figure 8 illustrates the spatial distribution of linear trends for scPDSIPM for all scenarios during the near future ((2020–2039), mid-century (2050–2069), and end-of-century (2080–2099), based on the Mann–Kendall test at 5% significance level. In general, a distinguishable spatial pattern of wetting and drying trends is shown for each SSP scenario and time slice. The sub-regional analysis shows different spatial patterns of wet and dry conditions with differences in trend values for the three time slices under all SSP scenarios. SAH show mixed results of wetting and drying trends in all SSPs. In WAF and CAF, we observed a more distinct drying trend under SSP2-4.5 (Figure 8d) than SSP1-2.6 (Figure 8a) in the near future (2020–2039), which reverts to a wetting trend in the mid-century (2050–2069) with magnitudes >0.25 decade−1 in Figure 8b,d, and mixed trends at the end-of-century (2080–2099) (Figure 8c,f). On the contrary, NEAF and SEAF are relatively similar, but they have mixed wetting and drying trends in three SSPs except for SSP5-8.5. A strong wetting trend under SSP5-8.5 is observed in the near future and end-of-century in NEAF and SEAF but with mixed trends in mid-century (2020–2039). On the other hand, WSAF and ESAF show a mixed trend in all SSPs but more pronounced drying conditions in the SSP3-7.0 and SSP5-8 scenarios at ESAF than WSAF at the end of century.
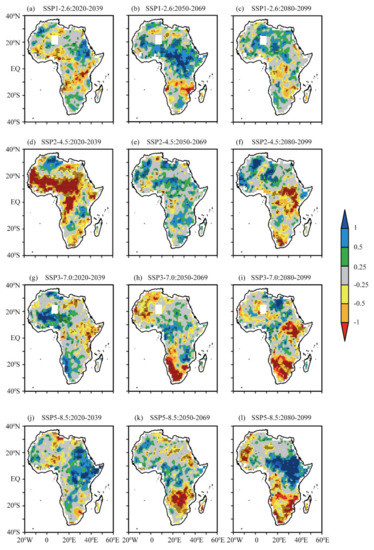
Figure 8.
Pixel-wise linear trends for < −2.0, for the near future (2020–2039), mid-century (2050–2069), and end-of-century (2080–2099) under (a–c) SSP1-2.6, (d–f) SSP2-4.5, (g–i) SSP3-7.0, and (j–l) SSP5-8.5 scenarios, respectively. The values are expressed in changes per decade (dots denote passing a 5% significance test). The white background shows areas with no values.
4. Discussion
This study uses the CNRM-CM6 data to investigate future drought characteristics and trends during the 21st century (near future, mid-century, and end-of-century) for four SSP scenarios (SSP1-2.6, SSP2-4.5, SSP3-7.0, and SSP5-8.5). Using these scenarios provides the scientific community with an opportunity to investigate changes in droughts across the African continent against the backdrop of the continent’s vulnerability to weather and climate variability, which is coupled with population growth.
The time series of change in drought intensity between the future and the baseline periods are computed and presented in Figure 3. An increase in drought event intensity is experienced under all SSP scenarios and different time periods. The extent of the drought-affected areas significantly increases over time and the upward trend increases with increasing SSPs (Figure 4). This indicates that the frequency of future drought events will be higher and drought-event severity will intensify over time, thus increasing the spatial extent of the affected area. Overall, higher emissions (i.e., SSP370 and SSP585) scenarios will exhibit higher frequency of drought events, more severe drought over significantly larger areas than lower emissions scenarios (SSP1.2.6 and SSP2-4.5). This result is consistent with the IPCC AR6 [1].
Geographically, the drought-event frequency shows some mixed results under different climate conditions. In absolute terms, drought events will be more frequent in areas under arid and semi-arid climate conditions in Africa (Figure 5) for different future periods. These results are consistent with a previous study over the region, but it is based on SPI and SPEI [69]. Moreover, this pattern is comparable to RCP2-4.5 and RCP8.5 scenarios from CMIP5 [32]. The spatial pattern shows similar value ranges in drought frequencies across the continent (Figure 6). The WAF region shows progressively decreasing values in drought frequency across all three time slices (Figure 6a–i). The number of drought occurrences decreases at a much lower rate, with a sharper decrease noted in the CAF (Figure 6a–i). This result is consistent with previous studies in the WAF and CAF regions [70,71]. On the contrary, an increase in the number of drought in SAH, WSAF, and ESAF (Figure 6a–i) is in agreement with Shongwe et al. [72]. On the other hand, the number of drought frequencies in NEAF and SEAF is relatively similar for different time slices and under each SSP-RCP scenario (Figure 6a–i), in agreement with Makula, and Zhou [73] and Ayugi et al. [68]. A general spatial pattern shows a likely increase in drought frequencies over SAH, WSAF, and ESAF under SSP3-7.0 and SSP5-8.5 than under SSP1-2.5 and SSP2-4.5.
To investigate future trends in wetting and drying conditions, the Mann–Kendall test [64] and the Theil–Sen slope estimator were used [65]. The scPDSI present significant trends for all different scenarios. The trends are mostly negative (indicating likely increases in drying conditions) across Africa. Overall, lower emissions (SSP1-2.5 and 2-4, Figure 7a,b) present a larger area of drying trends than higher emission (SSP3-7.0 and SSP5-8.5, Figure 7c,d). The regional analysis of projected wetting and drying trends shows spatial pattern differences across the continent. A larger area of negative trends obtained in SAH, WSAF, and ESAF indicate that future drought events may be further intensified in arid regions. Similar drying conditions were observed in Bellprat et al. [74] in WSAF and ESAF, and in SAH [75]. This may be partly attributed to the spatial pattern of future PRE in this region due to water-limited conditions. Droughts respond more to PRE than PET, which is consistent with Munday and Washington [76], or model uncertainties [77]. Considering the SSP scenarios, lower emissions (i.e., SSP1-2.6 and SSP2-4.5) are expected to witness more drying conditions than higher emissions (SSP3-7.0 and SSP5-8.5). The WSAF and ESAF point to drying conditions, with trends significant under SSP2-4.5, SSP3-7.0, and SSP5-8.5. This result is consistent with a study by Iyakaremye et al. [78], who projected that SAH and WSAF would warm faster, relative to other parts of the continent with changes in PRE [13,79]. The magnitudes of negative trends under SSP3-7.0 and SSP5-8.5 signal severe aridification trends in the arid region of WSAF and semi-arid conditions of ESAF than in SAH. The striking difference in drying trends in SAH relative to WSAF and ESAF is that the projected increase in PRE in the Northern Hemisphere (NH) is slightly higher than that in the Southern Hemisphere (SH), consistent with Almazroui et al. [55], Lim Kam Sian et al. [56], and Babaousmail et al. [80]. These results indicate that the arid conditions in the SH (i.e., WSAF and ESAF) exhibit more pronounced drying conditions than the NH (i.e., SAH). Similar results were noted in Lee & Wang [81]. The plausible reason for these results may be related to the interhemispheric difference in the warming rate documented in Kitoh et al. [82]. This signal has a potential implication for this region, as these impacts may affect regional socio-economic stability and ecological security for countries located in the SAF.
In WAF and CAF, SSP1-2.5 and SSP2-4.5 (Figure 7a,b) show opposite indicators to SSP3-7.0 and SSP5-8.5 (Figure 7c,d), as the magnitude of change cannot be ignored. Large changes are expected in the WAF and CAF regions, as large areas of significant positive trends under a high emissions rate and negative trends under lower emissions rate are observed. The possibility of an increase in negative trends under SSP1-2.5 and SSP2-4.5 (Figure 7a,b) and positive trends under SSP3-7.0 and SSP5-8.5 (Figure 7c,d) provides an interesting result, since, in humid conditions, drought responds to PET rather than PRE. A lower emissions rate likely will present a drying trend, and wetting trends in higher emissions scenarios in a humid environment such as WAF and CAF may be related to a weakening of the land–atmosphere coupling [11,83,84,85]. Similar results were reported in Dosio et al. [28] using both regional climate models (RCM) and GCMs over WAF but for PRE projections. A further study is recommended to examine this phenomenon of low emission scenarios (i.e., SSP1-2.6 and SSP2-4.5) that shows a stronger wetting trend with high magnitudes than high emission scenarios (i.e., SSP3-7.0 and SSP5-8.5).
The NEAF and SEAF regions present distinct spatial patterns between the four scenarios (Figure 7a–d). The SSP2-4.5 illustrates a positive trend in the NEAF and SEAF region, while the SSP1-2.5 exhibits no trend in large areas, with scattered packets of negative trends. However, the drought conditions under the SSP3-7.0 and SSP5-8.5 in the NEAF and SEAF generally present negative and positive trends. The negative trend is related to a decrease in PRE [79,80] and the increase in ET [35] or TEMP [55] in the NEAF and SEAF regions in the future. The drying conditions identified here agree with previous studies in this region, reflecting the complex patterns of PRE and ET trends [86,87]. The results noted that the negative trends are located in already vulnerable states, such as Kenya and Somalia, with arid conditions and poor adaptation mitigation. This pattern in NEAF and SEAF shows that the results are comparable in SSP2-4.5 and SSP5-8.5 scenarios from CMIP6 in Haile et al. [30]. Overall, the CNRM-CM6 model indicates that the possible future wetting and drying patterns are changing in different regions across Africa. We urge readers to interpret the results with caution, as the results are based on non-bias adjusted CNRM-CM6 data. Different studies have noted that non-bias adjusted data may over- or underestimate regions with significant variation in local features, such as topography and water bodies [88,89,90]. Future studies should consider the impact of bias adjustment on the historical and projected droughts events over Africa. This information may provide insight into the ongoing climate discussion and improve our understanding of drought events over the African region.
In summary, stakeholders have reiterated the need for an evidence-based approach to studing extreme events to inform policymaking at local scales. Many countries in Africa are highly dependent on rain-fed agriculture. The projected wetting and drying trend throughout the century for all SSP scenarios may likely impact the future agricultural production and ecological stability of humid, arid and semi-arid climates, as documented in past studies [30,91]. The regional analysis of projected drought climatology shows significant spatial differences. The spatial differences suggest that drought impact may vary with locations, and so will a region’s capacity to respond to drought events. Future climate adaptation policies should be tailored to specific regional needs. The results form a wider network of previous related studies published in FAO [41] to inform national policymakers of the identified future drought-prone regions to develop adaptation policies across Africa.
5. Conclusions
This study describes the long-term changes in drought characteristics using the scPDSI based on the CNRM-CM6 model of the CMIP6 datasets. The following conclusions are drawn from the model projections across Africa for all four SSP scenarios.
- The spatio-temporal pattern and trends reveal that Africa is likely to experience changes in drought characteristics under all SSP scenarios.
- The spatial pattern of drought frequency across the continent reveals regional differences, as arid and semi-arid regions are to likely to have more droughts.
- The CNRM-CM6 model projections indicate a regional difference in wetting and drying trends over Africa for different SSP scenarios.
- Overall, regions in Africa located below the equator are likely to experience a general drying trend with droughts intensifying over time, while arid regions above the equator are likely to show moderate drying conditions in all SSP scenarios.
- The CNRM-CM6′s ability to satisfactorily identify the extent of drought parameters and trends over Africa is consistent with previous studies and further increases the confidence of the CMIP6 datasets for future studies of extreme events.
Within the context of the Paris Agreement, the Agenda 20,230 of the United Nations Sustainable Development Goals (SDGs), and the Malabo 2025 declaration, the findings of this study are significant and provides a basis for stakeholders in the region to further explore the changing trends of projected drought episodes and its potential impact on various sectors of the society. Readers are urged to interpret the results with caution as the objective of this study is not to confirm the superiority of the CNRM-CM6 datasets over other CMIP6 datasets or the ensemble approach, but rather to demonstrate its potential use in a local context. A future study plans to explore the implication of future drought climatology on direct (e.g., water use efficiency and crop yields) and indirect costs in African countries whose economy is tied to climate variability.
Supplementary Materials
The following supporting information can be downloaded at: https://www.mdpi.com/article/10.3390/agriculture12040495/s1, Figure S1: Methodological Flowchart.
Author Contributions
Conceptualization, I.K.N. and D.F.T.H.; methodology, I.K.N. and D.F.T.H.; software, J.L.; validation, D.F.T.H. and W.U.; formal analysis, I.K.N., J.L. and D.F.T.H.; investigation, I.K.N. and D.F.T.H.; resources, S.L. and J.L.; data curation, S.L. and J.L.; writing—original draft preparation, I.K.N.; writing—review and editing, W.U., N.A.P., G.T.G. and K.T.C.L.K.S.; visualization, S.L. and J.L.; supervision, D.F.T.H. All authors have read and agreed to the published version of the manuscript.
Funding
This research received no external funding.
Institutional Review Board Statement
Not applicable.
Informed Consent Statement
Not applicable.
Data Availability Statement
The CNRM-CM6 datasets used here are publicly available at the France Centre National de Recherches Météorologiques website (https://esg1.umr-cnrm.fr/ (accessed on 20 May 2021)) or CMIP6: https://esgf-node.llnl.gov/search/cmip6 (accessed on 20 May 2021).
Acknowledgments
The authors are thankful to the World Climate Research Programme (WCRP)-Working Group on Coupled Modelling (WGCM) for making the CMIP6 data publicly available.
Conflicts of Interest
The authors declare no conflict of interest.
References
- IPCC. Summary for Policymakers. In Climate Change 2021, The Physical Science Basis Contribution of Working Group I to the Sixth Assessment Report of the Intergovernmental Panel on Climate Change; Cambridge University Press: Cambridge, UK, 2021. [Google Scholar]
- Mishra, A.K.; Singh, V.P. A review of drought concepts. J. Hydrol. 2010, 391, 202–216. [Google Scholar] [CrossRef]
- Heim, R.R.J. A review of twentieth-century drought indices used in the united states. Bull. Am. Meteorol. Soc. 2002, 83, 1149–1166. [Google Scholar] [CrossRef]
- Skoulikaris, C.; Makris, C.; Katirtzidou, M.; Baltikas, V.; Krestenitis, Y. Assessing the Vulnerability of a Deltaic Environment due to Climate Change Impact on Surface and Coastal Waters: The Case of Nestos River (Greece). Environ. Model. Assess. 2021, 26, 459–486. [Google Scholar] [CrossRef]
- Mckee, T.B.; Doesken, N.J.; Kleist, J. The relationship of drought frequency and duration to time scales. In Proceedings of the 8th Conference on Applied Climatology, Boston, MA, USA, 17–22 January 1993; Volume 17, pp. 179–183. [Google Scholar]
- Vicente-Serrano, S.M.; Beguería, S.; López-Moreno, J.I. A multiscalar drought index sensitive to global warming: The Standardized Precipitation Evapotranspiration Index. J. Clim. 2010, 23, 1696–1718. [Google Scholar] [CrossRef]
- Palmer, W.C. Meteorological Drought; U.S. Department of Commerce: Washington, DC, USA, 1965. Available online: https://www.droughtmanagement.info/literature/USWB_Meteorological_Drought_1965.pdf (accessed on 20 May 2021).
- Wells, N.; Goddard, S.; Michaelsen, J. A self-calibrating Palmer Drought Severity Index. J. Clim. 2004, 17, 2335–2351. [Google Scholar] [CrossRef]
- Ayantobo, O.O.; Wei, J. Appraising regional multi-category and multi-scalar drought monitoring using Standardized Moisture Anomaly Index (SZI): A water-energy balance approach. J. Hydrol. 2019, 579, 124139. [Google Scholar] [CrossRef]
- Chen, S.; Gan, T.Y.; Tan, X.; Shao, D.; Zhu, J. Assessment of CFSR, ERA-Interim, JRA-55, MERRA-2, NCEP-2 reanalysis data for drought analysis over China. Clim. Dyn. 2019, 53, 737–757. [Google Scholar] [CrossRef]
- Berg, A.; Findell, K.; Lintner, B.; Alessandra, G.; Sonia, I.S.; van den Hurk, B.; Ruth, L.; Pitman, A.; Hagemann, S.; Meier, A.; et al. Land—Atmosphere feedbacks amplify aridity increase over land under global warming. Nat. Clim. Chang. 2016, 6, 869–874. [Google Scholar] [CrossRef]
- Yang, Y.; Roderick, M.L.; Zhang, S.; McVicar, T.R.; Donohue, R.J. Hydrologic implications of vegetation response to elevated CO2 in climate projections. Nat. Clim. Chang. 2018, 9, 44–48. [Google Scholar] [CrossRef]
- Dai, A.; Zhao, T.; Chen, J. Climate change and drought: A precipitation and evaporation perspective. Curr. Clim. Chang. Rep. 2018, 4, 301–312. [Google Scholar] [CrossRef]
- Seneviratne, S.I.; Corti, T.; Davin, E.L.; Hirschi, M.; Jaeger, E.B.; Lehner, I.; Orlowsky, B.; Teuling, A.J. Investigating soil moisture–climate interactions in a changing climate: A review. Earth Sci. Rev. 2010, 99, 125–161. [Google Scholar] [CrossRef]
- Van der Schrier, G.; Barichivich, J.; Briffa, K.R.; Jones, P.D. A scPDSI-based global data set of dry and wet spells for 1901–2009. J. Geophys. Res. Atmos. 2013, 118, 4025–4048. [Google Scholar] [CrossRef]
- Seneviratne, S.I. Historical drought trends revisited. Nature 2012, 491, 338–339. [Google Scholar] [CrossRef]
- Trenberth, K.E.; Dai, A.; van der Schrier, G.; Jones, P.D.; Barichivich, J.; Briffa, K.R.; Sheffield, J. Global warming and changes in drought. Nat. Clim. Chang. 2014, 4, 17–22. [Google Scholar] [CrossRef]
- Douville, H.; Krishnan, R.; Renwick, J.; Allan, R.; Arias, P.; Barlow, M.; Cerezomota, R.; Cherchi, A.; Gan, T.Y. Water cycle change. In Climatic Change, 2021: The Physical Science Basis Contribution of Working Group I to 6th Assessment Report of IPCC; Cambridge University Press: Cambridge, UK, 2021. [Google Scholar]
- IPCC. Climate Change 2007, The Physical Science Basis, Contribution of Working Group I to the Fourth Assessment Report of the Intergovernmental Panel on Climate Change; Cambridge University Press: Cambridge, UK, 2007. [Google Scholar]
- Nooni, I.K.; Hagan, D.F.T.; Wang, G.; Ullah, W.; Li, S.; Lu, J.; Bhatti, A.S.; Shi, X.; Lou, D.; Prempeh, N.A.; et al. Spatiotemporal Characteristics and Trend Analysis of Two Evapotranspiration-Based Drought Products and Their Mechanisms in Sub-Saharan Africa. Remote Sens. 2021, 13, 533. [Google Scholar]
- O′Neill, B.C.; Tebaldi, C.; van Vuuren, D.P.; Eyring, V.; Friedlingstein, P.; Hurtt, G.; Knutti, R.; Kriegler, E.; Lamarque, J.F.; Lowe, J.; et al. The Scenario Model Intercomparison Project (ScenarioMIP) for CMIP6. Geosci. Model Dev. 2016, 9, 3461–3482. [Google Scholar] [CrossRef]
- IPCC. Climate Change 2014: Impacts, Adaptation, and Vulnerability; Cambridge University Press: Cambridge, UK, 2014. [Google Scholar]
- Eyring, V.; Bony, S.; Meehl, G.A.; Senior, C.A.; Stevens, B.; Stouffer, R.J.; Taylor, K.E. Overview of the Coupled Model Intercomparison Project Phase 6 (CMIP6) experimental design and organization. Geosci. Model Dev. 2016, 9, 1937–1958. [Google Scholar] [CrossRef]
- Stouffer, R.J.; Eyring, V.; Meehl, G.A.; Bony, S.; Senior, C.; Stevens, B.; Taylor, K.E. CMIP5 Scientific Gaps and Recommendations for CMIP6. Bull. Am. Meteorol. Soc. 2017, 98, 95–105. [Google Scholar] [CrossRef]
- Voldoire, A.; Saint-Martin, D.; Sénési, S.; Decharme, B.; Alias, A.; Chevallier, M.; Colin, J.; Guérémy, J.-F.; Michou, M.; Moine, M.-P.; et al. Evaluation of CMIP6 DECK Experiments With CNRM-CM6-1. J. Adv. Model. Earth Syst. 2019, 11, 2177–2213. [Google Scholar] [CrossRef]
- Li, M.; Wu, P.; Sexton, D.M.H.; Ma, Z. Potential shifts in climate zones under a future global warming scenario using soil moisture classification. Clim. Dyn. 2021, 56, 2071–2092. [Google Scholar] [CrossRef]
- Beck, H.E.; Zimmermann, N.E.; McVicar, T.R.; Vergopolan, N.; Berg, A.; Wood, E.F. Present and future Köppen-Geiger climate classification maps at 1-km resolution. Sci. Data 2018, 5, 180214. [Google Scholar] [CrossRef]
- Dosio, A.; Turner, A.G.; Tamoffo, A.T.; Sylla, M.B.; Lennard, C.; Jones, R.G.; Terray, L.; Nikulin, G.; Hewitson, B. A tale of two futures: Contrasting scenarios of future precipitation for West Africa from an ensemble of regional climate models. Environ. Res. Lett. 2020, 15, 064007. [Google Scholar] [CrossRef]
- Iturbide, M.; Gutiérrez, J.; Alves, L.; Bedia, J.; Cerezo-Mota, R.; Cimadevilla, E.; Cofiño, A.; Di Luca, A.; Faria, S.; Gorodetskaya, I.; et al. An update of IPCC climate reference regions for subcontinental analysis of climate model data: Definition and aggregated datasets. Earth Syst. Sci. Data 2020, 12, 2959–2970. [Google Scholar] [CrossRef]
- Haile, G.G.; Tang, Q.; Hosseini-Moghari, S.M.; Liu, X.; Gebremicael, T.G.; Leng, G.; Leng, G.; Kebede, A.; Xu, X.; Yun, X. Projected impacts of climate change on drought patterns over East Africa. Earths Future 2020, 8, e2020EF001502. [Google Scholar] [CrossRef]
- Chami, D.E.; Moujabber, M.E. Drought, climate change and sustainability of water in agriculture: A roadmap towards the NWRS2. S. Afr. J. Sci. 2016, 112, 1–4. [Google Scholar] [CrossRef]
- Ahmadalipour, A.; Moradkhani, H.; Castelletti, A.; Magliocca, N. Future drought risk in Africa: Integrating vulnerability, climate change, and population growth. Sci. Total Environ. 2019, 662, 672–686. [Google Scholar] [CrossRef]
- Cook, B.I.; Mankin, J.S.; Anchukaitis, K.J. Climate change and drought: From past to future. Curr. Clim. Chang. Rep. 2018, 4, 164–179. [Google Scholar] [CrossRef]
- Gan, T.Y.; Ito, M.; Hülsmann, S.; Qin, X.; Lu, X.X.; Liong, S.Y.; Rutschman, P.; Disse, M.; Koivusalo, H. Possible climate change/variability and human impacts, vulnerability of drought-prone regions, water resources and capacity building for Africa. Hydrol. Sci. J. 2016, 61, 1209–1226. [Google Scholar] [CrossRef]
- Nooni, I.K.; Hagan, D.F.T.; Wang, G.; Ullah, W.; Lu, J.; Li, S.; Dzakpasu, M.; Prempeh, N.A.; Lim Kam Sian, K.T.C. Future Changes in Simulated Evapotranspiration across Continental Africa Based on CMIP6 CNRM-CM6. Int. J. Environ. Res. Public Health 2021, 18, 6760. [Google Scholar] [CrossRef]
- Brient, F.; Roehrig, R.; Voldoire, A. Evaluating Marine Stratocumulus Clouds in the CNRM-CM6-1 Model Using Short-Term Hindcasts. J. Adv. Model. Earth Syst. 2019, 11, 127–148. [Google Scholar] [CrossRef]
- Volodin, E.M.; Mortikov, E.V.; Kostrykin, S.V.; Galin, V.Y.; Lykossov, V.N.; Gritsun, A.S.; Diansky, N.A.; Gusev, A.V.; Iakovlev, N.G.; Shestakova, A.A.; et al. Simulation of the modern climate using the INM-CM48 climate model. Russ. J. Numer. Anal. Math. Model. 2018, 33, 367–374. [Google Scholar] [CrossRef]
- Wu, T.; Lu, Y.; Fang, Y.; Xin, X.; Li, L.; Li, W.; Jie, W.; Zhang, J.; Liu, Y.; Zhang, L.; et al. The Beijing Climate Center Climate System Model (BCC-CSM): The main progress from CMIP5 to CMIP6. Geosci. Model Dev. 2019, 12, 1573–1600. [Google Scholar] [CrossRef]
- Wyser, K.; van Noije, T.; Yang, S.; von Hardenberg, J.; O’Donnell, D.; Döscher, R. On the increased climate sensitivity in the EC-Earth model from CMIP5 to CMIP6. Geosci. Model Dev. 2020, 13, 3465–3474. [Google Scholar] [CrossRef]
- Wyser, K.; Kjellström, E.; Koenigk, T.; Martins, H.; Döscher, R. Warmer climate projections in EC-Earth3-Veg: The role of changes in the greenhouse gas concentrations from CMIP5 to CMIP6. Environ. Res. Lett. 2020, 15, 054020. [Google Scholar] [CrossRef]
- World Health Organization. The State of Food Security and Nutrition in the World—Transforming Food Systems for Food Security, Improved Nutrition and Affordable Healthy Diets for All; FAO: Rome, Italy, 2021. [Google Scholar]
- Teichmann, C.; Jacob, D.; Remedio, A.R.; Remke, T.; Buntemeyer, L.; Hoffmann, P.; Kriegsmann, A.; Lierhammer, L.; Bülow, K.; Weber, T.; et al. Assessing mean climate change signals in the global CORDEX-CORE ensemble. Clim. Dyn. 2021, 57, 1269–1292. [Google Scholar] [CrossRef]
- Gnitou, G.T.; Tan, G.; Niu, R.; Nooni, I.K. Assessing Past Climate Biases and the Added Value of CORDEX-CORE Precipitation Simulations over Africa. Remote Sens. 2021, 13, 2058. [Google Scholar]
- Voldoire, A.; Sanchez-Gomez, E.; Salas y Mélia, D.; Decharme, B.; Cassou, C.; Sénési, S.; Valcke, S.; Beau, I.; Alias, A.; Chevallier, M.; et al. The CNRM-CM5.1 global climate model: Description and basic evaluation. Clim. Dyn. 2013, 40, 2091–2121. [Google Scholar] [CrossRef]
- Déqué, M.; Dreveton, C.; Braun, A.; Cariolle, D. The ARPEGE/IFS atmosphere model: A contribution to the French community climate modelling. Clim. Dyn. 1994, 10, 249–266. [Google Scholar] [CrossRef]
- Noilhan, J.; Planton, S. A Simple Parameterization of Land Surface Processes for Meteorological Models. Mon. Weather Rev. 1989, 117, 536–549. [Google Scholar] [CrossRef]
- Decharme, B.; Delire, C.; Minvielle, M.; Colin, J.; Vergnes, J.-P.; Alias, A.; Saint-Martin, D.; Séférian, R.; Sénési, S.; Voldoire, A. Recent Changes in the ISBA-CTRIP Land Surface System for Use in the CNRM-CM6 Climate Model and in Global Off-Line Hydrological Applications. J. Adv. Model. Earth Syst. 2019, 11, 1207–1252. [Google Scholar] [CrossRef]
- Masson, V.; Le Moigne, P.; Martin, E.; Faroux, S.; Alias, A.; Alkama, R.; Belamari, S.; Barbu, A.; Boone, A.; Bouyssel, F.; et al. The SURFEXv7.2 land and ocean surface platform for coupled or offline simulation of earth surface variables and fluxes. Geosci. Model Dev. 2013, 6, 929–960. [Google Scholar] [CrossRef]
- Madec, G.; Bourdallé-Badie, R.; Bouttier, P.A.; Bricaud, C.; Bruciaferri, D.; Calvert, D.; Jérôme, C.; Clementi, E.; Coward, A.; Delrosso, D.; et al. NEMO Ocean Engine; Notes du Pôle de Modélisation de l’Institut Pierre-Simon Laplace (IPSL): Singapore, 2017. [Google Scholar] [CrossRef]
- Salas Mélia, D. A global coupled sea ice–ocean model. Ocean. Model. 2002, 4, 137–172. [Google Scholar] [CrossRef]
- Craig, A.; Valcke, S.; Coquart, L. Development and performance of a new version of the OASIS coupler, OASIS3-MCT_3.0. Geosci. Model Dev. 2017, 10, 3297–3308. [Google Scholar] [CrossRef]
- Valcke, S.; Guilyardi, E.; Larsson, C. PRISM and ENES: A European approach to Earth system modelling. Concurr. Comput. Pract. Exp. 2006, 18, 247–262. [Google Scholar] [CrossRef]
- Oki, T.; Sud, Y.C. Design of Total Runoff Integrating Pathways (TRIP)—A Global River Channel Network. Earth Interact. 1998, 2, 1–37. [Google Scholar] [CrossRef]
- Meurdesoif, Y. Xios Fortran Reference Guide; IPSL: Singapore, 2018. [Google Scholar]
- Almazroui, M.; Saeed, F.; Saeed, S.; Nazrul Islam, M.; Ismail, M.; Klutse, N.A.B.; Siddiqui, M.H. Projected Change in Temperature and Precipitation Over Africa from CMIP6. Earth Syst. Environ. 2020, 4, 455–475. [Google Scholar] [CrossRef]
- Lim Kam Sian, K.T.C.; Wang, J.; Ayugi, B.O.; Nooni, I.K.; Ongoma, V. Multi-Decadal Variability and Future Changes in Precipitation over Southern Africa. Atmosphere 2021, 12, 742. [Google Scholar] [CrossRef]
- WCRP CMIP6. WCRP Coupled Model Intercomparison Project (Phase 6) Homepage. Available online: https://esgf-node-.llnl.gov/projects/cmip6/ (accessed on 10 January 2020).
- Van Vuuren, D.P.; Edmonds, J.; Kainuma, M.; Riahi, K.; Thomson, A.; Hibbard, K.; Hurtt, G.C.; Kram, T.; Krey, V.; Lamarque, J.-F.; et al. The representative concentration pathways: An overview. Clim. Chang. 2011, 109, 5. [Google Scholar] [CrossRef]
- Dai, A. Characteristics and trends in various forms of the Palmer Drought Severity Index during 1900–2008. J. Geophys. Res. Atmos. 2011, 116, D12115. [Google Scholar] [CrossRef]
- Taylor, I.H.; Burke, E.; McColl, L.; Falloon, P.D.; Harris, G.R.; McNeall, D. The impact of climate mitigation on projections of future drought. Hydrol. Earth Syst. Sci. 2013, 17, 2339–2358. [Google Scholar] [CrossRef]
- Nooni, I.K.; Wang, G.; Hagan, D.F.T.; Lu, J.; Ullah, W.; Li, S. Evapotranspiration and its Components in the Nile River Basin Based on Long-Term Satellite Assimilation Product. Water 2019, 11, 1400. [Google Scholar]
- Yevjevich, V. An objective approach to definitions and investigations of continental hydrologic droughts. Hydrol. Pap. 1969, 23, 1–18. [Google Scholar]
- Mann, H.B. Non-parametric tests against trend. Econometrica 1945, 13, 245–259. [Google Scholar] [CrossRef]
- Kendall, M. Rank Correlation Measures; Charles Griffin: London, UK, 1975. [Google Scholar]
- Sen, P.K. Estimates of the regression coefficients based on Kendall’s tau. J. Am. Stat. Assoc. 1968, 63, 1379–1389. [Google Scholar] [CrossRef]
- Ullah, W.; Wang, G.; Ali, G.; Tawia Hagan, D.F.; Bhatti, A.S.; Lou, D. Comparing Multiple Precipitation Products against In-Situ Observations over Different Climate Regions of Pakistan. Remote Sens. 2019, 11, 628. [Google Scholar]
- Ullah, W.; Wang, G.; Lou, D.; Ullah, S.; Bhatti, A.S.; Ullah, S.; Karim, A.; Hagan, D.F.T.; Ali, G. Large-scale atmospheric circulation patterns associated with extreme monsoon precipitation in Pakistan during 1981–2018. Atmos. Res. 2021, 253, 105489. [Google Scholar] [CrossRef]
- Ayugi, B.; Dike, V.; Ngoma, H.; Babaousmail, H.; Mumo, R.; Ongoma, V. Future Changes in Precipitation Extremes over East Africa Based on CMIP6 Models. Water 2021, 13, 2358. [Google Scholar] [CrossRef]
- Ajayi, V.O.; Ilori, O.W. Projected Drought Events over West Africa Using RCA4 Regional Climate Model. Earth Syst. Environ. 2020, 4, 329–348. [Google Scholar] [CrossRef]
- Akinsanola, A.A.; Zhou, W. Projection of West African summer monsoon rainfall in dynamically downscaled CMIP5 models. Clim. Dyn. 2019, 53, 81–95. [Google Scholar] [CrossRef]
- Faye, A.; Akinsanola, A.A. Evaluation of extreme precipitation indices over West Africa in CMIP6 models. Clim. Dyn. 2022, 58, 925–939. [Google Scholar] [CrossRef]
- Shongwe, M.E.; van Oldenborgh, G.J.; van den Hurk, B.J.J.M.; de Boer, B.; Coelho, C.A.S.; van Aalst, M.K. Projected Changes in Mean and Extreme Precipitation in Africa under Global Warming. Part I: Southern Africa. J. Clim. 2009, 22, 3819–3837. [Google Scholar] [CrossRef]
- Makula, E.K.; Zhou, B. Coupled Model Intercomparison Project phase 6 evaluation and projection of East African precipitation. Int. J. Climatol. 2022, 42, 2398–2412. [Google Scholar] [CrossRef]
- Bellprat, O.; Lott, F.; Gulizia, C.; Young, H.; Pampuch, L.; Pinto, I.; Ciavarella, A.; Stott, P. Unusual past dry and wet rainy seasons over Southern Africa and South America from a climate perspective. Weather Clim. Extrem. 2015, 9, 36–46. [Google Scholar] [CrossRef]
- Driouech, F.; ElRhaz, K.; Moufouma-Okia, W.; Arjdal, K.; Balhane, S. Assessing Future Changes of Climate Extreme Events in the CORDEX-MENA Region Using Regional Climate Model ALADIN-Climate. Earth Syst. Environ. 2020, 4, 477–492. [Google Scholar] [CrossRef]
- Munday, C.; Washington, R. Controls on the Diversity in Climate Model Projections of Early Summer Drying over Southern Africa. J. Clim. 2019, 32, 3707–3725. [Google Scholar] [CrossRef]
- Murphy, J.M.; Sexton, D.M.H.; Barnett, D.N.; Jones, G.S.; Webb, M.J.; Collins, M.; Stainforth, D.A. Quantification of modelling uncertainties in a large ensemble of climate change simulations. Nature 2004, 430, 768–772. [Google Scholar] [CrossRef]
- Iyakaremye, V.; Zeng, G.; Yang, X.; Zhang, G.; Ullah, I.; Gahigi, A.; Vuguziga, F.; Asfaw, T.G.; Ayugi, B. Increased high-temperature extremes and associated population exposure in Africa by the mid-21st century. Sci. Total Environ. 2021, 790, 148162. [Google Scholar] [CrossRef]
- Donat, M.G.; Lowry, A.L.; Alexander, L.V.; O’Gorman, P.A.; Maher, N. More extreme precipitation in the world’s dry and wet regions. Nat. Clim. Chang. 2016, 6, 508–513. [Google Scholar] [CrossRef]
- Babaousmail, H.; Hou, R.; Ayugi, B.; Ojara, M.; Ngoma, H.; Karim, R.; Rajasekar, A.; Ongoma, V. Evaluation of the Performance of CMIP6 Models in Reproducing Rainfall Patterns over North Africa. Atmosphere 2021, 12, 475. [Google Scholar] [CrossRef]
- Lee, J.Y.; Wang, B. Future change of global monsoon in CMIP5. Clim. Dyn. 2014, 42, 101–119. [Google Scholar] [CrossRef]
- Kitoh, A.; Endo, H.; Kumar, K.K.; Cavalcanti, I.F.A.; Goswami, P.; Zhou, T. Monsoons in a changing world: A regional perspective in a global context. J. Geophys. Res. Atmos. 2013, 118, 3053–3065. [Google Scholar] [CrossRef]
- Dirmeyer, P.A. The terrestrial segment of soil moisture-climate coupling. Geophys. Res. Lett. 2011, 38, L16702. [Google Scholar] [CrossRef]
- Koster, R.D.; Dirmeyer, P.A.; Guo, Z.; Bonan, G.; Chan, E.; Cox, P.; Gordon, C.T.; Kanae, S.; Kowalczyk, E.; Lawrence, D.; et al. Regions of strong coupling between soil moisture and precipitation. Science 2004, 305, 1138–1140. [Google Scholar] [CrossRef]
- Berg, A.; Sheffield, J. Soil Moisture-Evapotranspiration Coupling in CMIP5 Models: Relationship with Simulated Climate and Projections. J. Clim. 2018, 31, 4865–4878. [Google Scholar] [CrossRef]
- Dosio, A.; Jury, M.W.; Almazroui, M.; Ashfaq, M.; Diallo, I.; Engelbrecht, F.A.; Klutse, N.A.B.; Lennard, C.; Pinto, I.; Sylla, M.B.; et al. Projected future daily characteristics of African precipitation based on global (CMIP5, CMIP6) and regional (CORDEX, CORDEX-CORE) climate models. Clim. Dyn. 2021, 57, 3135–3158. [Google Scholar] [CrossRef]
- Pinto, I.; Lennard, C.; Tadross, M.; Hewitson, B.; Dosio, A.; Nikulin, G.; Panitz, H.-J.; Shongwe, M.E. Evaluation and projections of extreme precipitation over southern Africa from two CORDEX models. Clim. Chang. 2016, 135, 655–668. [Google Scholar] [CrossRef]
- Skoulikaris, C.; Venetsanou, P.; Lazoglou, G.; Anagnostopoulou, C.; Voudouris, K. Spatio-Temporal Interpolation and Bias Correction Ordering Analysis for Hydrological Simulations: An Assessment on a Mountainous River Basin. Water 2022, 14, 660. [Google Scholar] [CrossRef]
- Chen, J.; Brissette, F.P.; Chaumont, D.; Braun, M. Finding Appropriate Bias Correction Methods in Downscaling Precipitation for Hydrologic Impact Studies over North America. Water Resour. Res. 2013, 49, 4187–4205. [Google Scholar] [CrossRef]
- Teutschbein, C.; Seibert, J. Bias correction of regional climate model simulations for hydrological climate-change impact studies: Review and evaluation of different methods. J. Hydrol. 2012, 456, 12–29. [Google Scholar] [CrossRef]
- Shi, Y.; Shen, Y.; Kang, E.; Li, D.; Ding, Y.; Zhang, G.; Hu, R. Recent and future climate change in northwest China. Clim. Chang. 2007, 80, 379–393. [Google Scholar] [CrossRef]
Publisher’s Note: MDPI stays neutral with regard to jurisdictional claims in published maps and institutional affiliations. |
© 2022 by the authors. Licensee MDPI, Basel, Switzerland. This article is an open access article distributed under the terms and conditions of the Creative Commons Attribution (CC BY) license (https://creativecommons.org/licenses/by/4.0/).