
Early Diagnosis of Huntington Disease: Insights from Magnetic Resonance Spectroscopy—A Systematic Review
 ,
,  , and
, and 
Abstract
1. Introduction
2. Materials and Methods
2.1. Eligibility Criteria
2.2. Search Strategy
2.3. Data Management
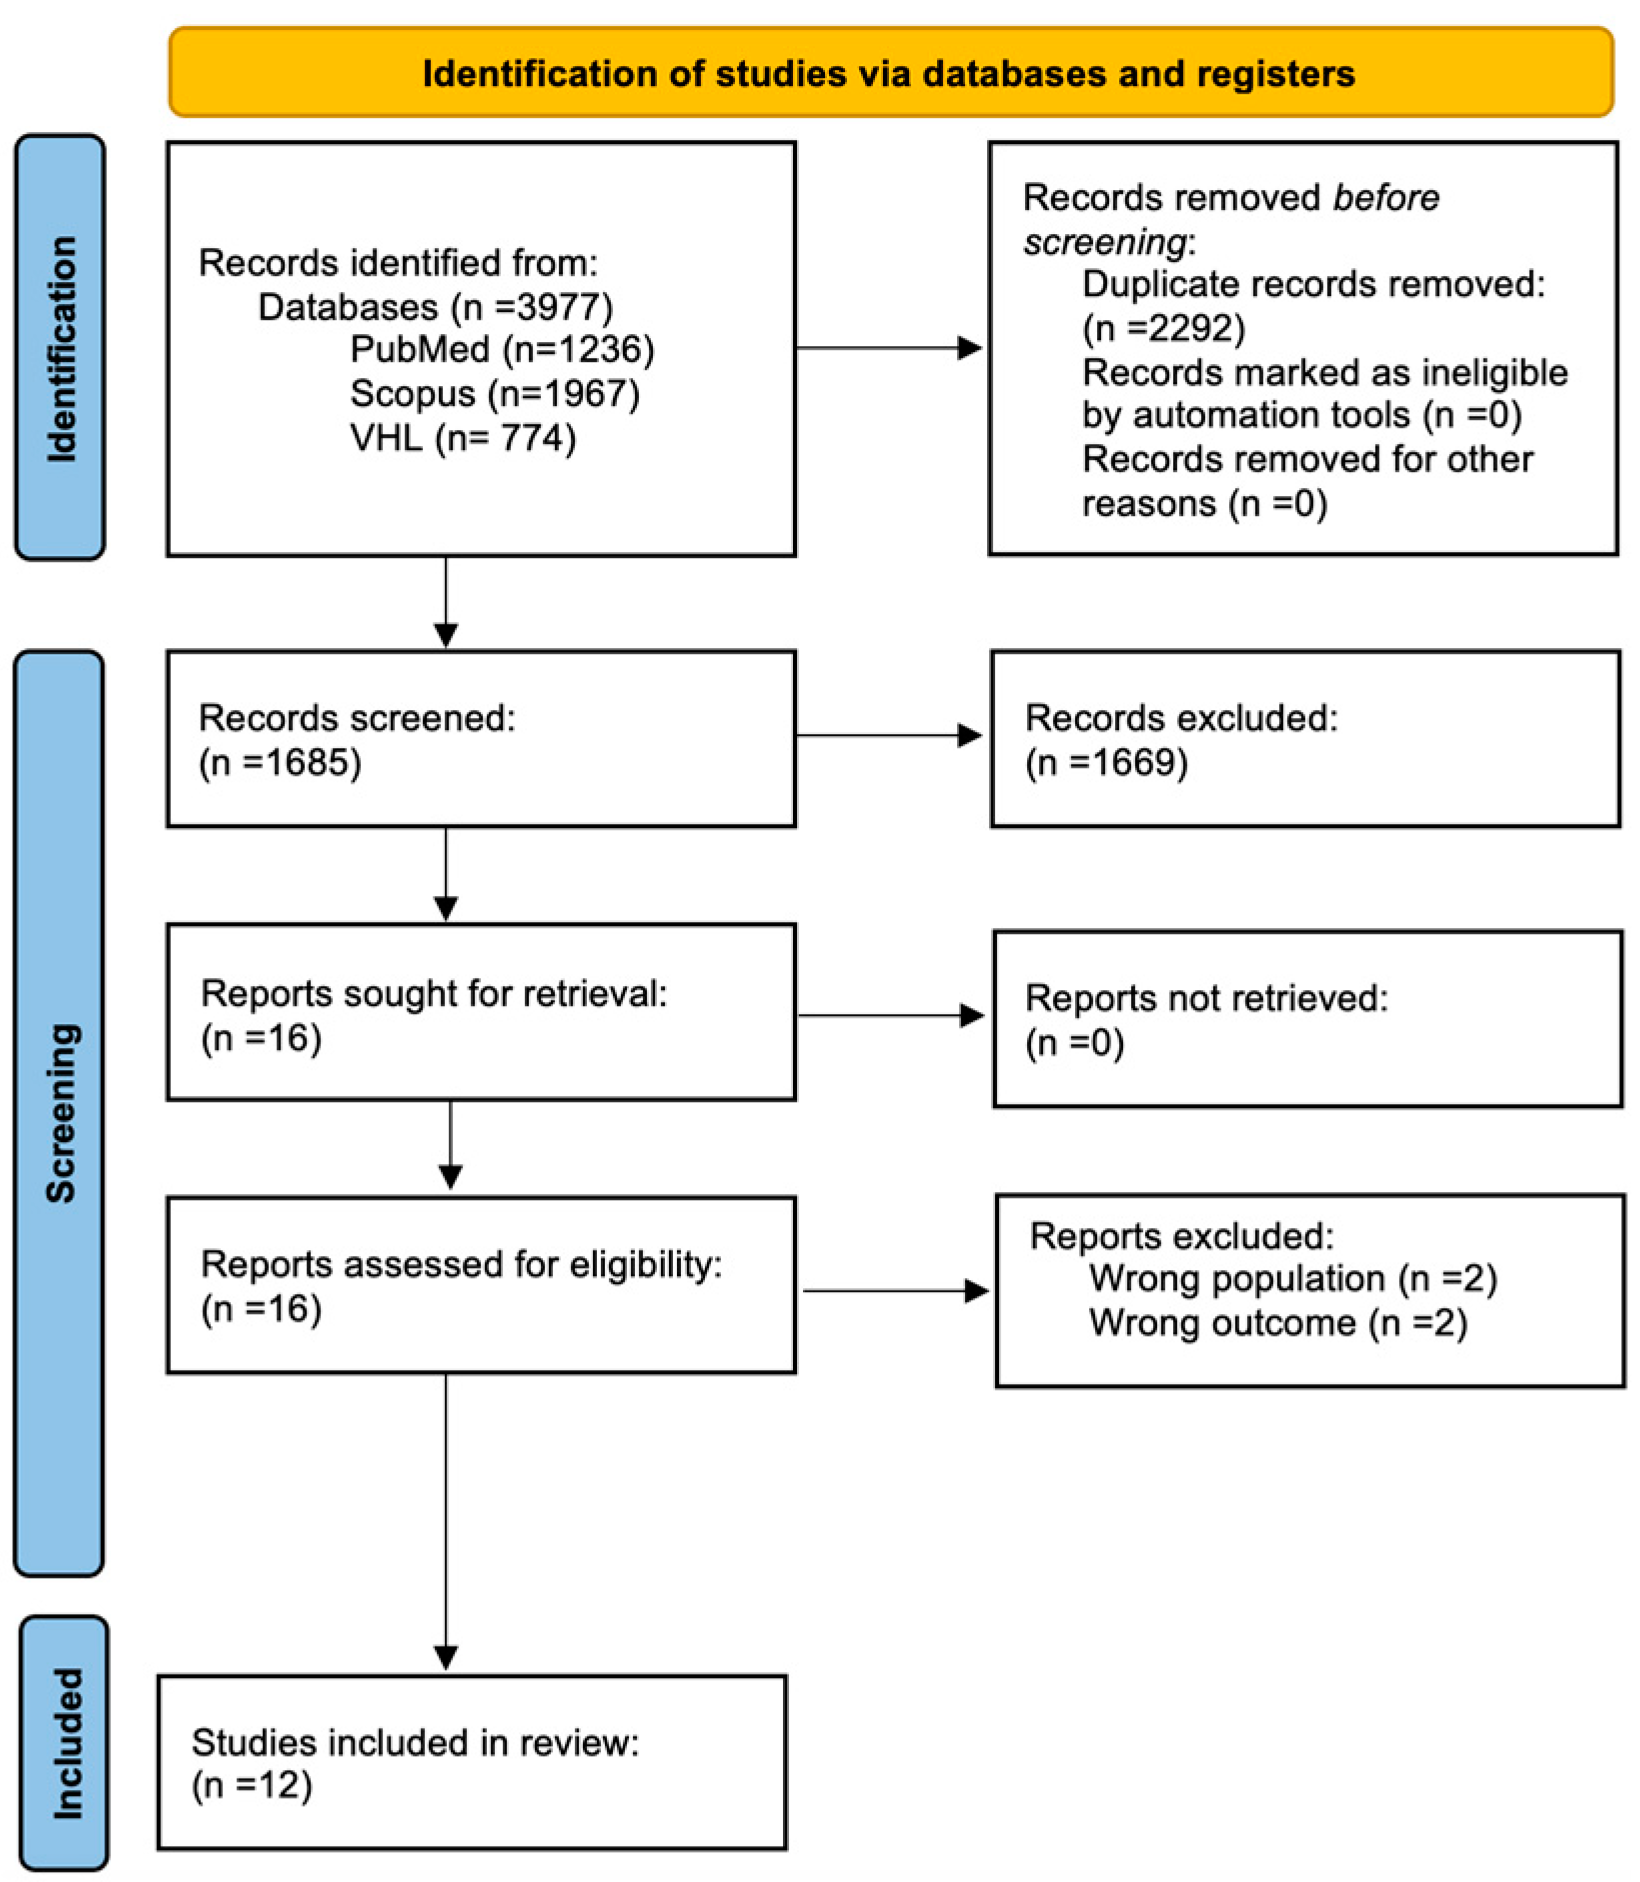
2.4. Selection Process
2.5. Data Items
2.6. Data Synthesis
2.7. Risk of Bias
3. Results
3.1. Magnetic Resonance Spectroscopy—Technical Characteristics
3.2. Brain Metabolites
3.3. Changes Per Anatomical Area
3.3.1. Frontal Cortex
3.3.2. Occipital Cortex
3.3.3. Prefrontal Cortex and Hypothalamus
3.3.4. Thalamus
3.3.5. Striatum
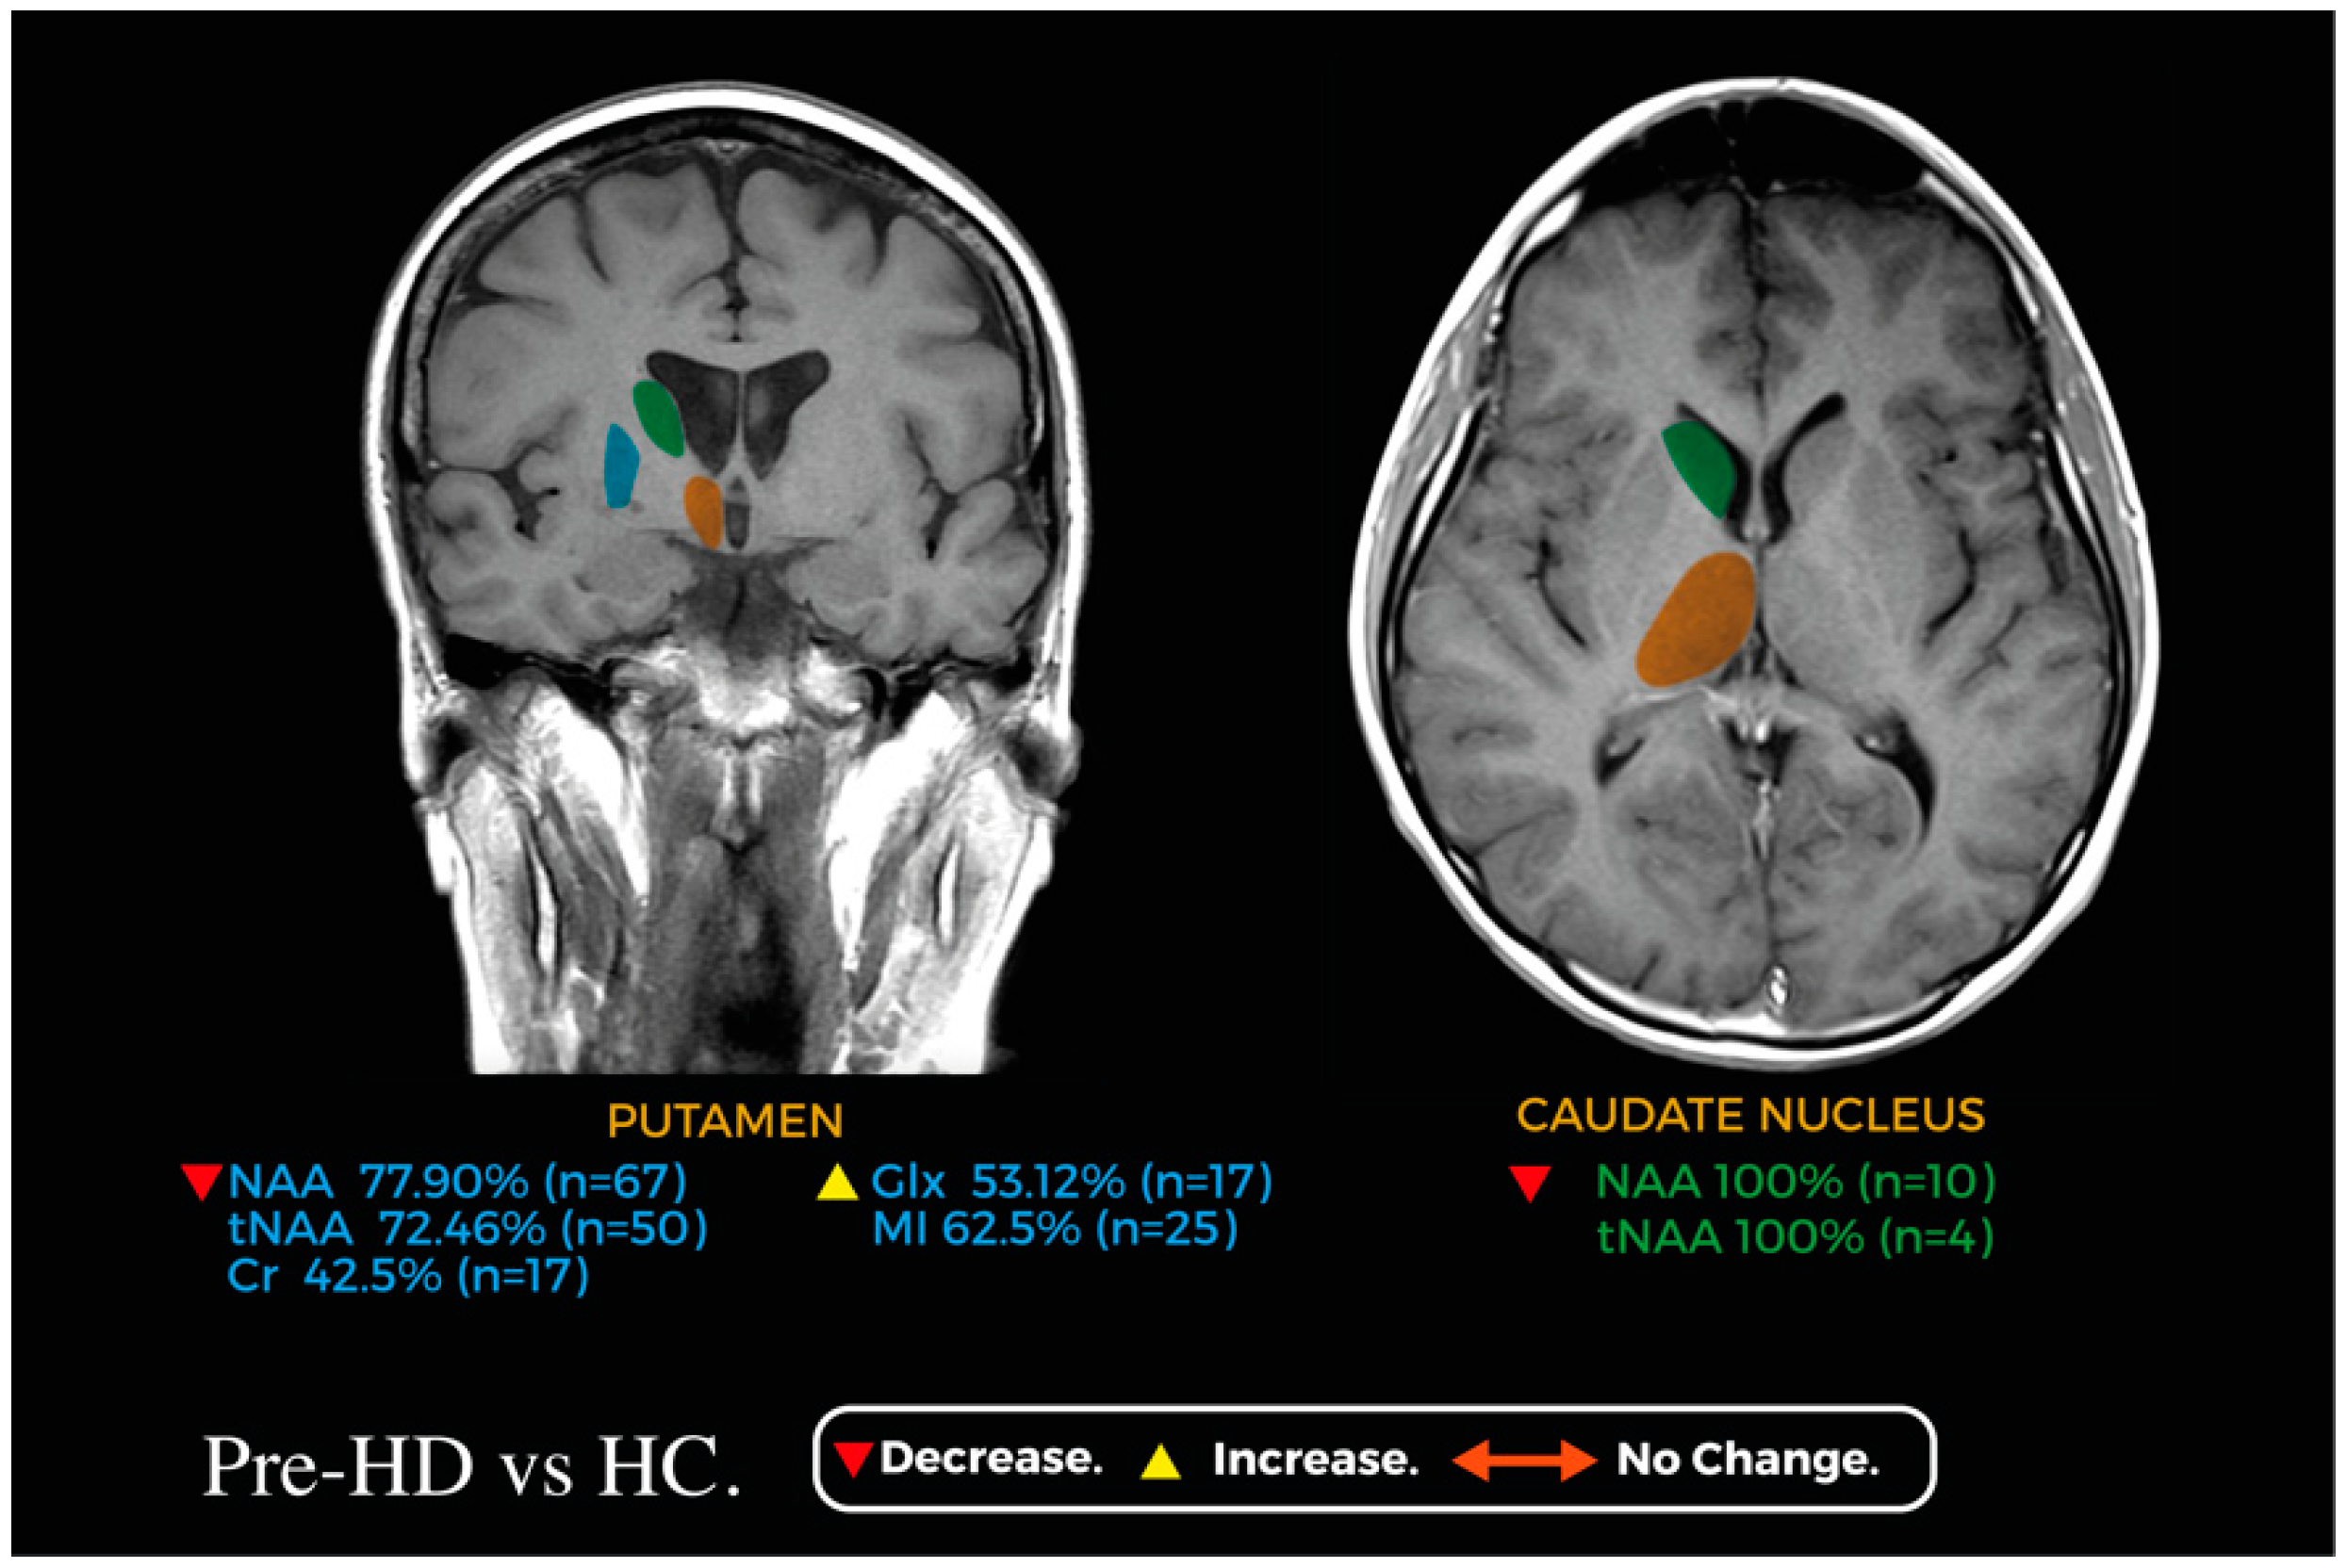
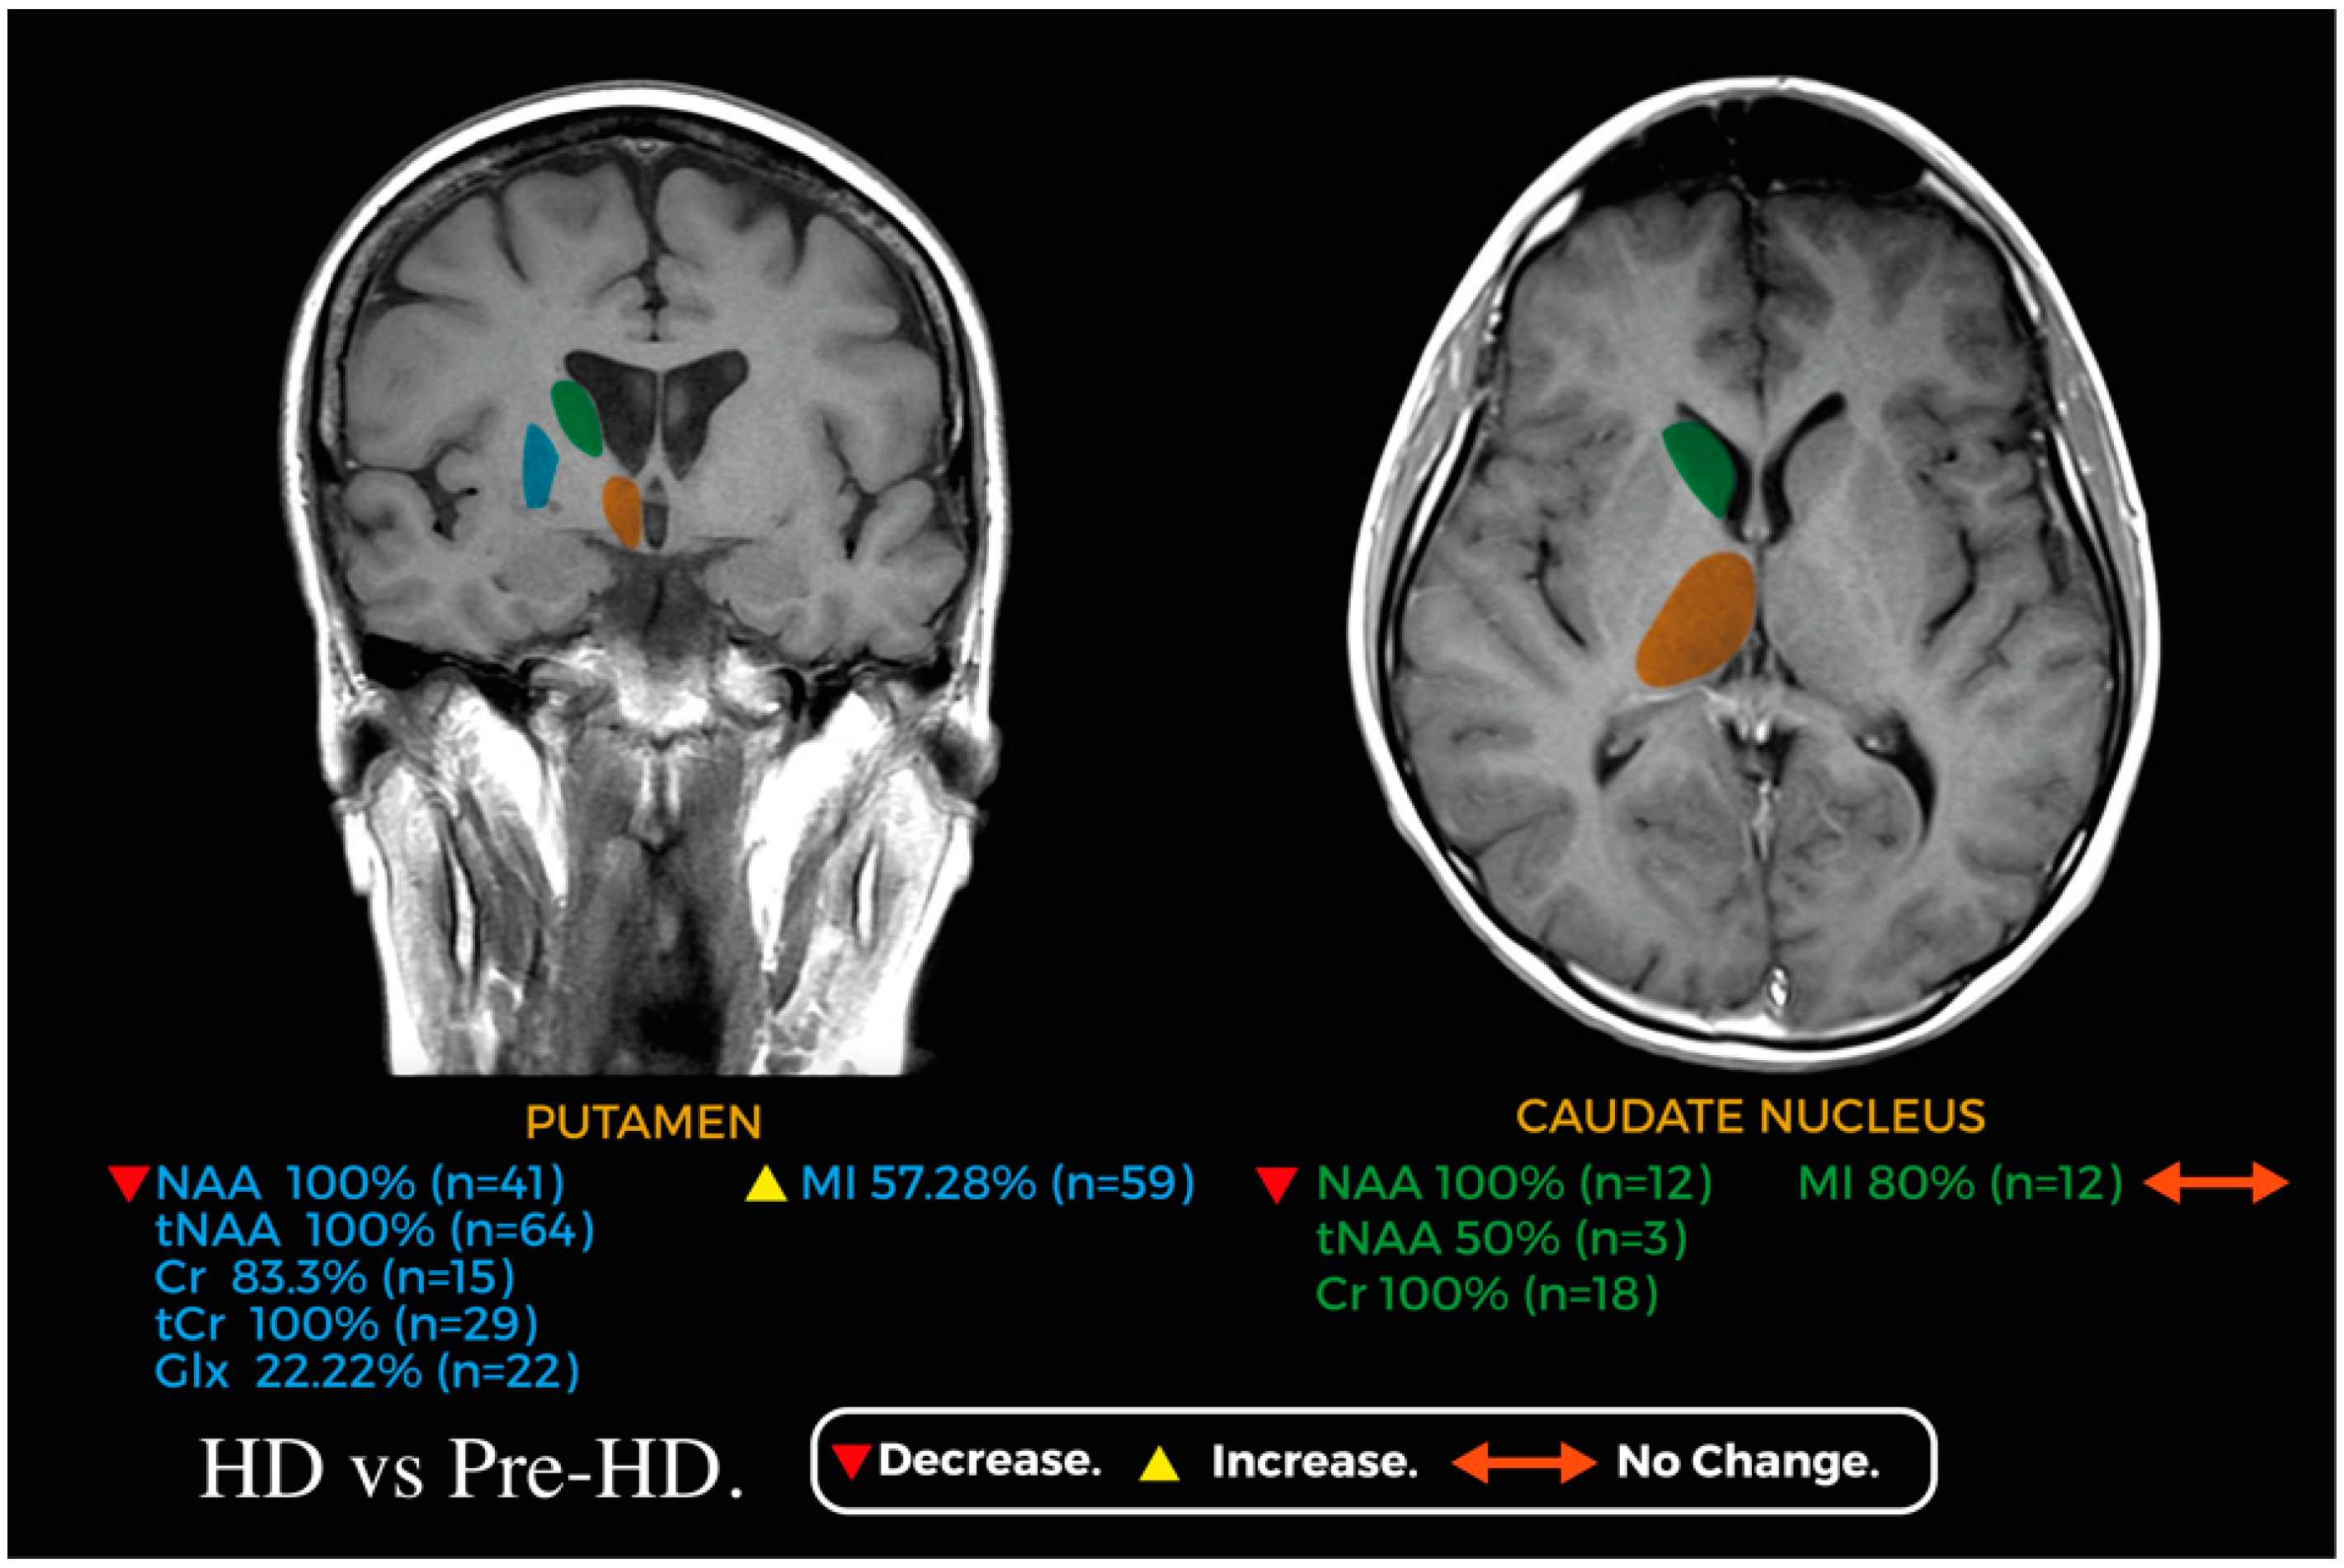
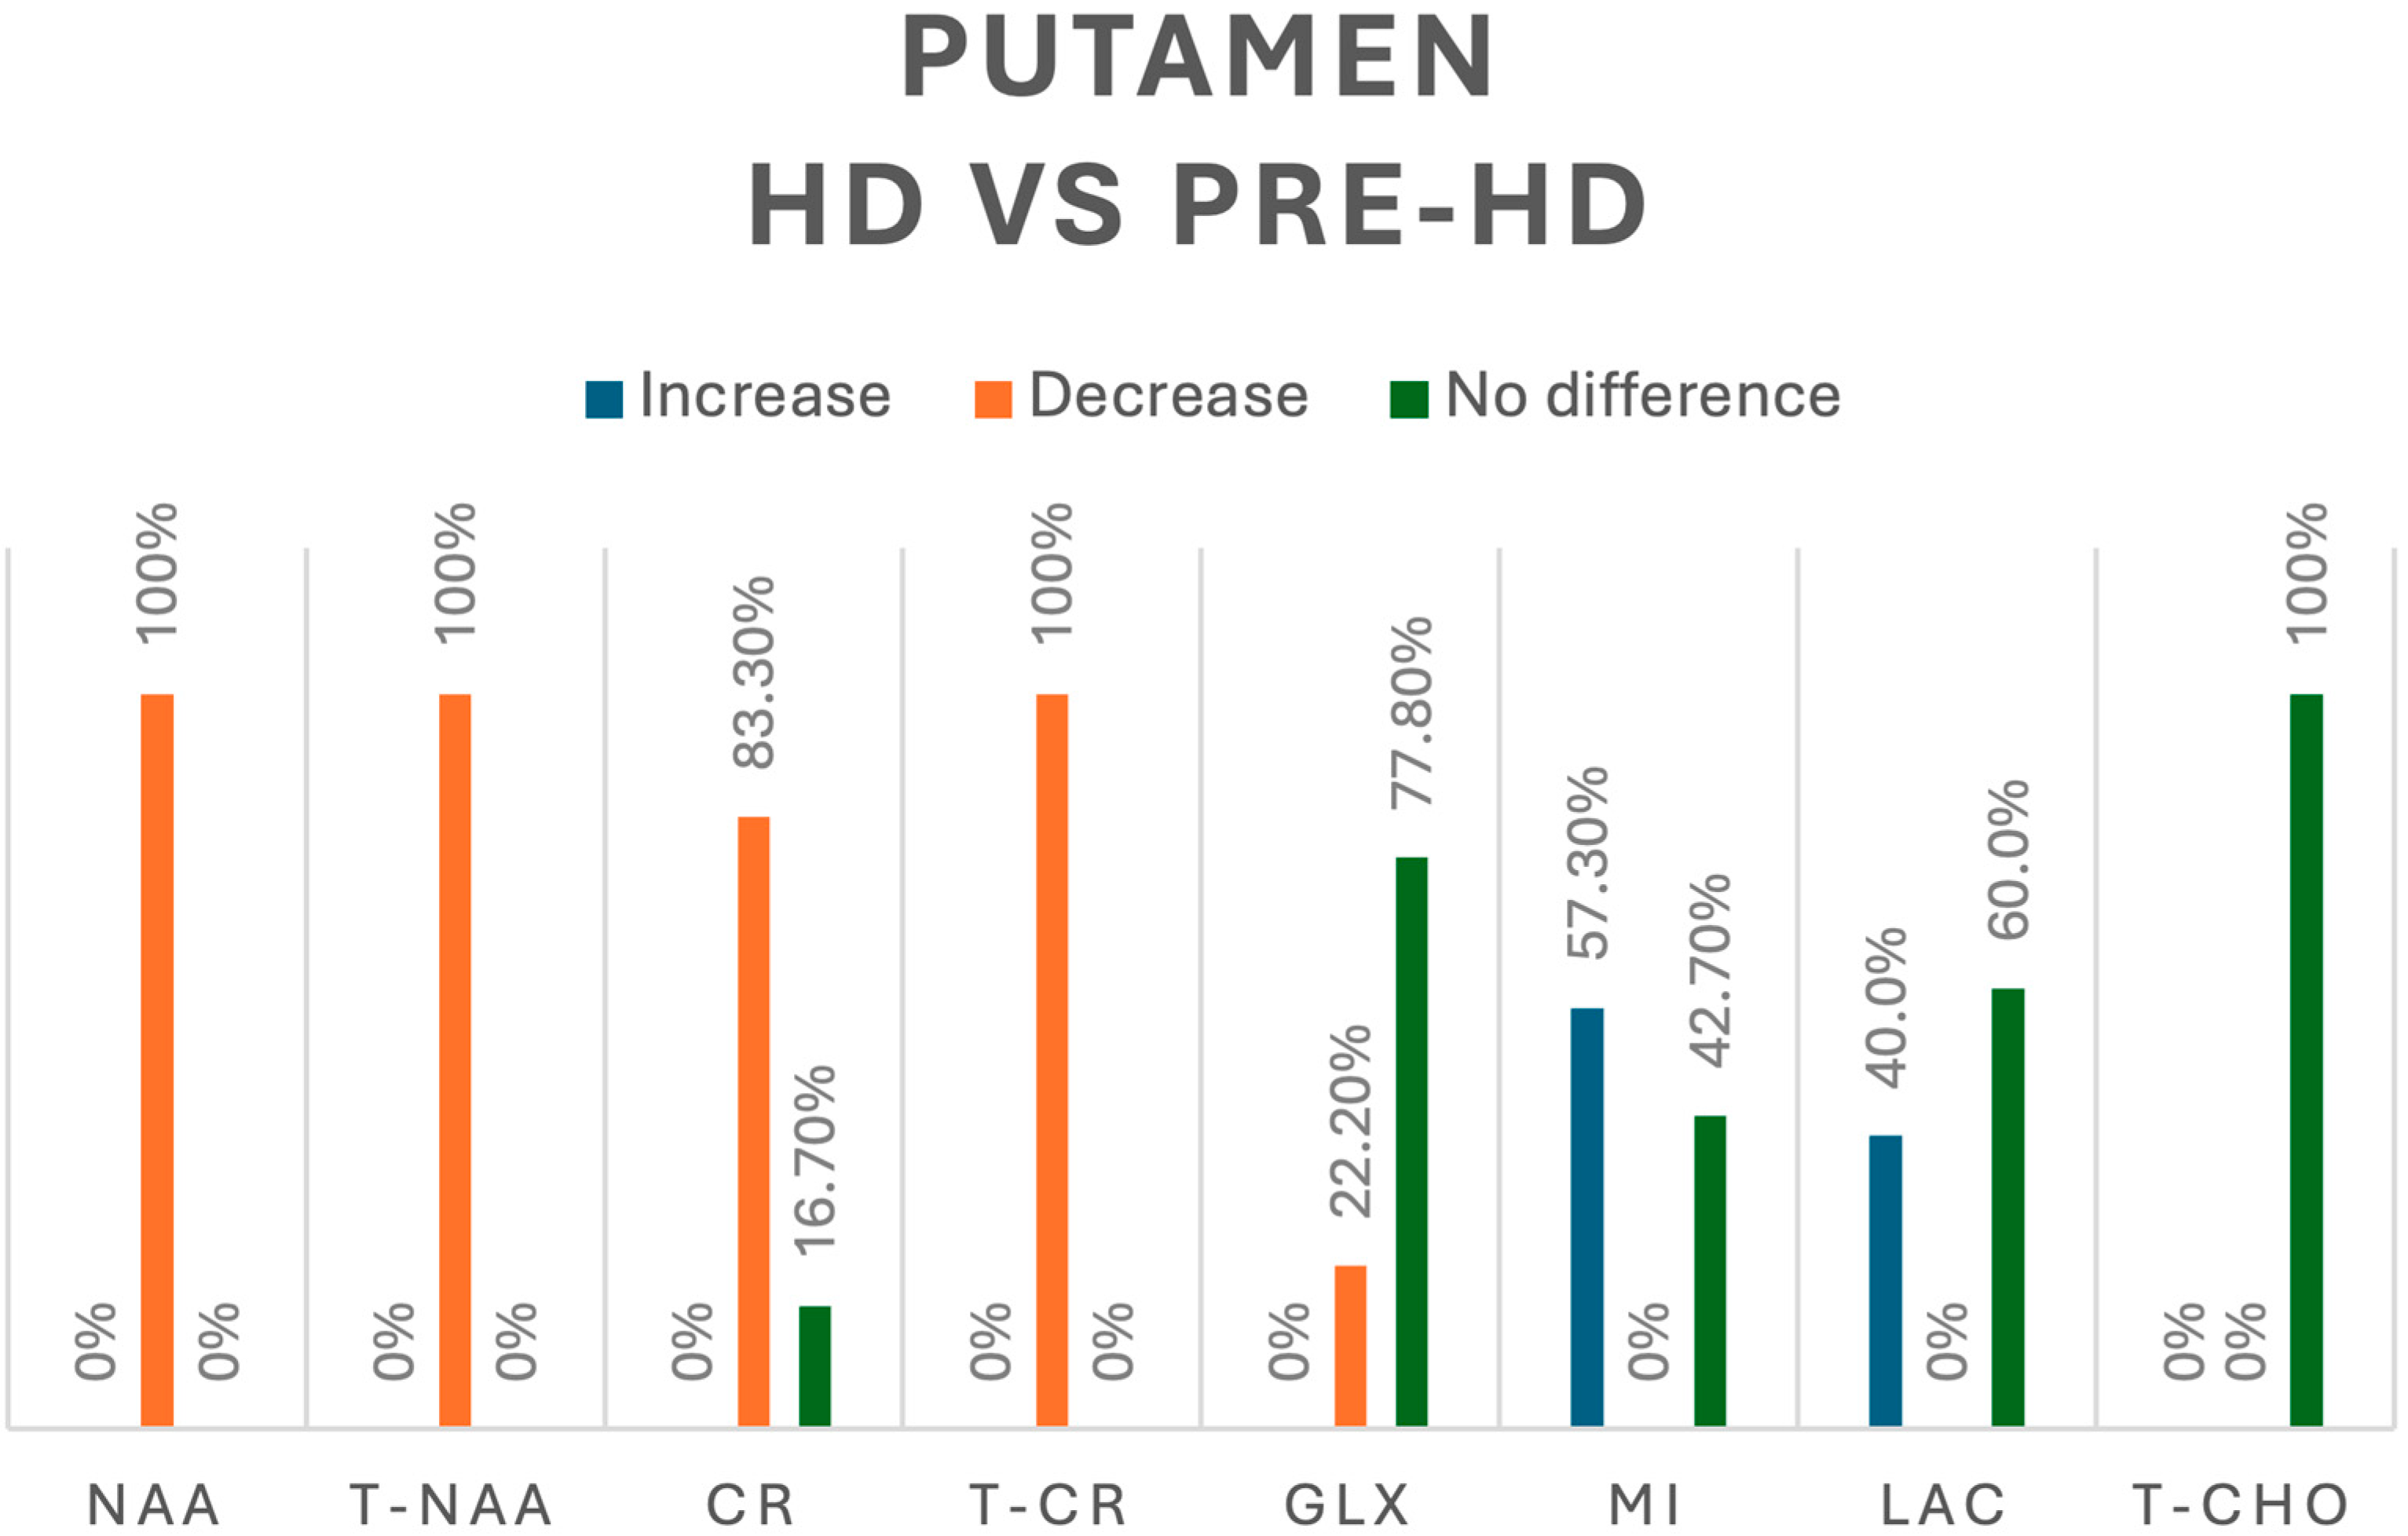
3.3.6. Putamen
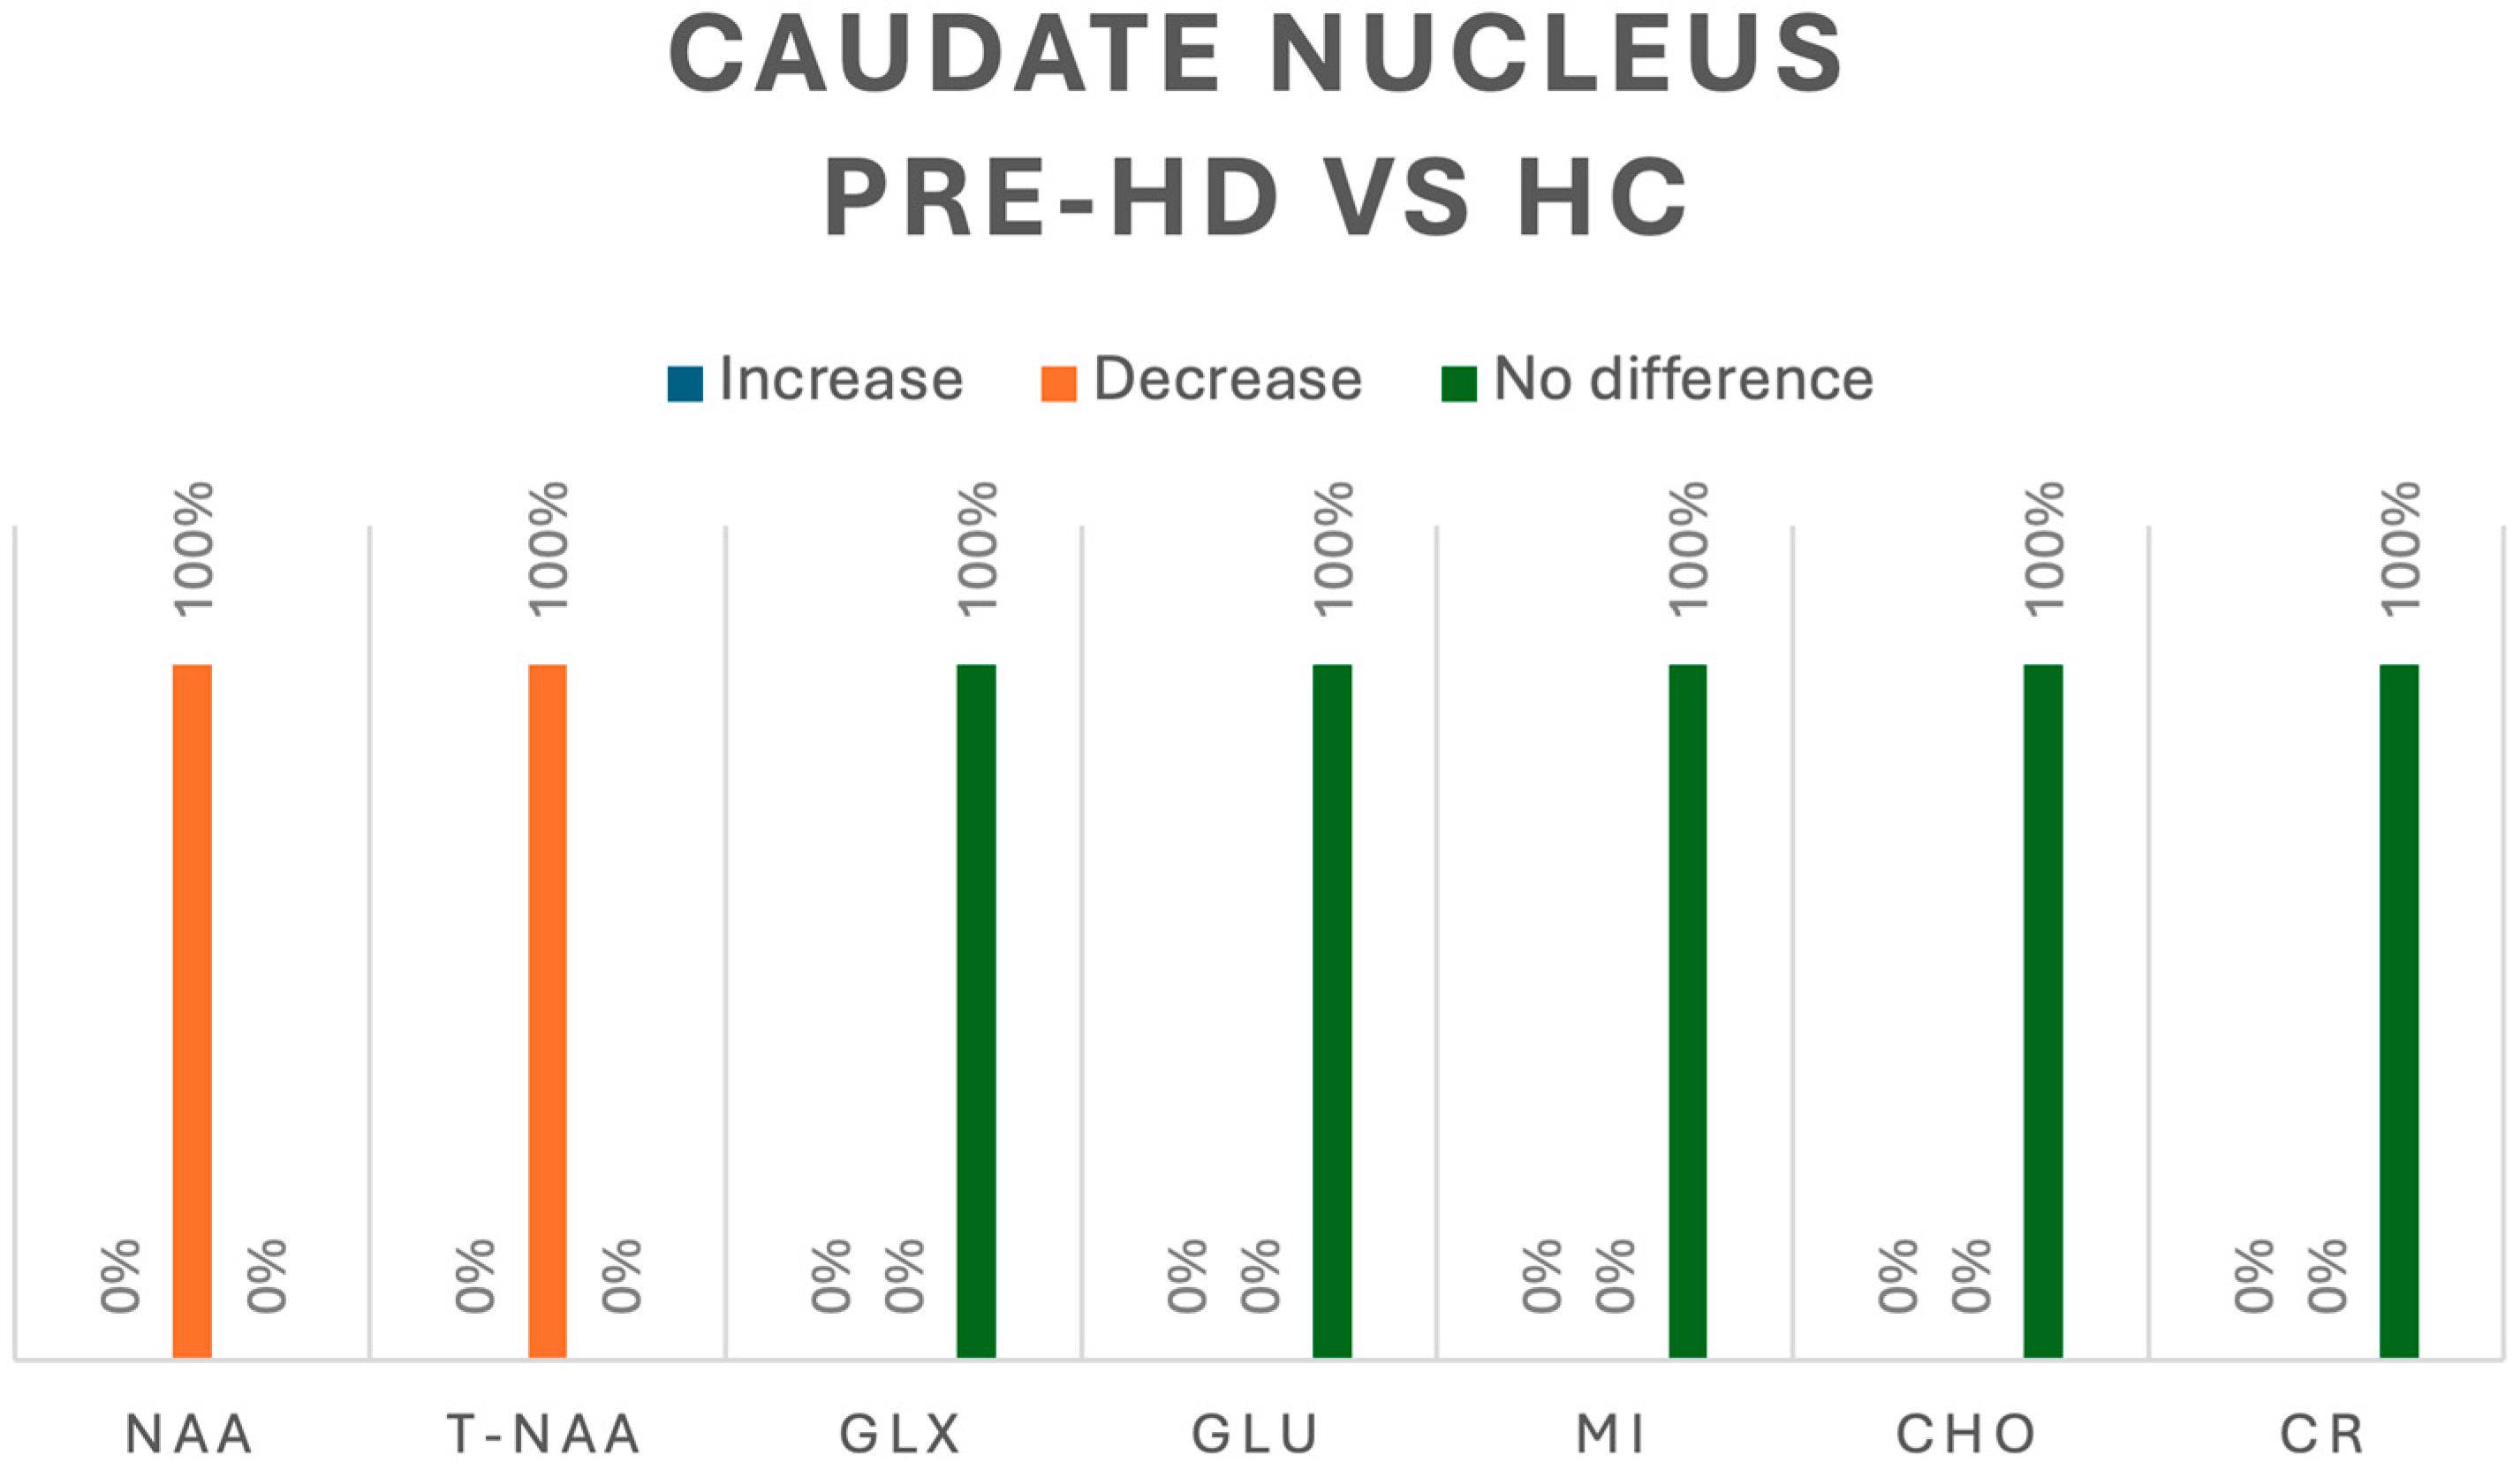
3.3.7. Caudate Nucleus
4. Discussion
Limitations
5. Conclusions
Supplementary Materials
Author Contributions
Funding
Institutional Review Board Statement
Informed Consent Statement
Data Availability Statement
Conflicts of Interest
References
- Stoker, T.B.; Mason, S.L.; Greenland, J.C.; Holden, S.T.; Santini, H.; Barker, R.A. Huntington’s disease: Diagnosis and management. Pract. Neurol. 2022, 22, 32–41. [Google Scholar] [CrossRef] [PubMed]
- McColgan, P.; Tabrizi, S.J. Huntington’s disease: A clinical review. Eur. J. Neurol. 2018, 25, 24–34. [Google Scholar] [CrossRef] [PubMed]
- Walker, F.O. Huntington’s disease. Lancet 2007, 369, 218–228. [Google Scholar] [CrossRef] [PubMed]
- Zhu, H.; Barker, P.B. MR Spectroscopy and Spectroscopic Imaging of the Brain. In Methods in Molecular Biology; Humana Press Inc.: Totowa, NJ, USA, 2011; pp. 203–226. [Google Scholar]
- Padowski, J.M.; Weaver, K.E.; Richards, T.L.; Laurino, M.Y.; Samii, A.; Aylward, E.H.; Conley, K.E. Neurochemical correlates of caudate atrophy in Huntington’s disease. Mov. Disord. 2014, 29, 327–335. Available online: https://pubmed.ncbi.nlm.nih.gov/24442623/ (accessed on 2 February 2024). [CrossRef] [PubMed]
- Harms, L.; Meierkord, H.; Timm, G.; Pfeiffer, L.; Ludolph, A.C. Decreased N-acetyl-aspartate/choline ratio and increased lactate in the frontal lobe of patients with Huntington’s disease: A proton magnetic resonance spectroscopy study. J. Neurol. Neurosurg. Psychiatry 1997, 62, 27–30. [Google Scholar] [CrossRef]
- Alcauter-Solorzano, S.; Pasaye-Alcaraz, E.H.; Alvarado-Alanis, P.; Fermin-Delgado, R.O.; Alonso-Vilatela, M.E.; Salgado-Lujambio, P.; Barrios, F.A. Hydrogen magnetic resonance quantitative spectroscopy at 3 T in symptomatic and asymptomatic Huntington’s disease patients. Rev. Neurol. 2010, 51, 208–212. Available online: https://pubmed.ncbi.nlm.nih.gov/20648464/ (accessed on 2 February 2024).
- Sturrock, A.; Laule, C.; Decolongon, J.; Santos, R.D.; Coleman, A.; Creighton, S.; Bechtel, N.; Reilmann, R.; Hayden, M.; Tabrizi, S.; et al. Magnetic resonance spectroscopy biomarkers in premanifest and early Huntington disease. Neurology 2010, 75, 1702–1710. [Google Scholar] [CrossRef]
- van Oostrom, J.C.; Sijens, P.E.; Roos, R.A.; Leenders, K.L. 1H magnetic resonance spectroscopy in preclinical Huntington disease. Brain Res. 2007, 1168, 67–71. Available online: https://pubmed.ncbi.nlm.nih.gov/17707354/ (accessed on 2 February 2024). [CrossRef]
- Bogaard, S.J.A.v.D.; Dumas, E.M.; Teeuwisse, W.M.; Kan, H.E.; Webb, A.; Roos, R.A.C.; Grond, J. Exploratory 7-Tesla magnetic resonance spectroscopy in Huntington’s disease provides in vivo evidence for impaired energy metabolism. J. Neurol. 2011, 258, 2230–2239. [Google Scholar] [CrossRef]
- Jenkins, B.G.; Rosas, H.D.; Chen, Y.C.; Makabe, T.; Myers, R.; MacDonald, M.; Rosen, B.R.; Beal, M.F.; Koroshetz, W.J. 1 H NMR spectroscopy studies of Huntington’s disease. Neurology 1998, 50, 1357–1365. [Google Scholar] [CrossRef]
- Sánchez–Pernaute, R.; García–Segura, J.; Alba, A.d.B.; Viaño, J.; de Yébenes, J. Clinical correlation of striatal 1H MRS changes in Huntington’s disease. Neurology 1999, 53, 806. Available online: https://pubmed.ncbi.nlm.nih.gov/10489045/ (accessed on 2 February 2024). [CrossRef] [PubMed]
- Reynolds, N.C.; Prost, R.W.; Mark, L.P. Heterogeneity in 1H-MRS profiles of presymptomatic and early manifest Huntington’s disease. Brain Res. 2005, 1031, 82–89. [Google Scholar] [CrossRef] [PubMed]
- van den Bogaard, S.J.; Dumas, E.M.; Teeuwisse, W.M.; Kan, H.E.; Webb, A.; van Buchem, M.A.; Roos, R.A.; van der Grond, J. Longitudinal metabolite changes in Huntington’s disease during disease onset. J. Huntingt. Dis. 2014, 3, 377–386. Available online: https://pubmed.ncbi.nlm.nih.gov/25575959/ (accessed on 2 February 2024). [CrossRef] [PubMed]
- Sturrock, A.; Laule, C.; Wyper, K.; Milner, R.A.; Decolongon, J.; Santos, R.D.; Coleman, A.J.; Carter, K.; Creighton, S.; Bechtel, N.; et al. A longitudinal study of magnetic resonance spectroscopy Huntington’s disease biomarkers. Mov. Disord. 2015, 30, 393–401. [Google Scholar] [CrossRef]
- Lowe, A.J.; Rodrigues, F.B.; Arridge, M.; De Vita, E.; Johnson, E.B.; I Scahill, R.; Byrne, L.M.; Tortelli, R.; Heslegrave, A.; Zetterberg, H.; et al. Longitudinal evaluation of proton magnetic resonance spectroscopy metabolites as biomarkers in Huntington’s disease. Brain Commun. 2022, 4, fcac258. [Google Scholar] [CrossRef]
- Tsai, G.; Coyle, J.T. N-Acetylaspartate in neuropsychiatric disorders. Prog. Neurobiol. 1995, 46, 531–540. [Google Scholar] [CrossRef]
- Verma, M.; Lizama, B.N.; Chu, C.T. Excitotoxicity, calcium and mitochondria: A triad in synaptic neurodegeneration. Transl. Neurodegener. 2022, 11, 3. [Google Scholar] [CrossRef]
- Sepers, M.D.; Raymond, L.A. Mechanisms of synaptic dysfunction and excitotoxicity in Huntington’s disease. Drug Discov. Today 2014, 19, 990–996. [Google Scholar] [CrossRef]
- Genovese, G.; Palombo, M.; Santin, M.D.; Valette, J.; Ligneul, C.; Aigrot, M.-S.; Abdoulkader, N.; Langui, D.; Millecamps, A.; Baron-Van Evercooren, A.; et al. Inflammation-Driven Glial Alterations in the Cuprizone Mouse Model Probed with Diffusion-Weighted Magnetic Resonance Spectroscopy at 11.7 T. NMR Biomed. 2021, 34, e4480. [Google Scholar] [CrossRef]
- Halliday, G.M.; Mcritchie, D.A.; Macdonald, V.; Double, K.L.; Trent, R.J.; Mccusker, E. Regional Specificity of Brain Atrophy in Huntington’s Disease. Exp. Neurol. 1998, 154, 663–672. [Google Scholar] [CrossRef]
- Kronenbuerger, M.; Hua, J.; Bang, J.Y.; Ultz, K.E.; Miao, X.; Zhang, X.; Pekar, J.J.; van Zijl, P.C.; Duan, W.; Margolis, R.L.; et al. Differential Changes in Functional Connectivity of Striatum-Prefrontal and Striatum-Motor Circuits in Premanifest Huntington’s Disease. Neurodegener. Dis. 2019, 19, 78–87. [Google Scholar] [CrossRef] [PubMed]
- Waldvogel, H.J.; Kim, E.H.; Tippett, L.J.; Vonsattel, J.P.G.; Faull, R.L.M. The neuropathology of Huntington’s disease. Curr. Top. Behav. Neurosci. 2014, 22, 33–80. [Google Scholar]
- Politis, M.; Pavese, N.; Tai, Y.F.; Tabrizi, S.J.; Barker, R.A.; Piccini, P. Hypothalamic involvement in Huntington’s disease: An in vivo PET study. Brain 2008, 131, 2860–2869. [Google Scholar] [CrossRef] [PubMed]
- Cheong, R.Y.; Gabery, S.; Petersén, Å. The Role of Hypothalamic Pathology for Non-Motor Features of Huntington’s Disease. J. Huntingt. Dis. 2019, 8, 375–391. [Google Scholar] [CrossRef] [PubMed]
- Casseb, R.F.; D’Abreu, A.; Ruocco, H.H.; Lopes-Cendes, I.; Cendes, F.; Castellano, G. Thalamic metabolic abnormalities in patients with Huntington’s disease measured by magnetic resonance spectroscopy. Braz. J. Med. Biol. Res. 2013, 46, 722–727. [Google Scholar] [CrossRef]
- Ruocco, H.H.; Lopes-Cendes, I.; Li, L.M.; Cendes, F. Evidence of thalamic dysfunction in Huntington disease by proton magnetic resonance spectroscopy. Mov. Disord. 2007, 22, 2052–2056. [Google Scholar] [CrossRef]


| Study | Year | Study Design | Risk of Bias |
|---|---|---|---|
| Padowski et al. [5] | 2014 | Cross-sectional | Moderately low |
| Harms et al. [6] | 1997 | Cross-sectional | Moderately low |
| Alcauter-Solórzano et al. [7] | 2010 | Cross-sectional | High |
| Sturrock et al. [8] | 2010 | Cross-sectional | Moderately low |
| Van Oostrom et al. [9] | 2007 | Cross-sectional | High |
| Van den Bogaard et al. [10] | 2011 | Cross-sectional | Moderately low |
| Jenkins et al. [11] | 1998 | Cross-sectional | Moderately low |
| Sánchez-Pernaute et al. [12] | 1999 | Cross-sectional | High |
| Reynolds et al. [13] | 2005 | Cross-sectional | High |
| Van den Bogaard et al. [14] | 2014 | Cohort | Moderately low |
| Sturrock et al. [15] | 2015 | Cross-sectional | Moderately low |
| Lowe et al. [16] | 2022 | Cohort | Moderately low |
| Author (Year) | Model | Magnetic Field Strength | TE | TR | Voxel Size | Sequence | HC (n) | Pre-HD (n) | HD (n) | Anatomical Area | Reported Difference |
|---|---|---|---|---|---|---|---|---|---|---|---|
| M. Padowski et al. (2014) [5] | Philips | 3 T | 3.20 ms | 7 ms | 1 × 1 × 1 mm | MPRAGE | 10 | 10 | - | Caudate Nucleus | NO DIFFERENCE: PRE-HD vs. HC |
| Frontal Cortex | NO DIFFERENCE: PRE-HD vs. HC | ||||||||||
| Van den Bogaard et al. (2011) [10] | Philips 7-Tesla Achieva | 7 T | 19 ms | 2000 ms | 0.44 × 0.44 × 0.84 mm | STEAM | 18 | 14 | 12 | Hypothalamus | NO DIFFERENCE: HD vs. PRE-HD |
| Thalamus | NO DIFFERENCE: HD vs. PRE-HD | ||||||||||
| Caudate | NO DIFFERENCE: HD vs. PRE-HD | ||||||||||
| Putamen | DECREASE: HD vs. PRE-HD (p < 0.05) | ||||||||||
| Prefrontal | NO DIFFERENCE: HD vs. PRE-HD | ||||||||||
| Reynolds et al. (2005) [13] | General Electric, Signa | 0.5 T | 17 ms | 3500 ms | 0.56 cm3 | PRESS PULSE SEQUENCE | 10 | 17 | 10 | Putamen | INCREASE: PRE-HD vs. HC (p < 0.05) |
| Van den Bogaard et al. (2014) [14] | Philips | 7 T | 5.4 ms | 11 ms | 1.00 × 1.01 × 1.00 mm | GRADIENT ECHO | - | 10 | 3 | Caudate Nucleus | NO DIFFERENCE: HD and PRE-HD |
| Putamen | NO DIFFERENCE: HD and PRE-HD | ||||||||||
| Frontal Cortex | NO DIFFERENCE: HD and PRE-HD | ||||||||||
| Lowe et al. (2022) [16] | Siemens Prisma | 3 T | 30 ms | 2000 ms | 35 × 10 × 15 mm3 | PRESS | 15 | 15 | 29 | Putamen | NO DIFFERENCE: PRE-HD vs. HC NO DIFFERENCE: HD vs. PRE-HD |
| Author (Year) | Model | Magnetic Field Strength | TE | TR | Voxel Size | Sequence | HC (n) | Pre-HD (n) | HD (n) | Anatomical Area | Reported Difference |
|---|---|---|---|---|---|---|---|---|---|---|---|
| Jenkins et al. (1998) [11] | General Electric | 1.5 T | 272 ms | 2000 ms | 2–4 mL | PRESS/STEAM | 17 | 8 | 31 | Striatum | INCREASE: PRE-HD vs. CONTROL (p < 0.01) |
| Occipital Cortex | INCREASE: HD vs. CONTROL (p < 10−11) | ||||||||||
| Van den Bogaard et al. (2011) [10] | Philips 7-Tesla Achieva | 7 T | 19 ms | 2000 ms | 0.44 × 0.44 × 0.84 mm | STEAM | 18 | 14 | 12 | Hypothalamus | NO DIFFERENCE: HD vs. PRE-HD |
| Thalamus | NO DIFFERENCE: HD vs. PRE-HD | ||||||||||
| Caudate | NO DIFFERENCE: HD vs. PRE-HD | ||||||||||
| Putamen | NO DIFFERENCE: HD vs. PRE-HD | ||||||||||
| Prefrontal | NO DIFFERENCE: HD vs. PRE-HD | ||||||||||
| Reynolds et al. (2005) [13] | General Electric, Signa | 0.5 T | 17 ms | 3500 ms | 0.56 cm3 | PRESS PULSE | 10 | 17 | 10 | Putamen | INCREASE: HD vs. PRE-HD (p not reported) |
| Van den Bogaard et al. (2014) [14] | Philips | 7 T | 5.4 ms | 11 ms | 1.00 × 1.01 × 1.00 mm | GRADIENT ECHO | - | 10 | 3 | Caudate Nucleus | NO DIFFERENCE: HD and PRE-HD |
| Putamen | NO DIFFERENCE: HD and PRE-HD | ||||||||||
| Frontal Cortex | NO DIFFERENCE: HD and PRE-HD |
| Author (Year) | Model | Magnetic Field Strength | TE | TR | Voxel Size | Sequence | HC (n) | Pre-HD (n) | HD (n) | Anatomical Area | Reported Difference |
|---|---|---|---|---|---|---|---|---|---|---|---|
| L. Harms et al. (1997) [6] | Gyroscan S15 (Philips) | 1.5 T | 30.90 ms | 2000 ms | 20 × 20 × 40 mm | SPARS | - | 4 | 17 | Frontal Cortex | NAA/Cho DECREASE: PRE-HD vs. HD (p < 0.05) |
| Cho/Cr NO DIFFERENCE: PRE-HD vs. HD | |||||||||||
| M. Padowski et al. (2014) [5] | Philips | 3 T | 3.20 ms | 7 ms | 1 × 1 × 1 mm | MPRAGE | 10 | 10 | - | Caudate Nucleus | Glu NO DIFFERENCE: PRE-HD vs. HC |
| Frontal Cortex | Glu DECREASE: PRE-HD vs. HC (p = 0.013) |
| Author (Year) | Model | Magnetic Field Strength | TE | TR | Voxel Size | Sequence | HC (n) | Pre-HD (n) | HD (n) | Anatomical Area | Reported Difference |
|---|---|---|---|---|---|---|---|---|---|---|---|
| M. Padowski et al. (2014) [5] | Philips | 3 T | 3.20 ms | 7 ms | 1 × 1 × 1 mm | MPRAGE | 10 | 10 | - | Caudate Nucleus | NO DIFFERENCE: PRE-HD vs. HC |
| Frontal Cortex | NO DIFFERENCE: PRE-HD vs. HC | ||||||||||
| Sturrock A et al. (2010) [8] | Philips | 3 T | 35 ms | 2000 ms | 35 mm × 10 mm × 15 mm | PRESS | 30 | 25 | 30 | Putamen | INCREASE: HD vs. PRE-HD (p < 0.05) INCREASE: PRE-HD vs. HC (p < 0.05) |
| Van den Bogaard et al. (2011) [10] | Philips 7-Tesla Achieva | 7 T | 19 ms | 2000 ms | 0.44 × 0.44 × 0.84 mm | STEAM | 18 | 14 | 12 | Hypothalamus | NO DIFFERENCE: HD vs. PRE-HD |
| Thalamus | NO DIFFERENCE: HD vs. PRE-HD | ||||||||||
| Caudate Nucleus | NO DIFFERENCE: HD vs. PRE-HD | ||||||||||
| Putamen | NO DIFFERENCE: HD vs. PRE-HD | ||||||||||
| Prefrontal Cortex | NO DIFFERENCE: HD vs. PRE-HD | ||||||||||
| Van den Bogaard et al. (2014) [14] | Philips | 7 T | 5.4 ms | 11 ms | 1.00 × 1.01 × 1.00 mm | GRADIENT ECHO | - | 10 | 3 | Caudate Nucleus | DECREASE: PRE-HD and HD after 2-year follow-up (p = 0.015) |
| Putamen | NO DIFFERENCE: HD and PRE-HD | ||||||||||
| Frontal Cortex | NO DIFFERENCE: HD and PRE-HD | ||||||||||
| Sturrock et al. (2015) [15] | Philips Achieva MR | 3 T | 35 ms | 2000 ms | 35 mm × 31 mm × 31.5 mm | PRESS | 30 | 25 | 29 | Left Putamen | INCREASE: HD vs. PRE-HD (p < 0.05) INCREASE: PRE-HD vs. HC (p < 0.05) |
| Lowe et al. (2022) [16] | Siemens Prisma | 3 T | 30 ms | 2000 ms | 35 mm × 10 mm × 15 mm | PRESS | 15 | 15 | 29 | Putamen | NO DIFFERENCE: PRE-HD vs. HC NO DIFFERENCE: HD vs. PRE-HD |
| Author (Year) | Model | Magnetic Field Strength | TE | TR | Voxel Size | Sequence | HC (n) | Pre-HD (n) | HD (n) | Anatomical Area | Reported Difference |
|---|---|---|---|---|---|---|---|---|---|---|---|
| M. Padowski et al. (2014) [5] | Philips | 3 T | 3.20 ms | 7 ms | 1 × 1 × 1 mm | MPRAGE | 10 | 10 | - | Caudate Nucleus | DECREASE: PRE-HD vs. HC (p = 0.023) |
| Frontal Cortex | DECREASE: PRE-HD vs. HC (p = 0.005) | ||||||||||
| Sturrock A. et al. (2010) [15] | Philips | 3 T | 35 ms | 2000 ms | 35 mm × 10 mm × 15 mm | PRESS | 30 | 25 | 30 | Putamen | DECREASE: PRE-HD vs. HC (p < 0.05) |
| Van Oostrom et al. (2007) [9] | SIEMENS AG | 1.5 T | 135 ms | 1500 ms | 2000 mm3 | PRESS | 8 | 19 | Putamen | NO DIFFERENCE: PRE-HD vs. HC | |
| Thalamus | NO DIFFERENCE: PRE-HD vs. HC | ||||||||||
| Van den Bogaard et al. (2011) [10] | Philips 7-Tesla Achieva | 7 T | 19 ms | 2000 ms | 0.44 × 0.44 × 0.84 mm | STEAM | 18 | 14 | 12 | Hipothalamus | NO DIFFERENCE: HD vs. PRE-HD |
| Thalamus | NO DIFFERENCE: HD vs. PRE-HD | ||||||||||
| Caudate | DECREASE: HD vs. PRE-HD (p < 0.05) | ||||||||||
| Putamen | DECREASE: HD vs. PRE-HD (p < 0.05) | ||||||||||
| Prefrontal | NO DIFFERENCE: HD vs. PRE-HD | ||||||||||
| Jenkins et al. (1998) [11] | General Electric | 1.5 T | 272 ms | 2000 ms | 2–4 mL | PRESS/STEAM | 17 | 8 | 31 | Striatum | NO DIFFERENCE: PRE-HD vs. HC |
| Occipital Cortex | NO DIFFERENCE: HD vs. CONTROL | ||||||||||
| Sánchez-Pernaute et al. (1999) [12] | General Electric, Signa Advantage | 1.5 T | 288 ms | 1500 ms | Mean: 4.54 cm3 HD: 3.27 cm3 | PROBE | 5 | 4 | 6 | Striatum | DECREASE: PRE-HD vs. HC (p < 0.01) DECREASE: HD vs. PRE-HD (p < 0.01) |
| Reynolds N. C. et al. (2005) [13] | General Electric, Signa | 0.5 T | 17 ms | 3500 ms | 0.56 cm3 | PRESS | 10 | 17 | 10 | Putamen | DECREASE: PRE-HD vs. HC (p < 0.05) |
| Sturrock et al. (2015) [15] | Philips Achieva MR | 3 T | 35 ms | 2000 ms | 35 mm × 31 mm × 31.5 mm | PRESS | 30 | 25 | 29 | Left Putamen | DECREASE: HD vs. PRE-HD (p < 0.001) DECREASE: PRE-HD vs. HC (p < 0.001) |
| Author (Year) | Model | Magnetic Field Strength | TE | TR | Voxel Size | Sequence | HC (n) | Pre-HD (n) | HD (n) | Anatomical Area | Reported Difference |
|---|---|---|---|---|---|---|---|---|---|---|---|
| Alcauter-Solórzano S et al. (2010) [7] | Excite II, GE | 3 T | 144 ms | 1500 ms | Not reported | PRESS | 3 | 4 | 3 | Caudate Head | DECREASE: HD vs. PRE-HD (p < 0.05) NO DIFFERENCE: PRE-HD vs. HC |
| Putamen | DECREASE: HD vs. PRE-HD (p < 0.05) NO DIFFERENCE: PRE-HD vs. HC | ||||||||||
| Occipital Cortex | DECREASE: HD vs. PRE-HD (p < 0.05) NO DIFFERENCE: PRE-HD vs. HC | ||||||||||
| Sturrock A et al. (2010) [8] | Philips | 3 T | 35 ms | 2000 ms | 35 mm × 10 mm × 15 mm | PRESS | 30 | 25 | 30 | Putamen | DECREASE: PRE-HD vs. CONTROL (p < 0.001) |
| Van den Bogaard et al. (2014) [14] | Philips | 7 T | 5.4 ms | 11 ms | 1.00 × 1.01 × 1.00 mm | GRADIENT ECHO | 10 | 3 | Caudate Nucleus | NO DIFFERENCE HD and PRE-HD | |
| Putamen | DECREASE: HD and PRE-HD at two-year follow-up (p = 0.028) | ||||||||||
| Frontal Cortex | NO DIFFERENCE: HD and PRE-HD | ||||||||||
| Sturrock et al. (2015) [15] | Philips Achieva MR | 3 T | 35 ms | 2000 ms | 35 mm × 31 mm × 31.5 mm | PRESS | 30 | 25 | 29 | Left Putamen | DECREASE: HD vs. PRE-HD (p < 0.01) DECREASE: PRE-HD vs. HC (p < 0.001) |
| Lowe et al. (2022) [16] | Siemens Prisma | 3 T | 30 ms | 2000 ms | 35 × 10 × 15 mm3 | PRESS | 15 | 15 | 29 | Putamen | NO DIFFERENCE: PRE-HD vs. HC DECREASE: HD vs. PRE-HD (p = 0.03) |
| Author (Year) | Model | Magnetic Field Strength | TE | TR | Voxel Size | Sequence | HC (n) | Pre-HD (n) | HD (n) | Anatomical Area | Reported Difference |
|---|---|---|---|---|---|---|---|---|---|---|---|
| M. Padowski et al. (2014) [5] | Philips | 3 T | 3.20 ms | 7 ms | 1 × 1 × 1 mm | MPRAGE | 10 | 10 | - | Caudate Nucleus | NO DIFFERENCE: PRE-HD vs. HC |
| Frontal Cortex | DECREASE: PRE-HD vs. HC (p = 0.033) | ||||||||||
| Van Oostrom et al. (2007) [9] | SIEMENS AG | 1.5 T | 135 ms | 1500 ms | 2000 mm3 | PRESS | 8 | 19 | - | Putamen | NO DIFFERENCE: PRE-HD vs. HC |
| Thalamus | NO DIFFERENCE: PRE-HD vs. HC | ||||||||||
| Van den Bogaard et al. (2011) [10] | Philips 7-Tesla Achieva | 7 T | 19 ms | 2000 ms | 0.44 × 0.44 × 0.84 mm | STEAM | 18 | 14 | 12 | Hipothalamus | NO DIFFERENCE: HD vs. PRE-HD |
| Thalamus | NO DIFFERENCE: HD vs. PRE-HD | ||||||||||
| Caudate | NO DIFFERENCE: HD vs. PRE-HD | ||||||||||
| Putamen | NO DIFFERENCE: HD vs. PRE-HD | ||||||||||
| Prefrontal | NO DIFFERENCE: HD vs. PRE-HD | ||||||||||
| Jenkins et al. (1998) [11] | General Electric | 1.5 T | 272 ms | 2000 ms | 2–4 mL | PRESS/STEAM | 17 | 8 | 31 | Striatum | INCREASE: PRE-HD vs. CONTROL (p < 0.001) |
| Occipital Cortex | INCREASE: HD vs. CONTROL (p < 0.01 or p < 0.02 if Choline/Cr ratios are used). | ||||||||||
| Sánchez-Pernaute et al. (1999) [12] | General Electric, Signa Advantage | 1.5 T | 288 ms | 1500 ms | Mean: 4.54 cm3 HD: 3.27 cm3 | PROBE | 5 | 4 | 6 | Striatum | NO DIFFERENCE: PRE-HD vs. HC NO DIFFERENCE: HD vs. PRE-HD DECREASE: HD vs. HC (p < 0.05) |
| Author (Year) | Model | Magnetic Field Strength | TE | TR | Voxel Size | Sequence | HC (n) | Pre-HD (n) | HD (n) | Anatomical Area | Reported Difference |
|---|---|---|---|---|---|---|---|---|---|---|---|
| M. Padowski et al. (2014) [5] | Philips | 3 T | 3.20 ms | 7 ms | 1 × 1 × 1 mm | MPRAGE | 10 | 10 | - | Caudate Nucleus | NO DIFFERENCE: PRE-HD vs. HC |
| Frontal Cortex | NO DIFFERENCE: PRE-HD vs. HC | ||||||||||
| Alcauter-Solórzano S et al. (2010) [7] | Excite II, GE | 3 T | 144 ms | 1500 ms | Not reported | PRESS | 3 | 4 | 3 | Caudate Head | DECREASE: HD vs. PRE-HD (p = 0.05) NO DIFFERENCE: PRE-HD vs. HC |
| Putamen | DECREASE: HD vs. PRE-HD (p < 0.05) NO DIFFERENCE: PRE-HD vs. HC | ||||||||||
| Occipital Cortex | DECREASE: HD vs. PRE-HD (p < 0.05) NO DIFFERENCE: PRE-HD vs. HC | ||||||||||
| Van Oostrom et al. (2007) [9] | SIEMENS AG | 1.5 T | 135 ms | 1500 ms | 2000 mm3 | PRESS | 8 | 19 | Putamen | NO DIFFERENCE: PRE-HD vs. HC | |
| Thalamus | NO DIFFERENCE: PRE-HD vs. HC | ||||||||||
| Van den Bogaard et al. (2011) [10] | Philips 7-Tesla Achieva | 7 T | 19 ms | 2000 ms | 0.44 × 0.44 × 0.84 mm | STEAM | 18 | 14 | 12 | Hipothalamus | NO DIFFERENCE: HD vs. PRE-HD |
| Thalamus | NO DIFFERENCE: HD vs. PRE-HD | ||||||||||
| Caudate | DECREASE: HD vs. PRE-HD (p < 0.05) | ||||||||||
| Putamen | DECREASE: HD vs. PRE-HD (p < 0.05) | ||||||||||
| Prefrontal | NO DIFFERENCE: HD vs. PRE-HD | ||||||||||
| Sánchez-Pernaute et al. (1999) [12] | General Electric, Signa Advantage | 1.5 T | 288 ms | 1500 ms | Mean: 4.54 cm3 HD: 3.27 cm3 | PROBE | 5 | 4 | 6 | Striatum | DECREASE: PRE-HD vs. HC (p < 0.05) DECREASE: HD vs. PRE-HD (p < 0.05) DECREASE: HD vs. HC (p < 0.001) |
| Reynolds, N. C et al. (2005) [13] | General Electric, Signa | 0.5 T | 17 ms | 3500 ms | 0.56 cm3 | PRESS | 10 | 17 | 10 | Putamen | NO DIFFERENCE: HD vs. HC DECREASE: PRE-HD vs. HC (p < 0.05) |
Disclaimer/Publisher’s Note: The statements, opinions and data contained in all publications are solely those of the individual author(s) and contributor(s) and not of MDPI and/or the editor(s). MDPI and/or the editor(s) disclaim responsibility for any injury to people or property resulting from any ideas, methods, instructions or products referred to in the content. |
© 2024 by the authors. Licensee MDPI, Basel, Switzerland. This article is an open access article distributed under the terms and conditions of the Creative Commons Attribution (CC BY) license (https://creativecommons.org/licenses/by/4.0/).
Share and Cite
Martínez Lozada, P.S.; Duque Perez, J.; Celi Salinas, R.; Miranda Morales, B.; Pazmiño Mesías, J.F.; García Ríos, C.A.; Rodas, J.A.; Leon-Rojas, J.E. Early Diagnosis of Huntington Disease: Insights from Magnetic Resonance Spectroscopy—A Systematic Review. J. Clin. Med. 2024, 13, 6390. https://doi.org/10.3390/jcm13216390
Martínez Lozada PS, Duque Perez J, Celi Salinas R, Miranda Morales B, Pazmiño Mesías JF, García Ríos CA, Rodas JA, Leon-Rojas JE. Early Diagnosis of Huntington Disease: Insights from Magnetic Resonance Spectroscopy—A Systematic Review. Journal of Clinical Medicine. 2024; 13(21):6390. https://doi.org/10.3390/jcm13216390
Chicago/Turabian StyleMartínez Lozada, Pablo S., José Duque Perez, Ronney Celi Salinas, Bryan Miranda Morales, Juan Francisco Pazmiño Mesías, Cecilia Alejandra García Ríos, Jose A. Rodas, and Jose E. Leon-Rojas. 2024. "Early Diagnosis of Huntington Disease: Insights from Magnetic Resonance Spectroscopy—A Systematic Review" Journal of Clinical Medicine 13, no. 21: 6390. https://doi.org/10.3390/jcm13216390
APA StyleMartínez Lozada, P. S., Duque Perez, J., Celi Salinas, R., Miranda Morales, B., Pazmiño Mesías, J. F., García Ríos, C. A., Rodas, J. A., & Leon-Rojas, J. E. (2024). Early Diagnosis of Huntington Disease: Insights from Magnetic Resonance Spectroscopy—A Systematic Review. Journal of Clinical Medicine, 13(21), 6390. https://doi.org/10.3390/jcm13216390