Abstract
Objective: This study aimed to determine the associations between lactate clearance in hyperlactataemic patients with diabetic ketoacidosis (DKA) and intensive care unit (ICU), hospital length of stay (LOS), and case-fatality. Methods: A retrospective, multicentre, cohort study of adult patients admitted to ICU with hyperlactataemia and a primary diagnosis of DKA from twelve sites in Queensland, Australia was conducted utilising pre-existing datasets that were linked for research purposes. The patients were divided into early and late lactate clearance groups; the early lactate clearance group included patients whose lactate returned to <2.0 mmol/L within 12 h, and the remainder were classified as late lactate clearance group. Results: The final dataset included 511 patients, 427 in the early lactate clearance group and 84 in the late lactate clearance group. Late lactate clearance was associated with increasing ICU LOS (β = +15.82, 95% CI +0.05 to +31.59, p < 0.049), increasing hospital LOS (β = +7.24, 95% CI +0.11 to 14.37, p = 0.048) and increasing Acute Physiology and Chronic Health Evaluation(APACHE) III score (ICU LOS outcome variable β = +1.05, 95% CI +0.88 to +1.22, p < 0.001; hospital LOS outcome variable β = +3.40, 95% CI +2.22 to 4.57, p < 0.001). Hospital case-fatality was not significantly different (2.2% in the early clearance group vs. 1.7% in the late clearance group, p = 0.496). Conclusions: In hyperlactataemic patients with DKA, late lactate clearance was associated with a statistically significant increase in both ICU and hospital LOS, though the clinical significance in both is minor.
1. Introduction
Diabetic ketoacidosis (DKA) is a condition that poses significant healthcare burden, impacting nearly 8 in 1000 patients with diabetes annually, with a mortality between 1 and 5% [1,2]. DKA arises due to deficiency or absence of circulating insulin, leading to hyperglycaemia, elevated ketones, and a high anion-gap metabolic acidosis [2,3].
Previous studies have demonstrated associations between hyperlactataemia and increased in-hospital case-fatality [4,5]. However, production and clearance of lactate is a dynamic process that necessitates evaluation over the time course of the disease [6,7]. In disease states such as sepsis, burns and myocardial disease, lactate clearance is an independent predictor of mortality [8]. The aetiology of hyperlactataemia in these settings is largely attributed to anaerobic glycolysis [4,9,10]. Conversely, the aetiology of hyperlactataemia in the setting of DKA is theorised to be due to alternate mechanisms, such as thiamine deficiency, which is commonly observed in diabetes, and the association between lactate clearance and clinical outcomes in DKA remains undefined [7,10,11,12,13].
The aim of this study was to determine associations between lactate clearance in hyperlactataemic patients with DKA and clinical outcomes, including intensive care unit (ICU) length of stay (LOS), hospital LOS, and ICU and hospital case-fatality.
2. Materials and Methods
The authors conducted a retrospective, multicentre cohort study that utilised data collected for quality assurance purposes by the Australia and New Zealand Intensive Care Society (ANZICS), Centre for Outcome and Resource Evaluation (CORE), and Adult Patient Database (APD) linked with data from eCritical MetaVision™ (iMDsoft, Boston, MA, USA) from twelve discrete intensive care units in Queensland, Australia. Data collected included patient demographics, hemodynamic parameters, outcome data, biochemistry, observations, and medications.
The approval for this study, with waiver of consent, was granted by the Metro South Human Research Ethics Committee (HREC/2022/QMS/82024) and data access was approved by the ANZICS CORE Directorate.
Data were collected pertaining to all eligible patients from 1 January 2015 to 31 December 2021. The inclusion criteria were adult patients (Age 18 and older) admitted to ICU with a primary diagnosis of DKA and lactate ≥2.0 mmol/L. This included patients with Type 1, Type 2, undifferentiated or other (for example, post-pancreatectomy) types of diabetes. Patients with applied limitations of life-sustaining care at the time of ICU admission, including “not for resuscitation”, “not for intubation”, “not for vasoactive drugs”, or “not for dialysis” orders, were excluded due to their known associations with worse outcomes to avoid confounding [14].
Data Management and Statistical Analysis
The variables extracted included demographic information, admission diagnosis, physiological variables used in Acute Physiology and Chronic Health Evaluation III (APACHE-III) scoring, lactate, Australia and New Zealand Risk of Death (ANZROD), biochemistry, observations, medications, vital status at hospital discharge, and lengths of stay in ICU and hospital.
The cohort was divided into two groups based on time to clearance of lactate with hyperlactataemia defined as a serum lactate concentration ≥2.0 mmol/L, as has been previously defined in the published literature [4,5,7,8,12]. The ‘early lactate clearance group’ consisted of patients who returned to lactate <2.0 mmol/L within 12 h of ICU admission; the remainder were classified as the ‘late lactate clearance group’, based on the methodology described by Morgan et al. [12].
The primary outcome was ICU LOS. The secondary outcomes included hospital LOS, need for vasopressors, receipt of mechanical ventilation, and the requirement for renal replacement therapy.
Statistical analysis was performed using STATA version 17.0. Continuous data were assessed for normality using the Shapiro–Wilk test and subsequently summarised as mean and standard deviation (if normally distributed) or median and interquartile range (if not normally distributed). Categorical data were summarised as proportions and percentages. The two groups were compared using the Mann–Whitney U test and the Pearson chi-squared test, respectively, for continuous and categorical variables.
The data formed a longitudinal time-series (panel data), and general multivariable modelling was undertaken with the patient ID set as the panel variable and number of hours to lactate clearance as the temporal variable.
The primary outcome, ICU LOS, was evaluated using mixed-effects multivariable logistic regression, with results presented as Beta (β), the regression coefficient slope, with 95% confidence interval (CI). The primary exposure variable was the lactate clearance group. Site was entered into the model as a random effect, with patients nested within sites. Fixed effects were sequentially added to generate a fully saturated model, from which non-significant covariates were removed to yield a final, adjusted model.
Non-linear modelling was accomplished using a general exponential washout curve. Statistical analysis was performed using STATA version 17.0 with the level of significance set at α < 0.05.
3. Results
Over the study period, 858 ICU admissions with DKA were recorded at the participating centres. Of these, 511 ICU admissions were hyperlactatemic on admission, of whom 84 patients met the criteria for late lactate clearance, with the remaining 427 patients being classified as early lactate clearance. The average age in the early lactate clearance group was 53 years (34–61) and 49 years (30–59) in the late lactate clearance group. In the early lactate clearance group, 219 patients (51.3%) were male, compared to 27 patients (32.5%) in the late lactate clearance group. Nine case-fatalities occurred, three in the ICU and six after ICU discharge. Univariate analysis of demographic data is summarised in Table 1.

Table 1.
Patient baseline characteristics.
Initial arterial blood gas (ABG) results within four hours of admission to ICU are summarised in Table 2. Patients in the late lactate clearance group had a mean lactate concentration of 5.3 mmol/L (IQR 4.0–6.7 mmol/L) within the first four hours, compared to 2.8 mmol/L (IQR 2.2–3.5 mmol/L; p < 0.001) in the early lactate clearance group. The late lactate clearance group also had a higher anion gap of 22 mmol/L (IQR 15–28 mmol/L) as compared to 8 mmol/L (IQR 13–23 mmol/L; p < 0.001) in the early lactate clearance group. There was no significant difference between the initial blood glucose concentrations: 26 mmol/L (IQR 14 to 37 mmol/L) in the late clearance group as opposed to 25 mmol/L (IQR 14 to 36 mmol/L; p = 0.867) in the early lactate clearance group. A positive association was also noted between early lactate clearance and lower admission whole blood sodium concentration with 136 mmol/L (IQR 133–139 mmol/L) in the early lactate clearance group vs. 139 mmol/L (IQR 133–145 mmol/L) in the late lactate clearance group, p = 0.041.
Table 2.
Arterial blood gas (ABG) results within four hours of admission to ICU.
Outcomes
The results of univariate analysis of primary and secondary outcomes are summarised in Table 3. Late lactate clearance was associated with a mean ICU LOS of 59 h (95% CI 40–99 h) vs. 48 h (95% CI 32–76 h; p < 0.001) in the early lactate clearance group and a mean hospital LOS of 141 h (95% CI 83–300 h) in the late lactate clearance group vs. 110 h (95% CI 69–195 h; p < 0.001) in the early lactate clearance group. Late lactate clearance was also significantly associated with a lower proportion of male patients, higher APACHE-II, APACHE-III, and ANZROD scores.
Table 3.
Univariate analysis of primary and secondary outcomes.
Patients in the late lactate clearance group had an increased need for vasopressors (43.1%) compared to the early lactate clearance group (13.8%; p < 0.001). A positive association with the proportion of invasive positive pressure ventilation was also noted with late lactate clearance (22.4% late lactate clearance vs. 7.9% early lactate clearance; p = 0.034). The proportionate use of NIV was also significantly higher in the late lactate clearance group (6.9% late lactate clearance vs. 1.9% early lactate clearance; p = 0.045). No significant associations were noted regarding the requirement for renal replacement therapy or overall ventilation hours with both IPPV and NIV.
The results of multivariable modelling are presented in Table 4. Patients in the late lactate clearance group had a significantly longer ICU LOS compared to the early lactate clearance group (β = +15.8, 95% CI +0.05 to +31.59, p = 0.049). An association with increased ICU LOS was also noted for patients with high APACHE-III scores (β = +1.05, 95% CI +0.88 to +1.22, p < 0.001), with the median APACHE-III score for patients in the late lactate clearance group being 77 (IQR 60 to 96) compared to 59 (IQR 47 to 76) in the early lactate clearance group. The model building details are outlined in Appendix A (Table A1).
Table 4.
Multivariable mixed-effects model after sequential deletion of non-significant predictors with ICU and hospital LOS as the outcome variables.
Multivariable modelling with hospital LOS as the outcome variable also demonstrated a significantly longer LOS in the late lactate clearance group as opposed to the early lactate clearance group (β = +7.24, 95% CI +0.11 to +14.37, p = 0.048), and an association of higher APACHE-III scores with late lactate clearance (β = +3.40, 95% CI +2.22 to +4.57, p < 0.001) was found. The model building details are outlined in Appendix A (Table A2).
Figure 1 demonstrates the clearance of lactate over time for the first 60 h among the early and late lactate clearance groups. Figure A1 and Figure A2 (see Appendix A) demonstrate the time course for glucose and pH for both clearance groups. Despite the notable difference in lactate clearance over time, both groups demonstrated similar trajectories for resolution of glucose and pH. Figure A3 and Figure A4 (see Appendix A) demonstrate the mL/h of crystalloid and colloid received, demonstrating that both groups received similar volumes of crystalloid; however, the late lactate clearance group received higher volumes of colloid.
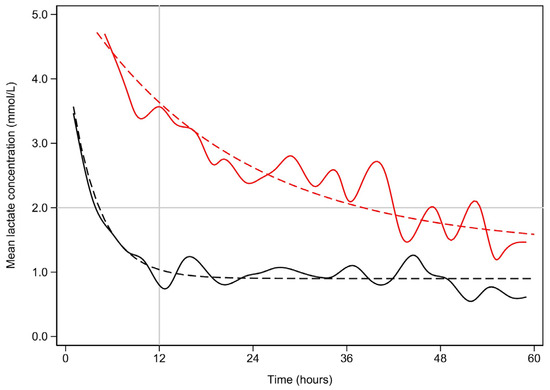
Figure 1.
Mean lactate concentration (mmol/L) vs. time (hours) for early and late lactate clearance.
Early lactate resolution is plotted in black, while late lactate resolution is plotted in red. The solid lines represent the best fit splines. The dashed lines represent the non-linear fitted plots. The upper bound is marked by the horizontal line. For the sake of clarity, lactate concentrations above 5 mmol/L are not shown. Similarly, the time scale is limited to 60 h.
Half lives:
Early—t1/2 = 2.6 h (95% CI 2.3–2.9, p < 0.001)
Late—t1/2 = 14.1 h (95%CI 12.2–17.1, p< 0.001)
The difference is also significant (p < 0.001).
4. Discussion
In this large cohort study, late lactate clearance among patients admitted to ICU with DKA was independently associated with a longer ICU LOS. The other major factor affecting ICU length of stay was increasing APACHE-III score. Mixed-effects modelling including significant univariate variables demonstrated that late clearance of lactate was statistically associated with a marginally longer ICU LOS, but not likely to be clinically significant. Mortality between the groups was not significantly different.
Multiple factors could account for these findings. The emerging literature suggests that hyperlactataemia in the setting of DKA may have separate aetiologies and ambiguous clinical significance compared to lactate elevations seen in other areas of critical care, such as sepsis, myocardial infarction, burns or trauma [3,8,9,12,15]. The physiologic mechanism of hyperlactataemia in the latter situations is primarily attributed to anaerobic metabolism secondary to tissue hypoxia [16]. Late clearance of lactate in these circumstances is independently associated with worse clinical outcomes, including ICU and hospital case-fatality, and ICU and hospital LOS [3,13]. However, in the setting of DKA, the aetiology of and clinical significance of hyperlactataemia and the significance of its clearance remains an area of debate, though its contribution to overall acidemia in DKA is likely to increase ICU and hospital LOS [4,7,8,10,12,13,17,18].
Factors beyond anaerobic glycolysis could account for the accumulation of lactate in DKA, including a catecholaminergic state, severe dehydration, metformin use, and thiamine deficiency [1,7,9,19]. This is suggested by our results where it was noted that despite the difference between lactate clearance over time between the two groups, biochemical resolution of pH and glucose was similar, suggesting that the hyperlactataemia observed was due to a process separate from the DKA. Derangement in overall metabolic profile is a significant influencer of ICU and hospital LOS in DKA, and interventions specifically targeting lactate aetiology may lead to a faster improvement [12].
A potential therapeutic option for further exploration is the administration of thiamine to hyperlactataemic patients with DKA. Thiamine deficiency is frequent among diabetic patients due to insulin deficiency causing impaired enteral thiamine absorption and renal thiamine reuptake, with thiamine deficiency being a known precipitant of hyperlactataemia [10,11]. Administration of thiamine may hasten lactate clearance, with faster resolution of metabolic profile and decreased ICU and hospital LOS [1,7,12]. This requires evaluation in prospective, interventional studies.
Our study demonstrated that patients with higher APACHE-III scores and late lactate clearance had a higher ICU LOS compared to those who had early clearance of lactate. Multiple factors could account for this finding. Diabetes often co-exists with significant comorbidities, including obesity, cardiac disease, and metabolic syndrome, which influence illness severity scores [20,21]. Furthermore, diabetic patients are at increased risk for sepsis, which is a common trigger for DKA, and is associated with high morbidity and mortality, which is also associated with high illness severity scores [8,20,22,23,24,25,26]. Sepsis may be a contributor to hyperlactataemia in patients with DKA, alongside alternate biochemical mechanisms [24].
The relationship between lactate clearance and case-fatality remains uncertain, investigated in only two small studies. Ibrahim et al. [6] performed a retrospective observational study of 107 patients, with a 7.54% case-fatality rate and demonstrated an association between lactate clearance and decreasing thirty-day case-fatality. Similarly, in a cohort of 40 patients, Taskin et al. [13] found decreasing lactate levels to be associated with improving case-fatality. Larger studies are required to explore this potential association.
The strengths of this study are that it is the largest study to evaluate the impact of lactate clearance on ICU LOS and other clinical outcomes in patients with DKA and has analysed data from large registries that have been utilised for research purposes. However, this study is limited by its retrospective observational design, potential for unknown confounders, and missing data. The numbers of patients in the early and late lactate clearance groups were disproportionate, affecting the robustness of the conclusions of the study. A notable limitation is the lack of data on the type of diabetes the patient had and the specific trigger for DKA, which can impact the aetiologies of the raised lactate, as patients whose DKA is triggered by sepsis, or acute coronary syndromes can be predicted to have a higher lactate level. Similarly, data regarding patients’ medications such as metformin or antipsychotics, the duration since the diagnosis of diabetes, and their diet were not available, all of which can impact lactate production and clearance.
5. Conclusions
Patients presenting with DKA frequently demonstrate a concomitant hyperlactataemia, which has an unclear aetiology and may be associated with poorer clinical outcomes. In this study, late lactate clearance was associated with increased ICU and hospital LOS. Future studies should be aimed at reviewing interventions that may expedite lactate clearance and potentially improve clinical outcomes for this group of patients.
Author Contributions
Conceptualization, A.K., C.A., R.D., P.M. (Philippa McIlroy), S.W., K.S., A.A., P.M. (Prashanti Marella), K.W., S.L., A.T., K.L. and M.R.; Methodology, C.A. and M.R.; Software, C.A.; Validation, C.A. and M.R.; Formal analysis, C.A.; Investigation, C.A.; Data curation, K.W.; Writing—original draft, A.K. and M.R.; Writing—review and editing, A.K., C.A., R.D., P.M. (Philippa McIlroy), S.W., K.S., A.A., P.M. (Prashanti Marella), K.W., S.L., A.T., K.L. and M.R.; Supervision, M.R.; Project administration, M.R. All authors have read and agreed to the published version of the manuscript.
Funding
This research received no external funding.
Institutional Review Board Statement
This study was conducted in accordance with the Declaration of Helsinki and approved by the Metro South Human Research Ethics Committee (HREC/2022/QMS/82024, approval date: 19 April 2024) and data access was approved by the ANZICS CORE Directorate.
Informed Consent Statement
Due to the anonymised nature of the dataset, the need for informed consent was waived.
Data Availability Statement
Data cannot be shared publicly due to institutional ethics, privacy, and confidentiality regulations. Data released for research under Sect. 280 of the Public Health Act 2005 require an application to the Director General of Queensland Health (PHA@health.qld.gov.au).
Acknowledgments
We acknowledge the ANZICS CORE management committee and the clinicians, data collectors, and researchers at the following contributing sites: Caboolture Hospital, Cairns Hospital, Gold Coast University Hospital, Logan Hospital, Mackay Base Hospital, Princess Alexandra Hospital, Redcliffe Hospital, Rockhampton Hospital, Royal Brisbane and Women’s Hospital, Sunshine Coast University Hospital, The Prince Charles Hospital, and The Townsville Hospital. We also acknowledge the collaborators of the Queensland Critical Care Research Network (QCCRN)—Mahesh Ramanan, Prashanti Marella, Patrick Young, Philippa McIlroy, Ben Nash, James McCullough, Kerina J Denny, Mandy Tallott, Andrea Marshall, David Moore, Sunil Sane, Aashish Kumar, Lynette Morrison, Pam Dipplesman, Jennifer Taylor, Stephen Luke, Anni Paasilahti, Ray Asimus, Kyle White, Jason Meyer, Rod Hurford, Meg Harward, James Walsham, Neeraj Bhadange, Wayne Stevens, Kevin Plumpton, Sainath Raman, Andrew Barlow, Alexis Tabah, Hamish Pollock, Stuart Baker, Kylie Jacobs, Antony G. Attokaran, David Austin, Jacobus Poggenpoel, Josephine Reoch, Kevin B. Laupland, Felicity Edwards, Tess Evans, Jayesh Dhanani, Marianne Kirrane, Pierre Clement, Nermin Karamujic, Paula Lister, Vikram Masurkar, Lauren Murray, Jane Brailsford, Todd Erbacher, Kiran Shekar, Jayshree Lavana, George Cornmell, Siva Senthuran, Stephen Whebell, Michelle Gatton, Robert Andrews, Sam Keogh.
Conflicts of Interest
The authors declare no conflicts of interest.
Appendix A
Table A1.
Multivariable analysis using a fully saturated model with ICU LOS as the outcome variable.
Table A1.
Multivariable analysis using a fully saturated model with ICU LOS as the outcome variable.
| Predictor | β (95% CI) | p-Value |
|---|---|---|
| Early lactate clearance | +18.23 (+1.03, +35.43) | 0.039 |
| Age (years) | −0.12 (−0.36, +0.13) | 0.355 |
| Female sex | +7.52 (−0.27, +15.31) | 0.059 |
| Co-morbidities | ||
| Renal | +0.16 (−37.44, +37.77) | 0.993 |
| Respiratory | −31.29 (−65.05, +2.47) | 0.062 |
| Cardiovascular | +5.64 (−21.06, +32.35) | 0.679 |
| Frailty score (referenced to 1) | ||
| 2 | −9.74 (−37.85, +18.37) | 0.497 |
| 3 | −23.63 (−52.31, +5.06) | 0.107 |
| 4 | −27.34 (−58.24, +3.56) | 0.096 |
| 5 | −31.99 (−68.02, + 4.05) | 0.102 |
| 6 | −24.09 (−55.04, +6.87) | 0.127 |
| 7 | −38.74 (−86.14, +8.66) | 0.134 |
| 8 | −58.01 (−145.77, +29.76) | 0.195 |
| BMI (kg/m2) | +0.07 (−0.62, +0.77) | 0.839 |
| APACHE-III Score | +0.70 (+0.52, +0.87) | <0.001 |
Abbreviations: BMI = body mass index; APACHE = Acute Physiology and Chronic Health Evaluation.
Table A2.
Multivariable analysis using a fully saturated model with hospital LOS as the outcome variable.
Table A2.
Multivariable analysis using a fully saturated model with hospital LOS as the outcome variable.
| Predictor | β (95% CI) | p-Value |
|---|---|---|
| Early lactate resolution | +8.23 (+0.03, +16.43) | 0.049 |
| Age (years) | +1.01 (−0.89, +1.13) | 0.332 |
| Female sex | +13.38 (−12.97, +39.35) | 0.713 |
| Co-morbidities | ||
| Renal | −0.48 (−2.69, +1.74) | 0.681 |
| Respiratory | −14.18 (−25.62, +2.73) | 0.064 |
| Cardiovascular | +10.16 (−8.76, +29.08) | 0.293 |
| Frailty score (referenced to 1) | ||
| 2 | +3.29 (−59.35, +65.95) | 0.918 |
| 3 | +25.39 (−38.11, +88.90) | 0.433 |
| 4 | +9.60 (−57.62, +76.81) | 0.780 |
| 5 | +82.99 (−6.93, +172.91) | 0.070 |
| 6 | +60.16 (−23.45, +143.77) | 0.158 |
| 7 | +13.69 (−2.09, +25.29) | 0.212 |
| 8 | +11.49 (−252.61, +275.58) | 0.932 |
| BMI (kg/m2) | +0.62 (−1.47, +2.71) | 0.561 |
| APACHE-III Score | +1.78 (+1.13, +2.42) | <0.001 |
Abbreviations: BMI = body mass index; APACHE = Acute Physiology and Chronic Health Evaluation.
Table A3.
Univariate analysis of number of comorbidities.
Table A3.
Univariate analysis of number of comorbidities.
| Number of Comorbidities | Early Lactate Clearance N = 427 | Late Lactate Clearance N = 84 1 | p-Value 2 |
|---|---|---|---|
| 0 | 119 (27.9%) | 17 (20.2%) | 0.423 |
| 1 | 281 (65.8%) | 62 (73.8%) | |
| 2 | 15 (3.5%) | 5 (6.0%) | |
| 3 | 9 (2.1%) | 0 | |
| 4 | 3 (0.7%) | 0 | |
| 5 | 0 | 0 |
1 Median (IQR) or frequency (%); 2 ANOVA.
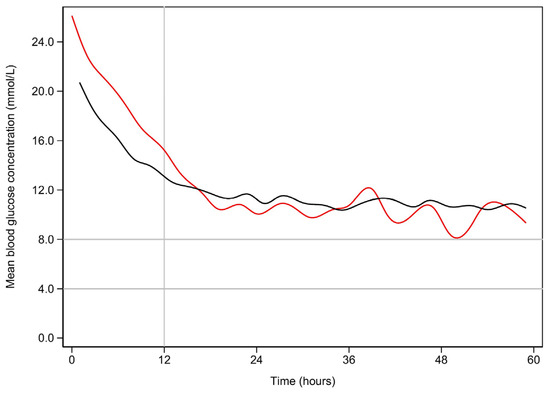
Figure A1.
Mean blood glucose (mmol/L) vs. time (hours) for early and late resolution of lactate.
Early lactate resolution is plotted in black, while late lactate resolution is plotted in red. The normal fasting range is marked by the horizontal lines.
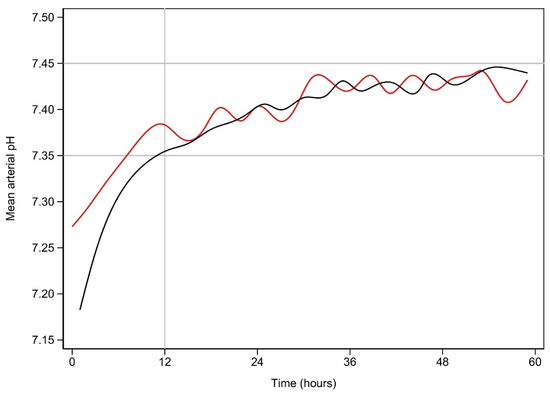
Figure A2.
Mean arterial pH vs. time (hours) for early and late resolution of lactate.
Early lactate resolution is plotted in black, while late lactate resolution is plotted in red. The normal range is marked by the horizontal lines.
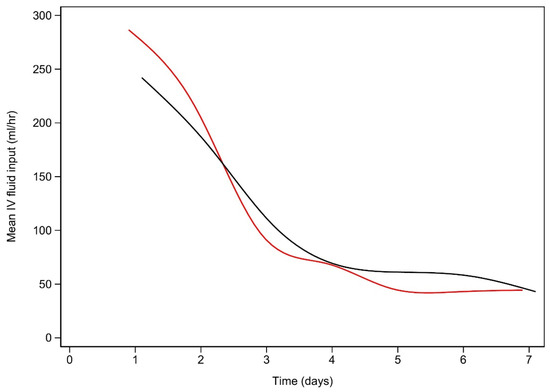
Figure A3.
Intravenous crystalloid (mL/h) use vs. time (days) for early and late lactate clearance.
Early lactate resolution is plotted in black, while late lactate resolution is plotted in red.
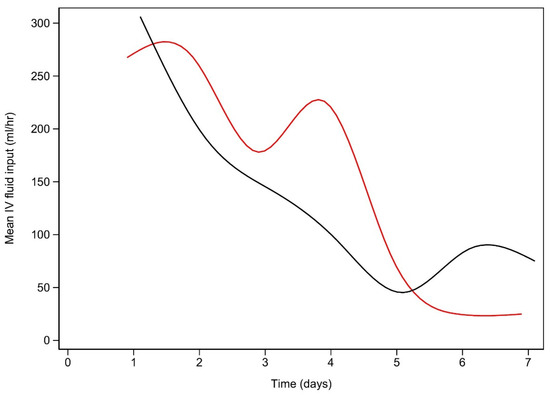
Figure A4.
Intravenous colloid (mL/h) use vs. time (days).
Usage is calculated at the end of each day. Early lactate resolution is plotted in black, while late lactate resolution is plotted in red.
References
- Moskowitz, A.; Berg, K.; Giberson, T.; Graver, A.; Donnino, M. The relationship between lactic acid and thiamine levels in patients with diabetic ketoacidosis. Crit. Care Med. 2012, 40, 70. [Google Scholar]
- Azevedo, L.C.P.; Choi, H.; Simmonds, K.; Davidow, J.; Bagshaw, S.M. Incidence and long-term outcomes of critically ill adult patients with moderate-to-severe diabetic ketoacidosis: Retrospective matched cohort study. J. Crit. Care 2014, 29, 971–977. [Google Scholar] [PubMed]
- Cox, K.; Cocchi, M.N.; Salciccioli, J.D.; Carney, E.; Howell, M.; Donnino, M.W. Prevalence and significance of lactic acidosis in diabetic ketoacidosis. J. Crit. Care 2012, 27, 132–137. [Google Scholar] [CrossRef] [PubMed]
- Kumar, A.; Doola, R.; Zahumensky, A.; Shaikh, A.; Tabah, A.; Laupland, K.B.; Ramanan, M. Association between elevated lactate and clinical outcomes in adults with diabetic ketoacidosis. J. Crit. Care 2023, 78, 154377. [Google Scholar] [CrossRef] [PubMed]
- Siregar, N.N.; Soewondo, P.; Subekti, I.; Muhadi, M. Seventy-Two Hour Mortality Prediction Model in Patients with Diabetic Ketoacidosis: A Retrospective Cohort Study. J. ASEAN Fed. Endocr. Soc. 2018, 33, 124–129. [Google Scholar] [PubMed]
- Ibrahim, A.; Bayramoglu, B.; Hokenek, N.M.; Tekyol, D. Lactate clearance during the first 2 hours after hospital admission: A useful biomarker for predicting 30-day mortality in patients with diabetic ketoacidosis. Int. J. Clin. Pract. 2021, 75, e14204. [Google Scholar] [PubMed]
- Vieira, I.H.; Petrova, M.; Moura, J.P. Does the Same Hyperlactatemia Cut-Off in the Context of Acute Diseases Hold the Same Meaning in Diabetes Mellitus? Cureus 2022, 14, e25163. [Google Scholar] [CrossRef] [PubMed]
- Masharani, U.; Strycker, L.A.; Lazar, A.A.; Wu, K.; Brooks, G.A. Hyperlactatemia in diabetic ketoacidosis. Diabet. Med. 2021, 39, e14723. [Google Scholar]
- Cetin, M.; Kilic, T.Y.; Yesilaras, M.; Uz, I. Clinical utiliy of serum lactate levels in diabetic ketoacidosis in adult patients admitted to emergency department. Ann. Med. Res. 2022, 29, 827–830. [Google Scholar] [CrossRef]
- Moskowitz, A.; Graver, A.; Giberson, T.; Berg, K.; Liu, X.; Uber, A.; Gautam, S.; Donnino, M.W. The relationship between lactate and thiamine levels in patients with diabetic ketoacidosis. J. Crit. Care 2014, 29, 182.e5–182.e8. [Google Scholar] [CrossRef]
- Anwar, A.; Ahmed Azmi, M.; Siddiqui, J.A.; Panhwar, G.; Shaikh, F.; Ariff, M. Thiamine Level in Type I and Type II Diabetes Mellitus Patients: A Comparative Study Focusing on Hematological and Biochemical Evaluations. Cureus 2020, 12, e8027. [Google Scholar] [CrossRef]
- Morgan, T.J.; Scott, P.H.; Anstey, C.M.; Bowling, F.G. Hyperlactatemia in diabetic ketoacidosis is common and can be prolonged: Lactate time-series from 25 intensive care admissions. J. Clin. Monit. Comput. 2021, 35, 757–764. [Google Scholar] [CrossRef]
- Taskin, G.; Yilmaz, M.; Yilmaz, S.; Sirin, H.; Sapmaz, H.; Tasligil, S.; Gunes, I.; Yamanel, L. Lactate kinetics in intensive care unit admissions due to diabetic ketoacidosis. Gulhane Med. J. 2021, 63, 212–217. [Google Scholar] [CrossRef]
- Kaufmann, M.; Perren, A.; Cerutti, B.; Dysli, C.; Rothen, H.U. Severity-Adjusted ICU Mortality Only Tells Half the Truth-The Impact of Treatment Limitation in a Nationwide Database. Crit. Care Med. 2020, 48, e1242–e1250. [Google Scholar] [CrossRef]
- Bhat, J.A.; Masoodi, S.R.; Bhat, M.H.; Bhat, H.; Ahmad, P.O.; Sood, M. Lactic Acidosis in Diabetic Ketoacidosis: A Marker of Severity or Alternate Substrate for Metabolism. Indian J. Endocrinol. Metab. 2021, 25, 59–66. [Google Scholar]
- Liu, J.; Yan, H.; Li, Y. Hyperlactatemia associated with diabetic ketoacidosis in pediatric intensive care unit. BMC Endocr. Disord. 2021, 21, 110. [Google Scholar]
- Graham, J.; Teoh, W.L.; Lockman, K.A. Diabetes ketoacidosis: A marker of poor clinical outcomes? Retrospective study of critical care admissions. Diabet. Med. 2015, 32, 201–202. [Google Scholar]
- Suwarto, S.; Sutrisna, B.; Waspadji, S.; Pohan, H.T. Predictors of five days mortality in diabetic ketoacidosis patients: A prospective cohort study. Acta Medica Indones. 2014, 46, 18–23. [Google Scholar]
- Nunes, R.T.L.; Mota, C.F.M.G.P.; Lins, P.R.G.; Reis, F.S.; Resende, T.C.F.; Barberino, L.A.; da Silva, P.H.L.; de Gois, A.F.T. Incidence, characteristics and long-term outcomes of patients with diabetic ketoacidosis: A prospective prognosis cohort study in an emergency department. Sao Paulo Med. J. 2021, 139, 10–17. [Google Scholar]
- Pattipati, M.; Gudavalli, G.; Dhulipalla, L. The Influence of Obesity Hypoventilation Syndrome on the Outcomes of Patients with Diabetic Ketoacidosis. Cureus 2022, 14, e25157. [Google Scholar] [CrossRef]
- Simpson, A.; Puxty, K.; McLoone, P.; Quasim, T.; Sloan, B.; Morrison, D.S. Comorbidity and survival after admission to the intensive care unit: A population-based study of 41,230 patients. J. Intensive Care Soc. 2021, 22, 143–151. [Google Scholar] [CrossRef] [PubMed]
- Cheng, Y.C.; Huang, C.H.; Lin, W.R.; Lu, P.L.; Chang, K.; Tsai, J.J.; Bojang, K.S.; Lin, C.Y.; Chen, Y.H. Clinical outcomes of septic patients with diabetic ketoacidosis between 2004 and 2013 in a tertiary hospital in Taiwan. J. Microbiol. Immunol. Infect. 2016, 49, 663–671. [Google Scholar] [PubMed]
- Kamata, Y.; Takano, K.; Kishihara, E.; Watanabe, M.; Ichikawa, R.; Shichiri, M. Distinct clinical characteristics and therapeutic modalities for diabetic ketoacidosis in type 1 and type 2 diabetes mellitus. J. Diabetes Its Complicat. 2017, 31, 468–472. [Google Scholar]
- Sato, Y.; Morita, K.; Okada, A.; Matsui, H.; Fushimi, K.; Yasunaga, H. Factors affecting in-hospital mortality of diabetic ketoacidosis patients: A retrospective cohort study. Diabetes Res. Clin. Pract. 2021, 171, 108588. [Google Scholar] [CrossRef] [PubMed]
- Shi, R.; Hamzaoui, O.; De Vita, N.; Monnet, X.; Teboul, J.L. Vasopressors in septic shock: Which, when, and how much? Ann. Transl. Med. 2020, 8, 794. [Google Scholar] [CrossRef] [PubMed]
- Wang, H.E.; Griffin, R.; Judd, S.; Shapiro, N.I.; Safford, M.M. Obesity and risk of sepsis: A population-based cohort study. Obesity 2013, 21, E762–E769. [Google Scholar] [CrossRef] [PubMed]
Disclaimer/Publisher’s Note: The statements, opinions and data contained in all publications are solely those of the individual author(s) and contributor(s) and not of MDPI and/or the editor(s). MDPI and/or the editor(s) disclaim responsibility for any injury to people or property resulting from any ideas, methods, instructions or products referred to in the content. |
© 2024 by the authors. Licensee MDPI, Basel, Switzerland. This article is an open access article distributed under the terms and conditions of the Creative Commons Attribution (CC BY) license (https://creativecommons.org/licenses/by/4.0/).