
Development and Validation of the Predictive Model for the Differentiation between Vestibular Migraine and Meniere’s Disease

 ,
,  ,
, 
Abstract
:1. Introduction
2. Materials and Methods
2.1. Data Collection and Processing
2.2. Statistical Analysis
3. Results
3.1. Demographics, Past History, and Auxiliary Examination Findings of VM and MD
3.2. Variables That Could Differentiate VM and MD
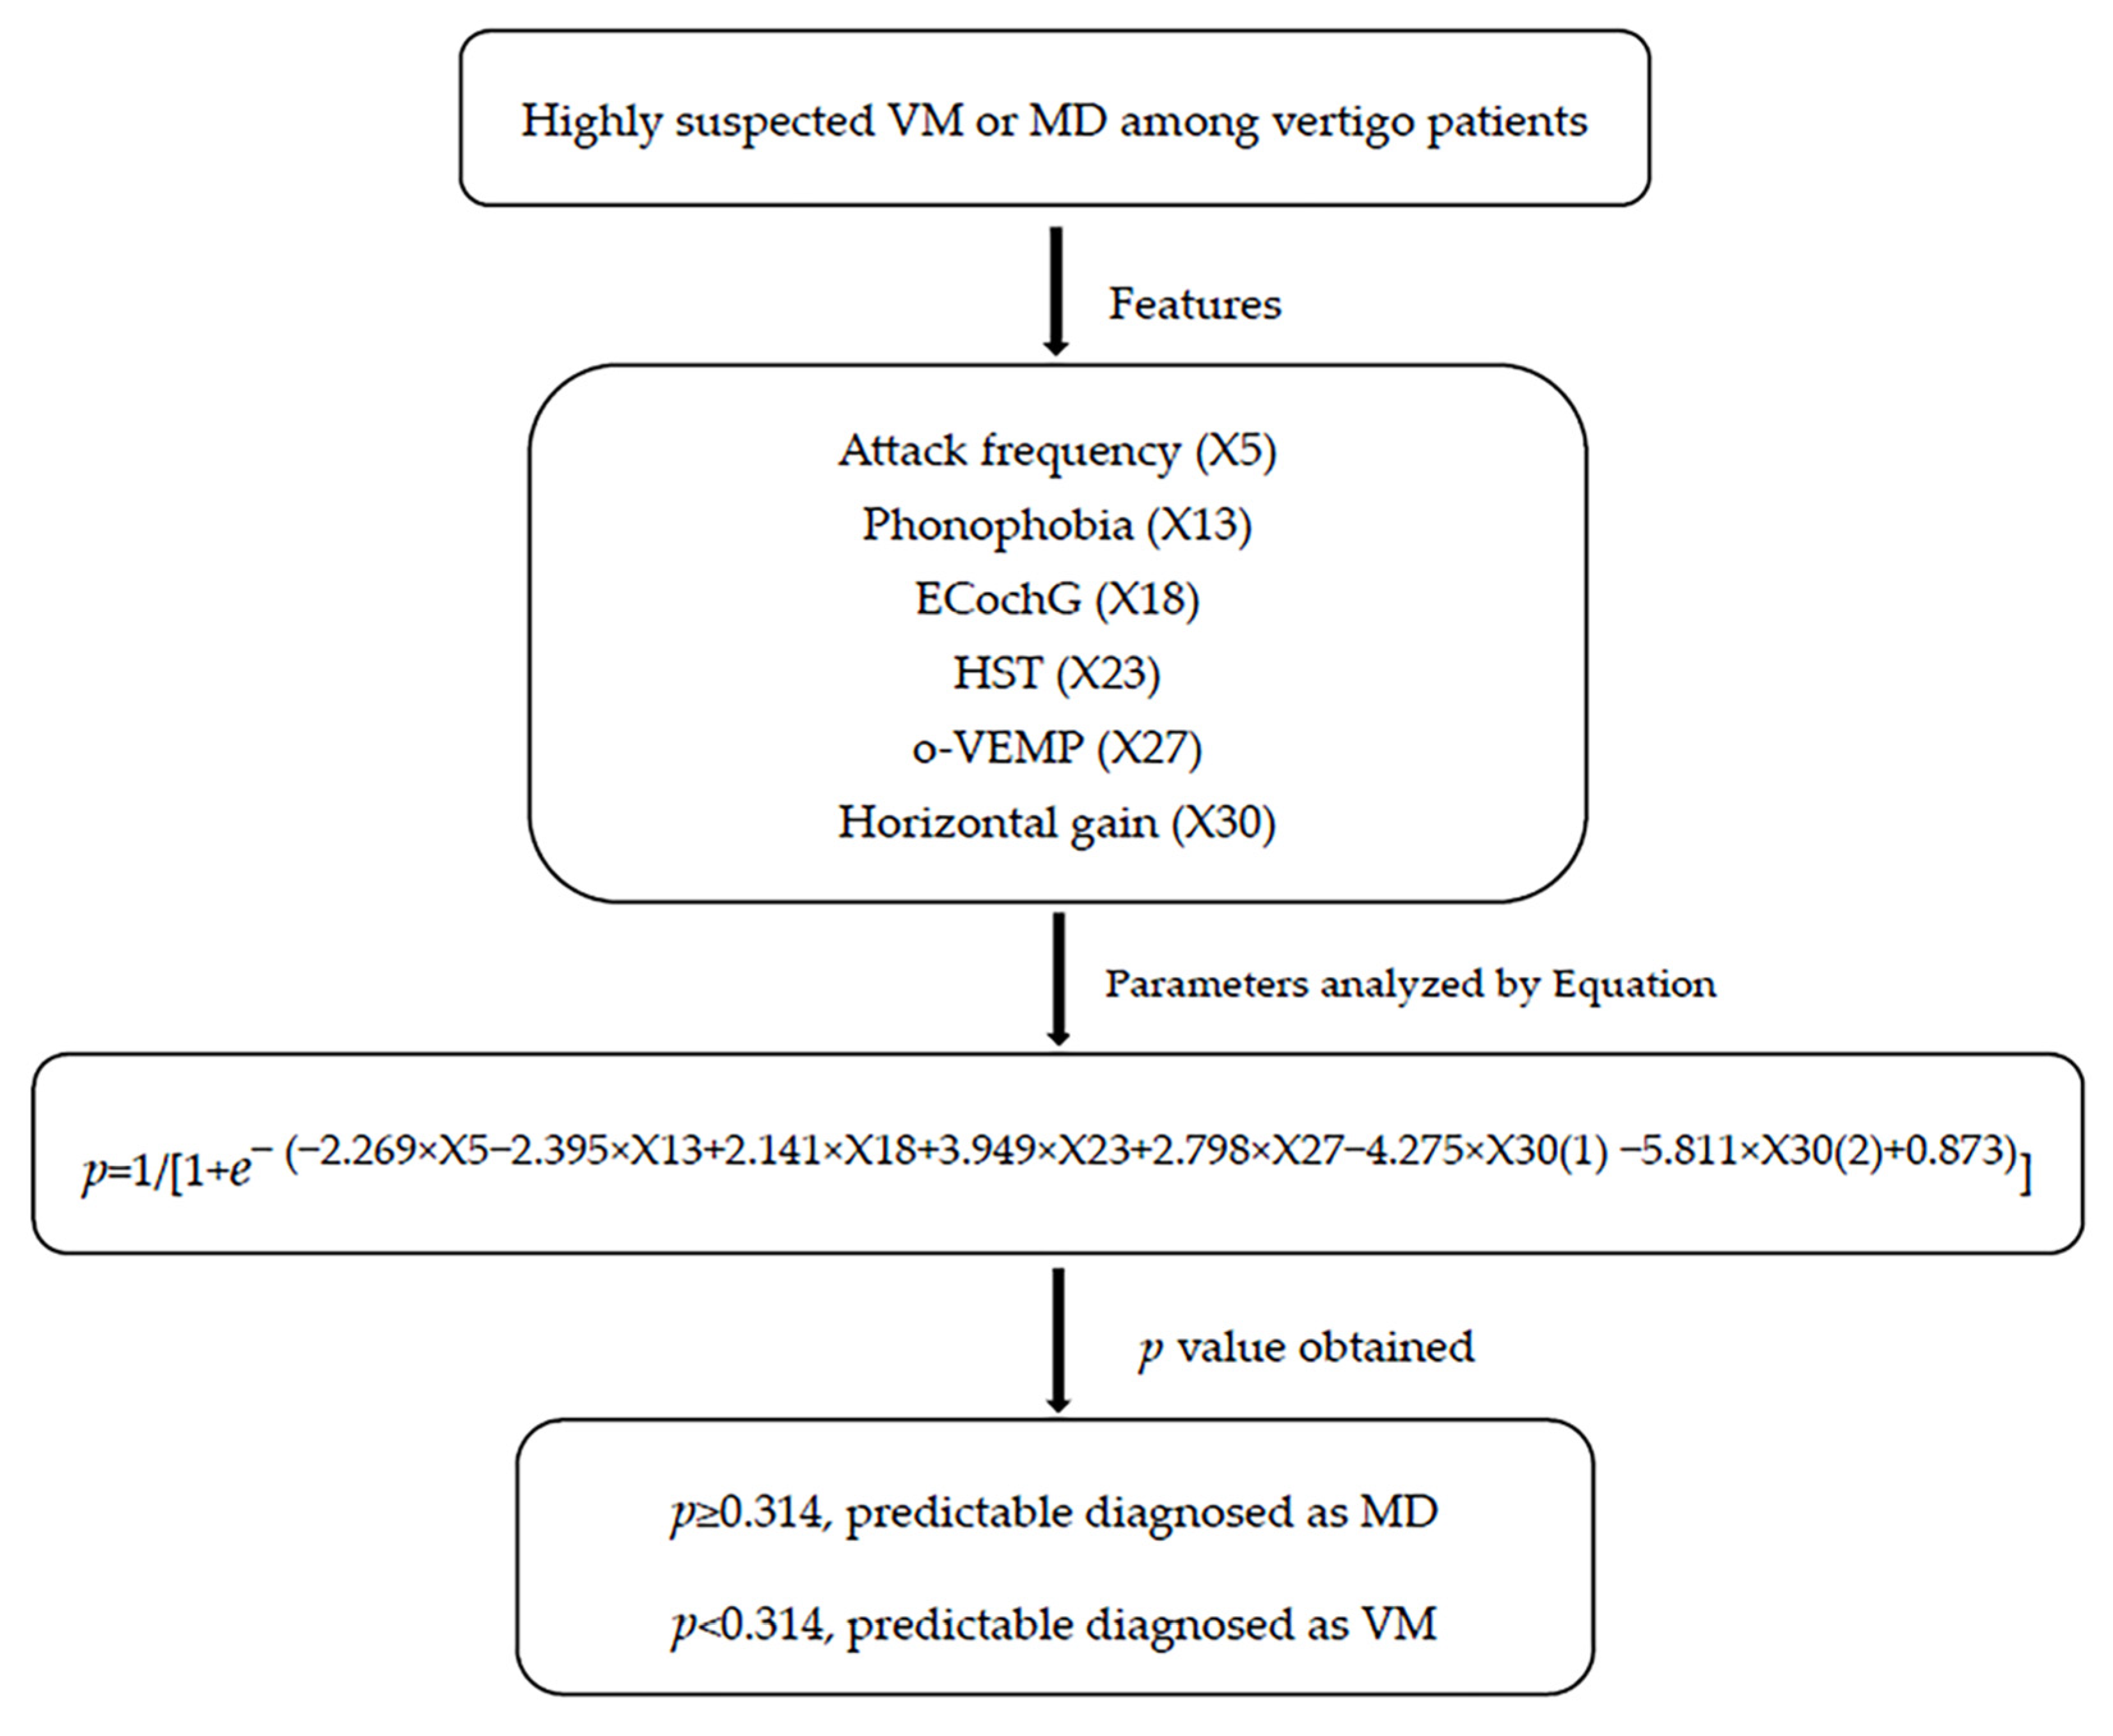
3.3. Predictive Variable Models for Differentiation of VM from MD
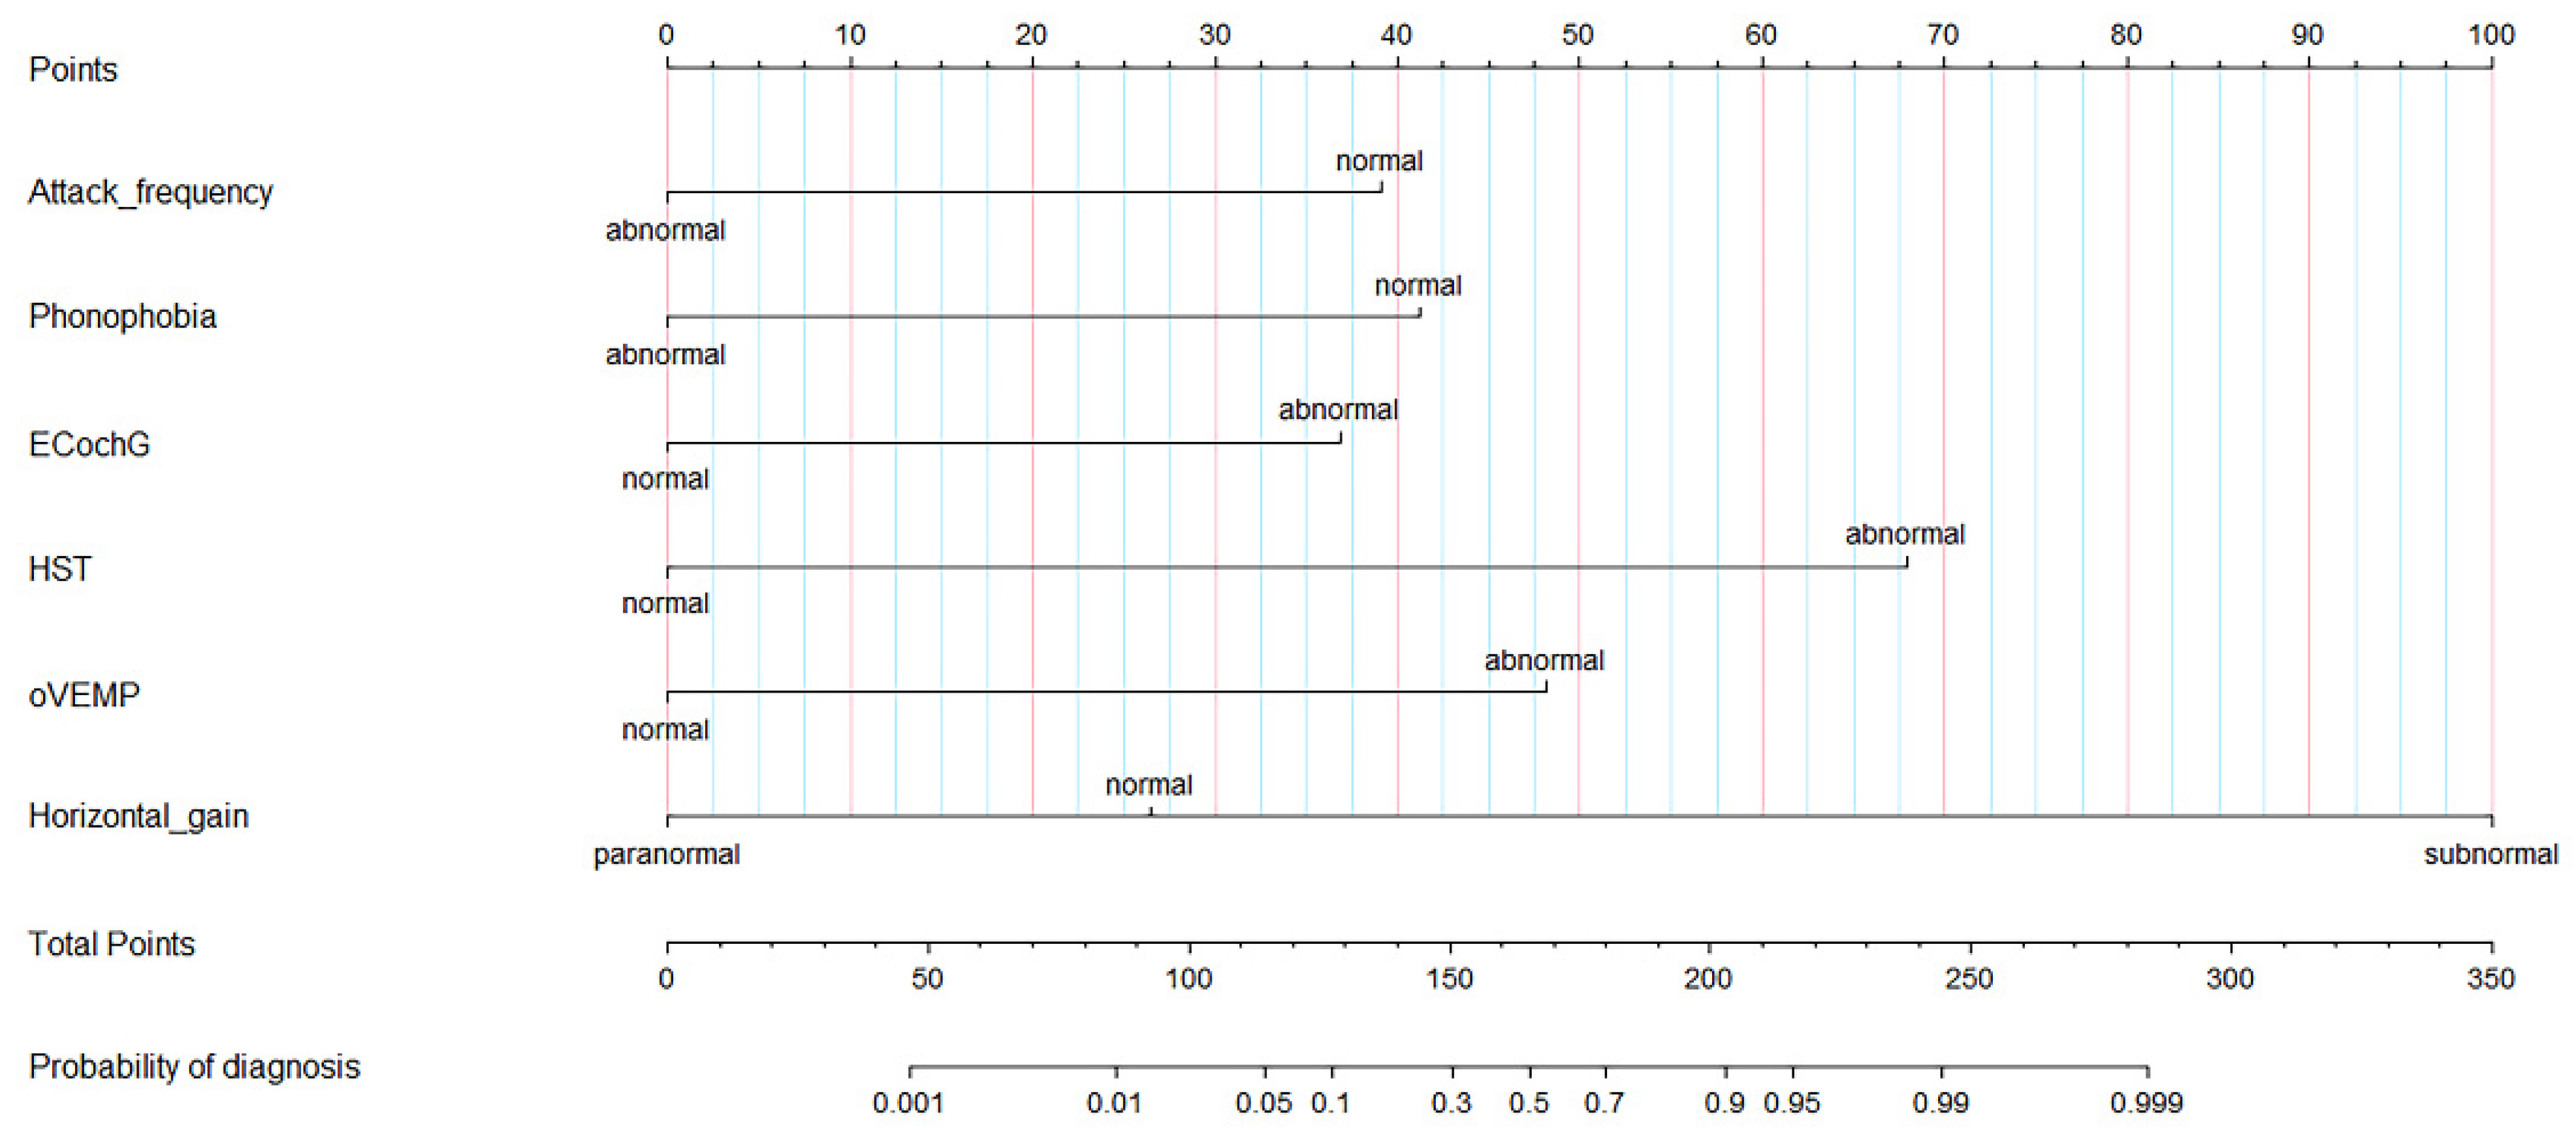
3.4. Nomograph and Applet, as Two Visualization Tools
3.5. Internal Validation of the Prediction Model
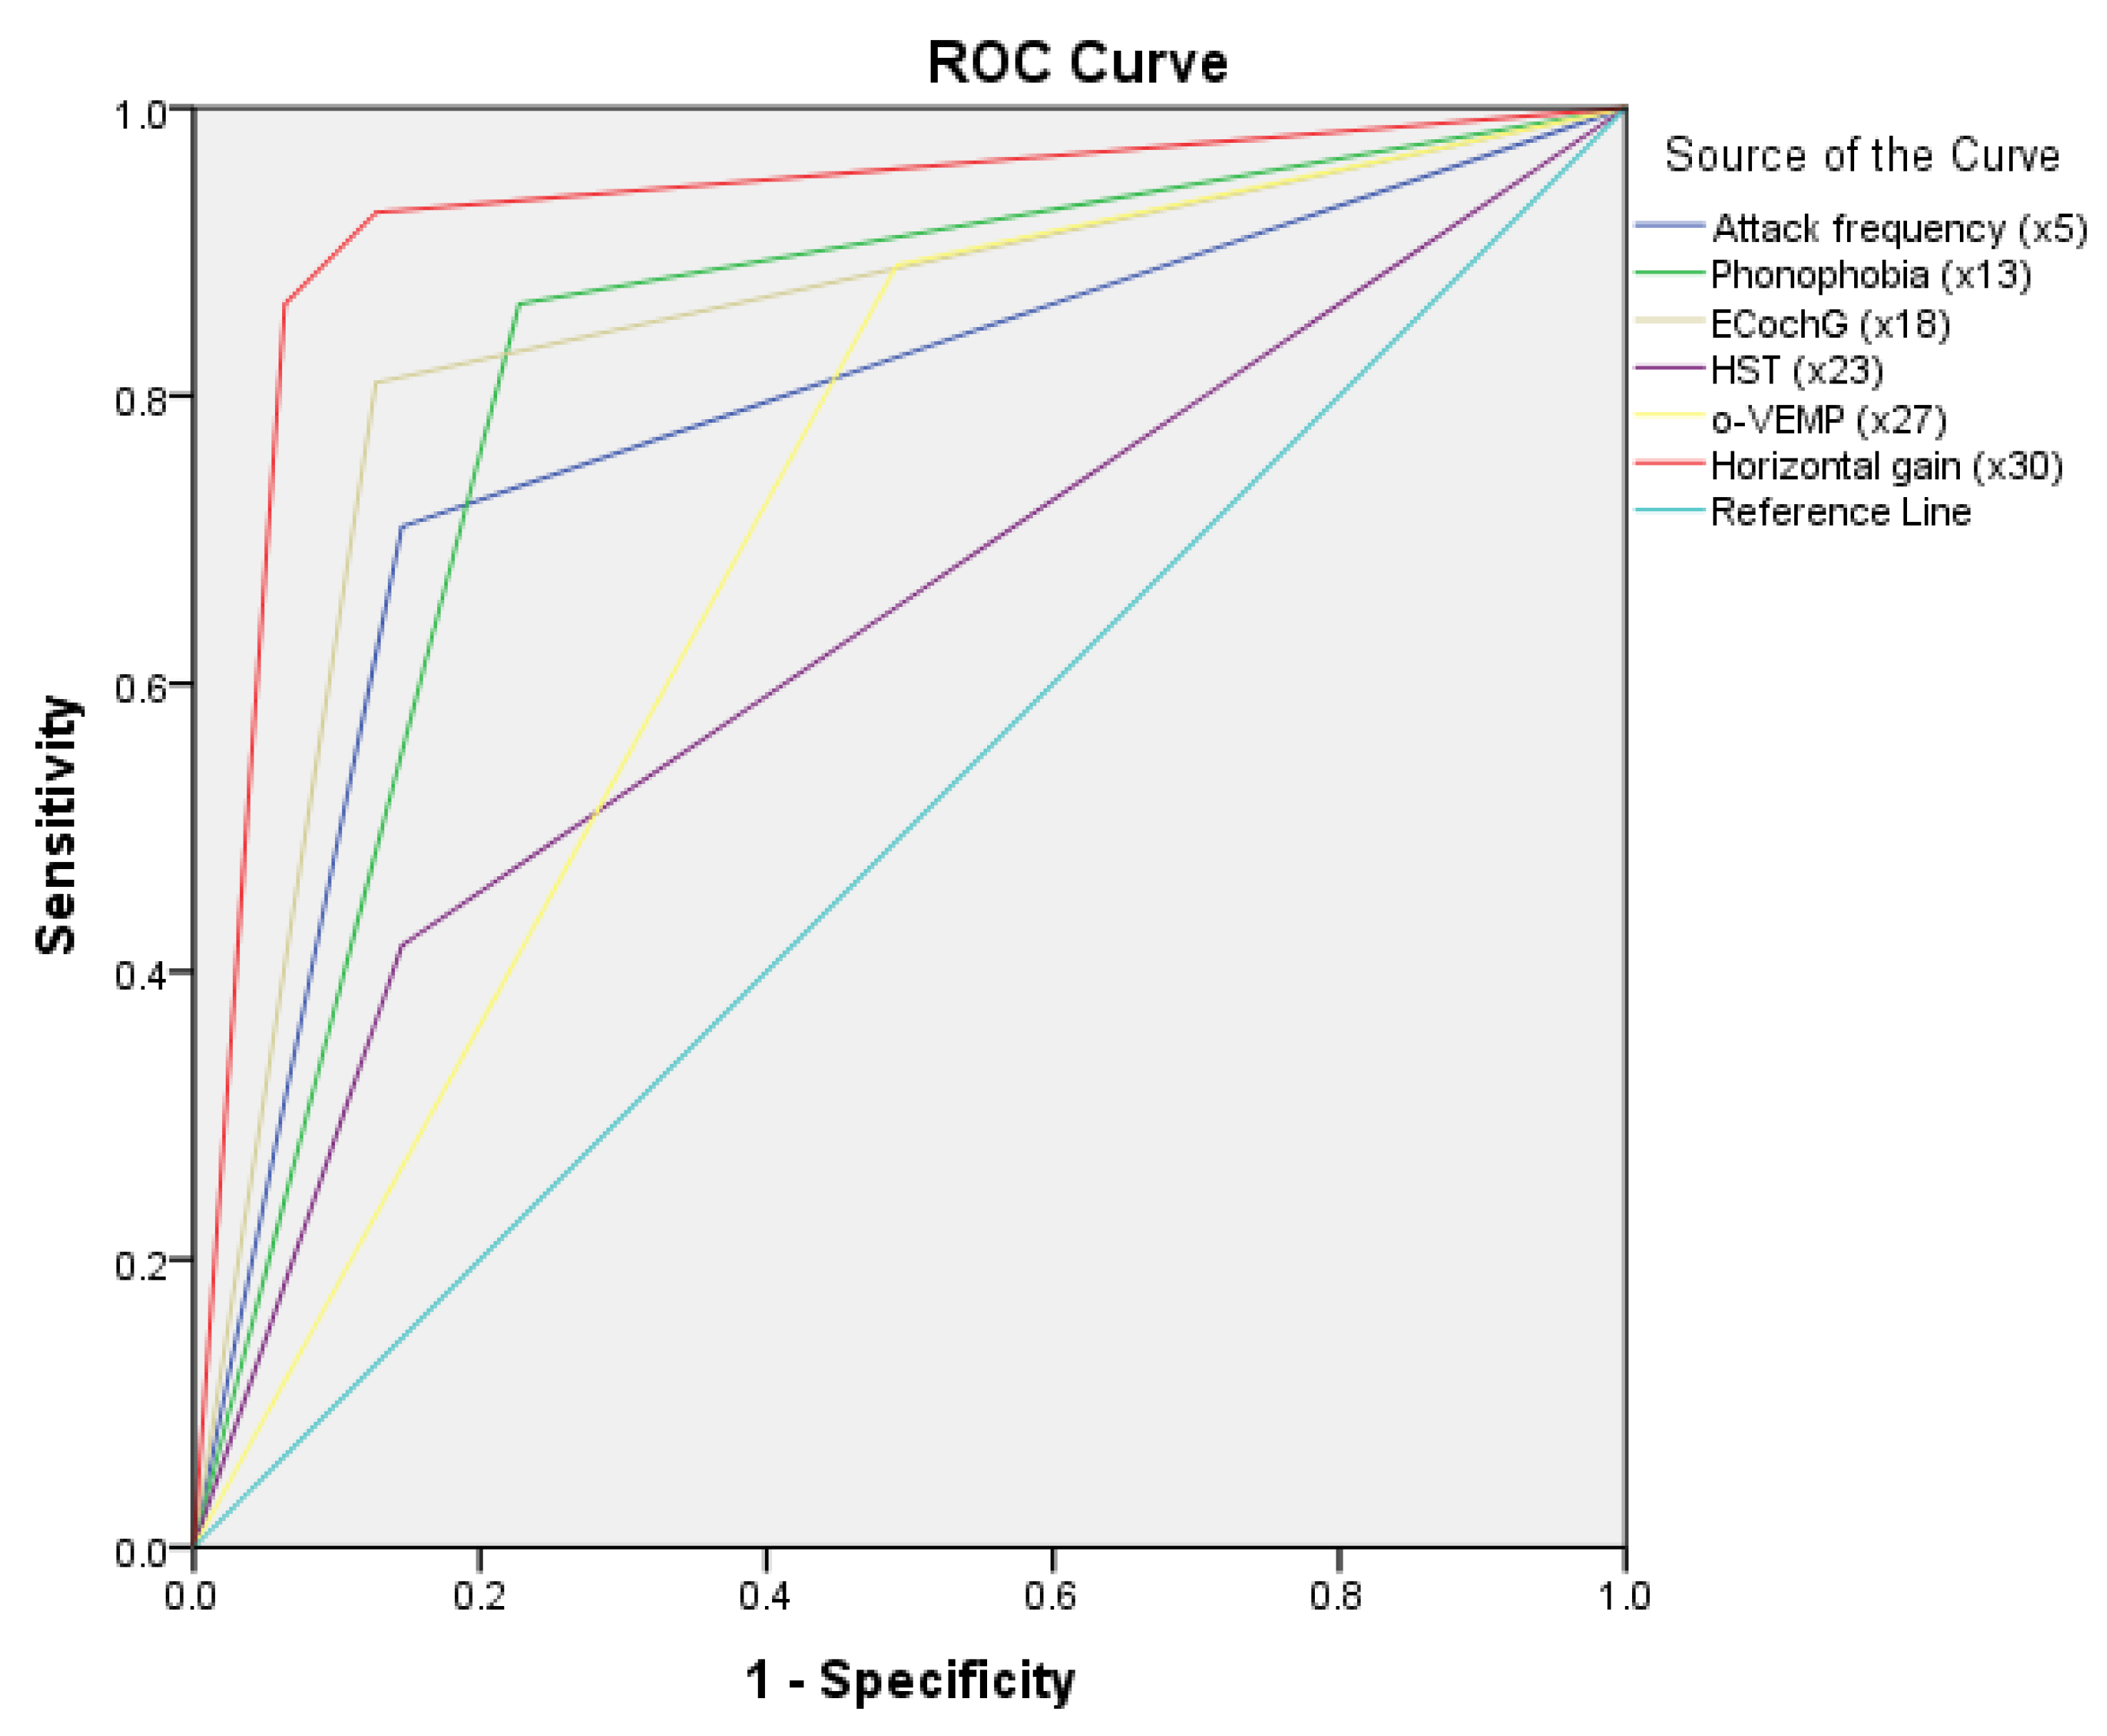
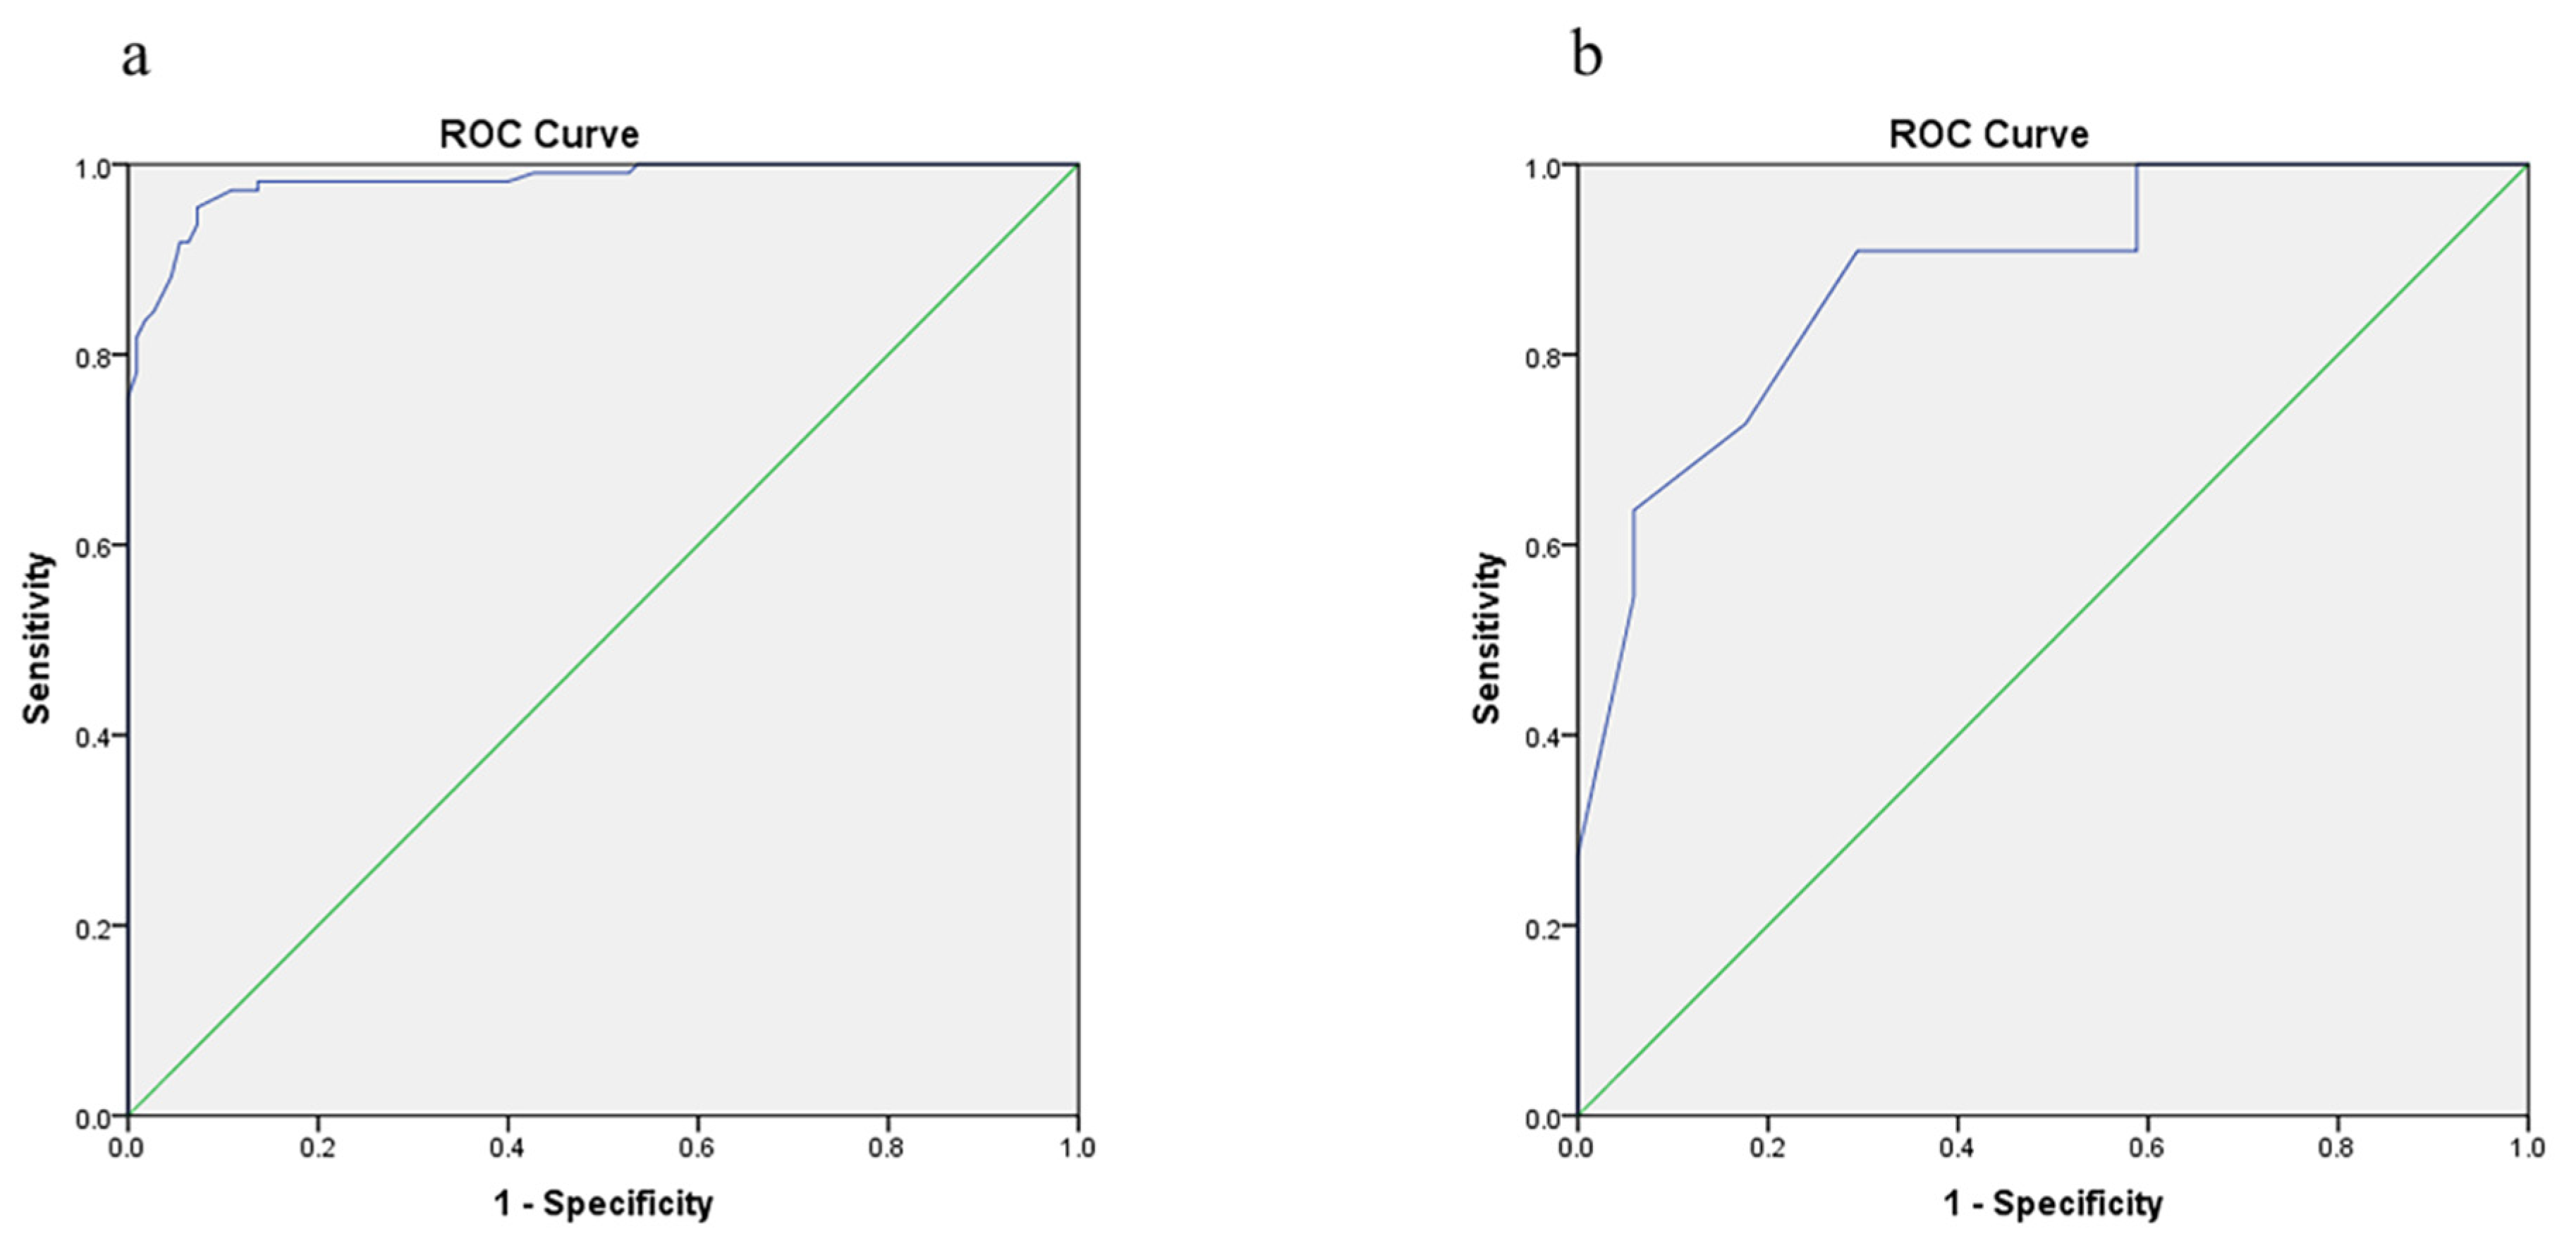
3.6. Discriminative Power
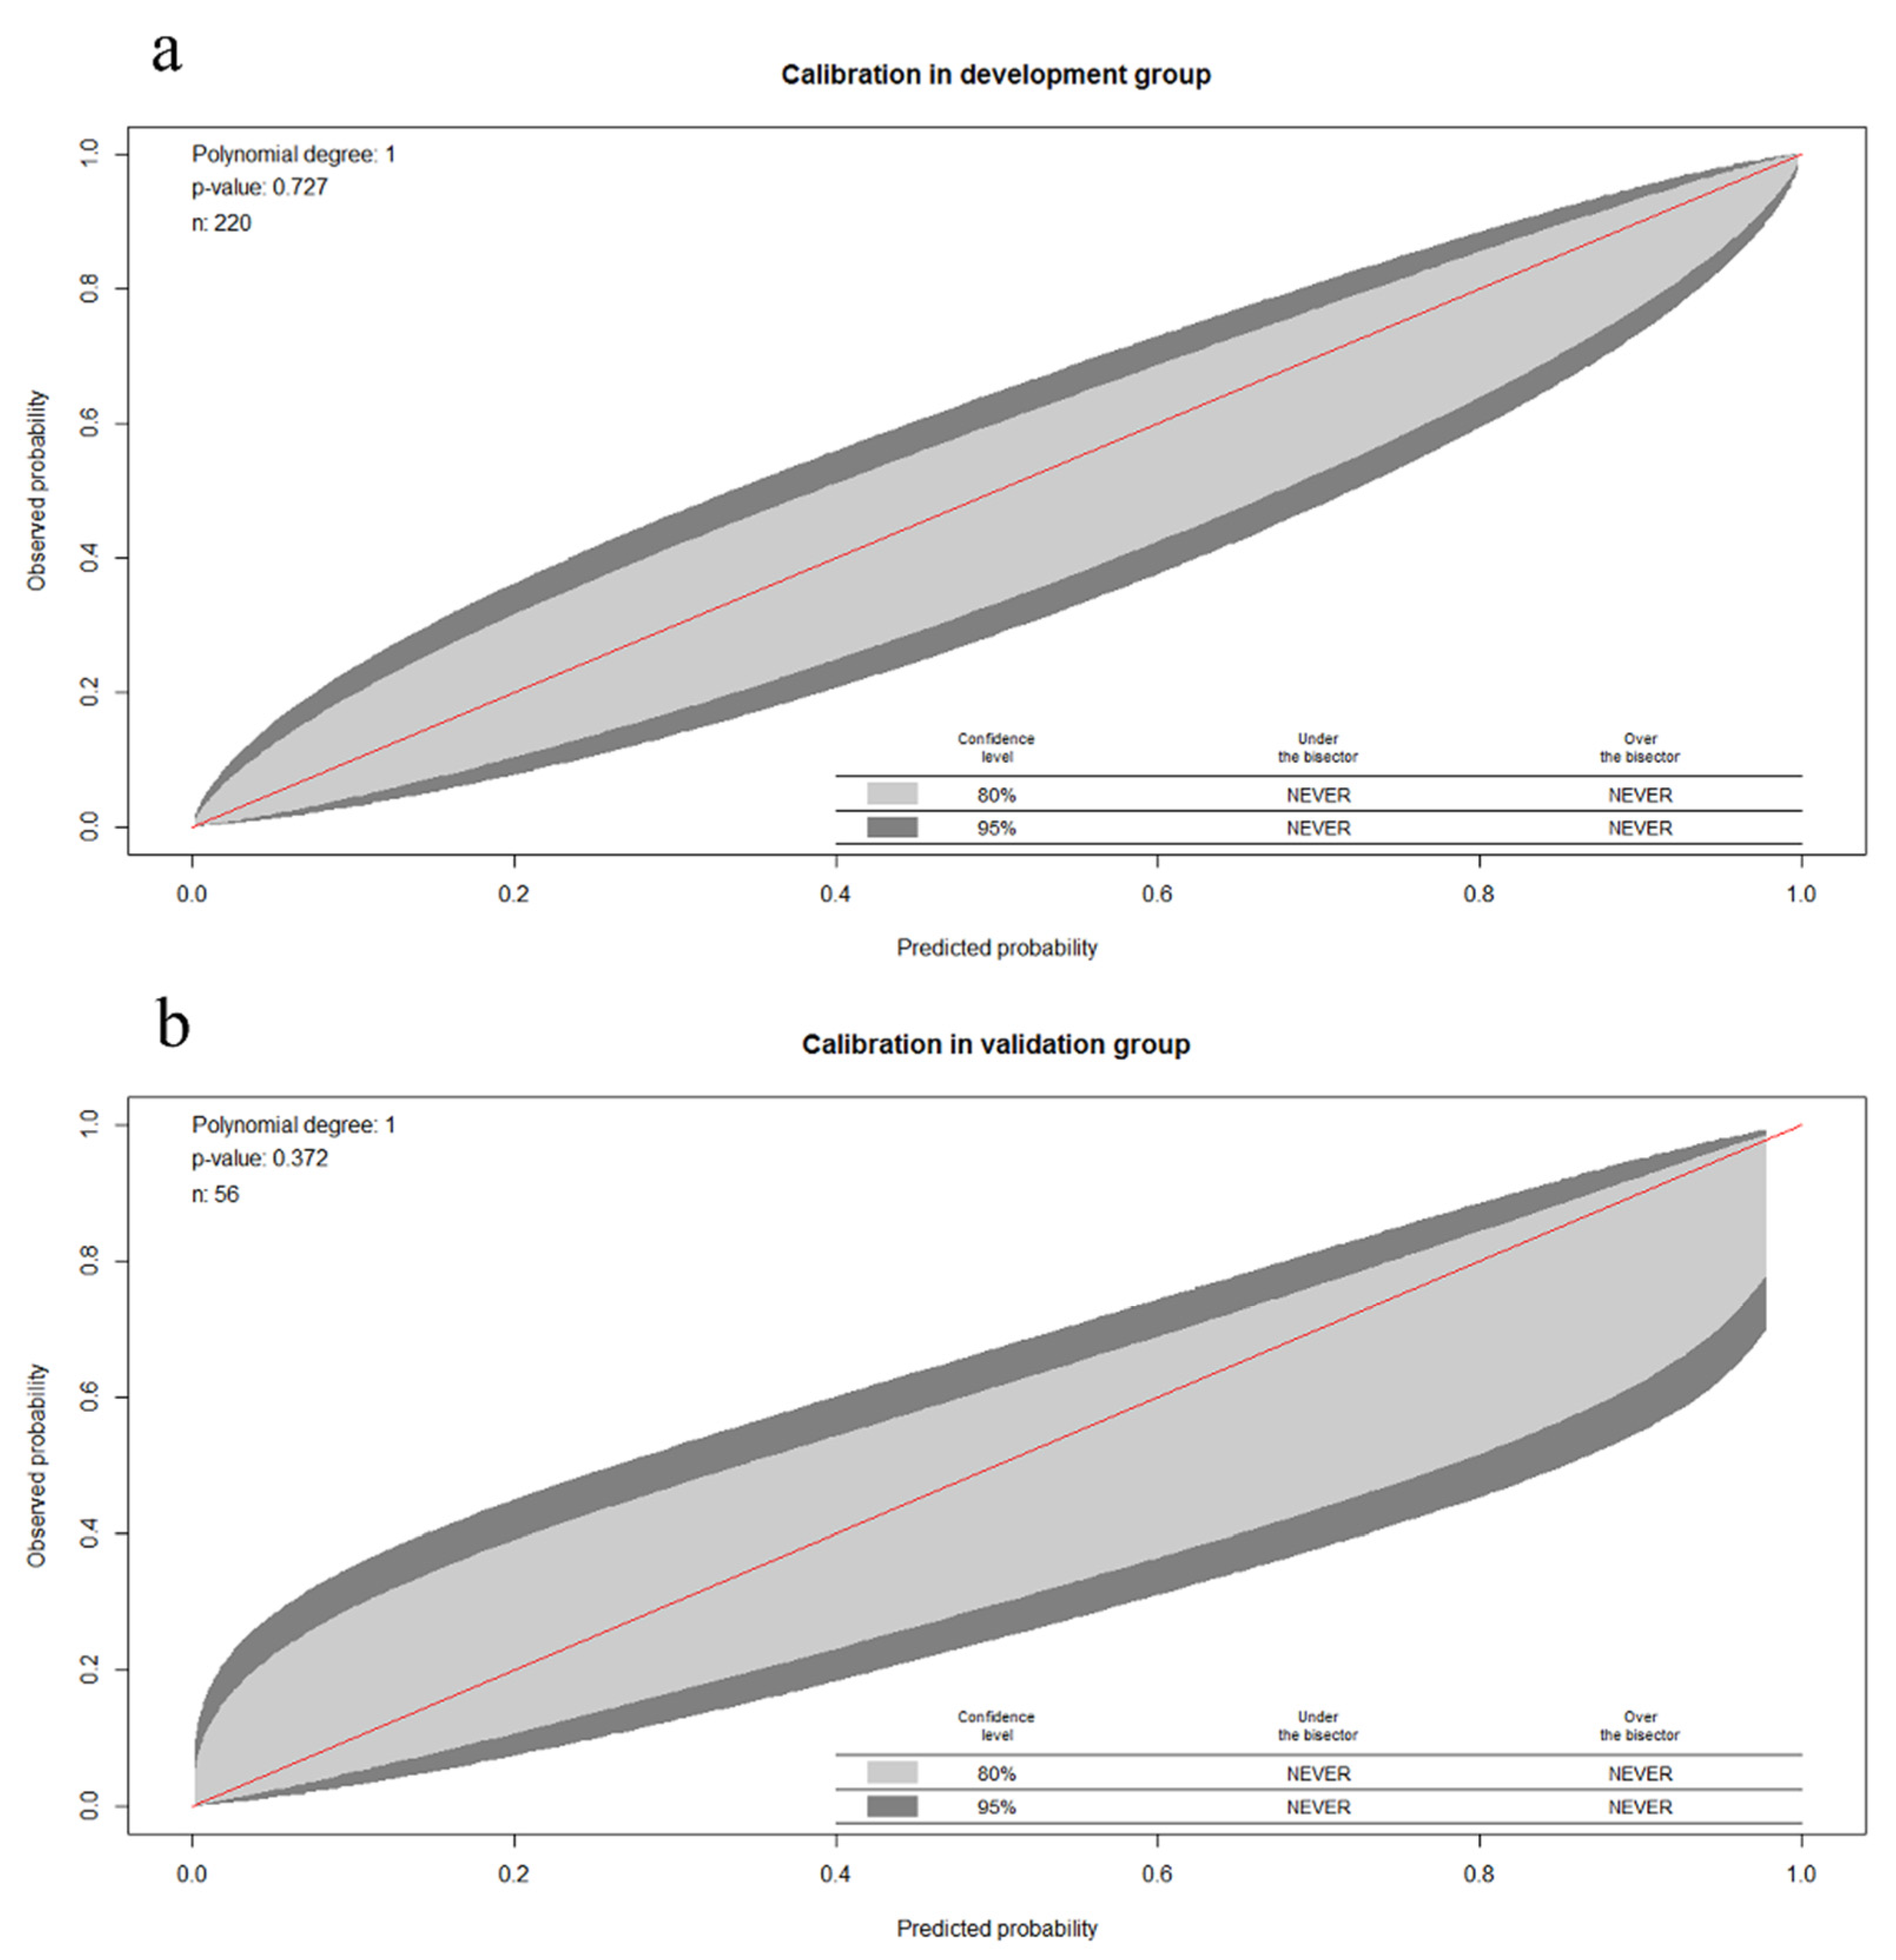
3.7. Calibrating Ability
4. Discussion
4.1. Clinical Symptoms
4.2. Auditory Function Results
4.3. Vestibular Function Findings
5. Conclusions
Supplementary Materials
Author Contributions
Funding
Institutional Review Board Statement
Informed Consent Statement
Conflicts of Interest
References
- Lopez-Escamez, J.A.; Carey, J.; Chung, W.H.; Goebel, J.A.; Magnusson, M.; Mandalà, M.; Newman-Toker, D.E.; Strupp, M.; Suzuki, M.; Trabalzini, F.; et al. Diagnostic criteria for Menière’s disease. J. Vestib. Res. 2015, 25, 1–7. [Google Scholar] [CrossRef]
- Lempert, T.; Olesen, J.; Furman, J.; Waterston, J.; Seemungal, B.; Carey, J.; Bisdorff, A.; Versino, M.; Evers, S.; Newman-Toker, D. Vestibular migraine: Diagnostic criteria. J. Vestib. Res. Equilib. Orientat. 2012, 22, 167–172. [Google Scholar] [CrossRef]
- Neuhauser, H.K.; Radtke, A.; von Brevern, M.; Feldmann, M.; Lezius, F.; Ziese, T.; Lempert, T. Migrainous vertigo: Prevalence and impact on quality of life. Neurology 2006, 67, 1028–1033. [Google Scholar] [CrossRef]
- Hochman, M.S. The interrelations of migraine, vertigo, and migrainous vertigo. Neurology 2001, 57, 1522. [Google Scholar] [CrossRef]
- Murofushi, T.; Tsubota, M.; Kitao, K.; Yoshimura, E. Simultaneous Presentation of Definite Vestibular Migraine and Definite Ménière’s Disease: Overlapping Syndrome of Two Diseases. Front. Neurol. 2018, 9, 749. [Google Scholar] [CrossRef]
- Pyykkö, I.; Pyykkö, N.; Manchaiah, V. Vestibular drop attacks in Ménière’s disease and its association with migraine. Eur. Arch. Otorhinolaryngol. 2020, 277, 1907–1916. [Google Scholar] [CrossRef] [PubMed]
- Neff, B.A.; Staab, J.P.; Eggers, S.D.; Carlson, M.L.; Schmitt, W.R.; Van Abel, K.M.; Worthington, D.K.; Beatty, C.W.; Driscoll, C.L.; Shepard, N.T. Auditory and vestibular symptoms and chronic subjective dizziness in patients with Ménière’s disease, vestibular migraine, and Ménière’s disease with concomitant vestibular migraine. Otol. Neurotol. 2012, 33, 1235–1244. [Google Scholar] [CrossRef]
- Moshtaghi, O.; Sahyouni, R.; Lin, H.W.; Ghavami, Y.; Djalilian, H.R. A Historical Recount: Discovering Menière’s Disease and Its Association With Migraine Headaches. Otol. Neurotol. 2016, 37, 1199–1203. [Google Scholar] [CrossRef]
- Dlugaiczyk, J.; Habs, M.; Dieterich, M. Vestibular evoked myogenic potentials in vestibular migraine and Menière’s disease: cVEMPs make the difference. J. Neurol. 2020, 267, 169–180. [Google Scholar] [CrossRef]
- Gürkov, R.; Kantner, C.; Strupp, M.; Flatz, W.; Krause, E.; Ertl-Wagner, B. Endolymphatic hydrops in patients with vestibular migraine and auditory symptoms. Eur. Arch. Oto-Rhino-Laryngol. 2014, 271, 2661–2667. [Google Scholar] [CrossRef]
- Oh, S.Y.; Dieterich, M.; Lee, B.N.; Boegle, R.; Kirsch, V. Endolymphatic Hydrops in Patients with Vestibular Migraine and Concurrent Meniere’s Disease. Front. Neurol. 2021, 12, 594481. [Google Scholar] [CrossRef]
- Shin, J.E.; Kim, C.H.; Park, H.J. Vestibular abnormality in patients with Meniere’s disease and migrainous vertigo. Acta Oto-Laryngol. 2013, 133, 154–158. [Google Scholar] [CrossRef]
- Groezinger, M.; Huppert, D.; Strobl, R.; Grill, E. Development and validation of a classification algorithm to diagnose and differentiate spontaneous episodic vertigo syndromes: Results from the DizzyReg patient registry. J. Neurol. 2020, 267, 160–167. [Google Scholar] [CrossRef]
- Kabade, V.; Hooda, R.; Raj, C.; Awan, Z.; Young, A.S.; Welgampola, M.S.; Prasad, M. Machine Learning Techniques for Differential Diagnosis of Vertigo and Dizziness: A Review. Sensors 2021, 21, 7565. [Google Scholar] [CrossRef] [PubMed]
- Lauritsen, J.M.; Bruus, M. EpiData Entry. A Comprehensive Tool for Validated Entry and Documentation of Data; The EpiData Association: Odense, Denmark, 2008. [Google Scholar]
- Collins, G.S.; Reitsma, J.B.; Altman, D.G.; Moons, K.G. Transparent Reporting of a multivariable prediction model for Individual Prognosis Or Diagnosis (TRIPOD): The TRIPOD Statement. Br. J. Surg. 2015, 102, 148–158. [Google Scholar] [CrossRef]
- Moons, K.G.M.; Wolff, R.F.; Riley, R.D.; Whiting, P.F.; Westwood, M.; Collins, G.S.; Reitsma, J.B.; Kleijnen, J.; Mallett, S. PROBAST: A Tool to Assess Risk of Bias and Applicability of Prediction Model Studies: Explanation and Elaboration. Ann. Intern. Med. 2019, 170, W1–W33. [Google Scholar] [CrossRef]
- Lopez-Escamez, J.A.; Dlugaiczyk, J.; Jacobs, J.; Lempert, T.; Teggi, R.; von Brevern, M.; Bisdorff, A. Accompanying Symptoms Overlap during Attacks in Menière’s Disease and Vestibular Migraine. Front. Neurol. 2014, 5, 265. [Google Scholar] [CrossRef] [PubMed]
- Radtke, A.; Neuhauser, H.; von Brevern, M.; Hottenrott, T.; Lempert, T. Vestibular migraine-validity of clinical diagnostic criteria. Cephalalgia 2011, 31, 906–913. [Google Scholar] [CrossRef]
- Brantberg, K.; Baloh, R.W. Similarity of vertigo attacks due to Meniere’s disease and benign recurrent vertigo, both with and without migraine. Acta Oto-Laryngol. 2011, 131, 722–727. [Google Scholar] [CrossRef]
- Ghavami, Y.; Mahboubi, H.; Yau, A.Y.; Maducdoc, M.; Djalilian, H.R. Migraine features in patients with Meniere’s disease. Laryngoscope 2016, 126, 163–168. [Google Scholar] [CrossRef]
- Vuralli, D.; Yildirim, F.; Akcali, D.T.; Ilhan, M.N.; Goksu, N.; Bolay, H. Visual and Postural Motion-Evoked Dizziness Symptoms Are Predominant in Vestibular Migraine Patients. Pain Med. 2018, 19, 178–183. [Google Scholar] [CrossRef]
- Huang, T.C.; Wang, S.J.; Kheradmand, A. Vestibular migraine: An update on current understanding and future directions. Cephalalgia 2020, 40, 107–121. [Google Scholar] [CrossRef]
- Aurora, S.K.; Wilkinson, F. The brain is hyperexcitable in migraine. Cephalalgia 2007, 27, 1442–1453. [Google Scholar] [CrossRef]
- Vass, Z.; Shore, S.E.; Nuttall, A.L.; Miller, J.M. Direct evidence of trigeminal innervation of the cochlear blood vessels. Neuroscience 1998, 84, 559–567. [Google Scholar] [CrossRef]
- Beh, S.C.; Masrour, S.; Smith, S.V.; Friedman, D.I. The Spectrum of Vestibular Migraine: Clinical Features, Triggers, and Examination Findings. Headache 2019, 59, 727–740. [Google Scholar] [CrossRef]
- Saberi, A.; Nemati, S.; Amlashi, T.T.; Tohidi, S.; Bakhshi, F. Phonophobia and migraine features in patients with definite meniere’s disease: Pentad or triad/tetrad? Acta Oto-Laryngol. 2020, 140, 548–552. [Google Scholar] [CrossRef]
- Kalita, J.; Misra, U.K.; Bansal, R. Phonophobia and brainstem excitability in migraine. Eur. J. Neurosci. 2021, 53, 1988–1997. [Google Scholar] [CrossRef]
- Levine, S.; Margolis, R.H.; Daly, K.A. Use of electrocochleography in the diagnosis of Meniere’s disease. Laryngoscope 1998, 108, 993–1000. [Google Scholar] [CrossRef]
- Ayub, A.; Qi, L.; Nunez, D.A. A systematic review and meta-analysis of extratympanic electrocochleography in Ménière’s disease diagnosis. Int. J. Audiol. 2019, 58, 533–540. [Google Scholar] [CrossRef] [PubMed]
- Nakada, T.; Yoshida, T.; Suga, K.; Kato, M.; Otake, H.; Kato, K.; Teranishi, M.; Sone, M.; Sugiura, S.; Kuno, K.; et al. Endolymphatic space size in patients with vestibular migraine and Ménière’s disease. J. Neurol. 2014, 261, 2079–2084. [Google Scholar] [CrossRef]
- Yang, T.H.; Lee, J.H.; Oh, S.Y.; Kang, J.J.; Kim, J.S.; Dieterich, M. Clinical implications of head-shaking nystagmus in central and peripheral vestibular disorders: Is perverted head-shaking nystagmus specific for central vestibular pathology? Eur. J. Neurol. 2020, 27, 1296–1303. [Google Scholar] [CrossRef]
- Gökgöz, M.C.; Satar, B.; Hıdır, Y.; Ceyhan, A.; Çoban, V.K. Recognizing Decompensated Meniere’s Disease Using High Frequency Rotational Test. J. Int. Adv. Otol. 2020, 16, 165–170. [Google Scholar] [CrossRef]
- Taylor, R.L.; Zagami, A.S.; Gibson, W.P.; Black, D.A.; Watson, S.R.; Halmagyi, M.G.; Welgampola, M.S. Vestibular evoked myogenic potentials to sound and vibration: Characteristics in vestibular migraine that enable separation from Meniere’s disease. Cephalalgia 2012, 32, 213–225. [Google Scholar] [CrossRef]
- Salviz, M.; Yuce, T.; Acar, H.; Taylan, I.; Yuceant, G.A.; Karatas, A. Diagnostic value of vestibular-evoked myogenic potentials in Ménière’s disease and vestibular migraine. J. Vestib. Res. Equilib. Orientat. 2016, 25, 261–266. [Google Scholar] [CrossRef] [PubMed]
- Baier, B.; Dieterich, M. Vestibular-evoked myogenic potentials in “vestibular migraine” and Menière’s disease: A sign of an electrophysiological link? Ann. N. Y. Acad. Sci. 2009, 1164, 324–327. [Google Scholar] [CrossRef] [PubMed]
- Blödow, A.; Heinze, M.; Bloching, M.B.; von Brevern, M.; Radtke, A.; Lempert, T. Caloric stimulation and video-head impulse testing in Ménière’s disease and vestibular migraine. Acta Oto-Laryngol. 2014, 134, 1239–1244. [Google Scholar] [CrossRef]
- Yilmaz, M.S.; Egilmez, O.K.; Kara, A.; Guven, M.; Demir, D.; Genc Elden, S. Comparison of the results of caloric and video head impulse tests in patients with Meniere’s disease and vestibular migraine. Eur. Arch. Oto-Rhino-Laryngol. 2021, 278, 1829–1834. [Google Scholar] [CrossRef]
- McGarvie, L.A.; Curthoys, I.S.; MacDougall, H.G.; Halmagyi, G.M. What does the head impulse test versus caloric dissociation reveal about vestibular dysfunction in Ménière’s disease? Ann. N. Y. Acad. Sci. 2015, 1343, 58–62. [Google Scholar] [CrossRef]
- Mallampalli, M.P.; Rizk, H.G.; Kheradmand, A.; Beh, S.C.; Abouzari, M.; Bassett, A.M.; Buskirk, J.; Ceriani, C.E.J.; Crowson, M.G.; Djalilian, H.; et al. Care Gaps and Recommendations in Vestibular Migraine: An Expert Panel Summit. Front. Neurol. 2022, 12, 812678. [Google Scholar] [CrossRef]
- Flook, M.; Frejo, L.; Gallego-Martinez, A.; Martin-Sanz, E.; Rossi-Izquierdo, M.; Amor-Dorado, J.C.; Soto-Varela, A.; Santos-Perez, S.; Batuecas-Caletrio, A.; Espinosa-Sanchez, J.M.; et al. Differential Proinflammatory Signature in Vestibular Migraine and Meniere Disease. Front. Immunol. 2019, 10, 1229. [Google Scholar] [CrossRef] [PubMed]
- Zhang, S.; Guo, Z.; Tian, E.; Liu, D.; Wang, J.; Kong, W. Meniere disease subtyping: The direction of diagnosis and treatment in the future. Expert Rev. Neurother. 2022, 22, 115–127. [Google Scholar] [CrossRef] [PubMed]
- Eckhard, A.H.; Zhu, M.; O’Malley, J.T.; Williams, G.H.; Loffing, J.; Rauch, S.D.; Nadol, J.B., Jr.; Liberman, M.C.; Adams, J.C. Inner ear pathologies impair sodium-regulated ion transport in Meniere’s disease. Acta Neuropathol. 2019, 137, 343–357. [Google Scholar] [CrossRef]
- Bächinger, D.; Brühlmann, C.; Honegger, T.; Michalopoulou, E.; Monge Naldi, A.; Wettstein, V.G.; Muff, S.; Schuknecht, B.; Eckhard, A.H. Endotype-Phenotype Patterns in Meniere’s Disease Based on Gadolinium-Enhanced MRI of the Vestibular Aqueduct. Front. Neurol. 2019, 10, 303. [Google Scholar] [CrossRef]
- Bächinger, D.; Luu, N.N.; Kempfle, J.S.; Barber, S.; Zürrer, D.; Lee, D.J.; Curtin, H.D.; Rauch, S.D.; Nadol, J.B., Jr.; Adams, J.C.; et al. Vestibular Aqueduct Morphology Correlates with Endolymphatic Sac Pathologies in Menière’s Disease-A Correlative Histology and Computed Tomography Study. Otol. Neurotol. 2019, 40, e548–e555. [Google Scholar] [CrossRef] [PubMed]


| Test | Equipment | Method | Parameter | Valuation |
|---|---|---|---|---|
| PTA | Madsen Electronics Orbiter 922 Version 2 Clinical Audiometer (Otometrics A/S, Taastrup, Denmark) | Patients wear earphones attached to the audiometer. Pure tones of a specific frequency and volume are delivered to one ear at a time. The patient is asked to signal when hearing a sound. Average hearing thresholds were expressed at 125–4000 and 8000 Hz. | Thresholds and frequencies | 0 = normal 1 = abnormal It was taken as abnormal if: PTA > 20 dBHL |
| OAE | Capella MADSEN company (Otometrics A/S, Taastrup, Den-mark) | A small probe is placed in the ear canal. This probe delivers a low-volume sound stimulus into the ear. The cochlea responds by producing an otoacoustic emission that travels back through the middle ear to the ear canal. | Otoacoustic emission is or not evoked. | 0 = normal 1 = abnormal It was taken as abnormal if: not evoked |
| Stapedius reflex | OTOFLE100 (Otometrics A/S, Taastrup, Denmark) | Dynamic changes result from contraction of stapedius in response to stimuli of 500, 1000, 2000, and 4000 Hz at intensities of 70–115 dB sound pressure level. | Thresholds for activation. | 0 = normal 1 = abnormal It was taken as abnormal if: not evoked |
| Glycerin test | Madsen Electronics Orbiter 922 Version 2 Clinical Audiometer (Otometrics A/S, Taastrup, Denmark) | PTA test is performed before the administration of glycerol and then patient is administered a solution of 86% of glycerol (1.5 mg/kg of body weight) dissolved in equal volume of physiological saline. PTA is then repeated at 1, 2, and 3 h of glycerol administration. | PTA threshold shift and speech discrimination | 0 = normal 1 = abnormal It was taken as abnormal if: (1) hearing threshold is lowered at least 15 dB at minimum three frequencies; (2) a total pure tone threshold shift of 25 dB at three consecutive frequencies; (3) 16% improvement in speech discrimination |
| ECochG | Nicolet Compass Meridian (nicolet compass, U.S.A) | A sticker electrode is placed on the forehead, and foil-covered earphones are inserted into the ear canals. An audio stimulus is presented to the patient through the earphones. An electrode picks up cochlear activity that occurs in response to the sound. | Summating potential/action potential (SP/AP) amplitude ratio | 0 = normal 1 = abnormal It was taken as abnormal if: an SP/AP amplitude ratio greater than 40–45% |
| Spontaneous nystagmus/Gaze test/Saccadic pursuit/Optokinetic test | VisalEyesTM VNG, Micromedical Technologies Inc., Chatham, IL, USA | Spontaneous nystagmus: The patient looks straight ahead without focusing and is observed for nystagmus. Gaze test: the patient follows aim, so she/he is looking 30° to the right, left, up, and down. There is a pause of 20 s in each of these positions to observe for nystagmus. Saccadic pursuit: the patient follows a slowly moving aim horizontally and then vertically (from center to 30° right and then to 30° left). Optokinetic test: an individual tracks (pursuit movement) a moving object with their eyes. | Induced different type of nystagmus | 0 = normal 1 = abnormal It was taken as abnormal if: patient’s eyes are observed for nystagmus |
| HST | / | The patient’s eyes are observed for nystagmus immediately after a passive rapid head shaking along a vertical axis at about a frequency of 2 Hz, for 20 cycles. | Induced different type of nystagmus | 0 = normal 1 = abnormal It was taken as abnormal if: patient’s eyes are observed for nystagmus |
| Dix-Hallpike/Roll test | VisualEyesTM VNG, Micromedical Technologies Inc., USA | Patient sits on a couch. Examiner holds the patients head, turns it 45° to the right, and then places the patient in a supine position so that the head hangs 30° below the horizontal. The test is repeated with head turned to left and then again in straight head-hanging position. It often used to check for a common type of vertigo called BPPV. | Induced different type of nystagmus | 0 = negative 1 = positive It was taken as positive if: patient’s eyes are observed for nystagmus |
| Caloric test | Air caloric irrigator system (Air Fx from Micromedical Technologies Inc., USA) | VNG is used to record eye movements during the caloric test. Before the test, the ear, especially the eardrum, is checked. A small amount of cold/warm air is gently delivered into ears. The temperature of the warm and cool air is 50 °C and 24 °C, respectively. | Unilateral weakness (UW) | 0 = normal 1 = abnormal It was taken as abnormal if: |UW%| greater than 25% |
| c-VEMP | Eclipse system (from Interacoustics A/S, Middelfart, Denmark) | Participants are asked to sit on a chair and rotate heir head to the contralateral side to activate SCM muscles. An active electrode is placed on the upper third of the ipsilateral SCM muscles, a ground electrode is put on the forehead, and a reference electrode is put on the sternoclavicular junction. Stimuli are produced by a customized VEMP software package (OtoAccess, from Interacoustics A/S, Middelfart, Denmark). | The amplitude asymmetry ratio (AR) and peak-to-peak cVEMP amplitude | 0 = normal 1 = abnormal It was taken as abnormal if: (1) The AR is greater than 36%; (2) the peak-to-peak cVEMP amplitude is absent or reduced |
| o-VEMP | Eclipse system (from Interacoustics A/S, Middelfart, Denmark) | Participants sit on a chair and are instructed to stare up at a red spot fixed on the wall at midline in front of them. The stare forces the participants to elevate and maintain their gaze up to approximately 30° above the horizontal plane during each session of the test. An active electrode is positioned on the contralateral inferior oblique muscles, a ground electrode is applied on the forehead, and a reference electrode is placed on the chin. | Biphasic wave-form and amplitude asymmetry ratio (AR) | 0 = normal 1 = abnormal It was taken as abnormal if: (1) Biphasic waveform was absent after at least 50 responses; (2) the AR is greater than 40% |
| v-HIT | ICS Impulse system (GN Otometrics, Denmark) | Subject wears a pair of tightly-fitting goggles equipped with video oculography camera to record and analyze the eye movement. Patient is seated upright facing the wall 1.0 m away and is instructed to fixate on a static target on the wall. The patient’s head is passively and randomly rotated to the left and right with a low amplitude (5~15°) and at a high peak velocity (150~250°/s) in an abrupt, brief and unpredictable manner. At least 20 head impulses are delivered in each direction. | Horizontal vHIT gain and re-fixation saccades | 0 = normal 1 = abnormal It was taken as abnormal if the horizontal vHIT gain is <0.8 and saccades appear |
| VAT | Software package (VATPLUS®) from WSR (Western System Research, Pasadena, CA, USA) | The patient is required to fix the eyes on a target 120 cm away and asked to perform head rotations on horizontal and vertical planes. Velocity is set at 0.5–0.9 Hz in the first 6 s, and it gradually rises from 1 to 6 Hz in the next 12 s. | The gain, phase, and asymmetry are recorded at the frequencies of 2.0–6.0 Hz | 0 = subnormal 1 = normal 2 = paranormal It was taken as abnormal if: Gain: The ratio of eye to head speed is <1: subnormal; the ratio of eye to head speed >1: paranormal; the ratio of eye to head speed close to 1: normal. Phase: The response time delay. Symmetry of left and right eye velocity (normal <±10%) |
| SOT | SMARTEquitest platform (NeuroCom International Inc., Clackamas, OR, USA) | Participants stand on a SMART Equitest platform and are asked to stand upright and maintain balance during the test. There are six sensory conditions (SOT1-SOT6). | Vestibular (VEST ratio) = SOT5/SOT1 | 0 = normal 1 = abnormal It was taken as abnormal if: VEST ratio < 0.577; it was taken as normal if: VEST ratio > 0.577 |
| Parameter | VM (n = 110) | MD (n = 110) | p-Value | Code | Valuation |
|---|---|---|---|---|---|
| Demographic features | |||||
| Gender(male/female) ratio | 44/66 | 65/45 | 0.120 | X1 | 0 = female, 1 = male |
| Age (range) year | 50.18 ± 13.318 | 48.95 ± 12.457 | 0.310 | X2 | continuous variable |
| Clinical features | |||||
| Vertigo/dizzy (%) | 98.2 | 95.4 | 0.840 | X3 | 0 = none 1 = yes |
| Illness duration (%) | 7.1/17.9/32.1/42.9 | 0/9/45.5/45.5 | 0.002 * | X4 | 0 =< 7 d, 1 = 7 d~30 d, 2 = 1 m~1 y, 3 => 1 y |
| Attack frequency (%) | 14.9/85.1 | 71.5/29.5 | 0.000 * | X5 | 0 =< 3 times 1 => 3 times |
| Visual motion (%) | 61.8 | 59.1 | 0.754 | X6 | 0 = none 1 = yes |
| Nausea and vomiting (%) | 63.6 | 72.7 | 0.281 | X7 | 0 = none 1 = yes |
| Hearing impairment (%) | 46.7 | 81.8 | 0.043 * | X8 | 0 = none 1 = yes |
| Tinnitus (%) | 57.3 | 63.6 | 0.334 | X9 | 0 = none 1 = yes |
| Aural fullness (%) | 10.9 | 23.7 | 0.002 * | X10 | 0 = none 1 = yes |
| Headache with vestibular episodes (%) | 47.3 | 13.6 | 0.000 * | X11 | 0 = none 1 = yes |
| Photophobia (%) | 73.0 | 14.2 | 0.000 * | X12 | 0 = none 1 = yes |
| Phonophobia (%) | 77.3 | 13.6 | 0.000 * | X13 | 0 = none 1 = yes |
| Auditory-vestibular function | |||||
| PTA (%) | 45.5 | 80.9 | 0.000 * | X14 | 0 = normal 1 = abnormal |
| OAE (%) | 80 | 73.6 | 0.263 | X15 | 0 = normal 1 = abnormal |
| Stapedius reflex (%) | 1.8 | 9.1 | 0.100 | X16 | 0 = negative 1 = positive |
| Glycerin test (%) | 14.5 | 70.9 | 0.000 * | X17 | 0 = negative 1 = positive |
| ECochG (%) | 12.7 | 80.9 | 0.000 * | X18 | 0 = normal 1 = abnormal |
| Spontaneous nystagmus (%) | 12.7 | 18.2 | 0.382 | X19 | 0 = negative 1 = positive |
| Gaze test (%) | 3.6 | 1.0 | 0.450 | X20 | 0 = normal 1 = abnormal |
| Saccadic pursuit (%) | 3.6 | 2.4 | 0.579 | X21 | 0 = normal 1 = abnormal |
| Optokinetic test (%) | 9.7 | 13.6 | 0.070 | X22 | 0 = normal 1 = abnormal |
| HST (%) | 14.5 | 39.8 | 0.000 * | X23 | 0 = normal 1 = abnormal |
| Dix-Hallpike (%) | 32.7 | 13.6 | 0.054 | X24 | 0 = negative 1 = positive |
| Roll test (%) | 21.8 | 9.1 | 0.064 | X25 | 0 = negative 1 = positive |
| Caloric test (%) | 30.9 | 54.5 | 0.000 * | X26 | 0 = normal 1 = abnormal |
| o-VEMP (%) | 25.5 | 74.5 | 0.000 * | X27 | 0 = normal 1 = abnormal |
| c-VEMP (%) | 23.6 | 31.8 | 0.296 | X28 | 0 = normal 1 = abnormal |
| v-HIT (%) | 58.7 | 63.6 | 0.170 | X29 | 0 = normal 1 = abnormal |
| VAT (Horizontal gain) (%) | 6.4/6.4/87.3 | 86.4/6.4/7.3 | 0.000 * | X30 | 0 = subnormal, 1 = normal, 2 = paranormal |
| VAT (Horizontal phase) (%) | 3.6/27.3/69.1 | 1.3/58.1/40.6 | 0.000 * | X31 | 0 = subnormal, 1 = normal, 2 = paranormal |
| VAT (Vertical gain) (%) | 0/94.5/5.5 | 1/93/6 | 0.184 | X32 | 0 = subnormal, 1 = normal, 2 = paranormal |
| VAT (Vertical phase) (%) | 0/94.5/5.5 | 6/92/2 | 0.184 | X33 | 0 = subnormal, 1 = normal, 2 = paranormal |
| VAT (Asymmetry) (%) | 12.7 | 13.6 | 0.879 | X34 | 0 = normal 1 = abnormal |
| SOT (Vestibular) (%) | 60.0/40.0 | 77.3/22.7 | 0.140 | X35 | 0 = normal 1 = abnormal |
| Radiologic | |||||
| MRI (%) | 10.9 | 13.6 | 0.634 | X36 | 0 = normal 1 = abnormal |
| Rating Scale | |||||
| PHQ9 (%) | 32.7 | 18.2 | 0.071 | X37 | 0 = normal 1 = abnormal |
| GAD7 (%) | 21.8 | 9.1 | 0.064 | X38 | 0 = normal 1 = abnormal |
| SCL90 (%) | 14.5 | 13.6 | 0.884 | X39 | 0 = normal 1 = abnormal |
| SSS (%) | 80.0 | 90.0 | 0.630 | X40 | 0 = normal 1 = abnormal |
| Indexes (Variable Code) | B | SE | Wald X2 | p-Value | OR (95% CI) |
|---|---|---|---|---|---|
| Attack frequency (X5) | −2.269 | 0.979 | 5.376 | 0.020 | 0.103 (0.015–0.704) |
| Phonophobia (X13) | −2.395 | 0.900 | 7.076 | 0.008 | 0.091 (0.016~0.532) |
| ECochG (X18) | 2.141 | 0.859 | 6.206 | 0.013 | 8.505 (1.578~45.828) |
| HST (X23) | 3.949 | 1.317 | 8.986 | 0.03 | 51.861 (3.923–68.531) |
| o-VEMP (X27) | 2.798 | 0.901 | 9.643 | 0.002 | 16.405 (2.806~95.898) |
| Horizontal gain (X30) | −4.458 | 1.008 | 19.569 | 0.000 | 0.012 (0.002~0.084) |
| Constant | 0.873 | 1.252 | 0.486 | 0.486 | 2.394 |
| Features | Sensitivity | Specificity | Accuracy | Positive PV | Negative PV |
|---|---|---|---|---|---|
| Attack frequency | 70.9 | 85.5 | 78.2 | 83 | 74.6 |
| Phonophobia | 86.4 | 77.3 | 81.8 | 79.2 | 85 |
| ECochG | 80.9 | 87.3 | 84.1 | 86.4 | 82.1 |
| HST | 58.2 | 85.5 | 71.8 | 80 | 67.1 |
| o-VEMP | 89.1 | 50.9 | 70.0 | 64.5 | 82.4 |
| Horizontal gain | 92.7 | 87.3 | 90 | 87.9 | 92.3 |
| Diagnostic model | 93.3 | 94.5 | 95.9 | 94.7 | 93.2 |
Publisher’s Note: MDPI stays neutral with regard to jurisdictional claims in published maps and institutional affiliations. |
© 2022 by the authors. Licensee MDPI, Basel, Switzerland. This article is an open access article distributed under the terms and conditions of the Creative Commons Attribution (CC BY) license (https://creativecommons.org/licenses/by/4.0/).
Share and Cite
Liu, D.; Guo, Z.; Wang, J.; Tian, E.; Chen, J.; Zhou, L.; Kong, W.; Zhang, S. Development and Validation of the Predictive Model for the Differentiation between Vestibular Migraine and Meniere’s Disease. J. Clin. Med. 2022, 11, 4745. https://doi.org/10.3390/jcm11164745
Liu D, Guo Z, Wang J, Tian E, Chen J, Zhou L, Kong W, Zhang S. Development and Validation of the Predictive Model for the Differentiation between Vestibular Migraine and Meniere’s Disease. Journal of Clinical Medicine. 2022; 11(16):4745. https://doi.org/10.3390/jcm11164745
Chicago/Turabian StyleLiu, Dan, Zhaoqi Guo, Jun Wang, E Tian, Jingyu Chen, Liuqing Zhou, Weijia Kong, and Sulin Zhang. 2022. "Development and Validation of the Predictive Model for the Differentiation between Vestibular Migraine and Meniere’s Disease" Journal of Clinical Medicine 11, no. 16: 4745. https://doi.org/10.3390/jcm11164745
APA StyleLiu, D., Guo, Z., Wang, J., Tian, E., Chen, J., Zhou, L., Kong, W., & Zhang, S. (2022). Development and Validation of the Predictive Model for the Differentiation between Vestibular Migraine and Meniere’s Disease. Journal of Clinical Medicine, 11(16), 4745. https://doi.org/10.3390/jcm11164745