
Porous Media Computational Fluid Dynamics and the Role of the First Coil in the Embolization of Ruptured Intracranial Aneurysms


 , , ,
, , ,  and
and
Abstract
1. Introduction
2. Material and Methods
2.1. Ethics Approval
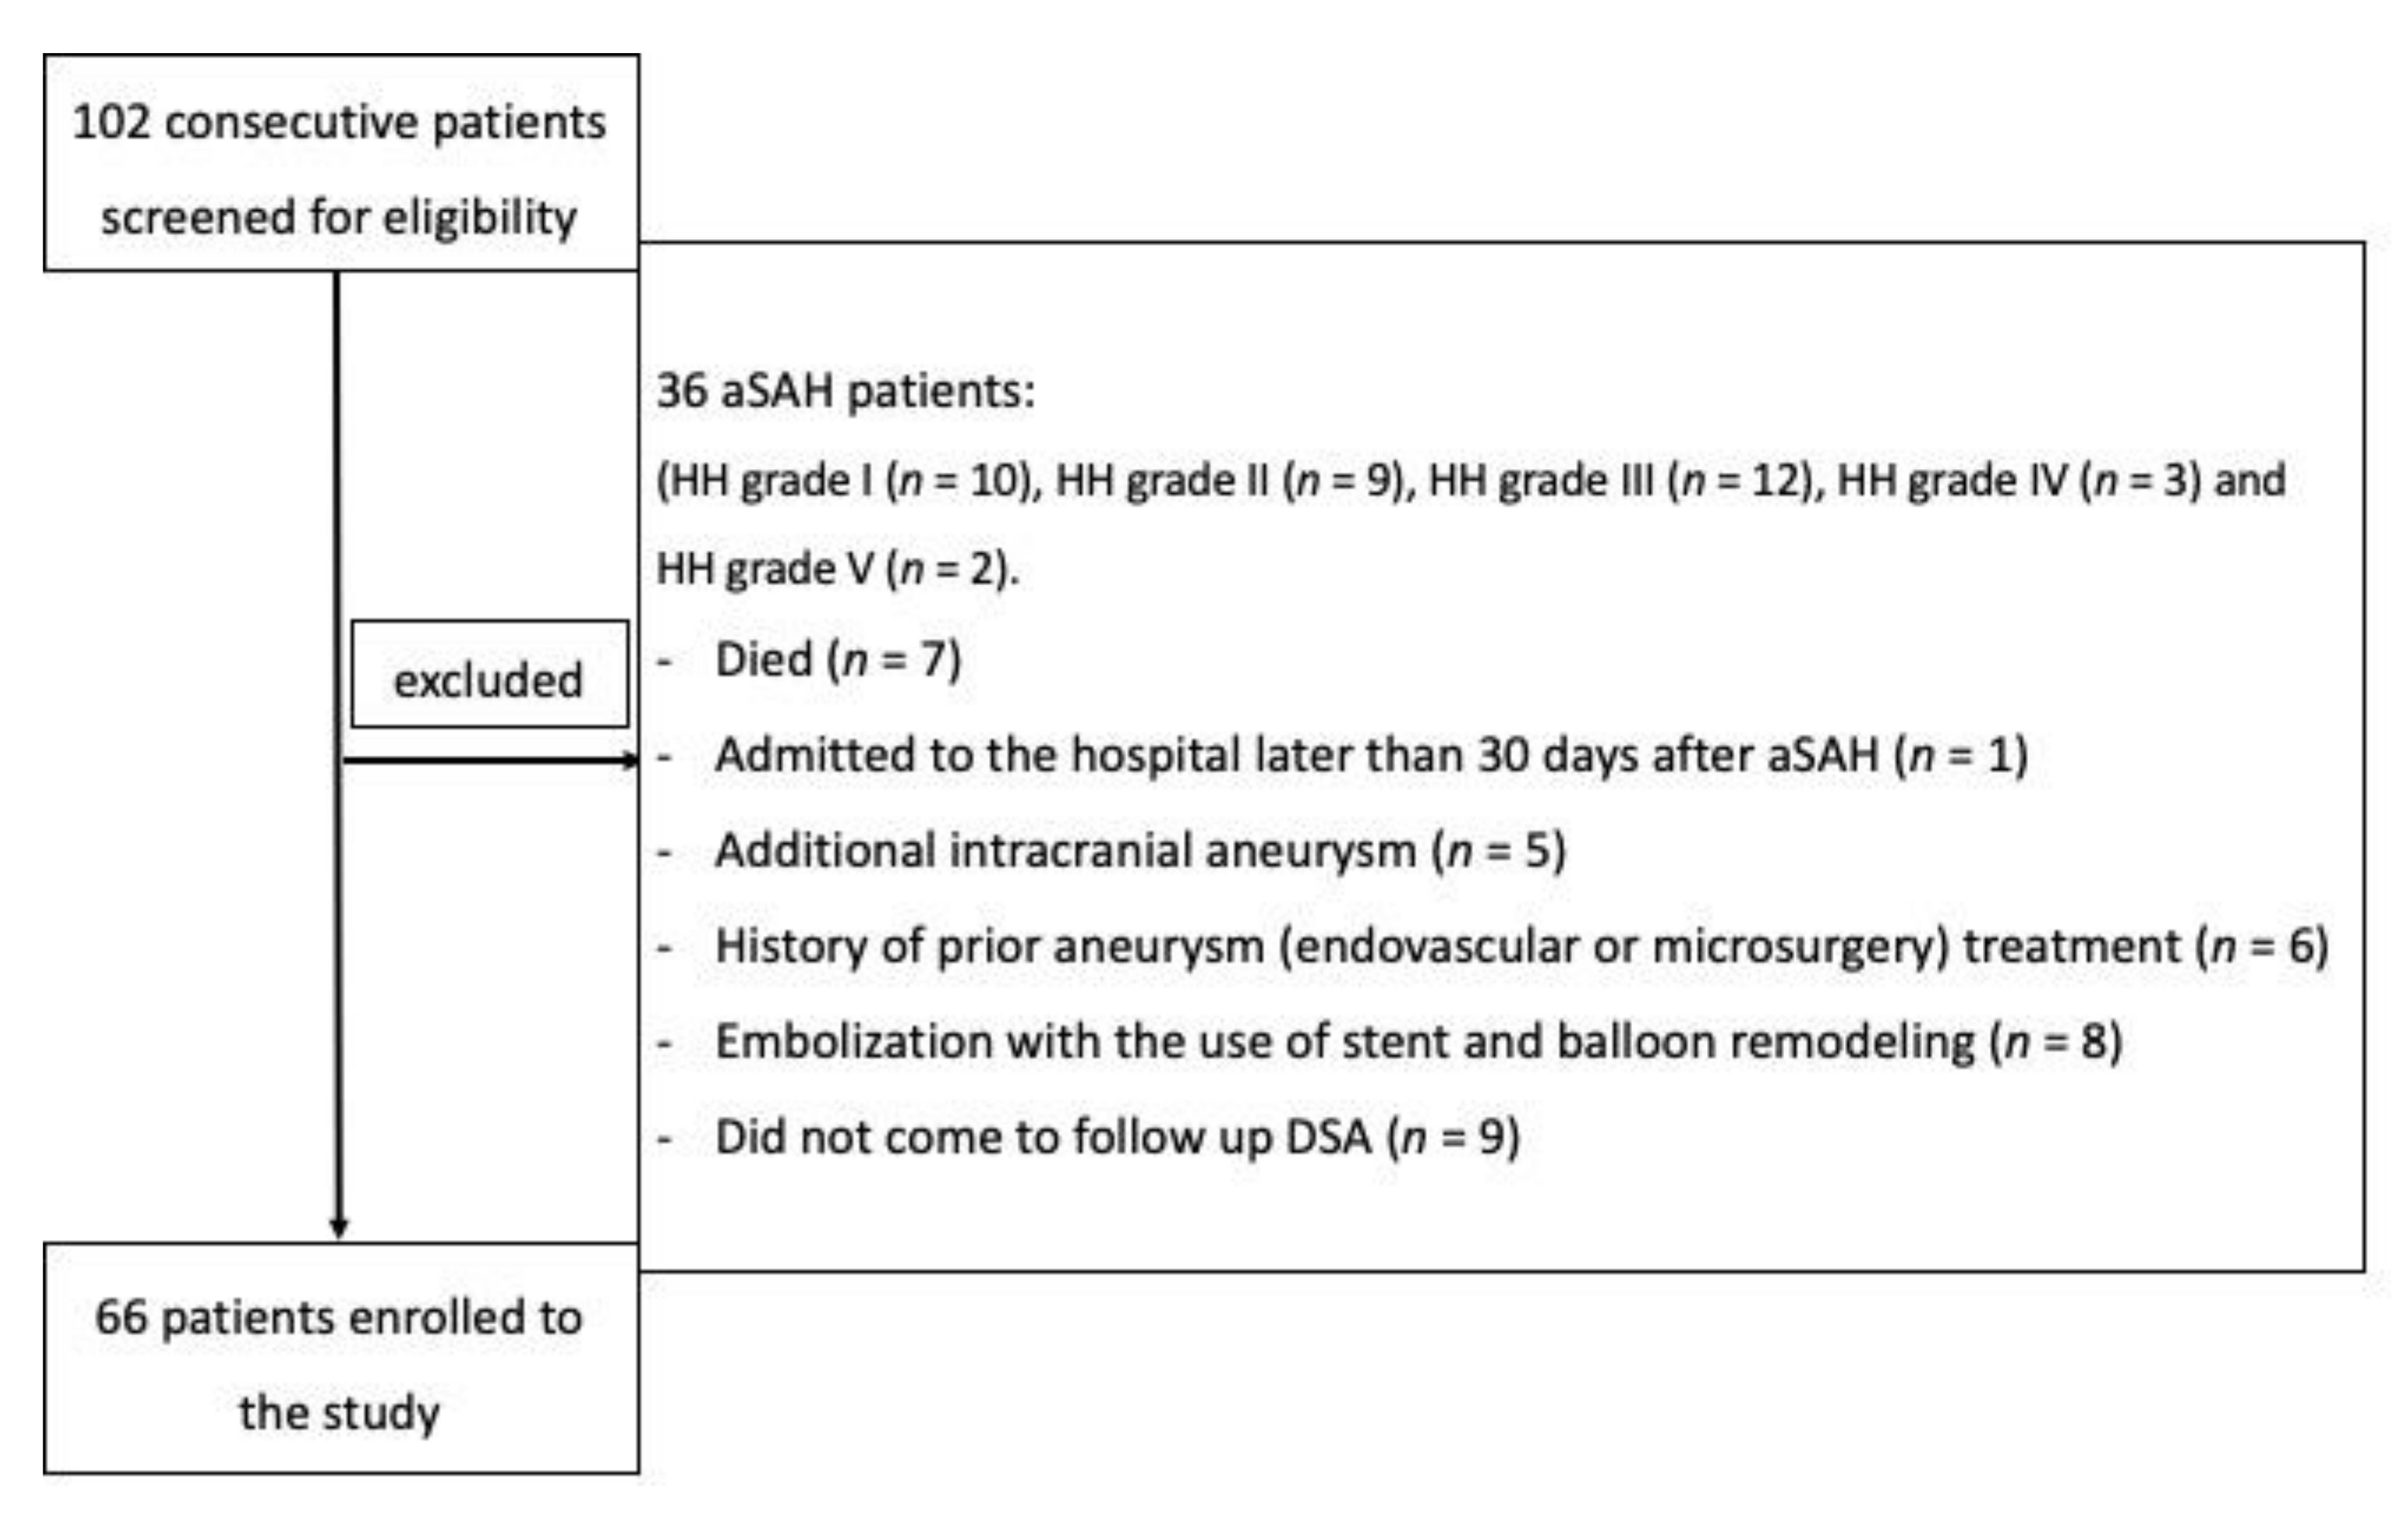
2.2. Patients
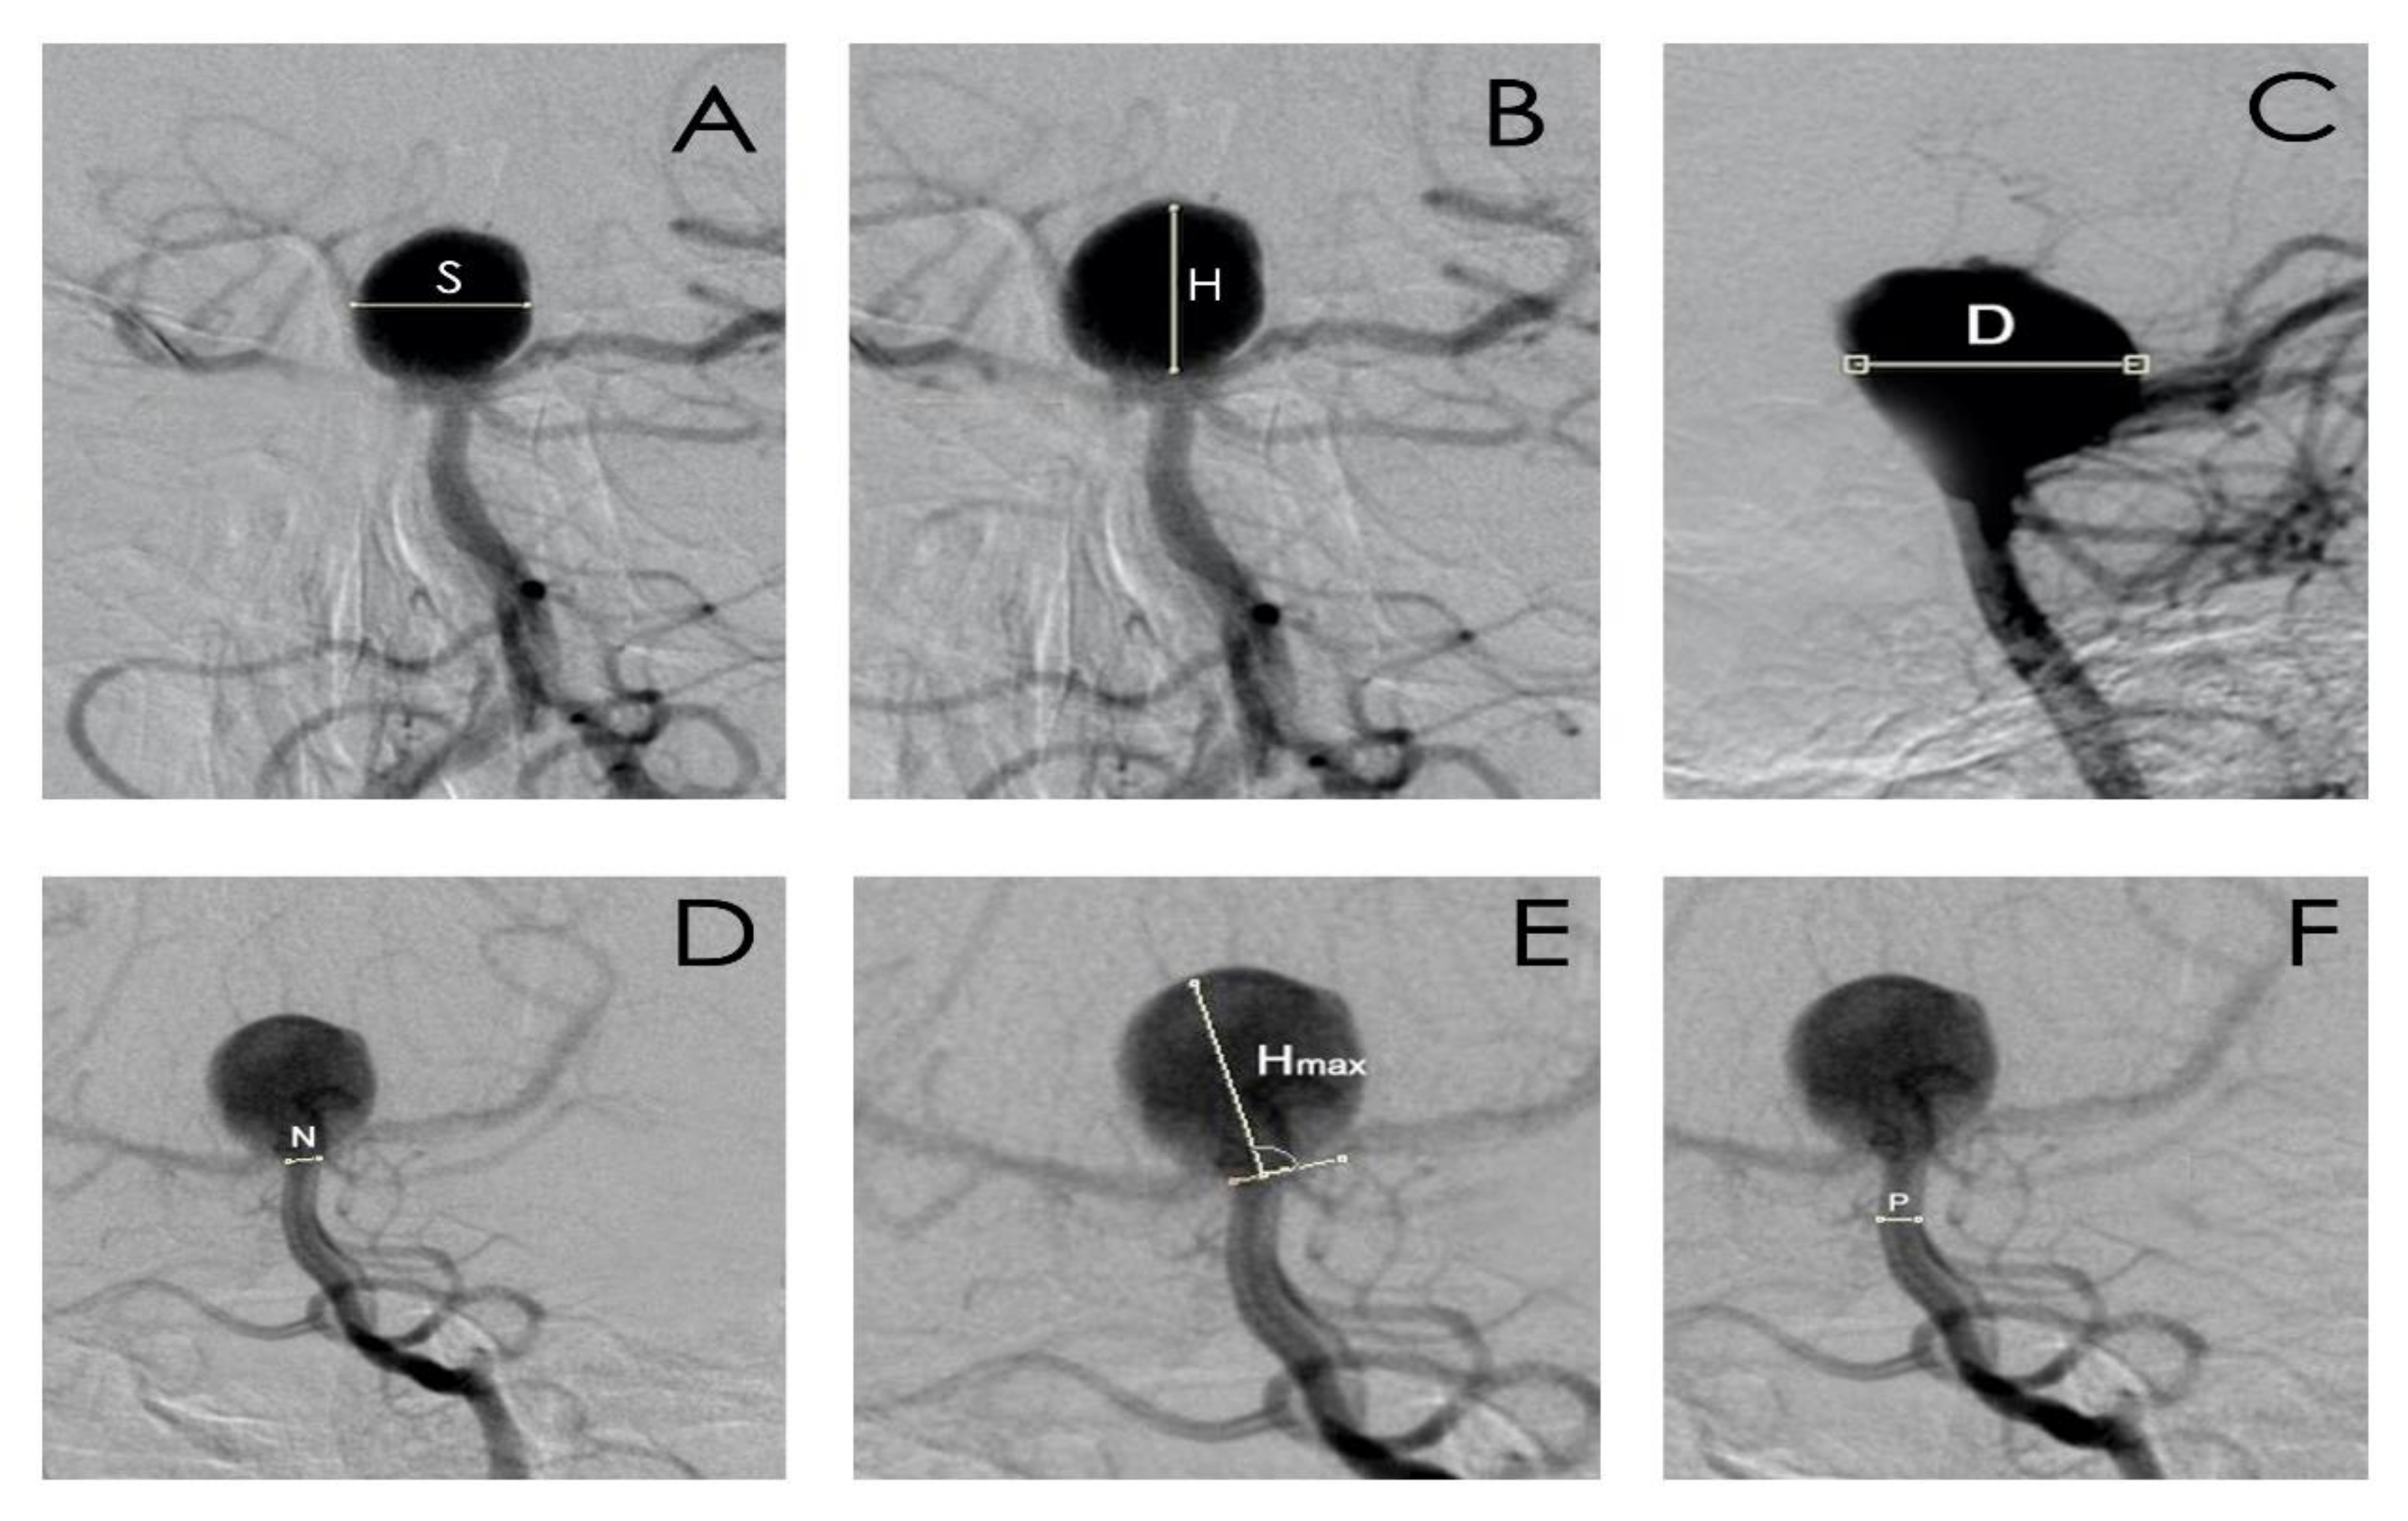
2.3. Digital Subtraction Angiography/Embolization
- aneurysm dome height (H), width (S), and depth size (D);
- aneurysm neck size (N);
- parent artery size (P);
- the largest aneurysm dimension perpendicular to the neck (Hmax);
- aspect ratio (AR), defined as the maximal perpendicular height (the largest perpendicular distance from the neck of the aneurysm to the dome of the aneurysm) divided by neck width;
- size ratio (SR), defined as maximum aneurysm height (between the center of the aneurysm neck and the greatest distance to the aneurysm dome), divided by the parent artery diameter;
- the index determining the ratio of aneurysm neck width to diameter of the parent artery.
2.4. Statistical Analysis
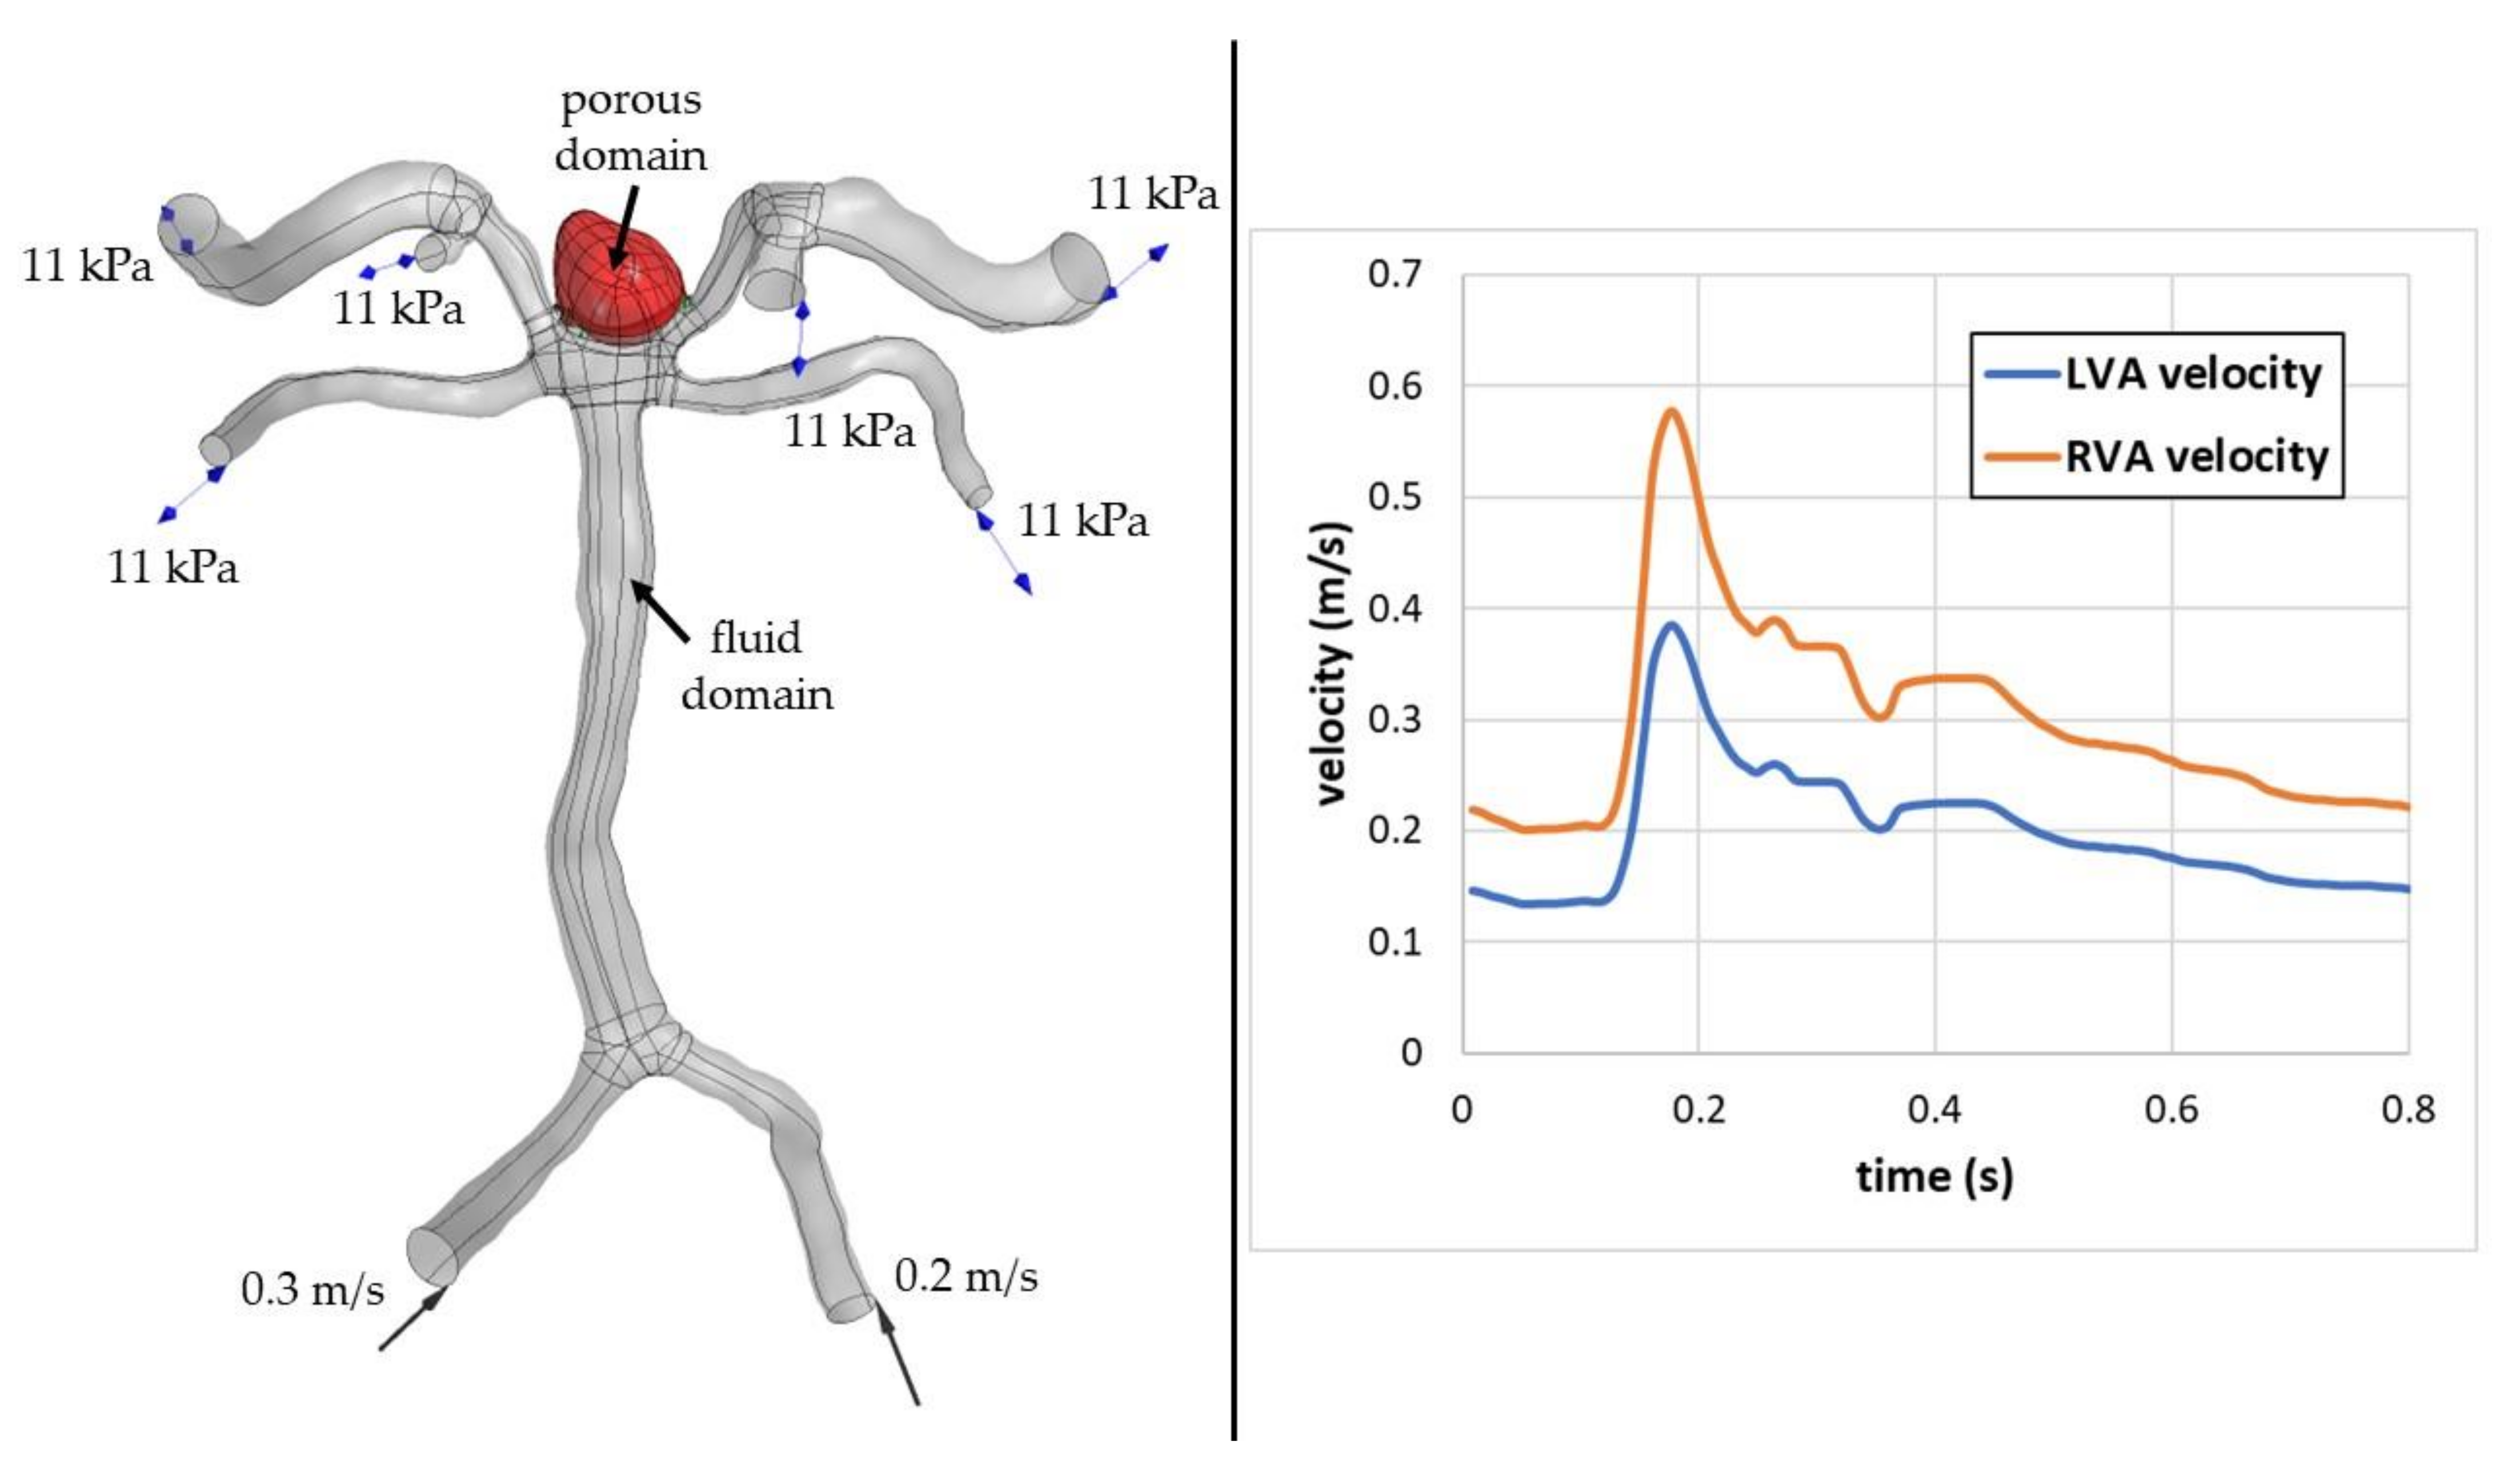
2.5. Computational Fluid Dynamics Analysis
3. Results
3.1. Patients
3.2. Aneurysm Location
3.3. Laboratory Results, Morphometric Parameters, Packing Density, 1st VPD of Intracranial Aneurysms
3.4. Complete Aneurysm Filling during the First Embolization
3.5. Type of Embolization Material
3.6. Recanalization
3.6.1. Early Recanalization (after 6 Months)
3.6.2. Late Recanalization (after 12 Months)
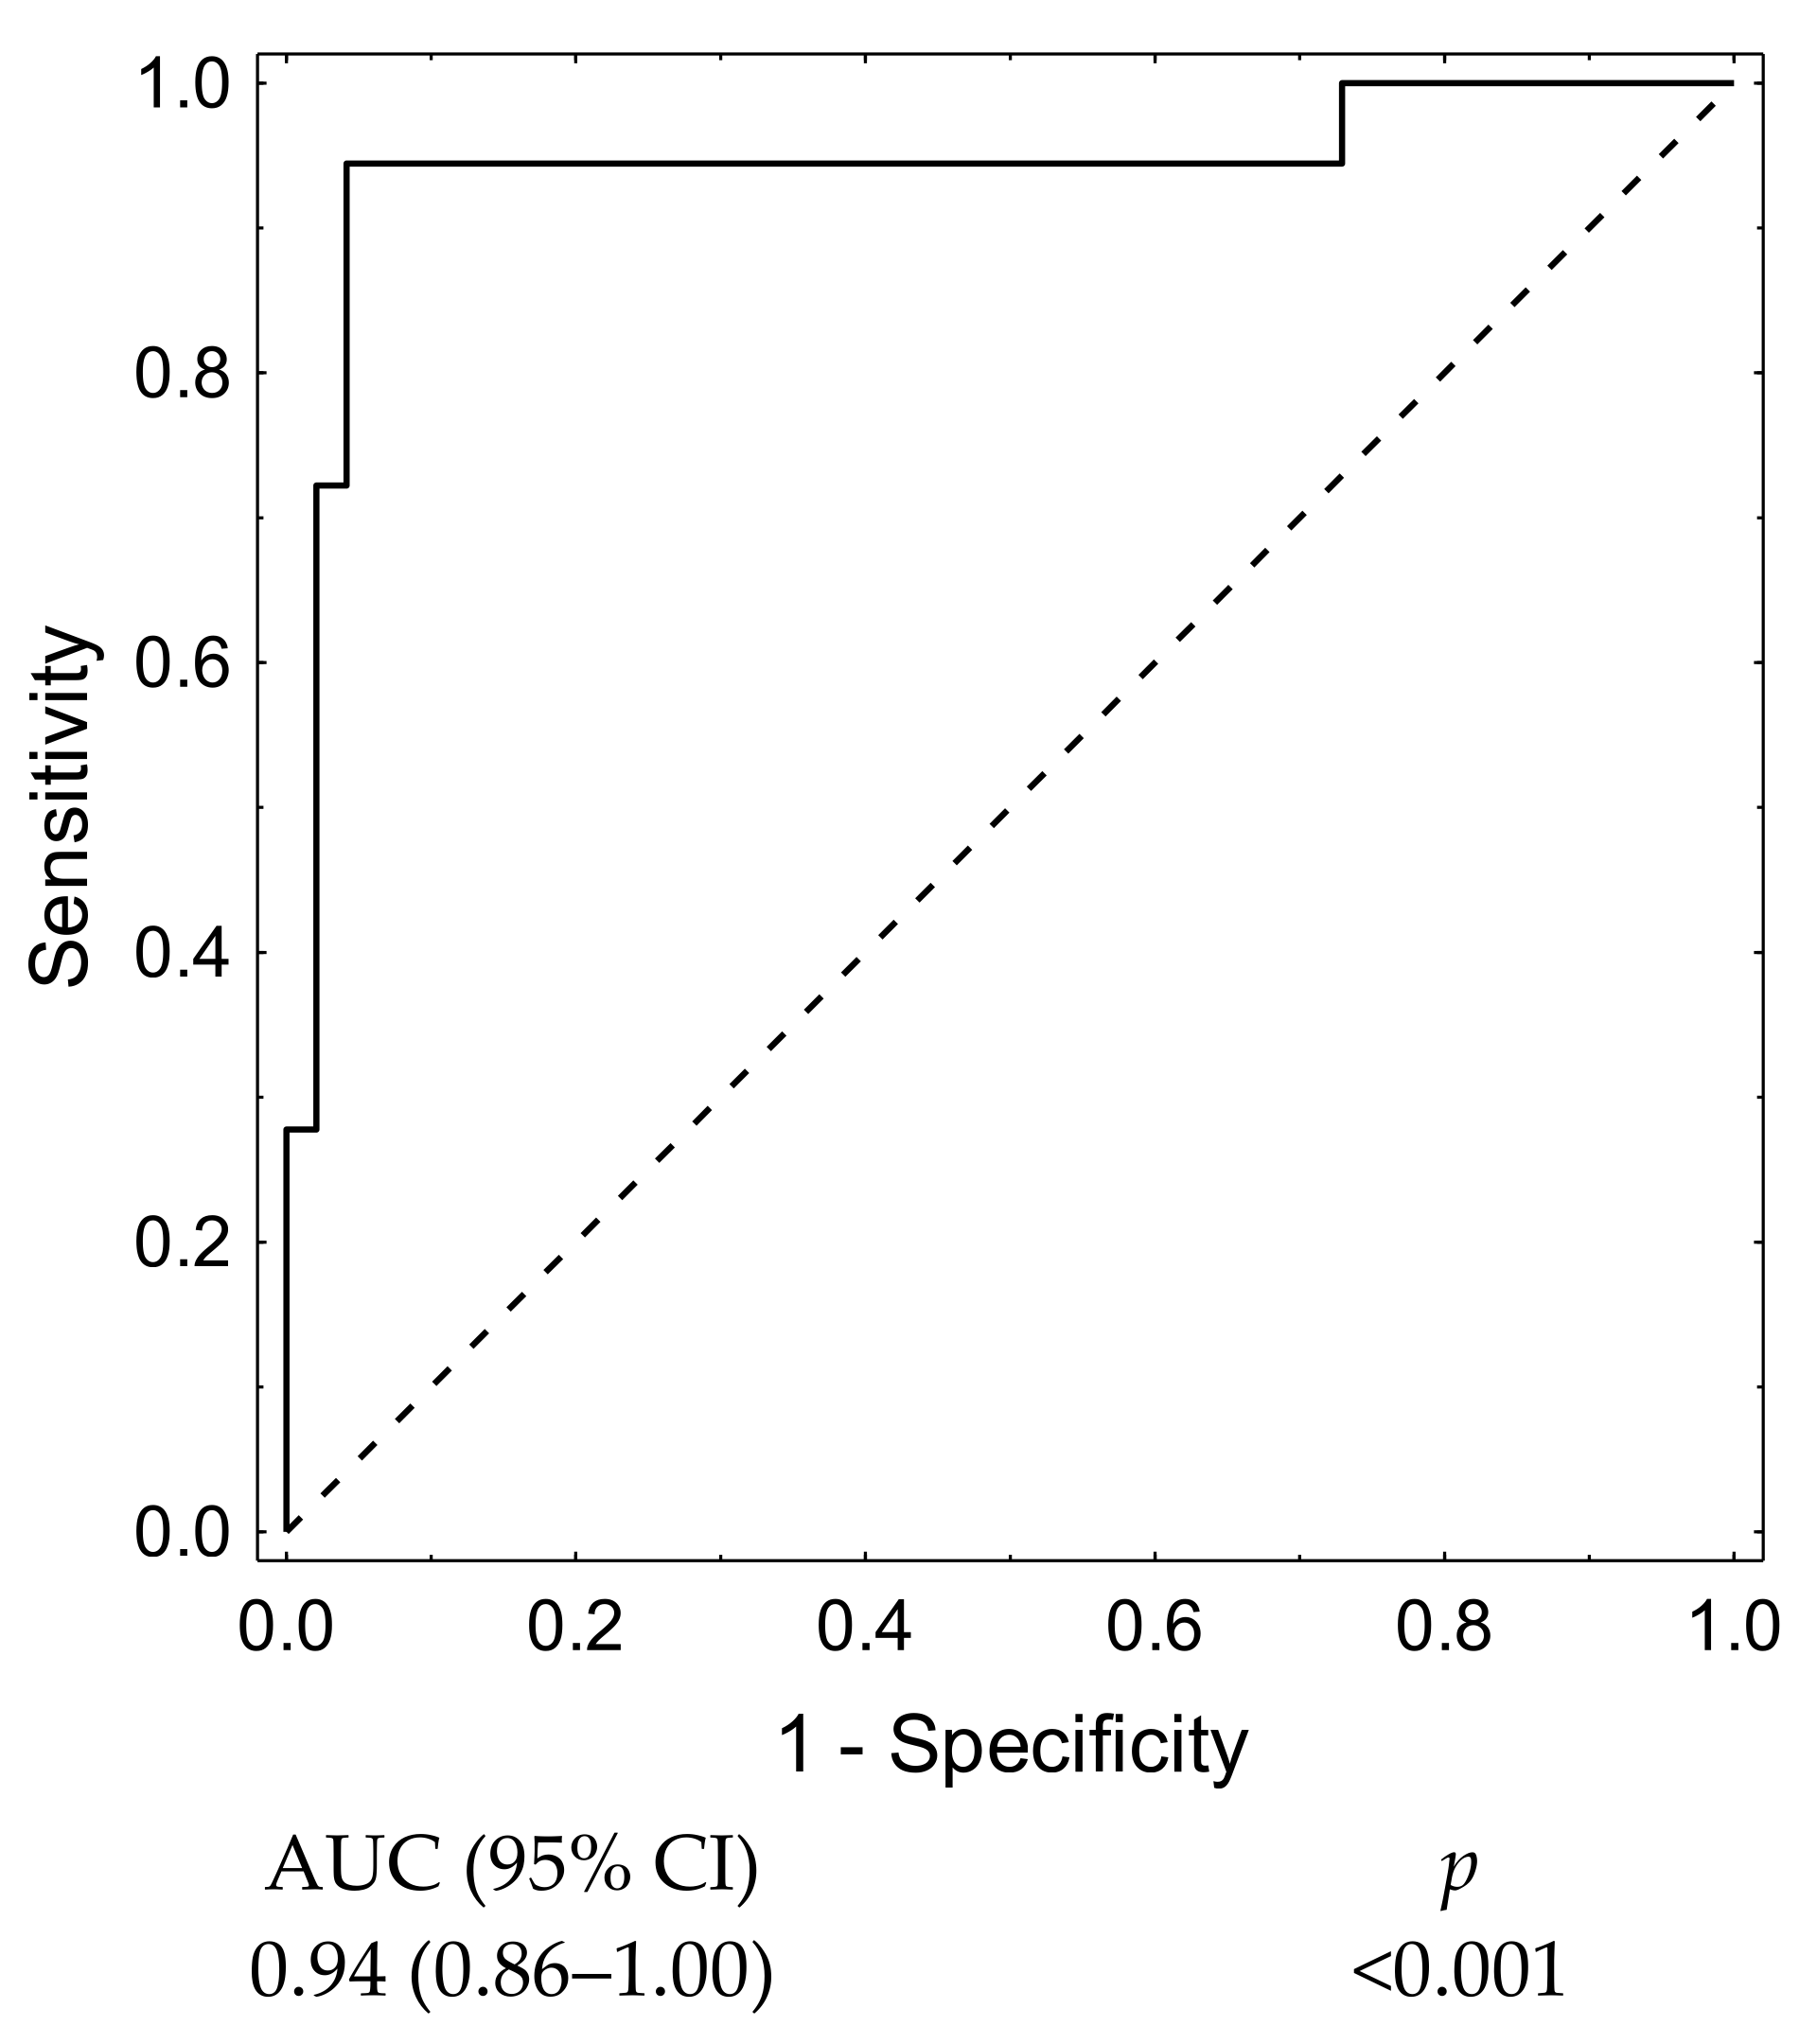
3.7. Statistical Analysis
3.7.1. Late Recanalization
3.7.2. Morphometric Parameters
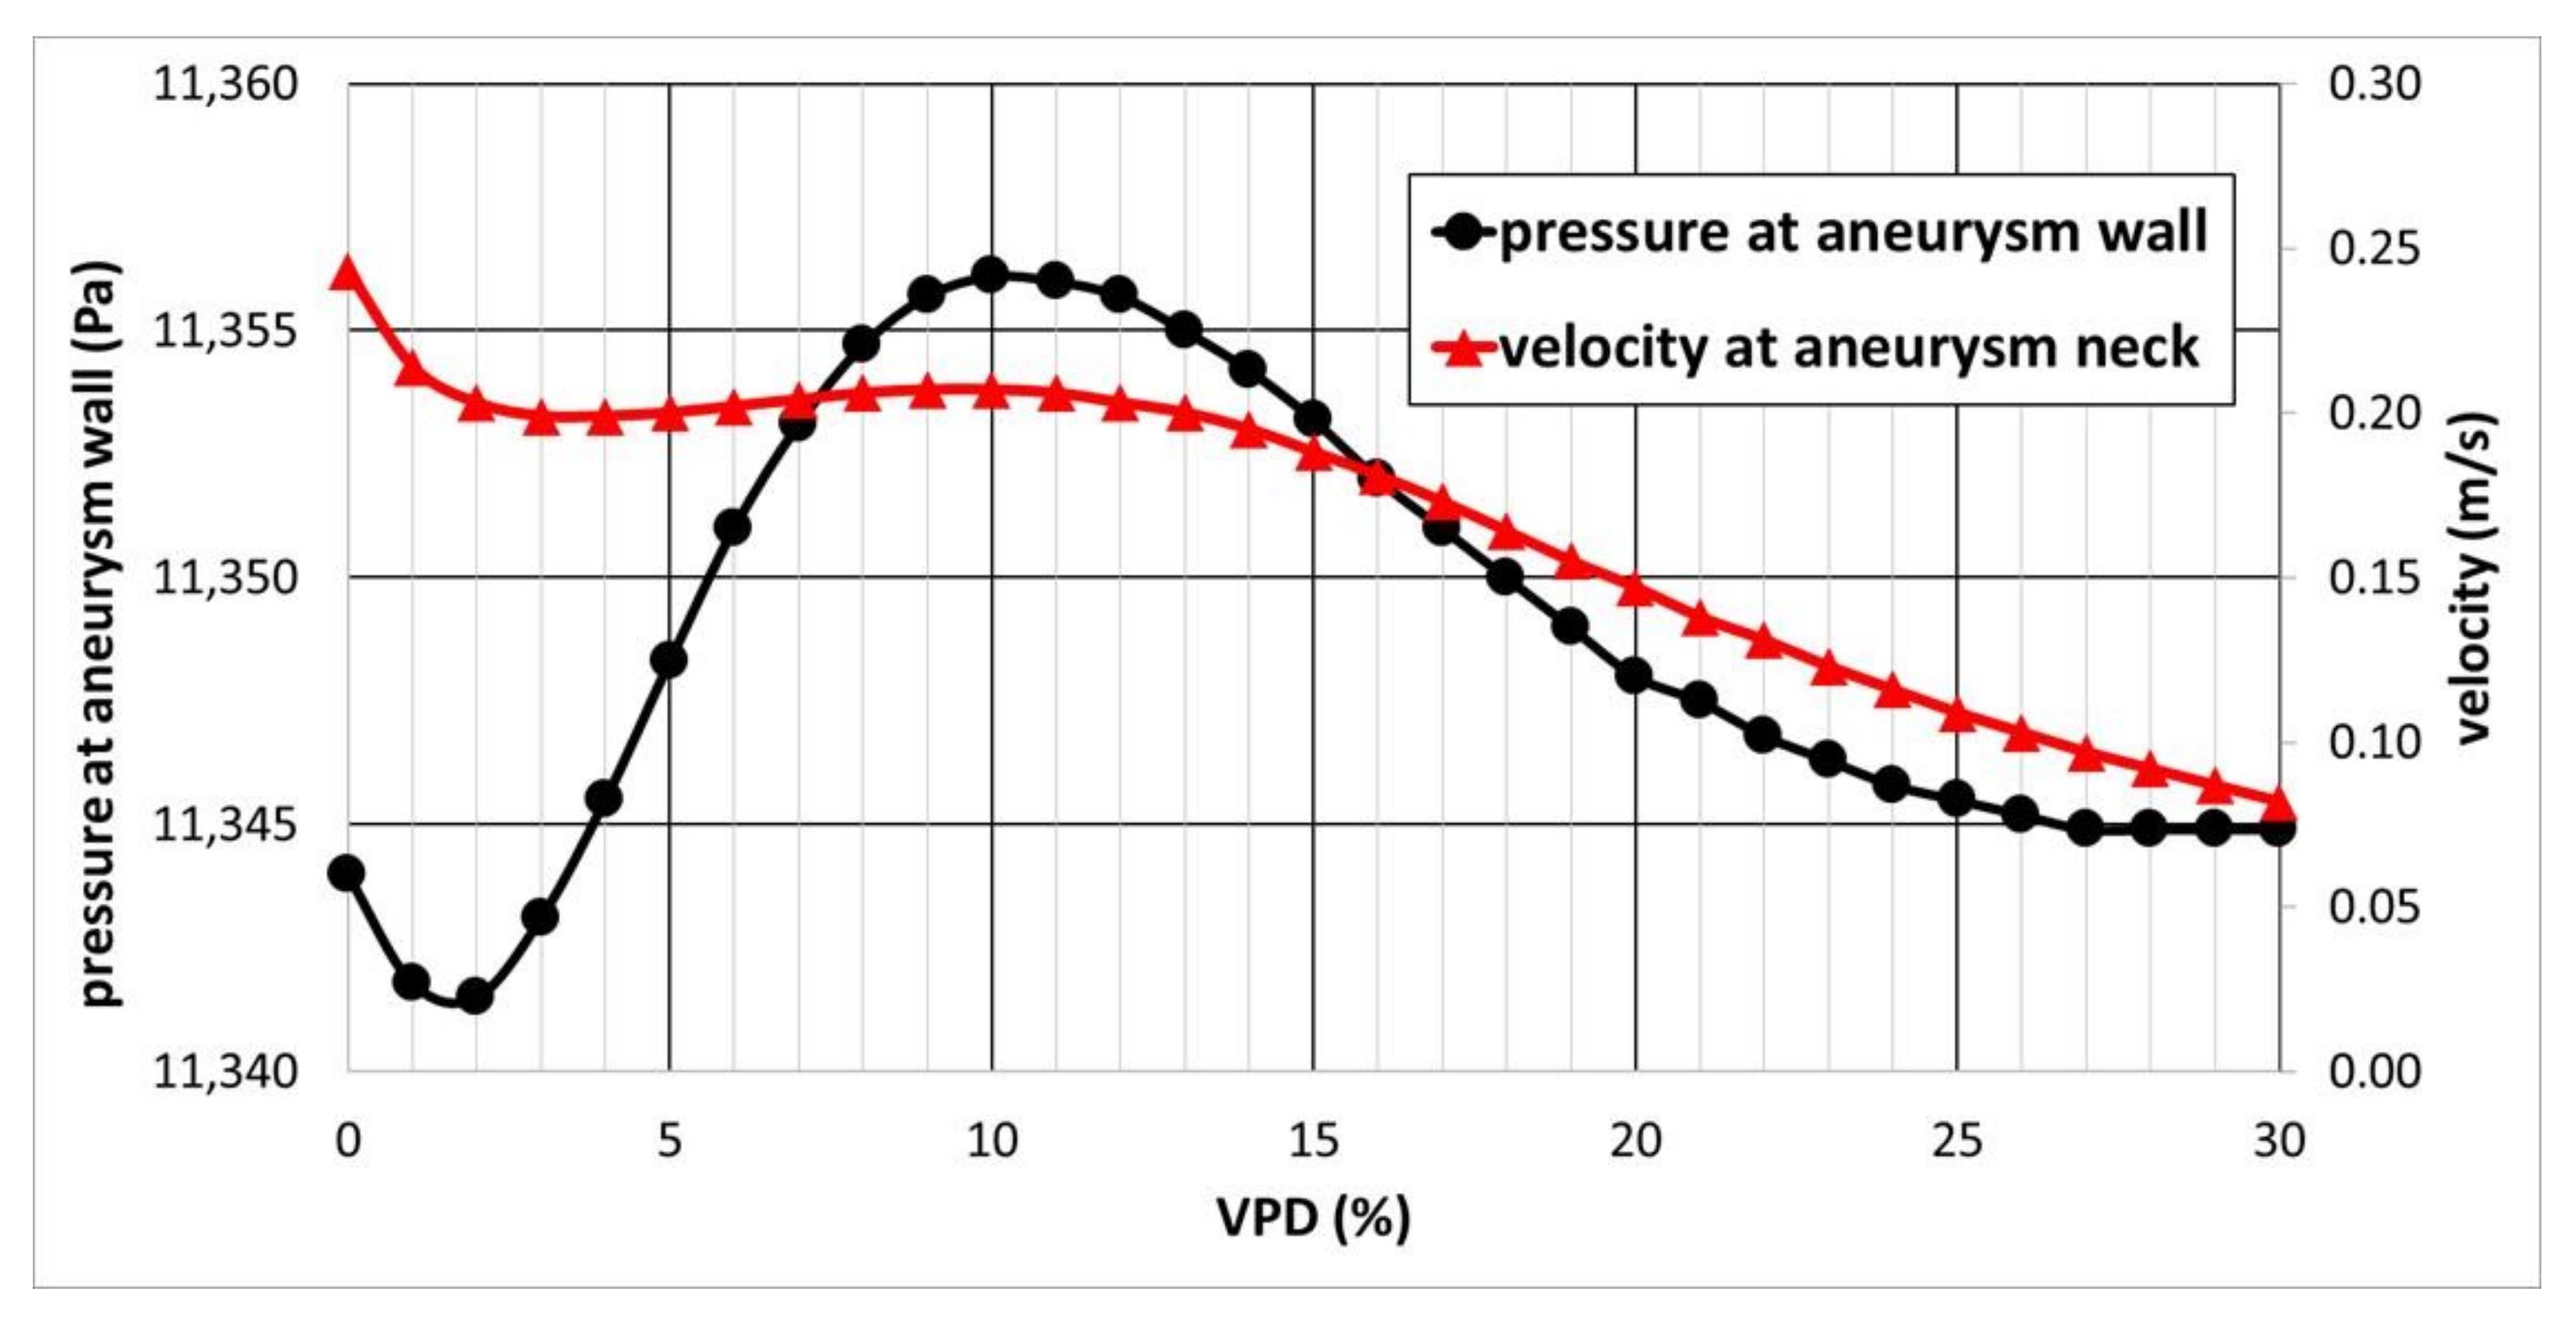
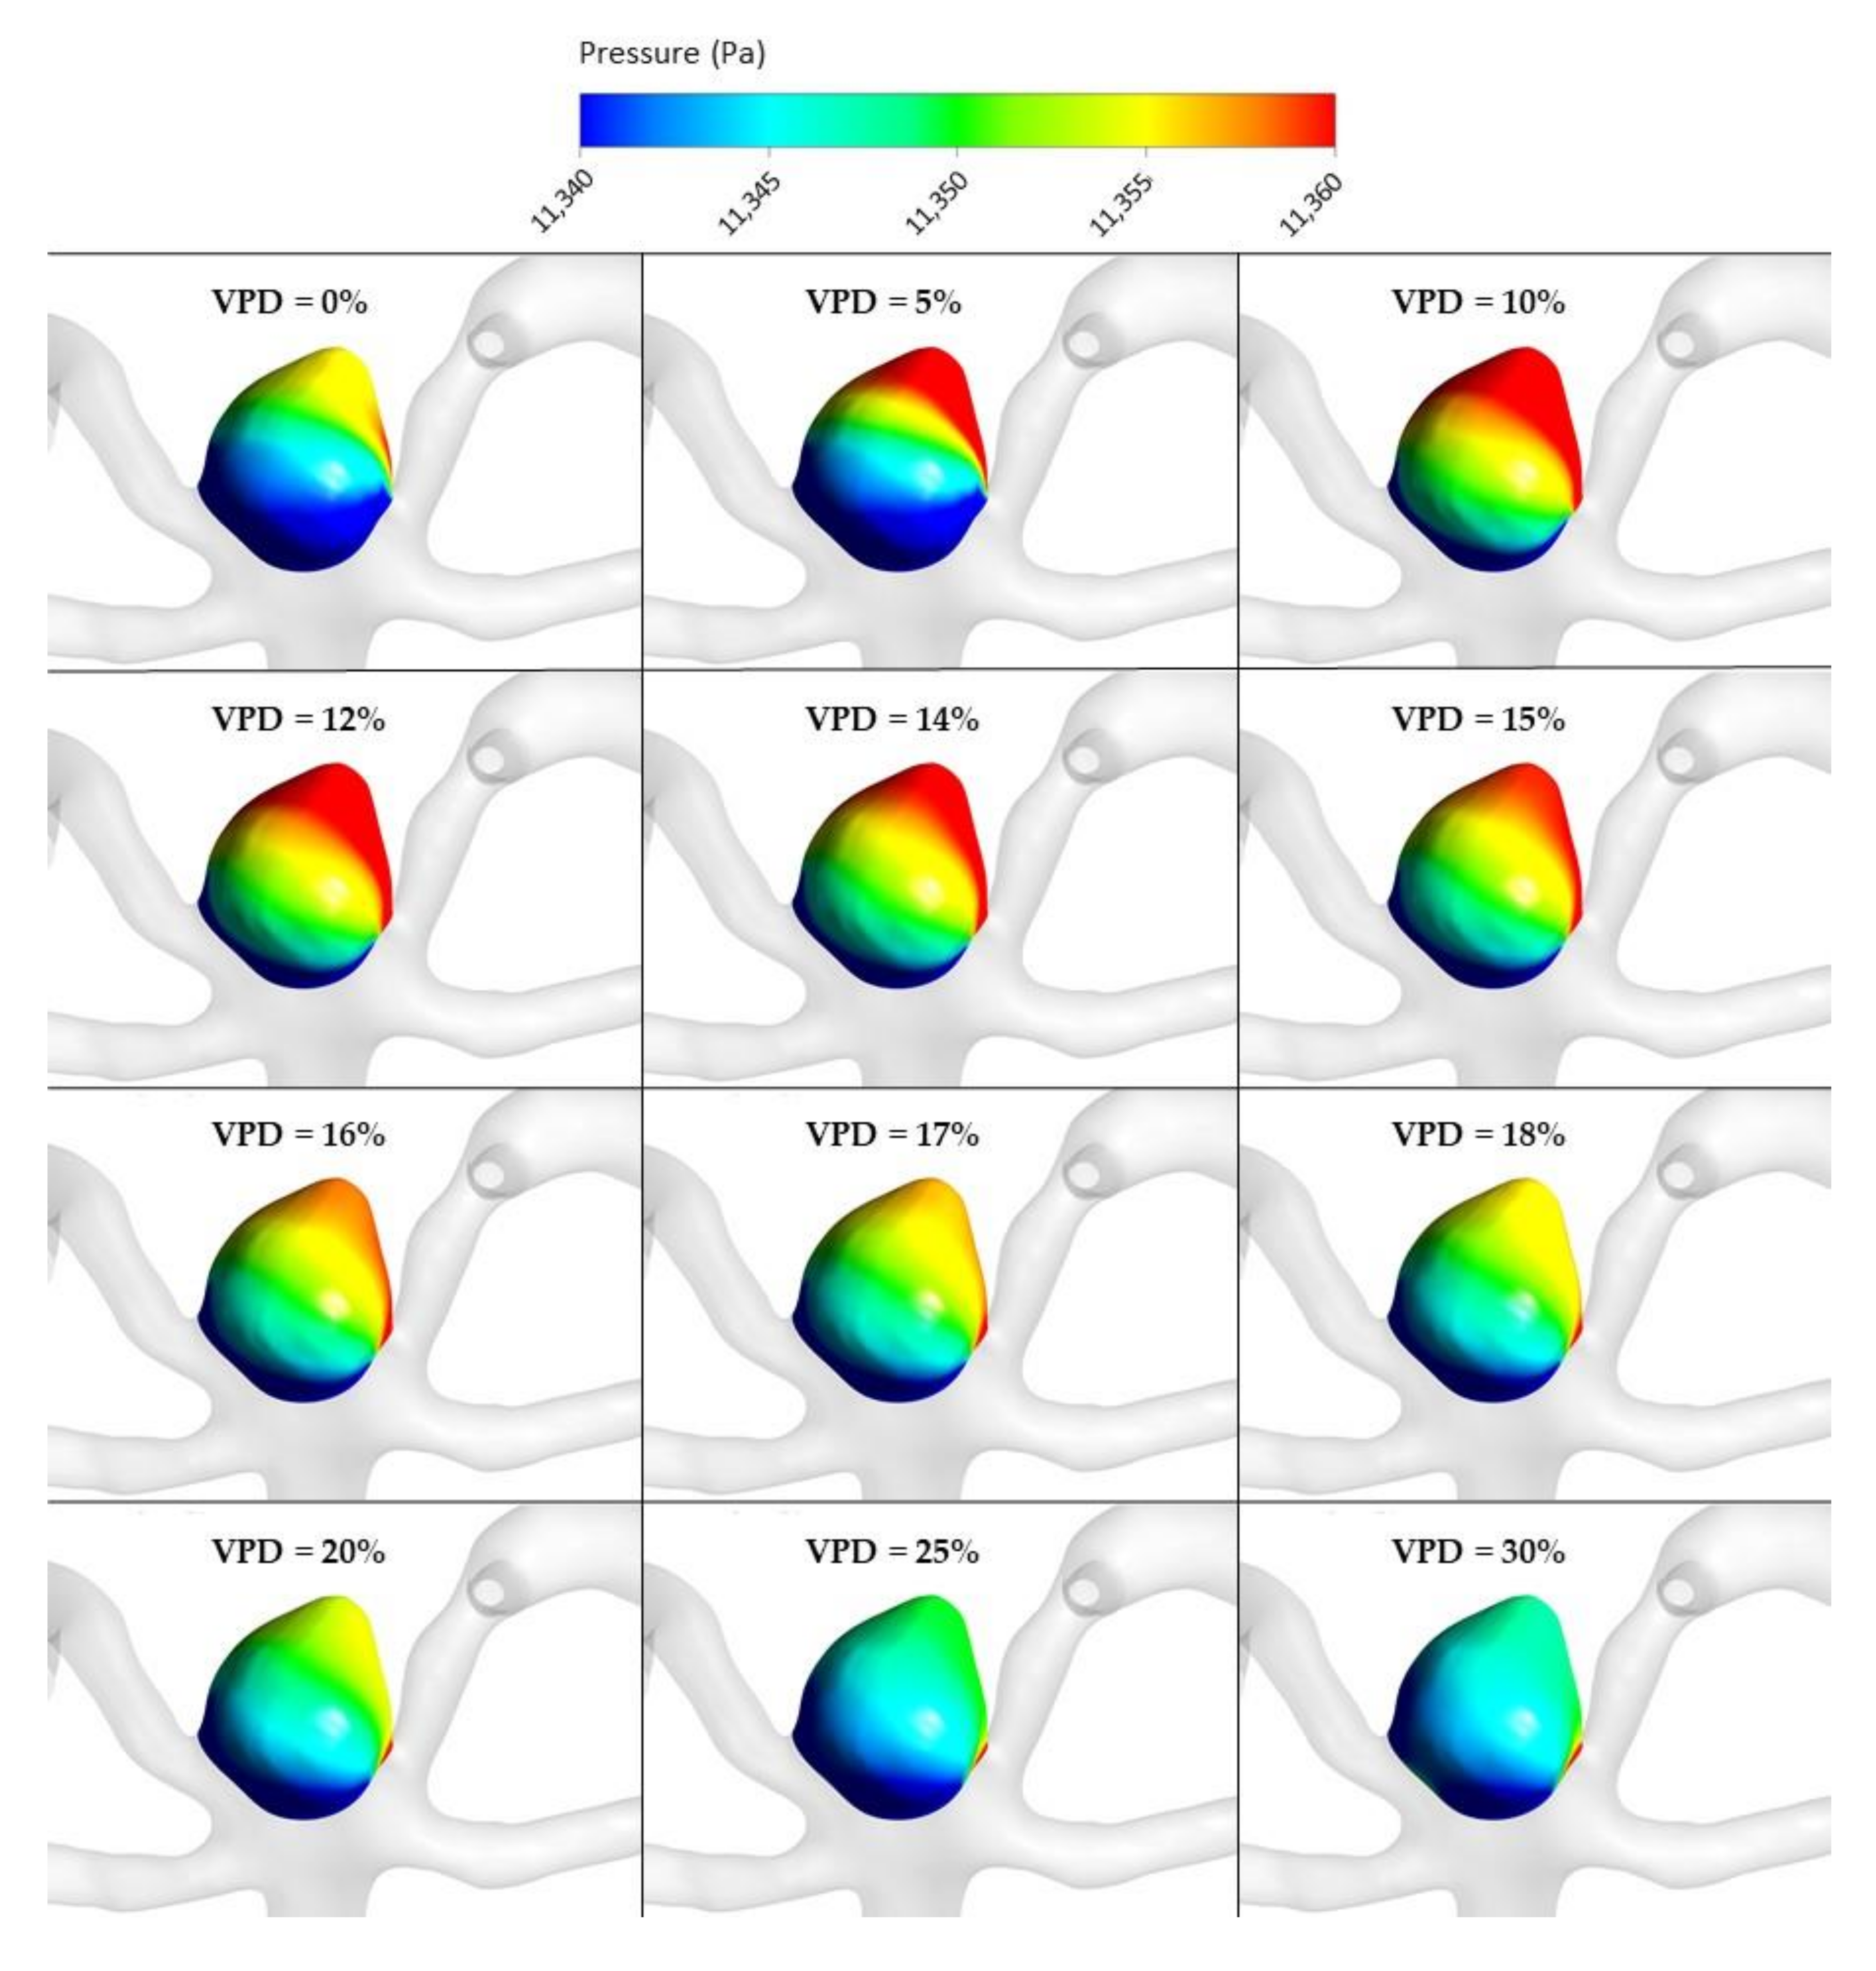
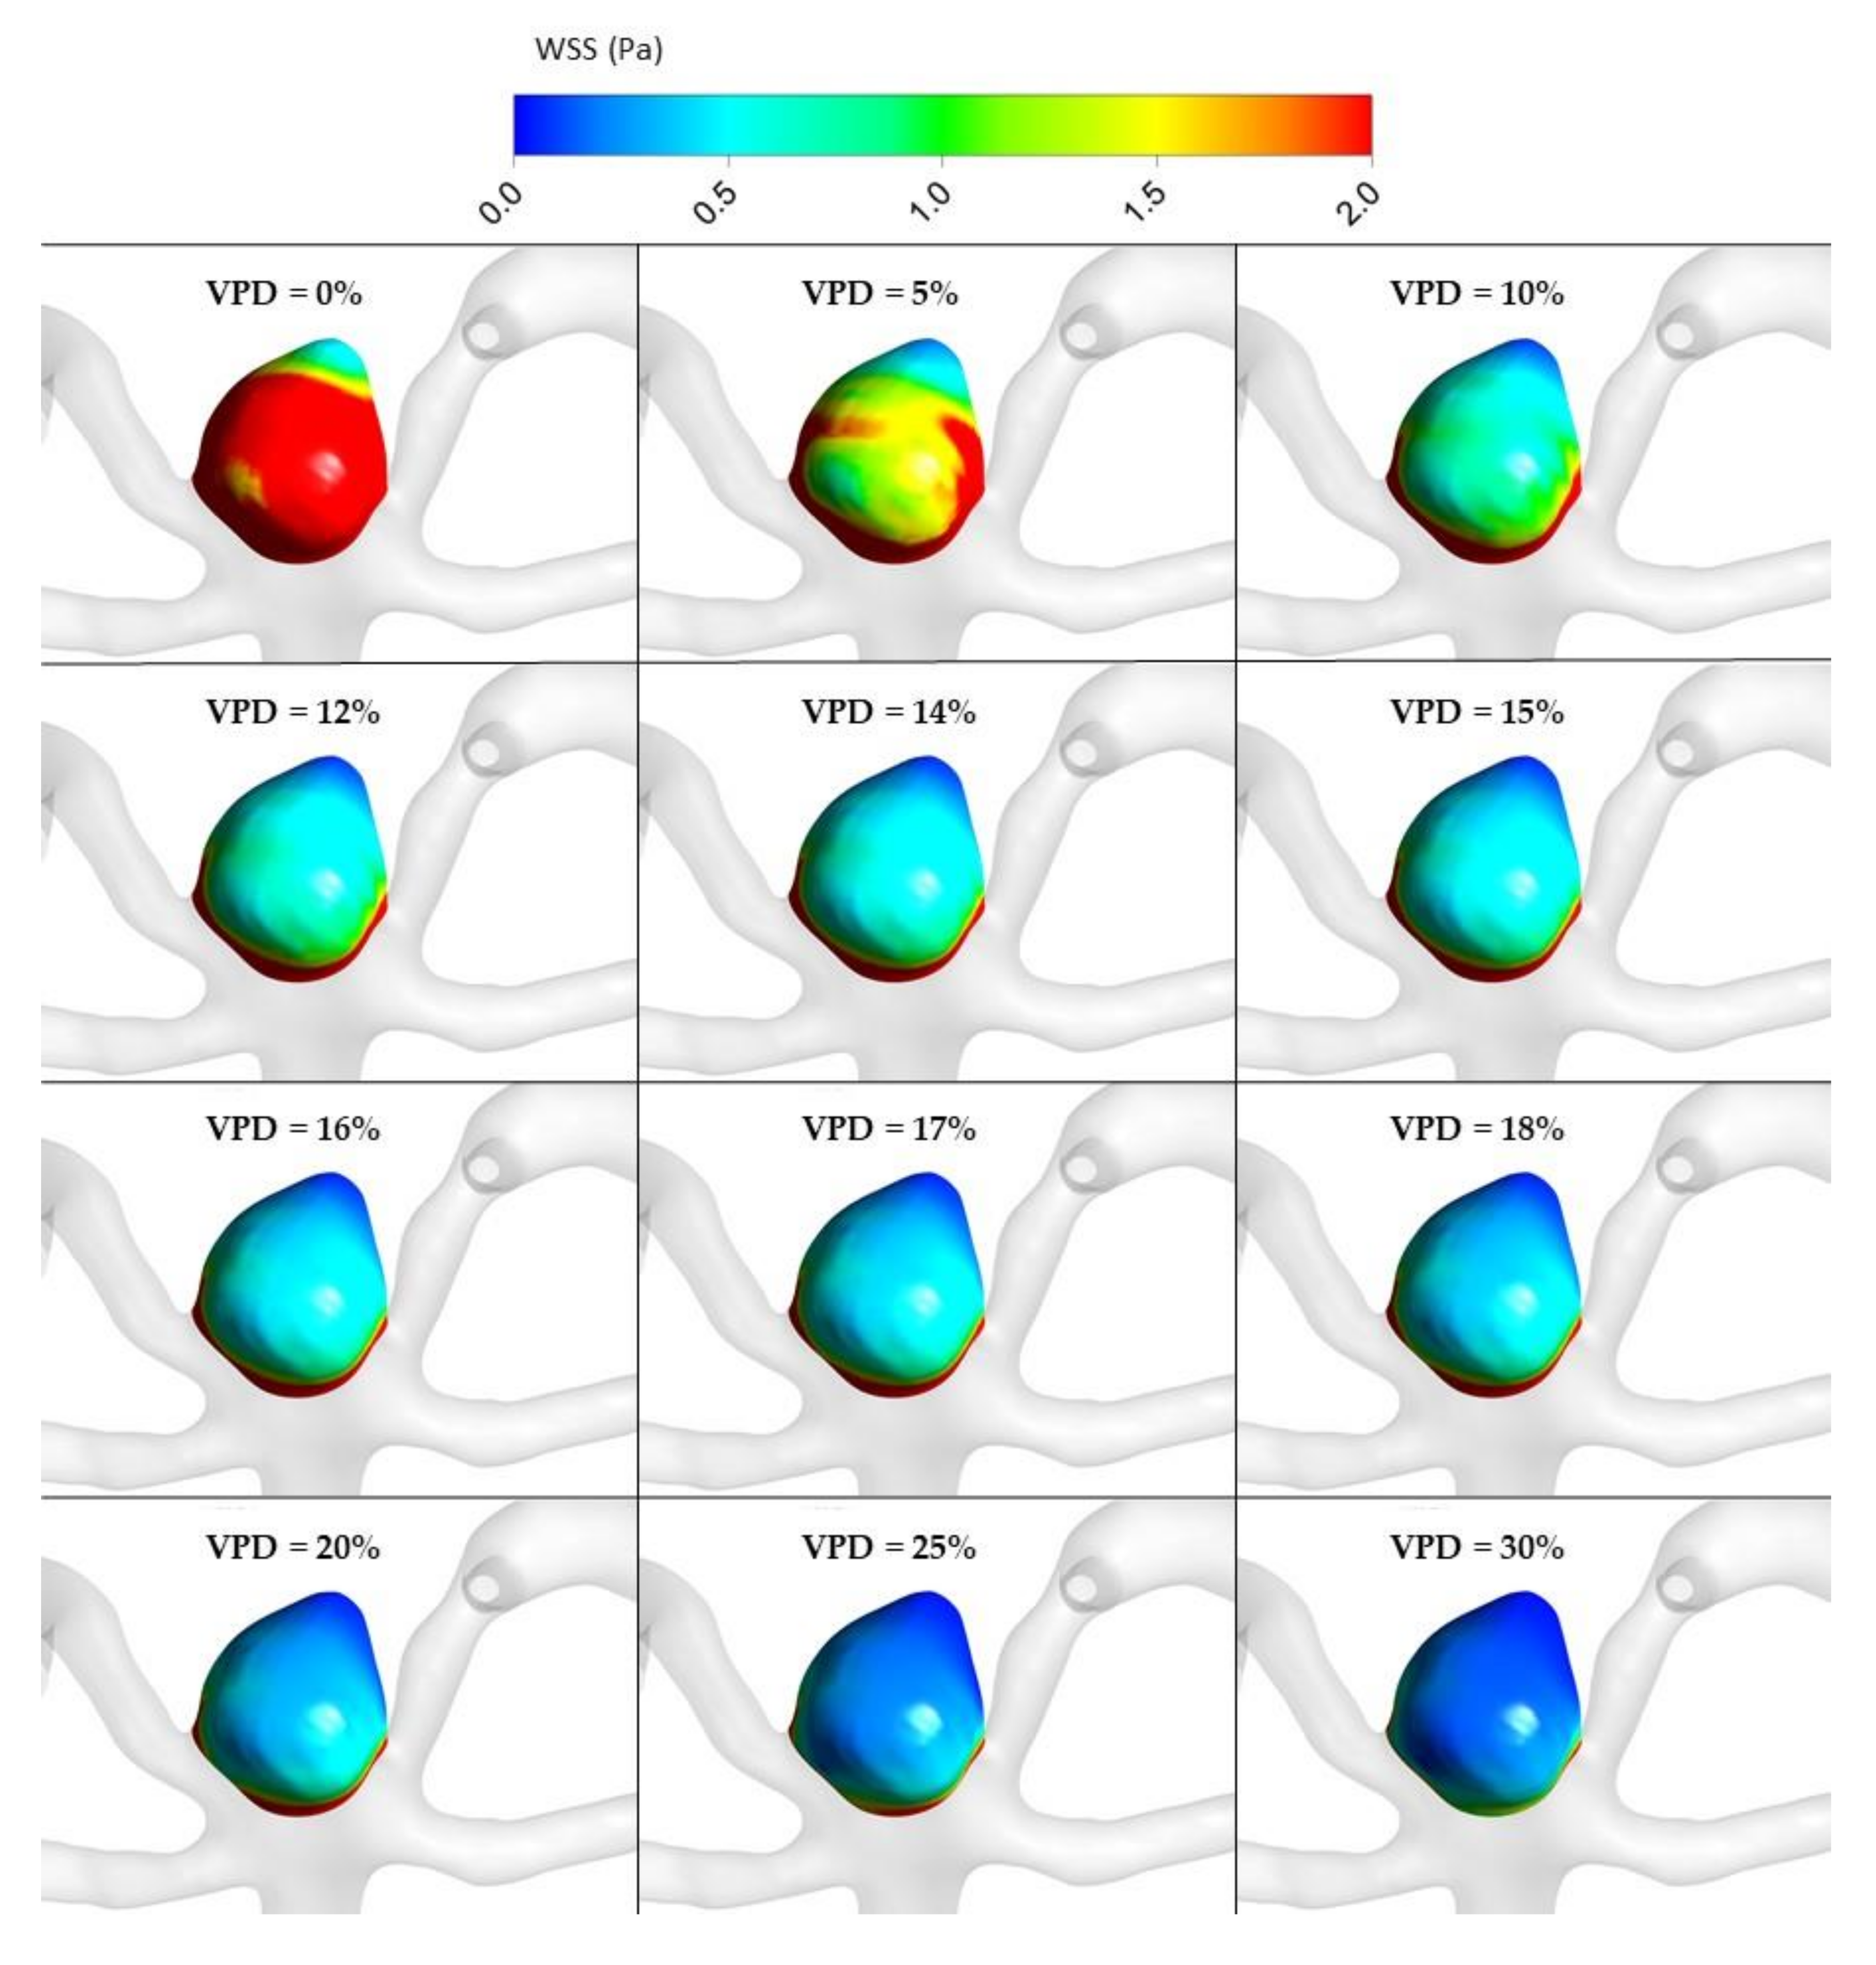
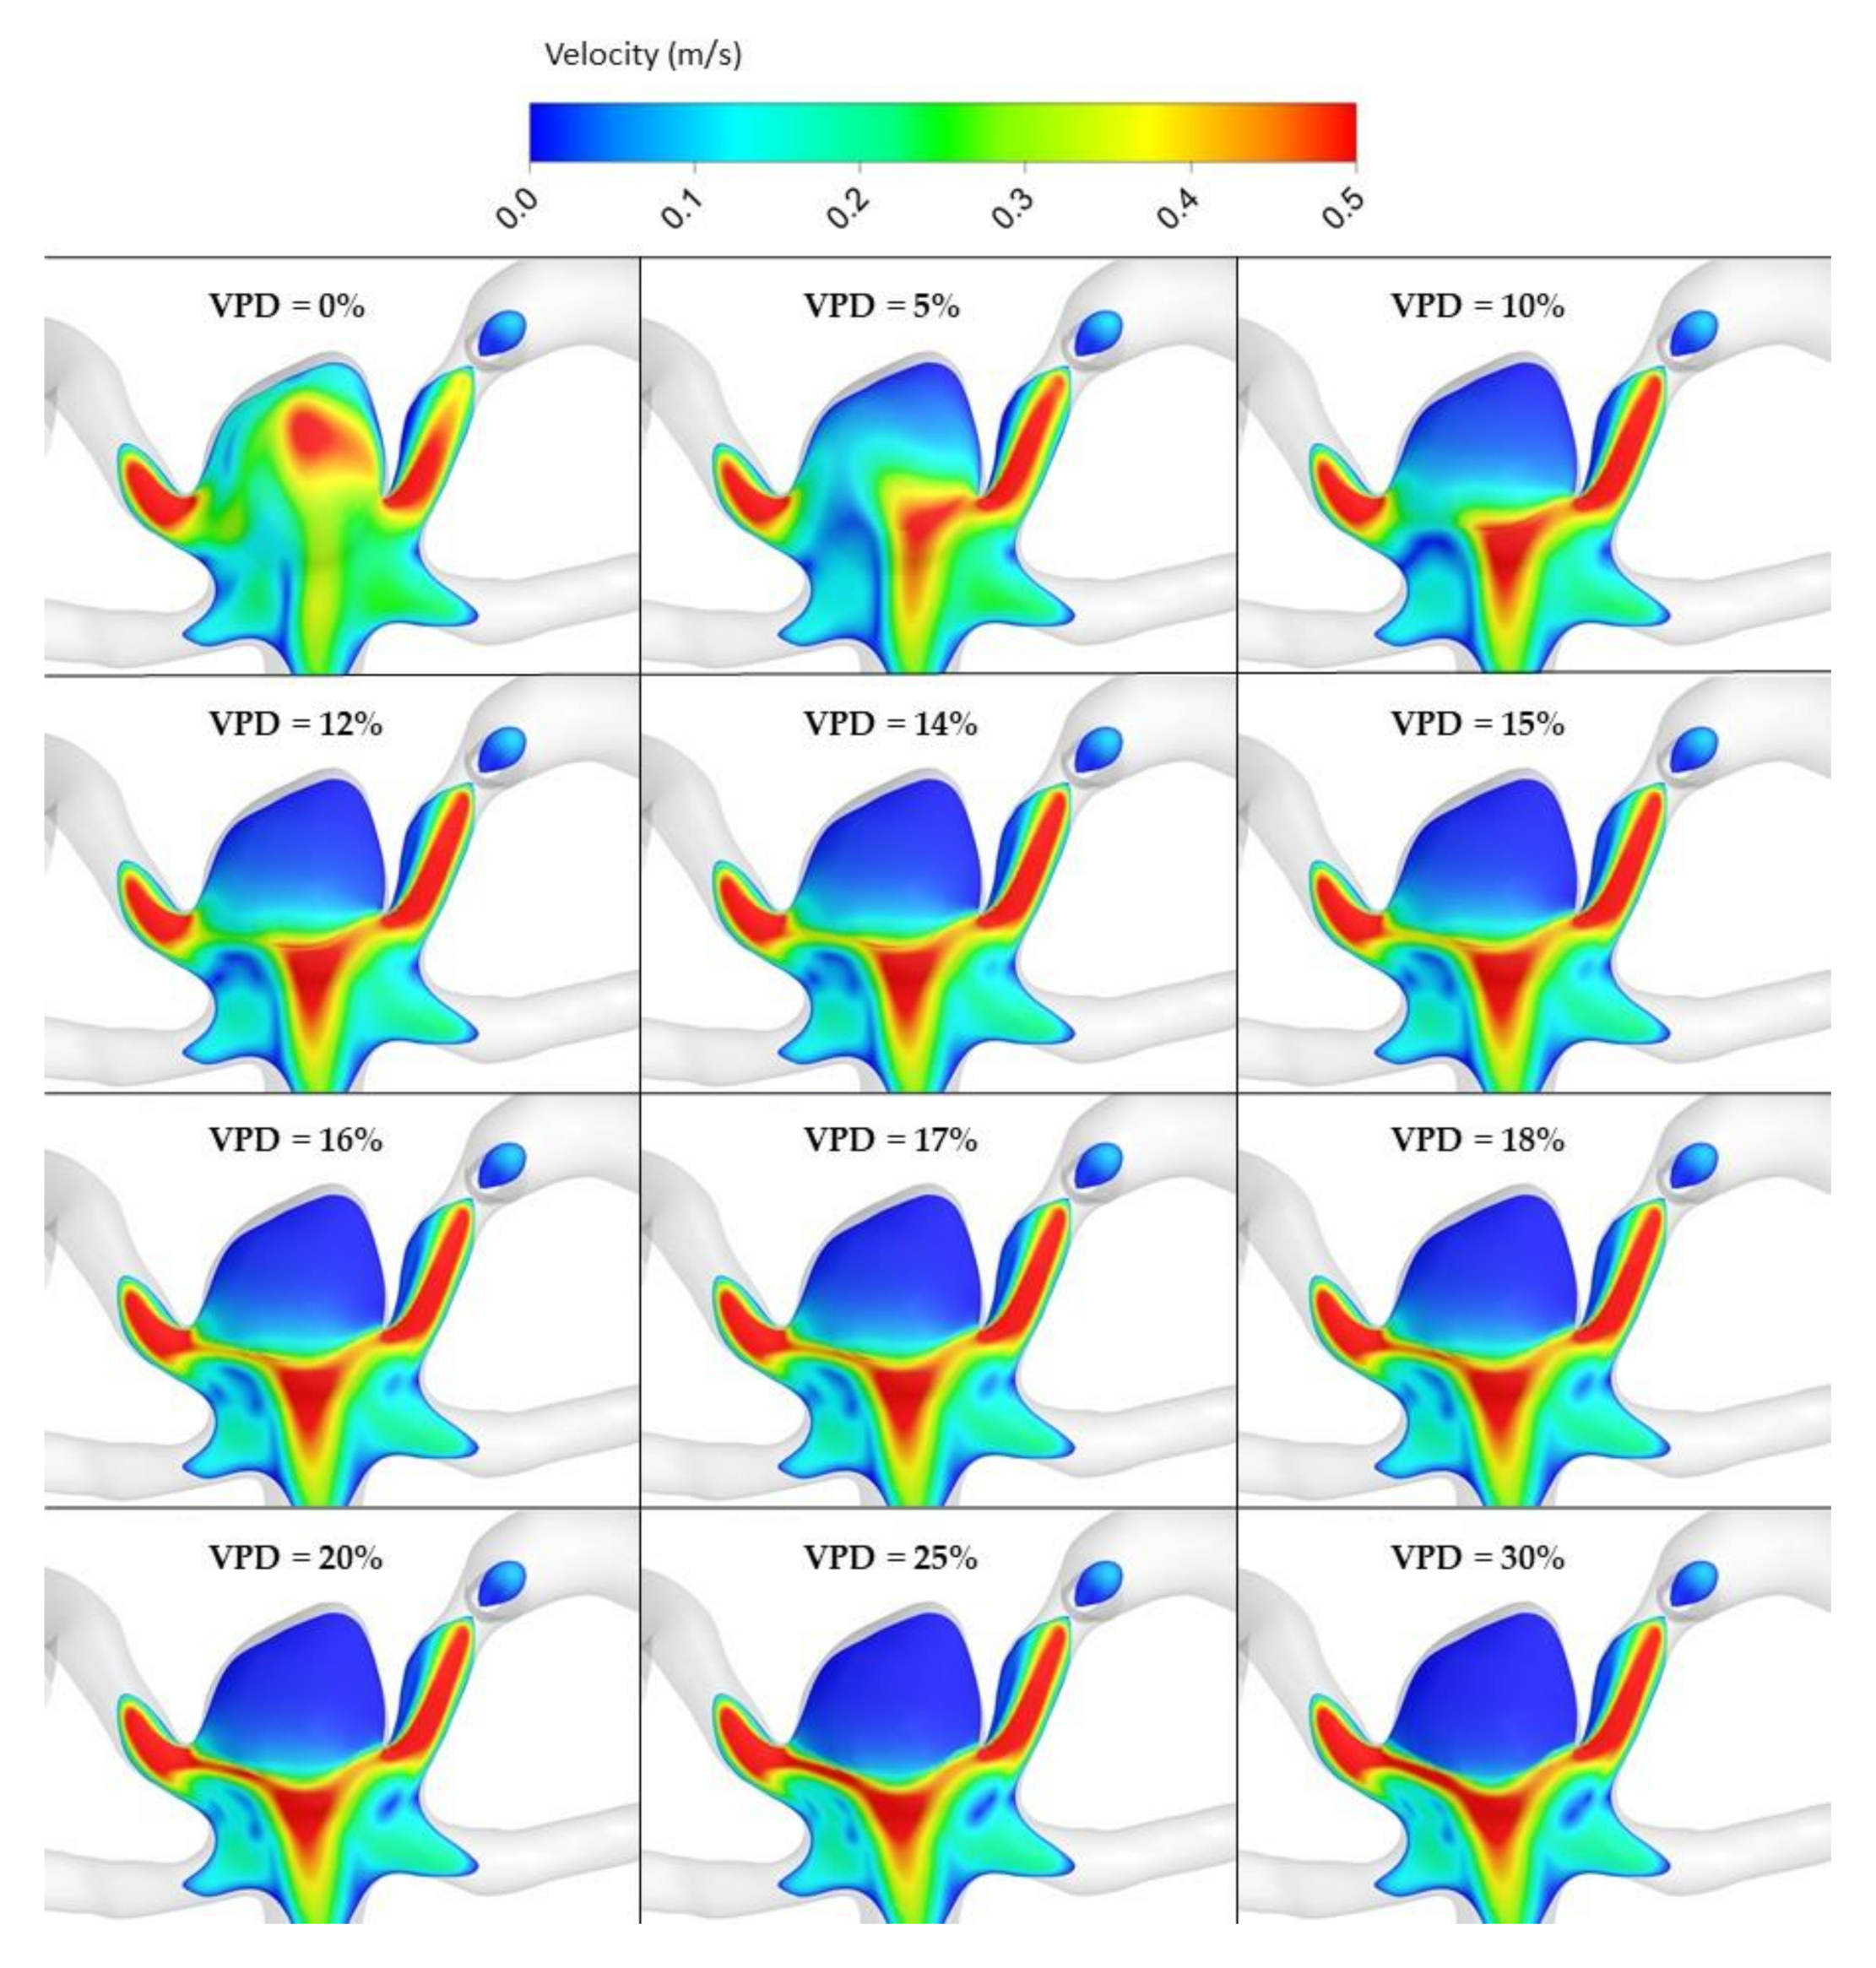
3.8. Computational Fluid Dynamics Analysis
4. Discussion
5. Conclusions
Author Contributions
Funding
Institutional Review Board Statement
Informed Consent Statement
Data Availability Statement
Conflicts of Interest
Consent for publication
References
- Ries, T.; Siemonsen, S.; Thomalla, G.; Grzyska, U.; Zeumer, H.; Fiehler, J. Long-Term Follow-Up of Cerebral Aneurysms after Endovascular Therapy Prediction and Outcome of Retreatment. Am. J. Neuroradiol. 2007, 28, 1755–1761. [Google Scholar] [CrossRef] [PubMed]
- Molyneux, A.; Kerr, R.; Stratton, I.; International Subarachnoid Aneurysm Trial (ISAT) Collaborative Group. International Subarachnoid Aneurysm Trial (ISAT) of neurosurgical clipping versus endovascular coiling in 2143 patients with ruptured intracranial aneurysms: A randomised trial. Lancet 2002, 360, 1267–1274. [Google Scholar] [CrossRef]
- Molyneux, A.J.; Kerr, R.S.; Yu, L.-M.; Clarke, M.; Sneade, M.; Yarnold, J.A.; Sandercock, P. International subarachnoid aneurysm trial (ISAT) of neurosurgical clipping versus endovascular coiling in 2143 patients with ruptured intracranial aneurysms: A randomised comparison of effects on survival, dependency, seizures, rebleeding, subgroups, and aneurysm occlusion. Lancet 2005, 366, 809–817. [Google Scholar] [CrossRef] [PubMed]
- Guglielmi, G.; Viñuela, F.; Sepetka, I.; Macellari, V. Electrothrombosis of saccular aneurysms via endovascular approach. Part 1: Electrochemical basis, technique, and experimental results. J. Neurosurg. 1991, 75, 1–7. [Google Scholar] [CrossRef]
- Guglielmi, G.; Viñuela, F.; Dion, J.; Duckwiler, G. Electrothrombosis of saccular aneurysms via endovascular approach. J. Neurosurg. 1991, 75, 8–14. [Google Scholar] [CrossRef] [PubMed]
- Vollherbst, D.F.; Hohenstatt, S.; Schönenberger, S.; Bendszus, M.; Möhlenbruch, M.A. WEB as a combined support and embolization device in a giant partially thrombosed donut-shaped aneurysm. J. Clin. Neurosci. 2020, 75, 210–212. [Google Scholar] [CrossRef] [PubMed]
- Ding, D.; Liu, K.C. Management strategies for intraprocedural coil migration during endovascular treatment of intracranial aneurysms: Table 1. J. NeuroInterventional Surg. 2014, 6, 428–431. [Google Scholar] [CrossRef] [PubMed]
- Ding, D.; Starke, R.M.; Evans, A.J.; Jensen, M.E.; Liu, K.C. Endovascular treatment of recurrent intracranial aneurysms following previous microsurgical clipping with the Pipeline Embolization Device. J. Clin. Neurosci. 2014, 21, 1241–1244. [Google Scholar] [CrossRef] [PubMed]
- CARAT Investigators. Rates of delayed rebleeding from intracranial aneurysms are low after surgical and endovascular treatment. Stroke 2006, 37, 1437–1442. [Google Scholar] [CrossRef]
- Johnston, S.C.; Dowd, C.F.; Higashida, R.T.; CARAT Investigators. Predictors of Rehemorrhage after treatment of ruptured Intracranial aneurysms: The cerebral aneurysm rerupture after treatment (CARAT) study. Stroke 2008, 39, 120–125. [Google Scholar] [CrossRef]
- Ishida, W.; Sato, M.; Amano, T.; Matsumaru, Y. The significant impact of framing coils on long-term outcomes in endovascular coiling for intracranial aneurysms: How to select an appropriate framing coil. J. Neurosurg. 2016, 125, 705–712. [Google Scholar] [CrossRef]
- Kawanabe, Y.; Sadato, A.; Taki, W.; Hashimoto, N. Endovascular Occlusion of Intracranial Aneurysms with Guglielmi Detachable Coils: Correlation Between Coil Packing Density and Coil Compaction. Acta Neurochir. 2001, 143, 451–455. [Google Scholar] [CrossRef]
- Singla, A.; Villwock, M.R.; Jacobsen, W.; Deshaies, E.M. Aneurysm embolization grade: A predictive tool for aneurysm recurrence after coil embolization. Acta Neurochir. 2012, 155, 231–236. [Google Scholar] [CrossRef]
- Ries, T.; Groden, C. Endovascular Treatment of Intracranial Aneurysms: Long-Term Stability, Risk Factors for Recurrences, Retreatment and Follow-Up. Clin. Neuroradiol. 2009, 19, 62–72. [Google Scholar] [CrossRef]
- Raymond, J.; Guilbert, F.; Weill, A.; Georganos, S.A.; Juravsky, L.; Lambert, A.; Lamoureux, J.; Chagnon, M.; Roy, D. Long-Term Angiographic Recurrences After Selective Endovascular Treatment of Aneurysms With Detachable Coils. Stroke 2003, 34, 1398–1403. [Google Scholar] [CrossRef] [PubMed]
- Misaki, K.; Uchiyama, N.; Nambu, I.; Aida, Y.; Kamide, T.; Mohri, M.; Ueda, F.; Nakada, M. Optimizing the Volume of the Initial Framing Coil to Facilitate Tight Packing of Intracranial Aneurysms. World Neurosurg. 2016, 90, 397–402. [Google Scholar] [CrossRef] [PubMed]
- Jeon, J.P.; Cho, Y.D.; Rhim, J.K.; Yoo, D.H.; Kang, H.-S.; Kim, J.E.; Cho, W.-S.; Han, M.H. Extended monitoring of coiled aneurysms completely occluded at 6-month follow-up: Late recanalization rate and related risk factors. Eur. Radiol. 2016, 26, 3319–3326. [Google Scholar] [CrossRef]
- Luo, B.; Yang, X.; Wang, S.; Li, H.; Chen, J.; Yu, H.; Zhang, Y.; Zhang, Y.; Mu, S.; Liu, Z.; et al. High Shear Stress and Flow Velocity in Partially Occluded Aneurysms Prone to Recanalization. Stroke 2011, 42, 745–753. [Google Scholar] [CrossRef] [PubMed]
- Li, C.; Wang, S.; Chen, J.; Yu, H.; Zhang, Y.; Jiang, F.; Mu, S.; Li, H.; Yang, X. Influence of hemodynamics on recanalization of totally occluded intracranial aneurysms: A patient-specific computational fluid dynamic simulation study. J. Neurosurg. 2012, 117, 276–283. [Google Scholar] [CrossRef]
- Tanioka, S.; Ishida, F.; Kishimoto, T.; Tanaka, K.; Shimosaka, S.; Suzuki, H. Prediction of the extent of thrombus formation in the parent artery after endovascular occlusion of a distal anterior cerebral artery aneurysm using computational fluid dynamics. J. Clin. Neurosci. 2020, 74, 210–212. [Google Scholar] [CrossRef] [PubMed]
- Slob, M.J.; Sluzewski, M.; Van Rooij, W.J. The relation between packing and reopening in coiled intracranial aneurysms: A prospective study. Neuroradiology 2005, 47, 942–945. [Google Scholar] [CrossRef] [PubMed]
- Mascitelli, J.R.; Patel, A.B.; Polykarpou, M.F.; Patel, A.A.; Moyle, H. Analysis of early angiographic outcome using unique large diameter coils in comparison with standard coils in the embolization of cerebral aneurysms: A retrospective review. J. Neurointerv. Surg. 2015, 7, 126–130. [Google Scholar] [CrossRef] [PubMed]
- Khatri, R.; Chaudhry, S.A.; Rodriguez, G.J.; Suri, M.F.K.; Cordina, S.M.; Qureshi, A.I. Frequency and Factors Associated with Unsuccessful Lead (First) Coil Placement in Patients Undergoing Coil Embolization of Intracranial Aneurysms. Neurosurgery 2012, 72, 452–458. [Google Scholar] [CrossRef]
- Wiśniewski, K.; Tomasik, B.; Bobeff, E.J.; Stefańczyk, L.; Hupało, M.; Jaskólski, D.J. Predictors for ophthalmic segment aneurysms recanalization after coiling and flow diverter embolization in 6- and 12-month follow-up. J. Clin. Neurosci. 2019, 68, 151–157. [Google Scholar] [CrossRef]
- Umeda, Y.; Ishida, F.; Tsuji, M.; Furukawa, K.; Shiba, M.; Yasuda, R.; Toma, N.; Sakaida, H.; Suzuki, H. Computational fluid dynamics (CFD) using porous media modeling predicts recurrence after coiling of cerebral aneurysms. PLoS ONE 2017, 12, e0190222. [Google Scholar] [CrossRef] [PubMed]
- Moradicheghamahi, J.; Sadeghiseraji, J.; Jahangiri, M. Numerical solution of the Pulsatile, non-Newtonian and turbulent blood flow in a patient specific elastic carotid artery. Int. J. Mech. Sci. 2019, 150, 393–403. [Google Scholar] [CrossRef]
- Box, F.M.A.; van der Geest, R.J.; Rutten, M.C.M.; Reiber, J.H.C. The Influence of Flow, Vessel Diameter, and Non-Newtonian Blood Viscosity on the Wall Shear Stress in a Carotid Bifurcation Model for Unsteady Flow. Investig. Radiol. 2005, 40, 277–294. [Google Scholar] [CrossRef]
- Pierot, L.; Barbe, C.; Herbreteau, D.; Gauvrit, J.-Y.; Januel, A.-C.; Bala, F.; Ricolfi, F.; Desal, H.; Velasco, S.; Aggour, M.; et al. Rebleeding and bleeding in the year following intracranial aneurysm coiling: Analysis of a large prospective multicenter cohort of 1140 patients—Analysis of Recanalization after Endovascular Treatment of Intracranial Aneurysm (ARETA) Study. J. Neurointerv. Surg. 2020, 12, 1219–1225. [Google Scholar] [CrossRef]
- Pierot, L.; Cognard, C.; Anxionnat, R.; Ricolfi, F.; CLARITY Investigators. Ruptured Intracranial Aneurysms: Factors Affecting the Rate and Outcome of Endovascular Treatment Complications in a Series of 782 Patients (CLARITY Study). Radiology 2010, 256, 916–923. [Google Scholar] [CrossRef]
- Ortiz, R.; Stefanski, M.; Rosenwasser, R.; Veznedaroglu, E. Cigarette smoking as a risk factor for recurrence of aneurysms treated by endosaccular occlusion. J. Neurosurg. 2008, 108, 672–675. [Google Scholar] [CrossRef]
- Hope, J.K.A.; Byrne, J.V.; Molyneux, A.J. Factors Influencing Successful Angiographic Occlusion of Aneurysms Treated by Coil Embolization. Am. J. Neuroradiol. 1999, 20, 391–399. [Google Scholar]
- Plowman, R.S.; Clarke, A.; Clarke, M.; Byrne, J.V. Sixteen-year single- surgeon experience with coil embolization for ruptured intracranial aneurysms: Recurrence rates and incidence of late rebleeding: Clinical article. J. Neurosurg. 2011, 114, 863–874. [Google Scholar] [CrossRef] [PubMed]
- Ferns, S.P.; Sprengers, M.E.; van Rooij, W.J.; van Zwam, W.H.; de Kort, G.A.; Velthuis, B.K.; Schaafsma, J.D.; van den Berg, R.; Sluzewski, M.; Brouwer, P.A.; et al. Late reopening of adequately coiled intracranial aneurysms: Frequency and risk factors in 400 patients with 440 aneurysms. Stroke 2011, 42, 1331–1337. [Google Scholar] [CrossRef]
- Piotin, M.; Spelle, L.; Mounayer, C.; Salles-Rezende, M.T.; Giansante-Abud, D.; Vanzin-Santos, R.; Moret, J. Intracranial Aneurysms: Treatment with Bare Platinum Coils—Aneurysm Packing, Complex Coils, and Angiographic Recurrence 1. Radiology 2007, 243, 500–508. [Google Scholar] [CrossRef] [PubMed]
- Grunwald, I.Q.; Papanagiotou, P.; Struffert, T.; Politi, M.; Krick, C.; Gül, G.; Reith, W. Recanalization after endovascular treatment of intracerebral aneurysms. Neuroradiology 2007, 49, 41–47. [Google Scholar] [CrossRef]
- Sluzewski, M.; Van Rooij, W.J.; Slob, M.J.; Bescós, J.O.; Slump, C.H.; Wijnalda, D. Relation between Aneurysm Volume, Packing, and Compaction in 145 Cerebral Aneurysms Treated with Coils. Radiology 2004, 231, 653–658. [Google Scholar] [CrossRef] [PubMed]
- White, P.M.; Lewis, S.C.; Gholkar, A.; Sellar, R.J.; Nahser, H.; Cognard, C.; Forrester, L.; Wardlaw, J.M. Hydrogel-coated coils versus bare platinum coils for the endovascular treatment of intracranial aneurysms (HELPS): A randomised controlled trial. Lancet 2011, 377, 1655–1662. [Google Scholar] [CrossRef]
- Molyneux, A.J.; Clarke, A.; Sneade, M.; Mehta, Z.; Coley, S.; Roy, D.; Kallmes, D.F.; Fox, A.J. Cerecyte coil trial: Angiographic outcomes of a prospective randomized trial comparing endovascular coiling of cerebral aneurysms with either cerecyte or bare platinum coils. Stroke 2012, 43, 2544–2550. [Google Scholar] [CrossRef]
- Pierot, L.; Cognard, C.; Anxionnat, R.; Ricolfi, F.; CLARITY Investigators. Remodeling Technique for Endovascular Treatment of Ruptured Intracranial Aneurysms Had a Higher Rate of Adequate Postoperative Occlusion than Did Conventional Coil Embolization with Comparable Safety. Radiology 2011, 258, 546–553. [Google Scholar] [CrossRef] [PubMed]
- Piotin, M.; Blanc, R.; Spelle, L.; Mounayer, C.; Piantino, R.; Schmidt, P.J.; Moret, J. Stent-assisted coiling of intracranial aneurysms: Clinical and angiographic results in 216 consecutive aneurysms. Stroke 2010, 41, 110–115. [Google Scholar] [CrossRef] [PubMed]
- Brinjikji, W.; Murad, M.H.; Lanzino, G.; Cloft, H.J.; Kallmes, D.F. Endovascular treatment of intracranial aneurysms with flow diverters: A meta-analysis. Stroke 2013, 44, 442–447. [Google Scholar] [CrossRef] [PubMed]
- Al Saiegh, F.; Mouchtouris, N.; Sweid, A.; Chalouhi, N.; Theofanis, T.; Ghosh, R.; Tjoumakaris, S.; Gooch, M.R.; Rosenwasser, R.H.; Jabbour, P. Placement of the Woven EndoBridge (WEB) device via distal transradial access in the anatomical snuffbox: A technical note. J. Clin. Neurosci. 2019, 69, 261–264. [Google Scholar] [CrossRef] [PubMed]
- Lubicz, B.; Klisch, J.; Gauvrit, J.Y.; zikora, I.; Leonardi, M.; Liebig, T.; Nuzzi, N.P.; Boccardi, E.; Paola, F.D.; Holtmannspötter, M.; et al. WEB-DL endovascular treatment of wide-neck bifurcation aneurysms: Short- and mid-term results in a European study. Am. J. Neuroradiol. 2014, 35, 432–438. [Google Scholar] [CrossRef] [PubMed]
- Baek, J.W.; Jin, S.-C.; Kim, S.-T.; Jeong, H.W.; Jeong, Y.G.; Heo, Y.J.; Han, J.Y.; Kim, D.; Park, J.H.; Kwon, S.C.; et al. Radiological and clinical outcomes of endovascular coiling of proximal A1 aneurysms. J. Clin. Neurosci. 2020, 73, 67–73. [Google Scholar] [CrossRef] [PubMed]
- Ferns, S.P.; Sprengers, M.E.S.; van Rooij, W.J.; Rinkel, G.J.; van Rijn, J.C.; Bipat, S.; Sluzewski, M.; Majoie, C.B. Coiling of intracranial aneurysms: A systematic review on initial occlusion and reopening and retreatment rates. Stroke 2009, 40, e523–e529. [Google Scholar] [CrossRef]
- Halouhi, N.; Jabbour, P.; Singhal, S.; Drueding, R.; Starke, R.M.; Dalyai, R.T.; Tjoumakaris, S.; Gonzalez, L.F.; Dumont, A.S.; Rosenwasser, R.; et al. Stent-assisted coiling of intracranial aneurysms: Predictors of complications, recanalization, and outcome in 508 cases. Stroke 2013, 44, 1348–1353. [Google Scholar] [CrossRef] [PubMed]
- Hetts, S.; Turk, A.; English, J.D.; Dowd, C.F.; Mocco, J.; Prestigiacomo, C.; Nesbit, G.; Ge, S.G.; Jin, J.N.; Carroll, K.; et al. Stent-Assisted Coiling versus Coiling Alone in Unruptured Intracranial Aneurysms in the Matrix and Platinum Science Trial: Safety, Efficacy, and Mid-Term Outcomes. Am. J. Neuroradiol. 2013, 35, 698–705. [Google Scholar] [CrossRef] [PubMed]
- Lubicz, B.; Leclerc, X.; Gauvrit, J.-Y.; Lejeune, J.-P.; Pruvo, J.-P. Three-dimensional packing with complex orbit coils for the endovascular treatment of intracranial aneurysms. Am. J. Neuroradiol. 2005, 26, 1342–1348. [Google Scholar] [PubMed]
- Neki, H.; Kohyama, S.; Otsuka, T.; Yonezawa, A.; Ishihara, S.; Yamane, F. Optimal first coil selection to avoid aneurysmal recanalization in endovascular intracranial aneurysmal coiling. J. Neurointerv. Surg. 2018, 10, 50–54. [Google Scholar] [CrossRef]
- Mitsos, A.P.; Kakalis, N.M.; Ventikos, Y.P.; Byrne, J.V. Hemodynamic simulation of aneurysm coiling in an anatomically accurate computational fluid dynamics model: Technical note. Neuroradiology 2008, 50, 341–347. [Google Scholar] [CrossRef]
- Otani, T.; Nakamura, M.; Fujinaka, T.; Hirata, M.; Kuroda, J.; Shibano, K.; Wada, S. Computational fluid dynamics of blood flow in coil-embolized aneurysms: Effect of packing density on flow stagnation in an idealized geometry. Med Biol. Eng. Comput. 2013, 51, 901–910. [Google Scholar] [CrossRef] [PubMed]


| Study Group | |
|---|---|
| Inclusion criteria |
|
| Exclusion criteria |
|
| N1–14039328 elements N2–6237876 elements N3–2436595 elements | r21–1.310 r32–1.368 | ||||
| Right posterior cerebral artery; velocity (m/s) | Left superior cerebellar artery; velocity (m/s) | Median cross section of the aneurysm; velocity (m/s) | Frontal cross section of the aneurysm; velocity (m/s) | Aneurysm walls; WSS (Pa) | |
| 0.1334 | 0.1391 | 0.182 | 0.221 | 3.82 | |
| 0.1328 | 0.1388 | 0.179 | 0.218 | 3.83 | |
| 0.1340 | 0.1375 | 0.169 | 0.19 | 3.74 | |
| p | 2.319 | 4.450 | 3.575 | 6.984 | 4.219 |
| 0.132 | 0.139 | 0.184 | 0.222 | 4.969 | |
| 0.90% | 0.94% | 5.59% | 12.84% | 0.36% | |
| 0.85% | 0.31% | 2.63% | 1.60% | 0.13% | |
| 0.134 | 0.139 | 0.184 | 0.222 | 4.983 | |
| 0.45% | 0.22% | 1.65% | 1.36% | 0.10% | |
| 0.51% | 0.09% | 1.00% | 0.24% | 0.05% | |
| 1.29% | 0.50% | 4.29% | 2.86% | 0.21% | |
| 0.64% | 0.12% | 1.26% | 0.30% | 0.06% | |
| Type of Scale | Numer of Cases |
|---|---|
| Hunt-Hess grade | n = 66 |
| I | 11 |
| II | 26 |
| III | 24 |
| IV | 5 |
| V | 0 |
| Fisher grade * | n = 66 |
| I | 11 |
| II | 23 |
| III | 15 |
| IV | 13 |
| Glasgow Outcome Scale (GOS) at discharge | n = 66 |
| V | 13 |
| IV | 32 |
| III | 10 |
| II | 7 |
| I | 4 |
| Modified Rankin scale (after 12 moths) | n = 66 |
| 1 | 22 |
| 2 | 16 |
| 3 | 6 |
| 4 | 9 |
| 5 | 9 |
| 6 | 4 |
| Comorbidities (mostly arterial hypertension, diabetes mellitus-DM (type I or II)) | 47/66 |
| Value | Mean ± SD without Recanalization | Mean ± SD with Recanalization | p |
|---|---|---|---|
| Age (years) | 56.75 ± 15.28 | 56.89 ± 16.12 | 0.974 |
| depth (mm) | 5.46 ± 2.68 | 6.42 ± 3.29 | 0.229 |
| height (mm) | 6.86 ± 3.22 | 9.49 ± 5.19 | 0.016 |
| width (mm) | 5.37 ± 2.63 | 6.63 ± 3.31 | 0.111 |
| neck size (mm) | 3.27 ± 0.83 | 4.14 ± 0.66 | <0.001 * |
| APTT | 30.09 ± 5.51 | 28.97 ± 2.86 | 0.473 |
| INR | 1.07 ± 0.28 | 1.08 ± 0.13 | 0.916 |
| HCT | 35.55 ± 11.42 | 36.49 ± 10.09 | 0.759 |
| APTT ratio | 96.64 ± 14.03 | 95.19 ± 8.26 | 0.683 |
| aneurysm volume (mm3) | 166.48 ± 274.3 | 349.15 ± 432.39 | 0.045 |
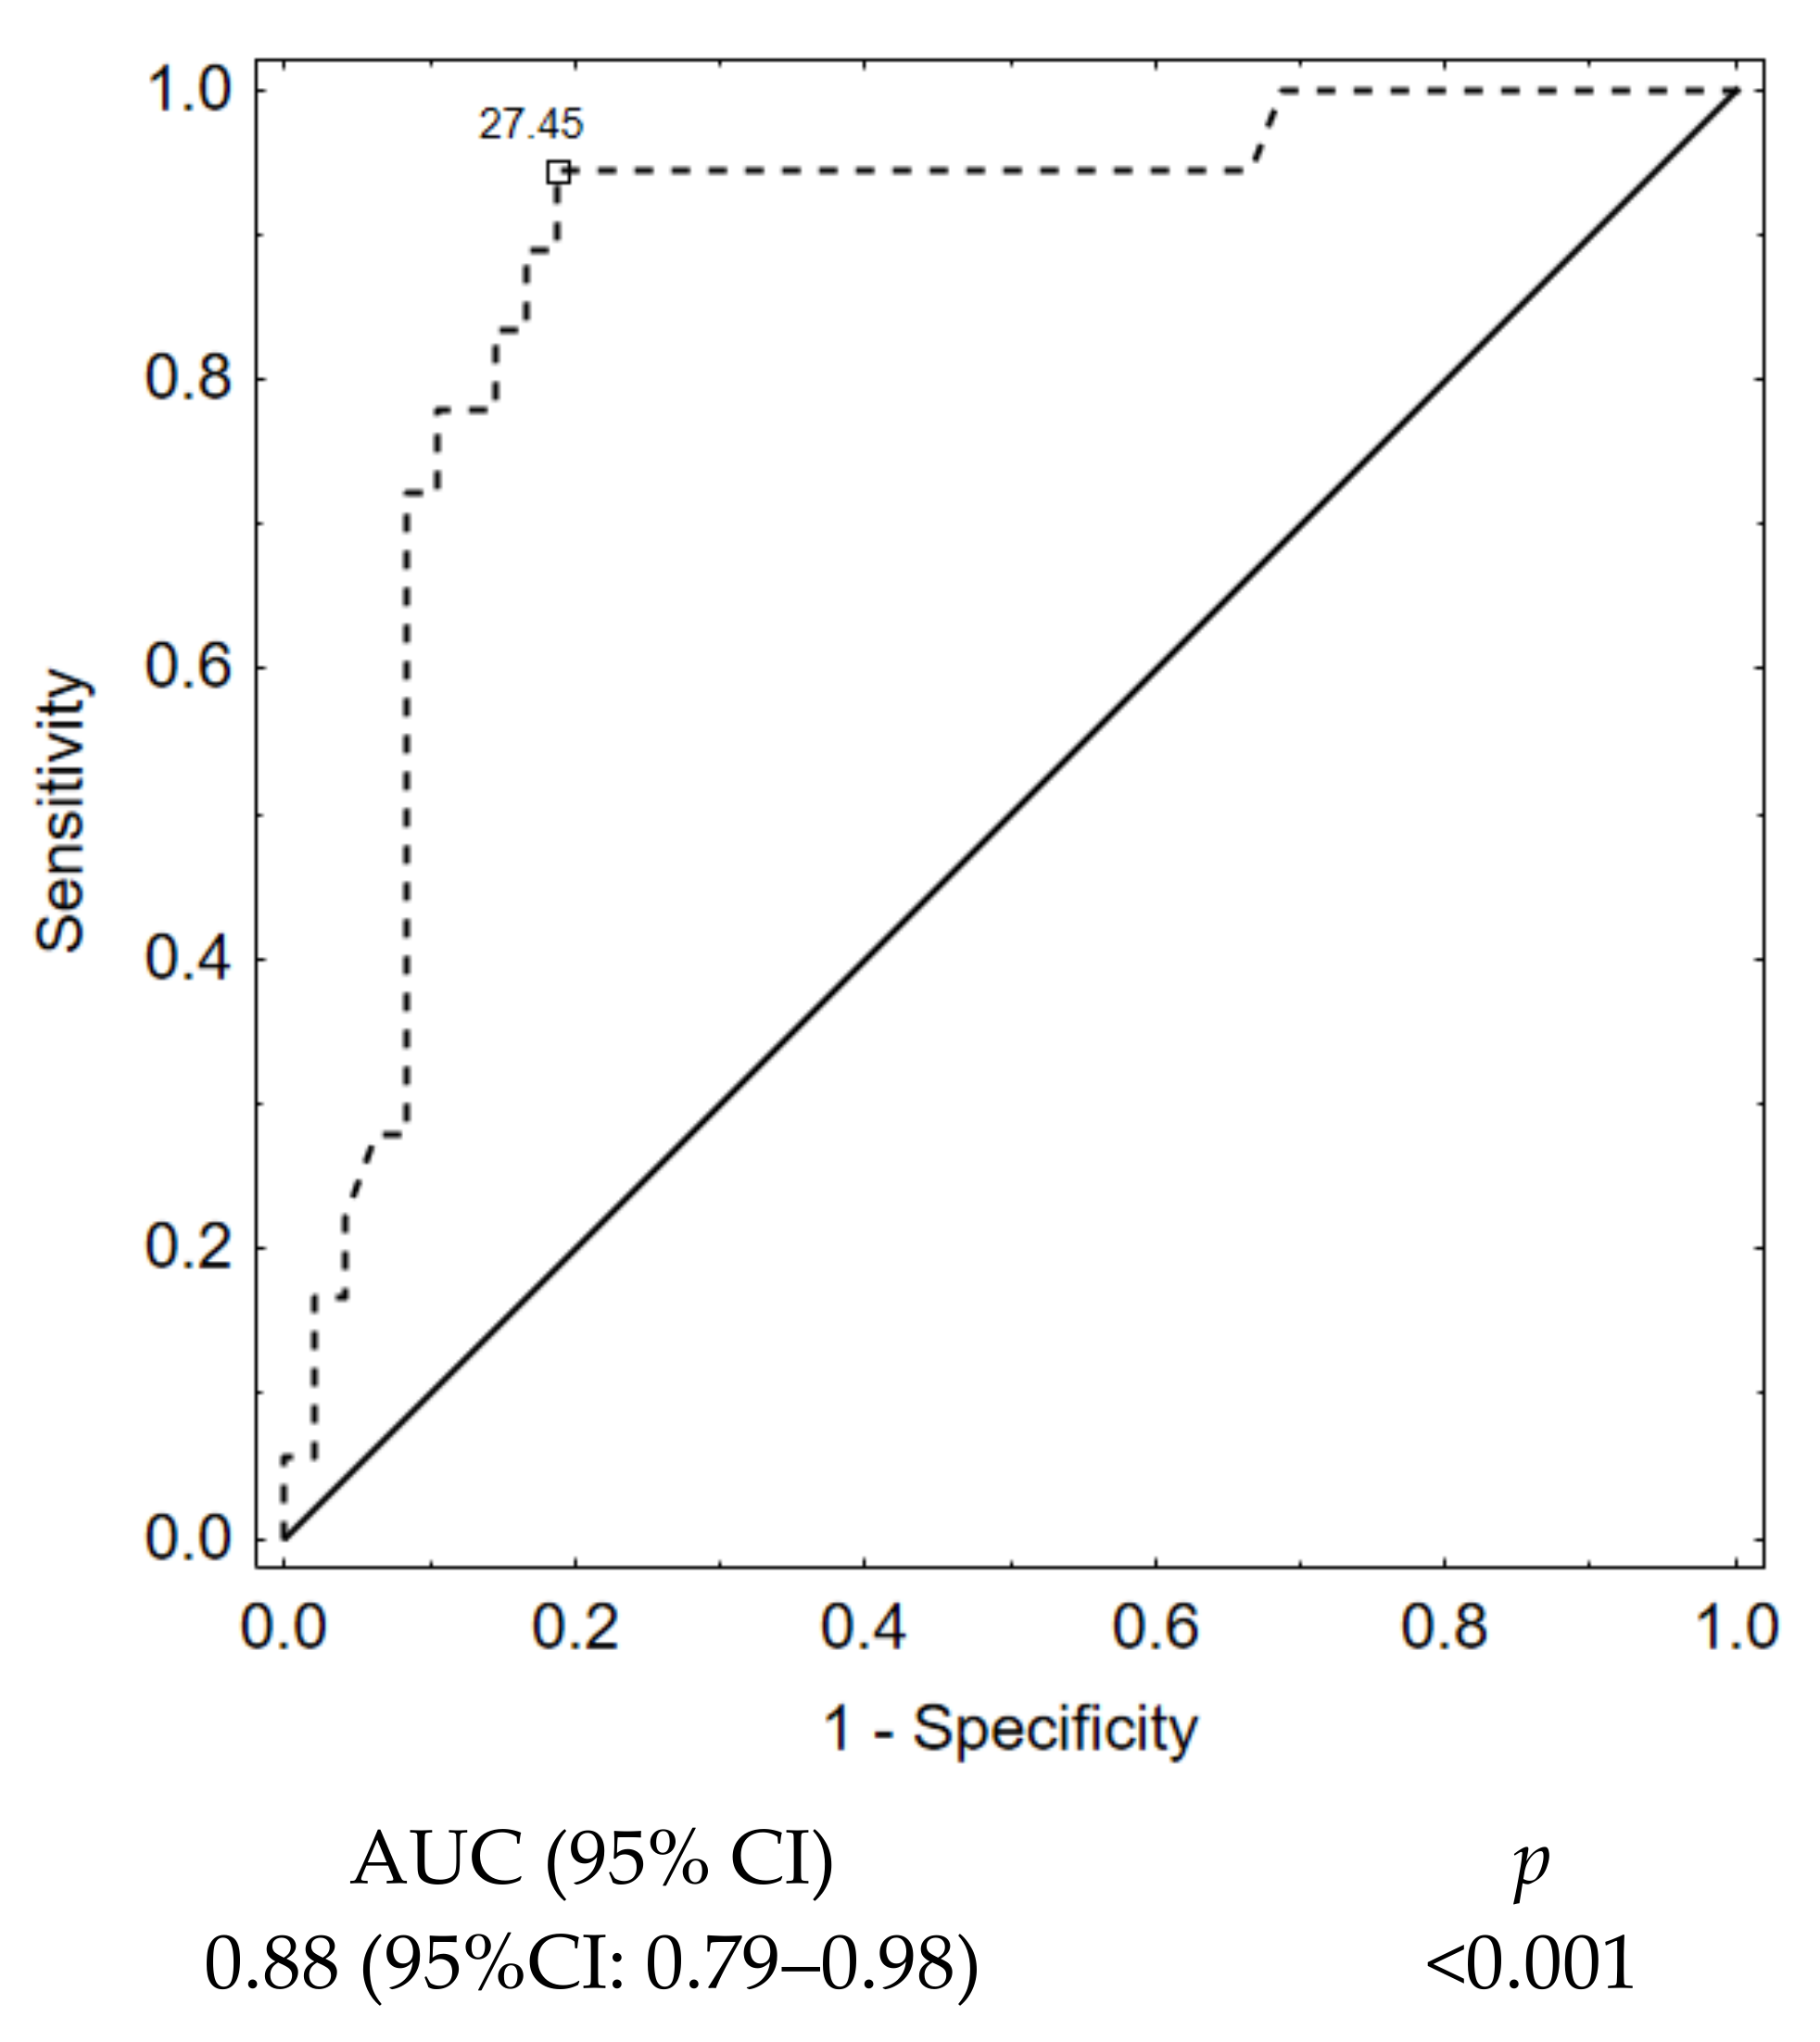
| packing density (%) | 35.0 ± 10.8 | 21.2 ± 6.6 | <0.001 * |
| 1st VPD (%) | 18.28 ± 4.16 | 10.51 ± 2.83 | <0.001 * |
| Parent artery diameter (mm) | 3.75 ± 0.92 | 3.92 ± 1.08 | 0.525 |
| The largest aneurysm size (mm) | 7.04 ± 3.16 | 9.44 ± 5.17 | 0.026 |
| SR (maximum aneurysm height divided by the parent artery diameter) | 2.02 ± 1.12 | 2.49 ± 1.27 | 0.147 |
| index determining the ratio of neck width to diameter of the parent artery | 0.92 ± 0.29 | 1.16 ± 0.46 | 0.015 |
| Hmax - the largest aneurysm dimension perpendicular to the neck (mm) | 6.89 ± 3.41 | 12.03 ± 5.09 | <0.001 * |
| aspect ratio (AR)—index determining the ratio of the largest dimension of the aneurysm perpendicular to the neck to the width of the aneurysm neck | 2.14 ± 0.90 | 3.03 ± 1.59 | 0.006 |
| Variable | Odds Ratio (95% CI) | p Value |
|---|---|---|
| Multivariate analysis for late recanalization | ||
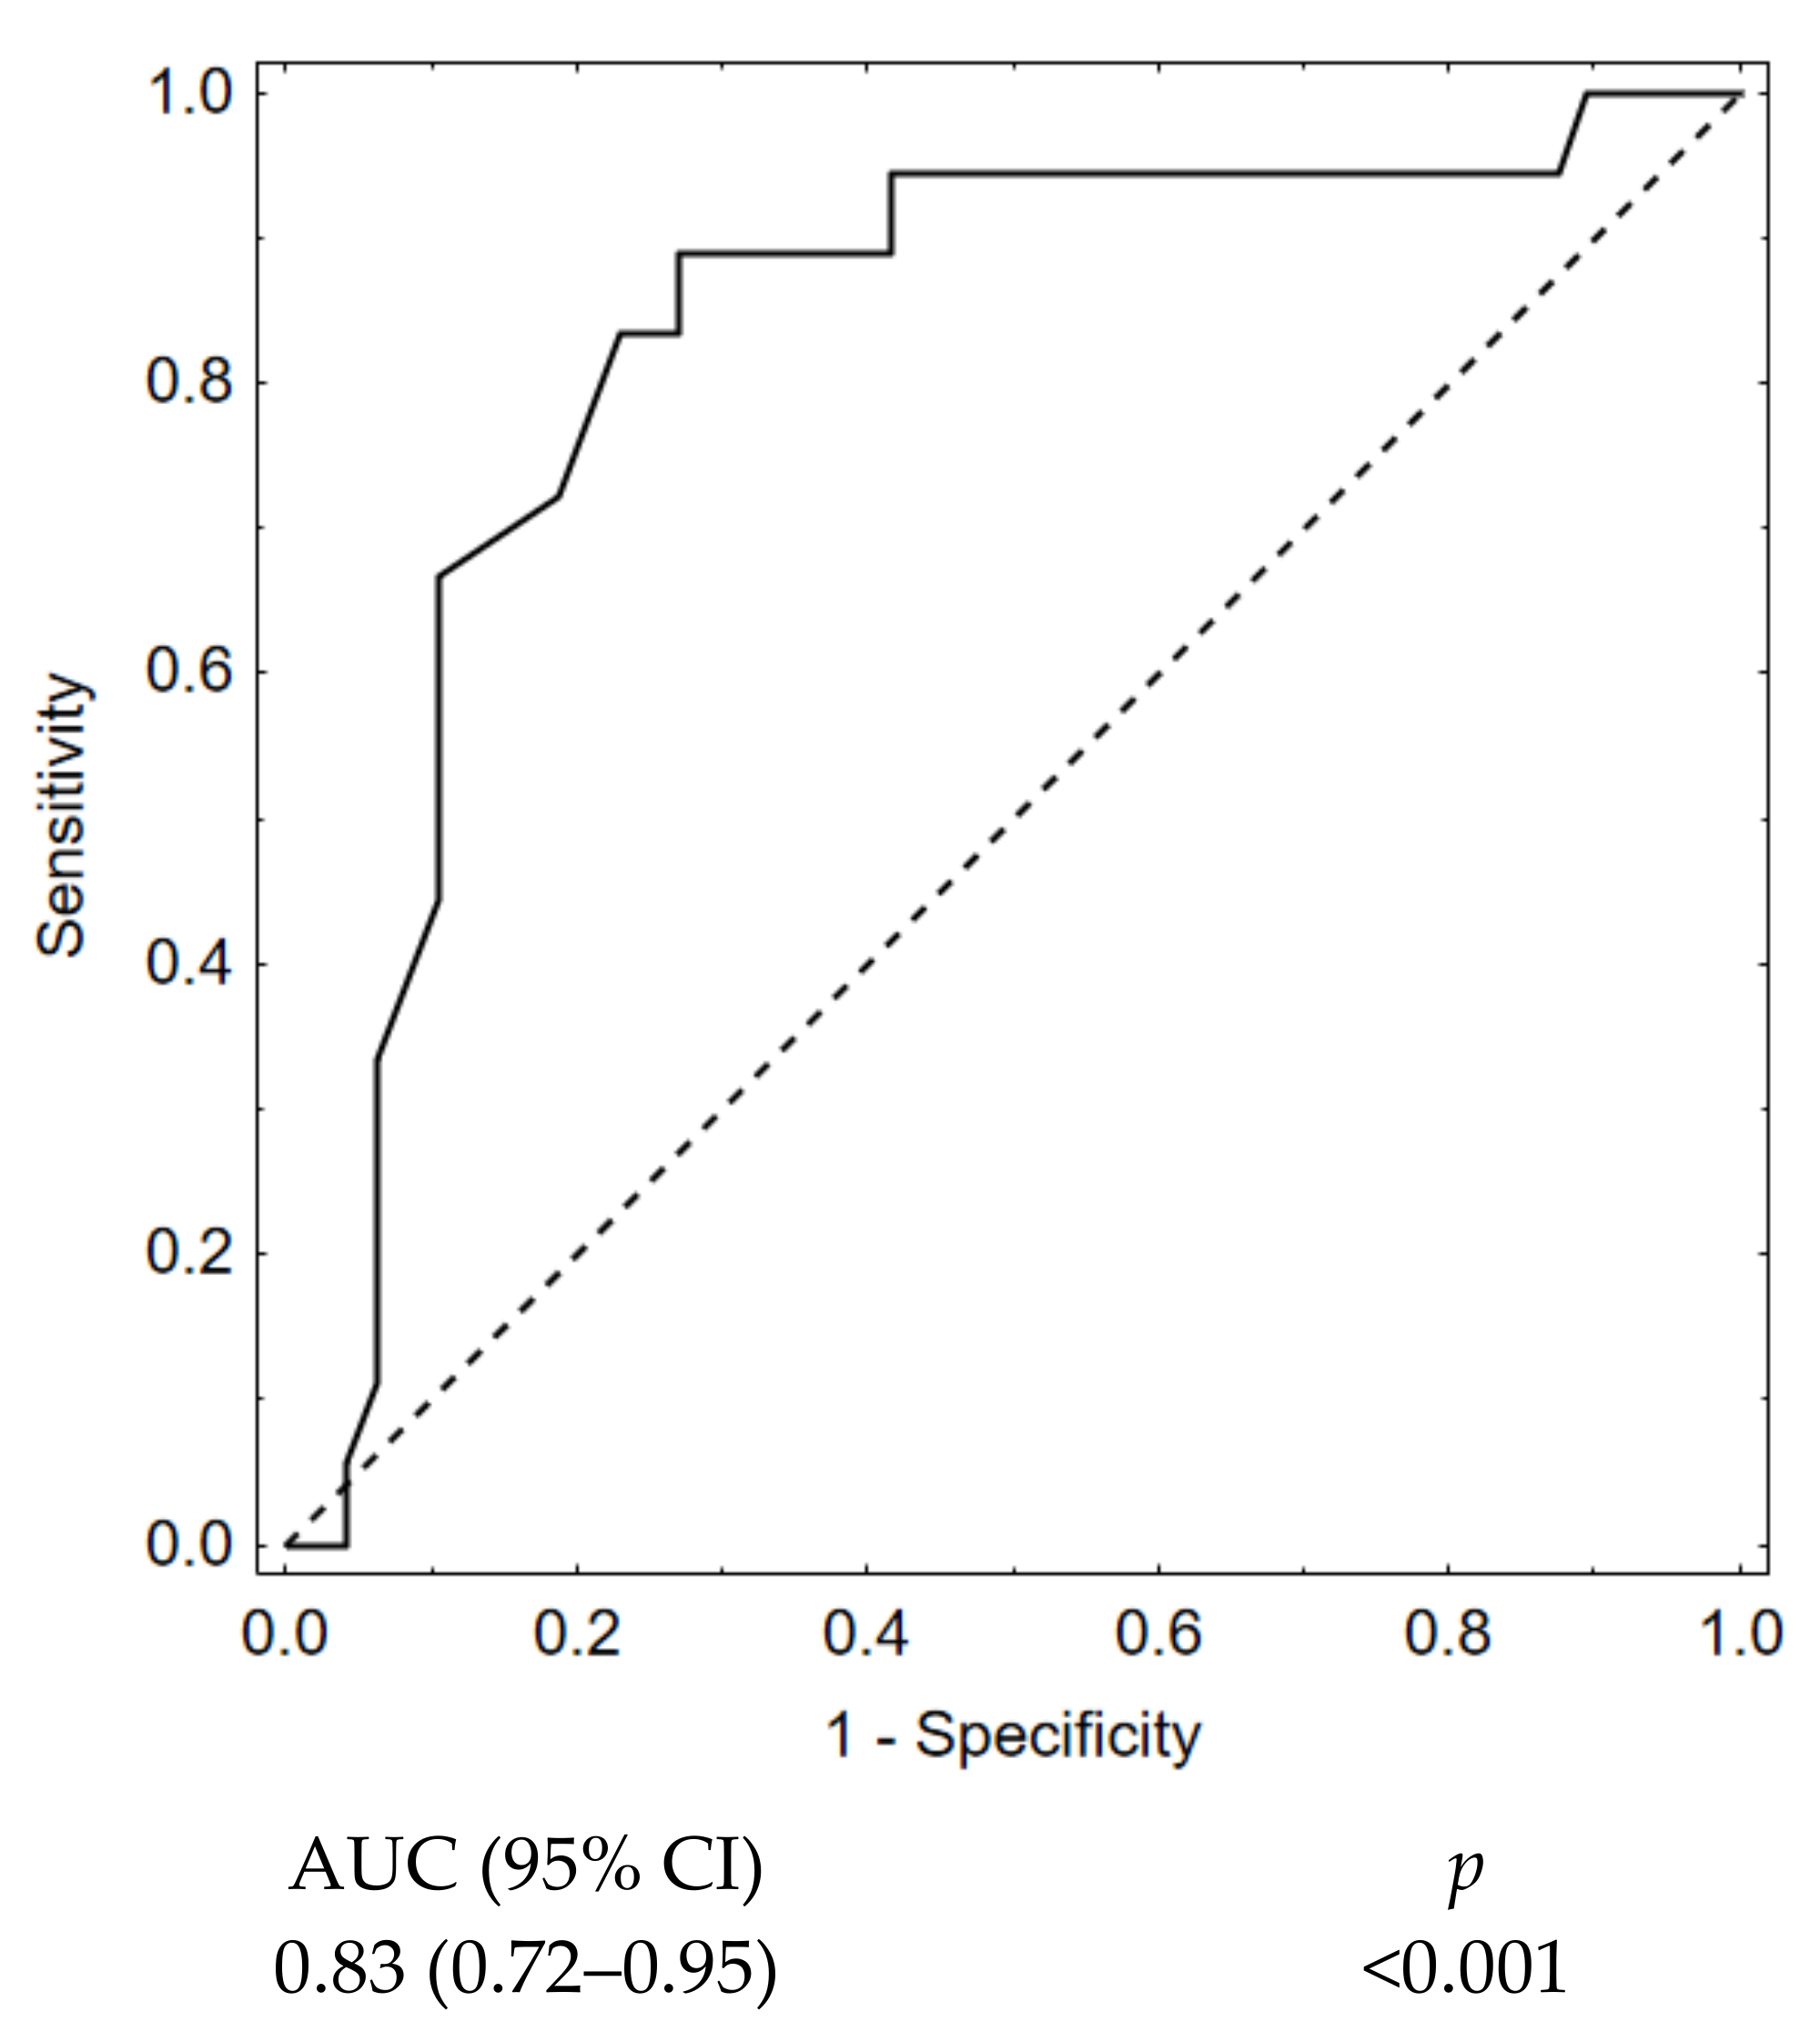
| 1st VPD | 0.50 (0.35–0.72) | <0.001 |
| Multivariate analysis for long-term outcome | ||
| GOS at discharge | 0.06 (0.01–0.28) | <0.001 |
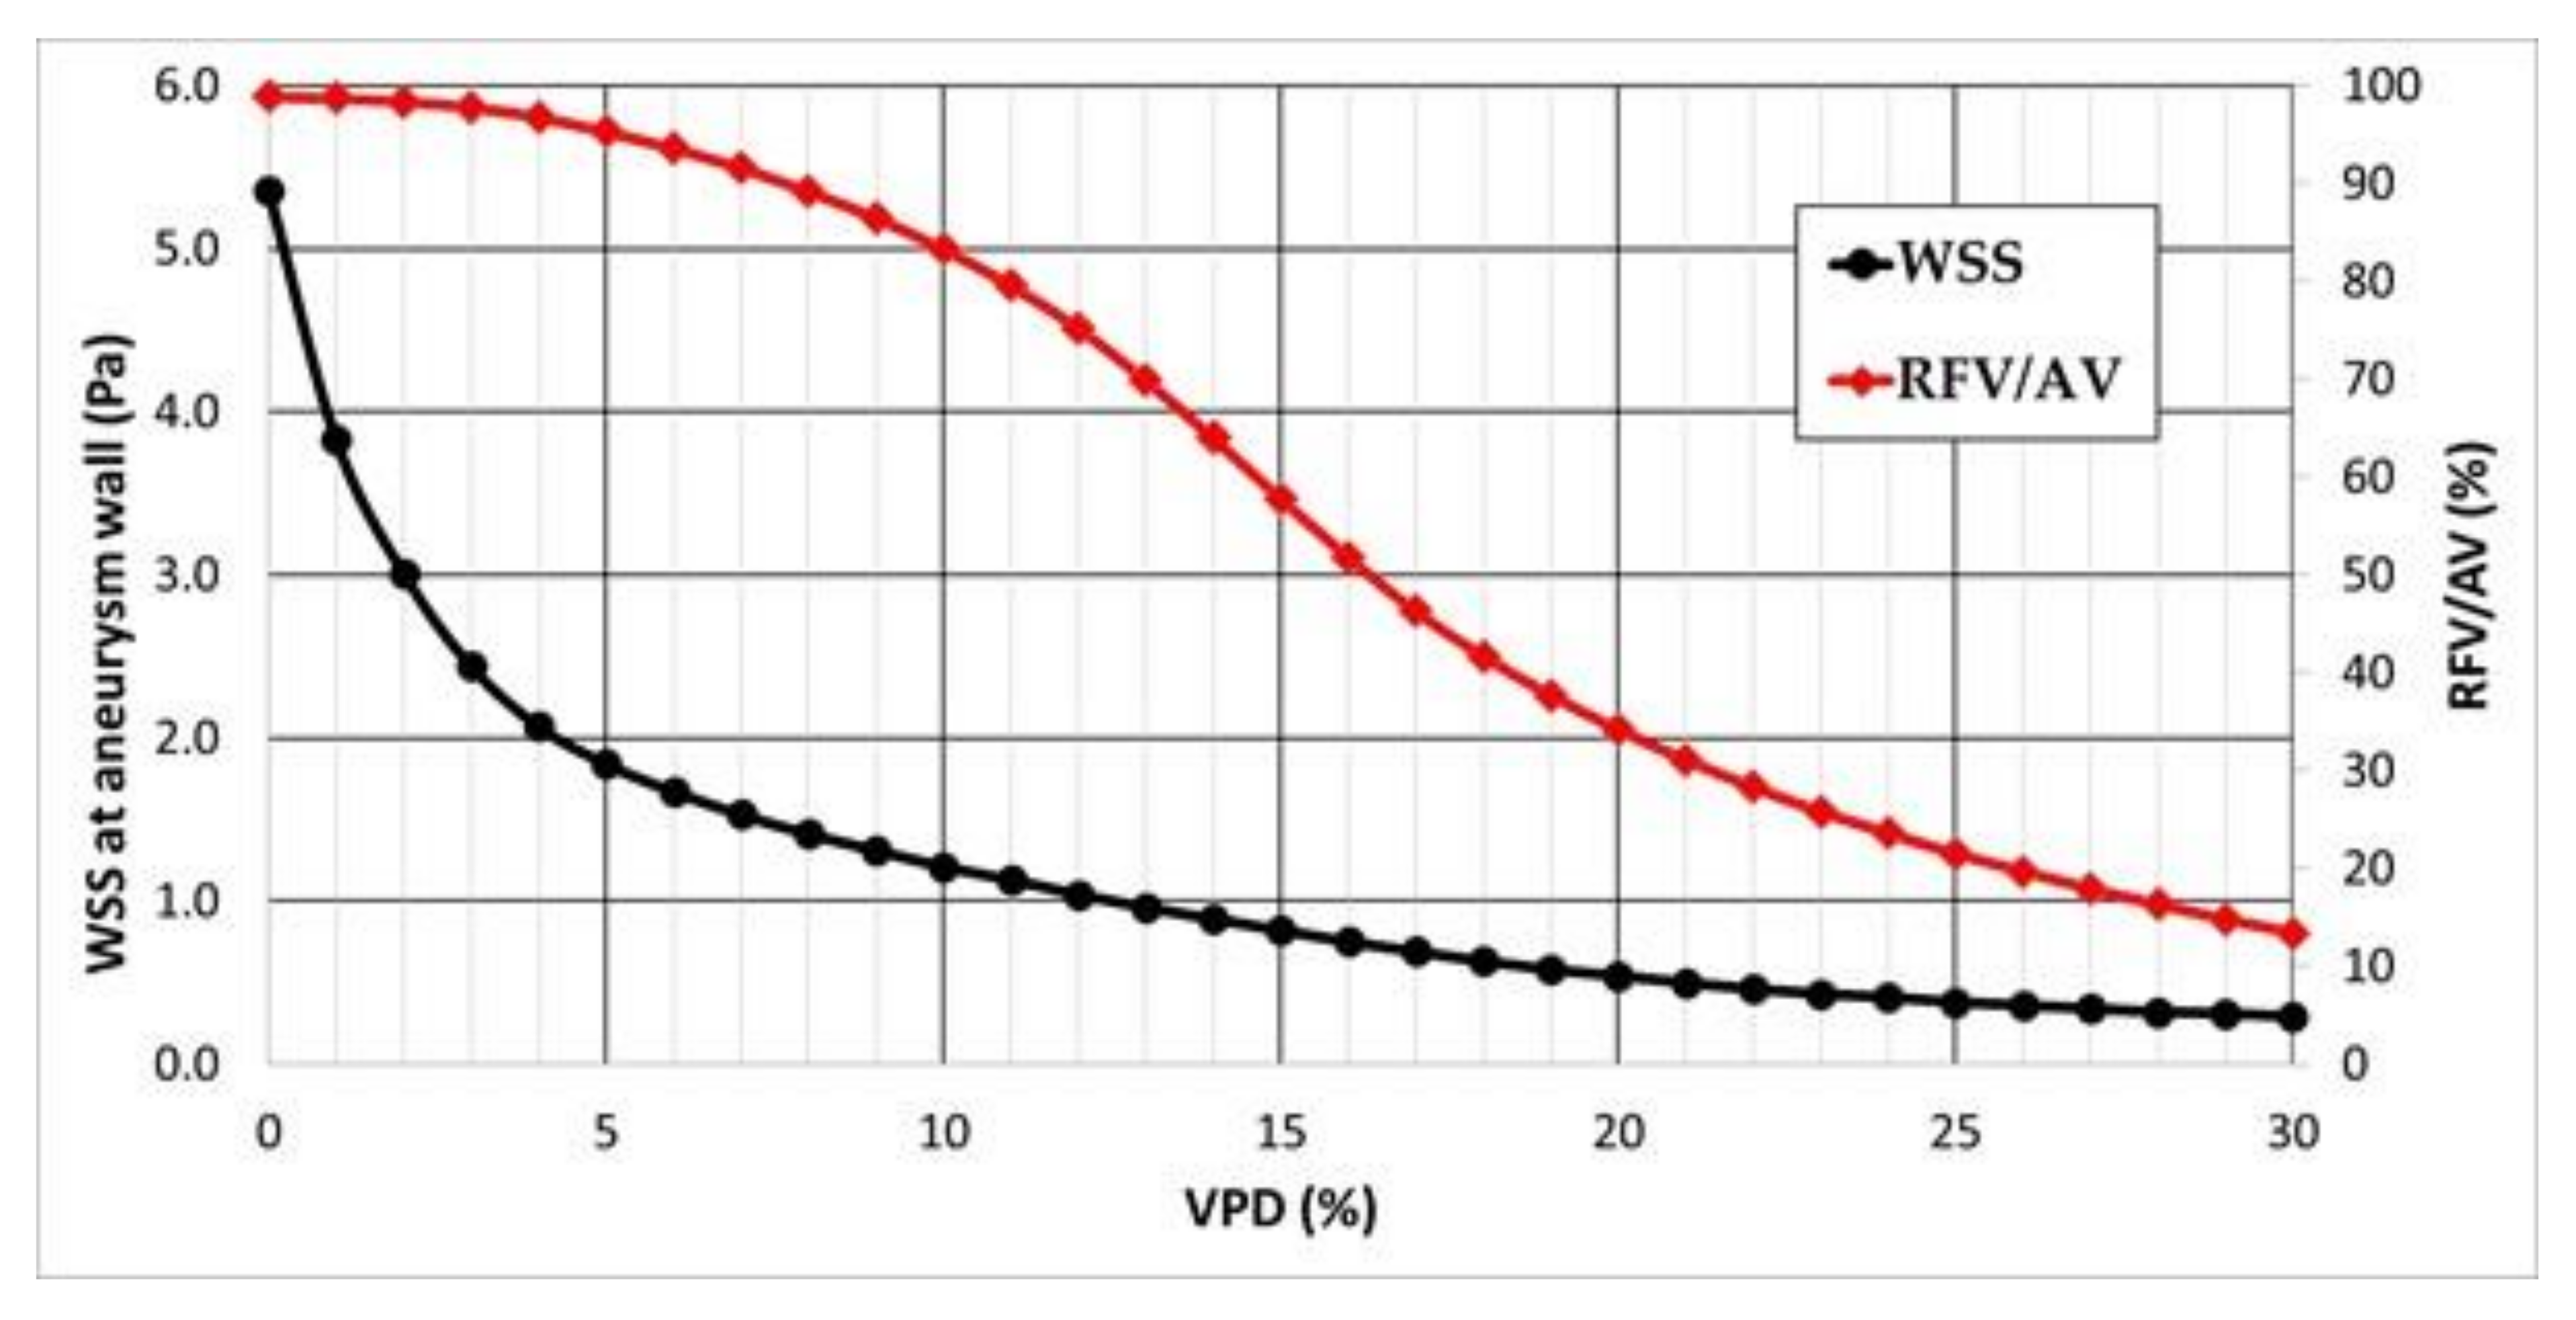
| 1st VPD (%) | Velocity at the Aneurysm Neck (m/s) | WSS at the Artery Wall (Pa) | WSS at the Aneurysm Wall (Pa) | Pressure at the Aneurysm Wall (Pa) | RFV/AV (%) |
|---|---|---|---|---|---|
| 0 | 0.243 | 4.99 | 5.36 | 11,344.0 | 98.9 |
| 1 | 0.214 | 4.98 | 3.83 | 11,341.8 | 98.7 |
| 2 | 0.203 | 4.98 | 3.01 | 11,341.5 | 98.4 |
| 3 | 0.199 | 4.98 | 2.44 | 11,343.1 | 97.8 |
| 4 | 0.199 | 4.98 | 2.07 | 11,345.5 | 96.8 |
| 5 | 0.200 | 4.99 | 1.84 | 11,348.3 | 95.3 |
| 6 | 0.202 | 4.99 | 1.67 | 11,351.0 | 93.6 |
| 7 | 0.204 | 5.00 | 1.53 | 11,353.1 | 91.6 |
| 8 | 0.206 | 5.00 | 1.41 | 11,354.7 | 89.2 |
| 9 | 0.207 | 5.01 | 1.31 | 11,355.7 | 86.5 |
| 10 | 0.207 | 5.01 | 1.21 | 11,356.1 | 83.3 |
| 11 | 0.206 | 5.02 | 1.13 | 11,356.0 | 79.6 |
| 12 | 0.203 | 5.02 | 1.04 | 11,355.7 | 75.2 |
| 13 | 0.200 | 5.02 | 0.96 | 11,355.0 | 69.9 |
| 14 | 0.195 | 5.03 | 0.89 | 11,354.2 | 64.0 |
| 15 | 0.188 | 5.03 | 0.82 | 11,353.2 | 57.8 |
| 16 | 0.181 | 5.03 | 0.75 | 11,352.0 | 51.8 |
| 17 | 0.173 | 5.04 | 0.69 | 11,351.0 | 46.3 |
| 18 | 0.164 | 5.04 | 0.63 | 11,350.0 | 41.7 |
| 19 | 0.155 | 5.05 | 0.58 | 11,349.0 | 37.7 |
| 20 | 0.147 | 5.05 | 0.54 | 11,348.0 | 34.2 |
| 21 | 0.138 | 5.06 | 0.50 | 11,347.5 | 31.1 |
| 22 | 0.131 | 5.06 | 0.46 | 11,346.8 | 28.3 |
| 23 | 0.123 | 5.06 | 0.43 | 11,346.3 | 25.8 |
| 24 | 0.116 | 5.07 | 0.41 | 11,345.8 | 23.6 |
| 25 | 0.109 | 5.07 | 0.38 | 11,345.5 | 21.5 |
| 26 | 0.103 | 5.07 | 0.36 | 11,345.2 | 19.7 |
| 27 | 0.097 | 5.08 | 0.34 | 11,344.9 | 17.9 |
| 28 | 0.092 | 5.08 | 0.32 | 11,344.9 | 16.3 |
| 29 | 0.087 | 5.08 | 0.31 | 11,344.9 | 14.8 |
| 30 | 0.082 | 5.08 | 0.29 | 11,344.9 | 13.4 |
Publisher’s Note: MDPI stays neutral with regard to jurisdictional claims in published maps and institutional affiliations. |
© 2021 by the authors. Licensee MDPI, Basel, Switzerland. This article is an open access article distributed under the terms and conditions of the Creative Commons Attribution (CC BY) license (http://creativecommons.org/licenses/by/4.0/).
Share and Cite
Wiśniewski, K.; Tomasik, B.; Tyfa, Z.; Reorowicz, P.; Bobeff, E.J.; Stefańczyk, L.; Posmyk, B.J.; Jóźwik, K.; Jaskólski, D.J. Porous Media Computational Fluid Dynamics and the Role of the First Coil in the Embolization of Ruptured Intracranial Aneurysms. J. Clin. Med. 2021, 10, 1348. https://doi.org/10.3390/jcm10071348
Wiśniewski K, Tomasik B, Tyfa Z, Reorowicz P, Bobeff EJ, Stefańczyk L, Posmyk BJ, Jóźwik K, Jaskólski DJ. Porous Media Computational Fluid Dynamics and the Role of the First Coil in the Embolization of Ruptured Intracranial Aneurysms. Journal of Clinical Medicine. 2021; 10(7):1348. https://doi.org/10.3390/jcm10071348
Chicago/Turabian StyleWiśniewski, Karol, Bartłomiej Tomasik, Zbigniew Tyfa, Piotr Reorowicz, Ernest J. Bobeff, Ludomir Stefańczyk, Bartłomiej J. Posmyk, Krzysztof Jóźwik, and Dariusz J. Jaskólski. 2021. "Porous Media Computational Fluid Dynamics and the Role of the First Coil in the Embolization of Ruptured Intracranial Aneurysms" Journal of Clinical Medicine 10, no. 7: 1348. https://doi.org/10.3390/jcm10071348
APA StyleWiśniewski, K., Tomasik, B., Tyfa, Z., Reorowicz, P., Bobeff, E. J., Stefańczyk, L., Posmyk, B. J., Jóźwik, K., & Jaskólski, D. J. (2021). Porous Media Computational Fluid Dynamics and the Role of the First Coil in the Embolization of Ruptured Intracranial Aneurysms. Journal of Clinical Medicine, 10(7), 1348. https://doi.org/10.3390/jcm10071348