Abstract
This study aimed to characterize the metabolomic profile of monofloral honey from Eucryphia cordifolia (ulmo) and evaluate the potential transfer of bioactive compounds from the plant parts, including the leaves and flowers, to the honey. Using UHPLC/Q-TOF-MS analysis, various flavonoids and phenolic acids were identified and quantified in extracts from the leaves, flowers, and honey from E. cordifolia. Given their rich polyphenolic composition, E. cordifolia leaves were included in this study to assess their potential contribution to the antioxidant properties and chemical markers of ulmo honey. Additionally, the polyphenolic compounds in honey samples were quantified. Chromatographic analysis via UHPLC-MS/MS revealed that ulmo honey contains phenolic acids such as gallic, syringic, ferulic, chlorogenic, caffeic, and coumaric acid, as well as flavonoids including pinocembrin, quercetin, luteolin, kaempferol, epicatechin, apigenin, and isorhamnetin. The results indicate that pinocembrin and gallic acid are the main chemical markers of ulmo honey, while isorhamnetin could complement its characterization as a complementary marker. UHPLC/Q-TOF-MS analysis was also utilized to compare the compounds present in the honey with those found in the plant parts (leaves and flowers), respectively. A total of 10 shared compounds were identified, 9 of which were preliminarily identified, while 1 remains unknown. Notably, dihydroquercetin 3-O-rhamnoside, quercetin 3-O-rhamnoside, cyanidin 3-(p-coumaroyl)-glucoside, and eupatorin were detected in ulmo honey for the first time. Along with gallic acid, pinocembrin, and isorhamnetin, these compounds could contribute to a characteristic fingerprint for identifying the botanical origin of the honey. Overall, these findings provide valuable insights into the chemical composition of ulmo honey and its potential application as a functional product with antioxidant properties.
1. Introduction
Honey is a natural food product with a sweet taste that is produced by the honeybee (Apis mellifera L.) and known for its high nutritional and medicinal value. In the Egyptian and Greek cultures, it was used to treat various ailments, like stomach ulcers and skin wounds [1]. Honey is a natural matrix composed of approximately 80–85% total carbohydrates (about 40% fructose, 30% glucose, and 10–15% maltose, sucrose, and other sugars), with the exact composition largely depending on the plant species from which the nectar or exudate was collected, as well as the environmental conditions and climate [2].
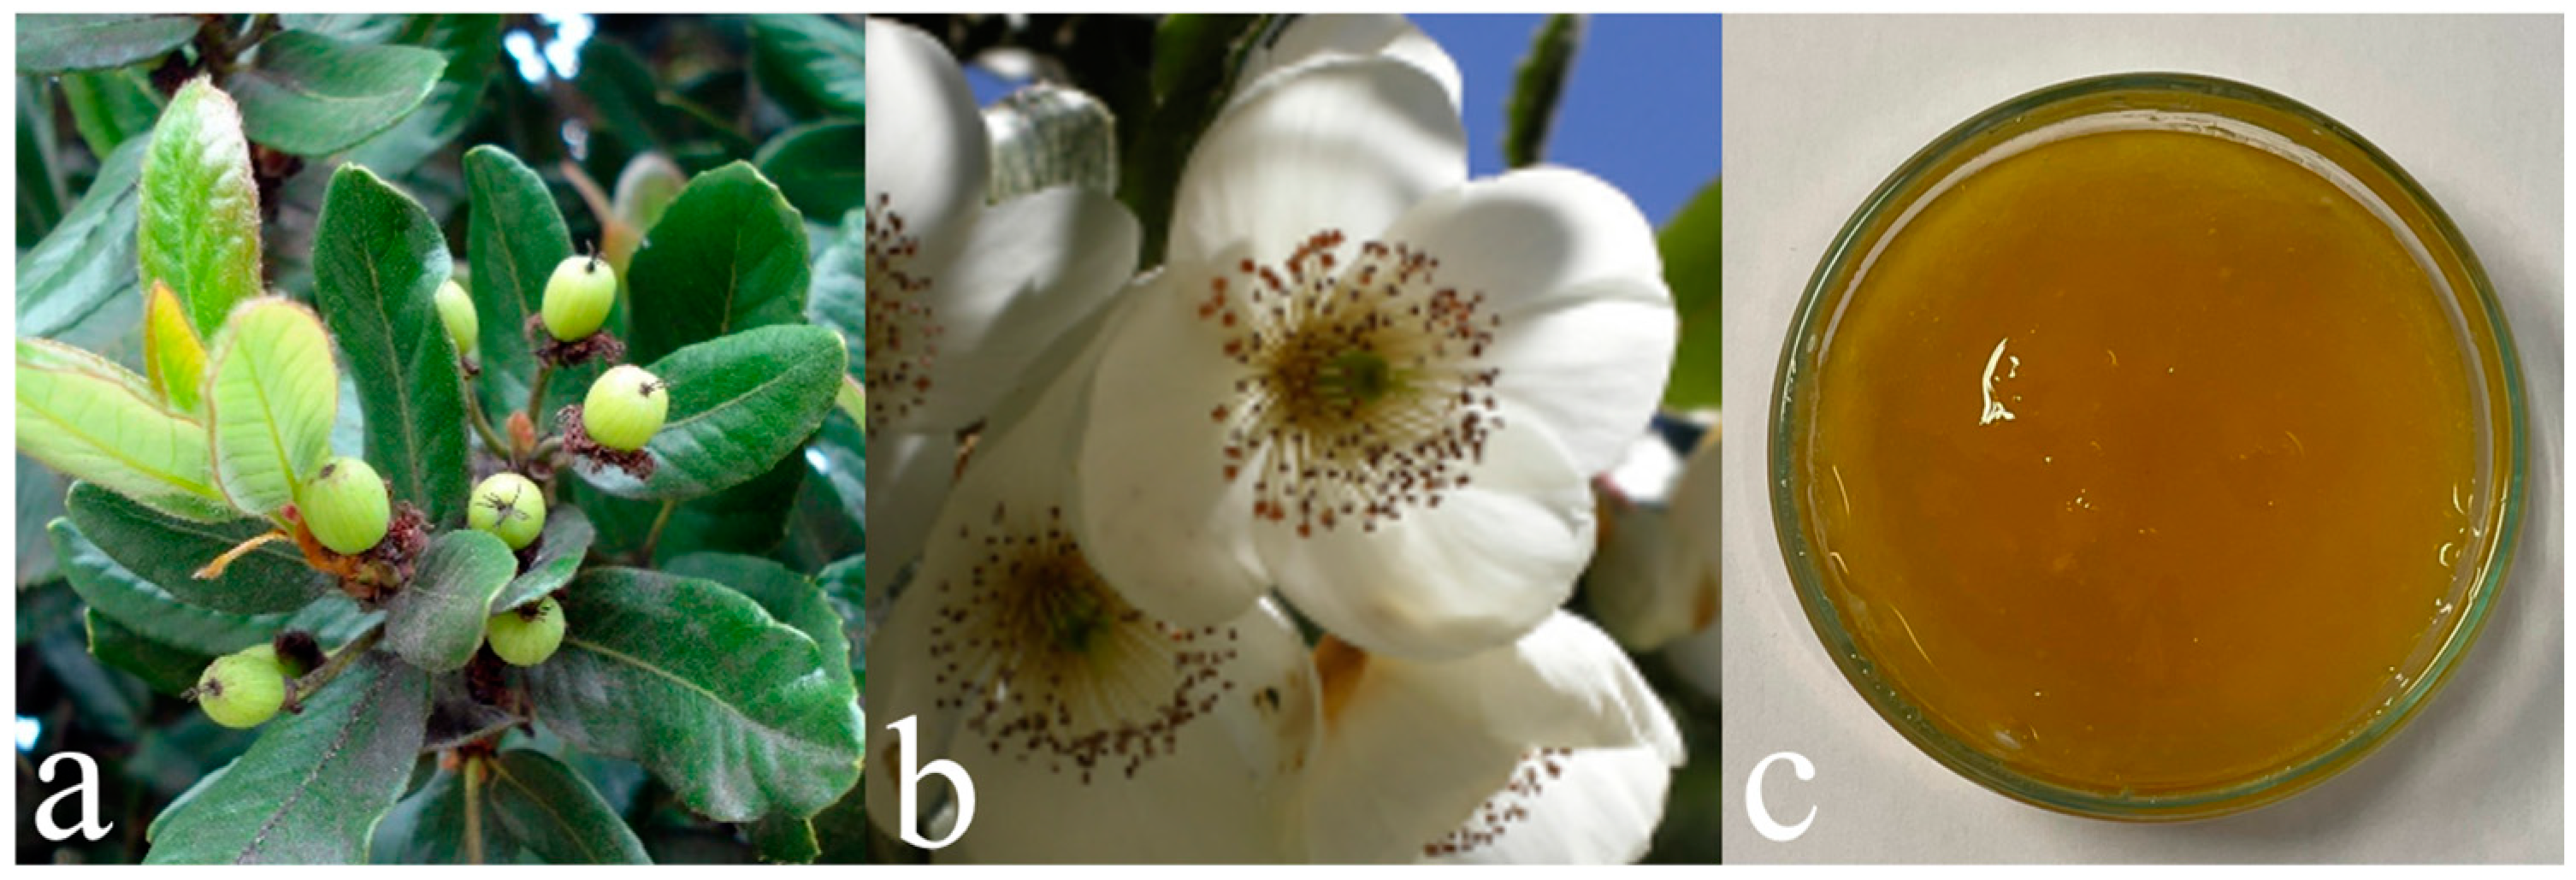
Chile ranks 29th among global honey producers with a production of 11,600 tons of honey annually (0.68% of global production), of which 10,000 tons are exported [3]. Chilean honey is highly appreciated due to its nematicidal and antifungal properties and its known chemical characteristics and biological attributes. A particular species, ulmo (Eucryphia cordifolia Cav.), possesses flowers that are highly appealing to bees (Figure 1). In recent times, ulmo honey has garnered recognition for its antioxidant and antimicrobial characteristics. The monofloral honey of Eucryphia cordifolia has been widely used in traditional medicine in the Mapuche-Chilean culture, especially for the treatment of infections. The ulmo tree is distributed in southern Chile from the Ñuble Region to the Los Lagos Region, being a typical tree of the Valdivian forest. Its flowers produce a large amount of nectar, making it an excellent honey tree and providing a product with a pleasant aroma and characteristic golden color (Figure 1) [4]. The ulmo (E. cordifolia) blooms between January and March, depending on the latitude and altitude. During this period, bees collect nectar from its flowers to produce honey. The ulmo honey harvest typically takes place between March and April.

Figure 1.
Leaves (a), flowers (b), and honey of E. cordifolia (c).
Recently, a study conducted by our group reported that the leaves and monofloral honey of E. cordifolia exhibit antioxidant and antibacterial activities [5,6]. Another study suggests that ulmo honey may possess healing properties, along with potential anticancer, antioxidant, and antibacterial effects [4]. The presence of phenolic compounds, flavonoids, tannins, triterpenes, diterpenes, steroids, and volatile oils in the leaves and stems of E. cordifolia has been reported, evidencing its bioactive potential [7,8,9,10,11]. Therefore, their inclusion in this study allows for a more comprehensive evaluation of the plant’s potential impact on the composition and bioactivity of the resulting honey. However, information on the metabolomic identification of its flowers and the honey derived from this specimen is still limited. Considering that ulmo honey originates from floral nectar, it is essential to evaluate its metabolomic profile and determine whether its bioactive compounds present antioxidant properties. To date, the antioxidant properties of E. cordifolia flowers have not been studied, which represents a gap in knowledge about the chemistry of this species and its potential influence on honey composition.
Various techniques have been developed to verify the floral origin of honey, aiming to ensure its authenticity and distinguish it from other types of honey. Among these methodologies, melissopalynology has been widely used to identify the characteristic pollen profile of the species in question. Additionally, infrared spectroscopy and chemometric analysis have been used to predict the phenolic and flavonoid content in ulmo honey [12]. Furthermore, sensory analysis and SPME-GC-MS have enabled the identification of distinctive compounds in monofloral ulmo honey [13]. In recent years, metabolomic profiling using mass spectrometry has emerged as an advanced tool for detailed chemical characterization.
In this study, metabolomic analysis using high-resolution mass spectrometry (LC-MS/MS) with a QTOF analyzer was employed to identify and characterize flavonoids, phenolic acids, and anthocyanins in E. cordifolia. This technology provides a comprehensive profile of the metabolites present in ulmo honey and allows comparison with leaf and flower extracts of the species. Therefore, the main objective of this research was to evaluate the relationship between the chemical compounds present in the plant and their possible transfer to honey, aiming to identify potential chemical markers that contribute to its botanical authentication.
2. Materials and Methods
2.1. Chemicals and Reagents
Folin–Ciocalteu’s phenol reagent, Ethyl acetate, n-hexane, and methanol were purchased from Merck (Darmstadt, Germany). 1,1-diphenyl-2-picrylhydrazyl (DPPH), potassium persulfate (K2S2O8), 2,2′-azino-bis(3-ethylbenzothiazoline-6-sulphonate) (ABTS), 1,3,5-triphenyltetrazolium chloride (TPTZ), Trolox (6-hydroxy2,5,7,8-tetramethylchroman-2-carboxylic acid), FeSO4·7H2O, gallic acid, cinnamic acid, syringic acid, ferulic acid, chlorogenic acid, caffeic acid, p-coumaric acid, benzoic acid, pinocembrin, rutin, quercetin, luteolin, kaempferol, epicatechin, catechin, apigenin, myricetin, isorhamnetin, taxifolin, chrysin, galanganin, genistein, and hesperetin were all purchased from Sigma Chemical Co. (St. Louis, MO, USA).
2.2. Plant Material and Extraction
The plant material (leaves and flowers) of E. cordifolia was collected in January 2020 in Puerto Varas (Chile). Ethyl acetate and aqueous fractions from the methanolic extract of E. cordifolia leaves were previously obtained [10]. The flowers were dried at room temperature in the shade. The dry and powdered material was subsequently extracted separately with n-hexane, ethyl acetate, and methanol by maceration followed by filtration. The extracts were prepared at room temperature by stirring for 48 h. The extracts were concentrated to dryness in a rotary evaporator (Rotavapor® R-100, BÜCHI Labortechnik AG, Flawil, Switzerland) under reduced pressure at 45 °C. Subsequently, they were stored at 4 °C for further analysis. Also, n-hexane was used to defat the flower samples, and the resulting extract was not included in the analysis.
2.3. Honey Collection
Honey samples from ulmo honey (UH055, UH056, and UH057) were obtained from local beekeepers in the Mediterranean climate zone of southern Chile (Los Lagos: Región X, Los Ríos: Región XIV). For comparison, three samples of monofloral honey (Tiaca, Guindo Santo, Alfalfa Chilota; 3 samples of each honey) were collected from southern Chile. Only honeys containing ≥ 45% ulmo pollen, as determined by melissopalynological analysis, were selected. The samples were stored at −20 °C until the study was conducted. The water content, pH value, diastase activity and sugar content of the ulmo honey samples were determined according to the methods proposed by the Association of Official Analytical Chemists (AOAC) [14].
2.4. Honey Extract Preparation
Ulmo honey samples (1 g) were dissolved in 10 mL of distilled water and allowed to stand for approximately 1 h. The sample was added to an Oasis HLB cartridge, which was previously conditioned with 5 mL of methanol and 5 mL of distilled water, respectively. The washing step was finished by adding 5 mL of distilled water, extracting mainly interfering sugars, and allowing the sample to dry for approximately 15 min under vacuum. The phenolic compounds were eluted with 5 mL of methanol. The methanol extract was filtered through a 0.45 μm filter and stored at −20 °C for further analysis, as described in Section 2.5 and Section 2.6 [15].
2.5. Quantitative UHPLC-MS/MS Chromatographic Analysis
All samples were analyzed with an ABSciex triple Quad 4500 mass spectrometer equipped with an electrospray (TurboV) interface coupled to an Eksigent Ekspert Ultra LC100 automatic sampling system with an Ekspert Ultra LC100-XL (AB/Sciex Concord, Concord, ON, Canada). A LiChrospher 100 RP-18 (125 mm × 4 mm id, 5 µm) column was utilized, and 0.1% formic acid in water (A) and methanol (B) with the following gradient compositions were used as a mobile phase: 0–1 min, 15% B; 1–17 min, 15–100% B; 17–21 min 100–100% B; 21–22 min, 100–15% B; 22–25 min, 15–15% B. Ten microliters of each sample were injected at a flow rate of 0.5 mL/min at 30 °C. Calibration curves were recorded for each compound using available standards in the 10–250 μg/L range.
2.6. UHPLC/Q-TOF-MS/MS
Chromatographic profiling was performed on an Agilent 1260 Infinity UHPLC system (Agilent, Waldbronn, Germany) coupled to a Triple TOF 5600 QTOF-MS detector (AB SCIEX, Toronto, ON, Canada) with an electrospray ionization (ESI) source. Data acquisition and processing were performed using the Analyst TF 1.5, PeakView™ 1.2, and LibraryView™ (AB Sciex, Toronto, ON, Canada) software, respectively. For analysis, 2 mg per mL of the plant parts was dissolved in distilled water/methanol (1:1 v/v) and then 5 µL of the filtered solution (PTFE filter, Merck KGaA, Darmstadt, Germany) was injected.
Liquid chromatography was performed using an Acquity UPLC C18 1.7 μm, 2.1 mm × 50 mm column (Waters Corporation, Milford, MA, USA). A gradient of 0.1% formic acid (solvent A) and methanol with 0.1% formic acid (solvent B) was used as follows: between 0 and 13 min, 90% (A) and 10% (B), then between 13 and 15 min, 100% (B), and, finally, between 15 and 22 min, 90% (A) and 10% (B). The flow rate was adjusted to 0.4 mL/min and the separation was finished in 35 min.
MS data were recorded from 80 to 1200 m/z in negative mode and directed information dependent acquisition (IDA) analysis was performed in survey scan type (TOF-MS) using dependent scan (production) with −50 V collision energy voltage. The temperature was 400 °C with 25 psi curtain gas (CU), while 50 psi was applied for both ion source gas 1 (GC1) and ion source 2 gas (GS2). The ion spray voltage was −4500 V, the disaggregation potential was (DP) 90 V, and the collision energy voltage was set to (CE) −50 V (Supplementary Materials, Figures S1–S5).
2.7. Antioxidant Activity Assays
2.7.1. 2,2-Diphenyl-1-picrylhydrazyl Radical (DPPH)
The DPPH• radical was determined by the decolorization method [16] and adapted to 96-well plates. Briefly, 50 µL of sample was mixed with 150 µL of a DPPH solution (0.15 mM) in methanol and kept in the dark for 30 min. Subsequently, the absorbance was measured at 517 nm in a microplate reader (Cytation™ 5, BioTek, Santa Clara, CA, USA). The results are expressed in TEAC, the antioxidant activity equivalent to Trolox (μmol Trolox/g extract). The synthetic antioxidant reference, Trolox, at a concentration of 25–200 µM in methanol solution, was tested under the same conditions.
2.7.2. 2,2′-Azino-bis(3-ethylbenzothiazoline-6-sulphonate) (ABTS)
The ABTS assay was carried out by means of the iron reduction method [17], and adapted to 96-well plates. A stock solution of ABTS was prepared by mixing ABTS and potassium persulfate (K2S2O8) in distilled water, considering a final concentration of 7 mM for ABTS and a final concentration of 3.6 mM for K2S2O8. The reaction was then incubated at room temperature for 24 h in the dark. Subsequently, the ABTS stock solution was diluted to a final concentration of 156 µM to obtain a final absorbance of 0.70 ± 0.02 at 732 nm. Then, 50 µL of sample solution was mixed with 150 µL of reagent solution and the absorbance was measured at 732 nm after 30 min in the dark using a microplate reader (Cytation™ 5, BioTek, Santa Clara, CA, USA). The calibration curve was built with Trolox, and the results were expressed as micromoles of Trolox equivalents per gram of dry extract (µmol TE/g).
2.7.3. Ferric Ion Reducing Antioxidant Power Assay (FRAP)
The FRAP assay was performed according to the reported procedure [18]. Briefly, the FRAP reagent was prepared in situ by mixing 300 mM acetate buffer (pH 3.6), a solution of 10 mM 2,4,6-tripyridyl-s-triazine (TPTZ) in 40 mM hydrochloric acid and 20 mM ferric chloride in a 10:1:1 ratio (v/v/v). Then, 20 µL of each extract was mixed with 180 µL of FRAP reagent in 96-well plates. The mixture was left for 30 min in the dark and the absorbance at 595 nm was measured in a microplate reader (Cytation™ 5, BioTek, Santa Clara, CA, USA). Ferrous sulfate heptahydrate (FeSO4·7H2O) was used as standard to perform the calibration curve and results were expressed as millimoles of Fe per gram of dry sample (mmol Fe/g).
2.8. Total Phenolic Content (Folin-Ciocalteau)
The phenolic content was analyzed as previously reported [18]. A total of 20 µL of each sample was mixed with 100 µL of Folin–Ciocalteau reagent (1:10 v/v) and 80 µL of a Na2CO3 solution (7.5%), then incubated for 60 min at room temperature, after which the absorbance of the resulting blue solution was measured at 760 nm in a microplate reader (Cytation™ 5, BioTek, Santa Clara, CA, USA). The obtained absorbance values were replaced in the equation of the standard curve of gallic acid. The results of the total phenol content are expressed in mg of gallic acid equivalent per gram of dry extract (mg GAE/g).
2.9. Statistical Analysis
All assays were conducted in triplicate, with the results being expressed as the median ± standard deviation (SD) using Microsoft Excel (Microsoft 365, Microsoft Corporation, Redmond, WA, USA). Statistical differences between groups were considered significant at p < 0.05 and were analyzed using one-way ANOVA followed by Tukey’s post hoc test in the commercial software Minitab 19.
3. Results
3.1. Identification of Compounds in E. cordifolia Extracts by LC QTOF-MS/MS
In this study, the fingerprint was generated by LC-QTOF-MS/MS, which allowed for the determination of several families of compounds in the extracts of the leaves, flowers, and honey of E. cordifolia. The metabolomic study of the three ulmo honey samples enabled the identification and characterization of their chemical profiles, highlighting the compounds present in each. For the construction of the compound table, only metabolites shared among the three samples were considered, ensuring a more consistent and representative depiction of the characteristic chemical profile of E. cordifolia honey. The tentative identification of the metabolites was carried out by the analysis of full scan mass spectra, base peak chromatograms, and fragmentation patterns in comparison to the PubChem database, FooDB, and data from the literature.
3.1.1. Identification of Metabolites in the Ethyl Acetate Fraction of Leaves
Eighteen compounds were detected, and 14 compounds were tentatively identified in the ethyl acetate fraction (EtOAcF) from the methanolic extract of E. cordifolia leaves. Of these compounds, two are phenolic acids (1, 15), eight are flavonoids (5, 6, 7, 8, 9, 10, 11, and 18), three are anthocyanins (12, 13 and 14), and one is a polyphenolic compound (17); four compounds remained unidentified, respectively (2, 3, 4, and 16) (Table 1, Supplementary Materials, Figure S1).

Table 1.
Identification of metabolites in EtOAc fraction of E. cordifolia leaves.
Anthocyanin
Peak 12, with a pseudomolecular ion at M+H+ at m/z: 611.1300, was identified as delphinidin 3-O-(6-p-coumaroyl-glucoside) (C30H27O14+). Peak 13 exhibited a molecular ion at M+H+ with m/z: 578.1355 and showed a major fragment with m/z: 271.8191 that may correspond to pelargonidin; this compound could be tentatively identified as Pelargonidin-3-O-beta-D-p-coumaroylglucoside (C30H26O12+). Peak 14 showed a molecular ion at M+H+ with m/z 595.1306 and produced a major fragment with m/z 286.8026 (cyanidin); this compound was identified as cyanidin 3-(p-coumaroyl)-glucoside (C30H26O13+).
Flavonoids
Peak 5, with a M−H− ion at m/z: 449.1087, was identified as dihydroquercetin 3-O-rhamnoside (C21H21O11−) and peaks 6–11 were identified as quercetin 3-O-glucoside (C21H19O12−), hesperidin (C28H33O15−), quercetin 3-O-pentoside (C20H17O11−), quercetin 3-O-rhamnoside (C21H19O11−), isorhamnetin (C16H11O7−), and kaempferol 3-O-rhamnoside (C21H19O10−), respectively. Finally, peak 18 was identified as eupatorin (C18H15O7−).
Phenolic Acids
Peak 1 was identified as galloyl glucose (C13H15O10−), and peak 15 as vanillic acid (C8H7O4−).
Other Polyphenols
Peak 17, with a pseudomolecular ion at m/z: 149.0971, was identified as carvacrol (C10H13O−).
Unknown
Peaks 2, 3, 4, and 16 remain unidentified to date.
3.1.2. Identification of Metabolites in the Aqueous Fraction of Leaves
Twelve compounds were detected in this fraction and 10 compounds were tentatively identified in the aqueous fraction (AqF) from the methanolic extract of E. cordifolia leaves. Of these, two are procyanidins (1, 2), five are flavonoids (3, 4, 5, 6, 7), one is a phenolic acid (8), one is an anthocyanin (9), one is a polyphenol (12), and two compounds remain unidentified (10 and 11) (Table 2, Supplementary Materials, Figure S2).
Table 2.
Identification of metabolites in the aqueous fraction of E. cordifolia leaves.
Anthocyanin
Peak 9 showed a molecular ion at M+H+ with m/z 595.1297 and was identified as cyanidin 3-(p-coumaroyl)-glucoside (C30H26O13+).
Flavonoids
Peak 3, with a M−H− ion at m/z: 449.1085, was identified as dihydroquercetin 3-O-rhamnoside (C21H21O11−), and peaks 4–7 were identified as quercetin 3-O-glucoside (C21H19O12−), hesperidin (C28H33O15−), quercetin 3-O-pentoside (C20H17O11−), and quercetin 3-O-rhamnoside (C21H19O11−), respectively.
Phenolic Acids
Peak 8 was identified as vanillic acid (C8H7O4−).
Procyanidins
Peak 1, with a pseudomolecular ion at m/z 577.1366, was identified as procyanidin dimer B1 (C30H25O12−). Peak 2 showed a deprotonated molecule at m/z 865.2006 and was identified as an isomer of a procyanidin trimer EEC with a MW of 866.
Other Polyphenols
Peak 12, with a pseudomolecular ion at m/z: 149.0971, was identified as carvacrol (C10H13O−).
Unknown
Peaks 10 and 11 remain unidentified.
3.1.3. Identification of Metabolites in the Ethyl Acetate Extract of Flowers
Twenty-seven compounds were detected, and 21 compounds were tentatively identified in the ethyl acetate extract (EtOAcE) of E. cordifolia flowers. Of these, 2 compounds are anthocyanins (21 and 23), 10 are flavonoids (5, 10, 13, 14, 15, 16, 17, 18, 19, 27), 5 are phenolic acids (1, 2, 7, 8 and 24), 2 are procyanidins (6, 12), and 2 are polyphenol (4 and 26). Finally, six unidentified compounds (3, 9, 11, 20, 22, and 25) were observed (Table 3, Supplementary Materials, Figure S3).
Table 3.
Identification of metabolites in the EtOAc extract of flowers.
Anthocyanin
Peak 21 exhibited a molecular ion [M + H]+ with m/z: 578.1355 and produced a major fragment at m/z: 271.8189 that may correspond to pelargonidin; this compound could be tentatively identified as Pelargonidin-3-O-beta-D-p-coumaroylglucoside (C30H26O12+). Peak 23, with a pseudomolecular ion at m/z: 624.1455, was identified as Petunidin 3-O-(6-p-coumaroyl-glucoside) (C31H29O14+).
Flavonoids
Peak 5, with a [M−H]− ion at m/z: 289.0717, was identified as (-)-catechin (C15H13O6−); peak 10, showing a pseudomolecular ion at m/z: 447.1039, was identified as the isorhamnetin 3-O-glucoside (C22H21O12−). Peaks 13–19 were identified as flavonol, flavononol, and flavone derivatives, respectively. Peak 13 showed a pseudomolecular ion at m/z: 449.1087 and was identified as the dihydroquercetin 3-O-rhamnoside (C21H21O11−). Peak 14 (m/z: 463.0881, [M−H]−) was consistent with the molecular formula (C21H19O12−), corresponding to quercetin 3-O-glucoside. Peak 15, with a parent ion at m/z: 433.0775, was identified as quercetin 3-O-pentoside (C20H17O11−). Peak 16 produced a molecular ion at m/z 447.0929 and MSn ions at m/z 300.7869 (M-rhamnose), and was identified as quercetin 3-O-rhamnoside (C21H19O11−). Peak 17, with a [M−H]− ion at m/z 315.0507, was tentatively identified as isorhamnetin (C16H11O7−). Peaks 18 and 19 were identified as kaempferol derivatives. Peak 18 produced a molecular ion at m/z 417.0824 and a kaempferol MS2 fragment at m/z 283.7958, which pointed to the presence of kaempferol 3-O-arabinoside (C20H17O10−). Peak 19, with a pseudomolecular ion at m/z 431.0986, which in turn produced a kaempferol ion at m/z 284.8083 (M-hexose), was proposed to be an O-glycosylated kaempferol derivative (kaempferol 3-O-rhamnoside). Finally, peak 27 was identified as eupatorin (C18H15O7−).
Phenolic Acids
Peak 1 was identified as 3-feruloylquinic acid (C17H19O9−), peak 2 as galloyl glucose (C13H15O10−), peak 7 as ferulic acid 4-O-glucoside (C16H19O9−), peak 8 as 5-p-coumaroylquinic acid (C16H17O8−), and peak 24, with pseudomolecular ions at m/z: 167.0350, was identified as vanillic acid (C8H7O4−).
Procyanidins
Peak 6 showed a deprotonated molecule at m/z 865.1995 and was identified as an isomer of a procyanidin trimer EEC with a MW of 866. Peak 12, with a [M−H]− ion at m/z: 591.1508, was identified as Bis-8,8-Catechinylmethane (C31H27O12−).
Other Polyphenols
Peak 4 was identified as resorcinol (C6H5O2−) and peak 26, with a pseudomolecular ion at m/z: 149.0971, was identified as carvacrol (C10H13O−).
Unknown
Peaks 3, 9, 11, 20, 22, and 25 remain unidentified.
3.1.4. Identification of Metabolites in the Methanolic Extract of Flowers
Twenty-six compounds were detected, and 23 compounds were tentatively identified in the methanolic extract (MeOHE) of E. cordifolia flowers. Of these, 3 are anthocyanins’ compounds (18, 20, and 22), 13 are flavonoids (3, 9, 10, 11, 12, 13, 14, 15, 16, 21, 23, 24, 26), 4 are phenolic acids (1, 4, 6, 7), 2 are polyphenols (2, 19), and one is a procyanidin (5). Finally, three compounds remained unidentified (8, 17, and 25) (Table 4, Supplementary Materials, Figure S4).
Table 4.
Identification of metabolites in the MeOH extract of flowers.
Anthocyanin
Peak 18, with a pseudomolecular ion at m/z: 610.1299, was identified as delphinidin 3-O-(6-p-coumaroyl-glucoside) (C30H26O14−). Peak 20 exhibited a molecular ion at M+H+ with m/z: 578.1359 and produced a major fragment with m/z: 270.8202 that may correspond to pelargonidin; this compound could be tentatively identified as Pelargonidin-3-O-beta-D-p-coumaroylglucoside (C30H26O12+). Peak 22, showing a pseudomolecular ion at m/z: 625.1455, was identified as petunidin 3-O-(6-p-coumaroyl-glucoside) (C31H29O14+).
Flavonoids
Peak 3, with a [M−H]− ion at m/z: 289.0717, was identified as (-)-catechin (C15H13O6−). Peaks 9 and 10 were identified as dihydroquercetin derivatives. Peak 9 produced a molecular ion at m/z 449.1087, which pointed to the presence of dihydroquercetin 3-O-rhamnoside (C21H21O11−). Peak 10, with a pseudomolecular ion at m/z 465.1039, which in turn produced a dihydroquercetin ion at m/z 301.7841 (M-hexose), was proposed to be an O-glycosylated dihydroquercetin derivative (Dihydroquercetin 3-O-glucoside). Peaks 11–13 were identified as flavonol derivatives. Peak 11, with a parent ion at m/z: 463.0881, was identified as quercetin 3-O-glucoside (C21H19O12−); peak 12 showed a pseudomolecular ion at m/z: 433.0775 and was tentatively identified as quercetin 3-O-pentoside (C20H17O11−); and peak 13 produced a molecular ion at m/z 447.0929 and MSn ions at m/z 300.7869 (M-rhamnose), and was identified as quercetin 3-O-rhamnoside (C21H19O11−). Peak 14, with a [M−H]− ion at m/z 315.0509, was identified as isorhamnetin (C16H11O7−). Peaks 15 and 16 were identified as kaempferol derivatives. Peak 15 produced a molecular ion at m/z 477.1036 and was identified as isorhamnetin 3-O-glucoside (C22H21O12−). Peak 16, with a pseudomolecular ion at m/z 431.0986, which in turn produced a kaempferol ion at m/z 284.8083 (M-hexose), was proposed to be an O-glycosylated kaempferol derivative (kaempferol 3-O-rhamnoside, C21H19O10−). Finally, peaks 21 and 24 were identified as the flavanone aglycones naringenin and pinocembrin, while peaks 23 and 26 were identified as the flavone aglycones apigenin and eupatorin, respectively. MS-MS analysis of all of these compounds showed characteristic daughter ions (Table 4).
Phenolic Acids
Peak 4 was identified as ferulic acid 4-O-glucoside (C16H19O9−), peak 6 as 5-p-coumaroylquinic acid (C16H17O8−), and peak 7 as p-coumaric acid (C9H7O3-). Additionally, peak 1 was identified as gallic acid (C7H5O5−).
Procyanidins
Peak 5, with a [M−H]− ion at m/z: 591.1508, was identified as Bis-8,8-Catechinylmethane (C31H27O12−).
Other Polyphenols
Peak 2 was identified as resorcinol (C6H5O2−) and peak 19 as homovanillyl alcohol (C9H11O3−).
Unknown
Peaks 8, 17, and 25 remain unidentified.
3.1.5. Identification of Metabolites in the Honey Extract
The three samples that were evaluated contained between 75% and 77% E. cordifolia pollen grains. According to the Codex Alimentarius [33], the ulmo honey in this study has a high quality, with a pH of 4.5, a water content of 19.3%, a reducing sugar content of 81.3%, and a relatively high diastase activity of 23.1 units according to Schade. Twenty-four compounds were detected, and 22 compounds were tentatively identified in the honey extract. Of these, 4 are polyphenolic compounds (1, 2, 8, 9), 15 are flavonoids (3, 4, 5, 7, 10, 12, 13, 14, 15, 17, 18, 19, 20, 22, 24), 2 are coumarins (6, 16), and 1 is an anthocyanin (21). Finally, two compounds remained unidentified (11 and 23) (Table 5, Supplementary Materials, Figure S5).
Table 5.
Identification of metabolites in the honey extract.
Anthocyanin
Peak 21 showed a molecular ion at M+H+ with m/z 595.1297 and produced a major fragment with m/z 286.8026 (cyanidin) and was identified as cyanidin 3-(p-coumaroyl)-glucoside (C30H26O13+).
Coumarin
Peak 6, with a pseudomolecular ion at m/z: 177.0558, was identified as mellein (C10H9O3−), and peak 16, with a pseudo-molecular ion at m/z: 161.0245, was identified as umbelliferone (C9H5O3−).
Flavonoids
Peak 3, with a M−H− ion at m/z: 625.1413, was identified as myricetin 3-O-rutinoside (C27H29O17−), and peaks 4–5 were identified as quercetin 3-O-rutinoside (C27H29O16−) and dihydroquercetin 3-O-rhamnoside (C21H21O11−). Peak 7, with a [M−H]− ion at m/z 447.0920 and MS2 ions at m/z 300.7859 (M-rhamnose), was tentatively identified as quercetin 3-O-rhamnoside (C21H19O11−), while peak 10 was assigned to quercetin (C16H11O4−). Peaks 12–15 were identified as formononetin (C16H11O4−), isorhamnetin (C16H11O7−), naringenin (C15H11O5−), and kaempferide (C16H11O6−), respectively. Peaks 17–18 were assigned to flavone cirsimaritin (C17H13O6−) and 3,7-dimethylquercetin (C17H13O7−), while peak 19 was assigned to flavanone pinocembrin (C15H11O4−) and peak 20 to daidzein (C15H9O4−). Finally, peak 22 was assigned to flavone apigenin (C15H9O5−) and peak 24 was identified as eupatorin (C18H15O7−), respectively.
Other Polyphenols
Peak 1 was identified as p-anisaldehyde (C8H7O2−) and peak 2 as syringaldehyde (C9H9O4−). Peaks 8–9 were assigned to eugenol (C10H11O2−) and homovanillyl alcohol (C9H11O3−), respectively.
Unknown
Peaks 11 and 23 remain unidentified.
3.2. Quantification of Phenolic Compounds
Phenolic acids and flavonoids are key contributors to the color, aroma, flavor, and health benefits of honey. As shown in Table 6, 22 phenolic standards were employed to quantify their presence in fractions and extracts obtained from the leaves, flowers, and honey of ulmo.
Table 6.
Quantitation of compounds in E. cordifolia ethyl acetate, aqueous fraction, and methanolic extract of honey (mg/kg).
The results in Table 6 show significant differences (p < 0.05) in the concentrations of phenolic and flavonoid compounds among the E. cordifolia extracts and ulmo honey samples. Statistical analysis using one-way ANOVA followed by Tukey’s test revealed that the methanolic extract of flowers had the highest concentration of gallic acid (1378.69 ± 0.38 mg/kg), which was significantly higher than all other fractions/extracts and honey samples that were analyzed. In contrast, in ulmo honey, the concentration of this compound ranged from 3.72 ± 0.16 mg/kg to 32.80 ± 0.20 mg/kg, suggesting a possible transfer from the plant to the honey in lower proportions. Pinocembrin was one of the most abundant flavonoids in the ulmo honey, with sample UH056 showing the highest concentration (1196.53 ± 0.24 mg/kg), followed by sample UH057 (231.44 ± 0.09 mg/kg). These differences were statistically significant (p < 0.05) and suggest variability in the chemical composition of the honey, which is possibly influenced by environmental and floral factors. In the plant extracts, pinocembrin was found at a higher concentration in the methanolic extract of the flowers (123.24 ± 0.15 mg/kg), supporting its potential botanical origin in E. cordifolia. Other compounds, such as isorhamnetin and quercetin, also showed significant differences among the samples. Isorhamnetin was found at higher concentrations in the leaf fractions (42.55 ± 0.06 mg/kg) compared to the honey, where it ranged from 1.16 ± 0.02 to 2.89 ± 0.02 mg/kg. Meanwhile, quercetin was more abundant in the methanolic extract of the flowers (3.57 ± 0.02 mg/kg) and was detected only in low concentrations in the honey samples (≤0.06 mg/kg). Overall, the variability in the concentration of these compounds suggests that, while some metabolites are transferred from E. cordifolia to honey, the proportion will be significantly lower, possibly due to degradation processes or chemical modifications during honey production. Taken together, these results indicate that pinocembrin and gallic acid can be considered the main chemical markers of ulmo honey, while isorhamnetin may complement their characterization. Notably, the leaves of E. cordifolia were found to be a rich source of polyphenolic compounds, underscoring their potential influence on the chemical profile and antioxidant properties of ulmo honey. This highlights the importance of considering not only the floral nectar but also other plant parts when evaluating the bioactive composition of honey. However, further studies are needed to assess their stability and specificity in larger samples of E. cordifolia honey.
3.3. Antioxidant Activity and Total Phenolic Content
The fractions and extracts of leaves and flowers were evaluated in vitro to determine their antioxidant activity using the DPPH, ABTS, and FRAP methods and are expressed as µmol Trolox/g of dry extract (Table 7). In addition, the total phenolics content was determined by the Folin–Ciocalteau method. Our results showed that the EtOAc and aqueous leaf fractions were more potent antioxidants than the EtOAc and MeOH extracts of E. cordifolia flowers. On the other hand, the ulmo 056 honey (UH056) showed the highest TPC value (58 mg GAE/100 g honey), while the ulmo 057 (UH057) honey presented the lowest TPC value (35 mg GAE/100 g honey). The values of antioxidant capacity, evaluated by the DPPH, ABTS, and FRAP methods, were between 94 (UH055) and 187 μmol TE/g ulmo honey (UH057) for DPPH, between 75 (UH055) and 122 μmol TE/g UH (UH057) for ABTS, and between 0.23 (UH056) and 0.59 0 mmol Fe/g UH (UH057) for FRAP. The results show statistically significant differences (p < 0.05) among the leaf fractions, flower extracts, and honey samples in terms of their antioxidant capacity and total phenolic content. Analysis of variance (ANOVA), followed by Tukey’s test, confirmed that the flower extracts, particularly those obtained with methanol, exhibited the highest antioxidant activity in the DPPH and ABTS assays, with significantly higher values than the leaf fractions and honey samples. Similarly, the total phenolic content of the flower extracts was significantly higher compared to that of the honey (p < 0.05), suggesting a greater concentration of bioactive compounds in the plant. Among the honey samples that were analyzed, sample UH057 showed the highest antioxidant capacity, significantly differing from the other honey samples (UH55 and UH056). These differences suggest that the chemical composition of ulmo honey may be influenced by environmental and floral factors, highlighting the need for further studies to correlate the presence of specific metabolites with its botanical origin and biological functionality.
Table 7.
Content of phenols and antioxidant activity of the different extracts of E. cordifolia.
4. Discussion
Honey has been consumed by humans since ancient times, mainly due to its high nutritional and medicinal values. In addition, honey is a mixture of hundreds of compounds that are found in very low concentrations, e.g., polyphenols, which give the different varieties of honey different colors, smells, flavors, and bioactivities. According to their geographical origin and floral source, the trace compound composition of honey differs considerably [35]. In this sense, it is necessary to identify chemical markers that can serve to distinguish the individual characteristics of honey.
A metabolomic study is a qualitative and quantitative analytical approach to detecting metabolites in different biological samples. The use of targeted metabolomics for quantitative analysis provides comprehensive information on biological samples. While previous studies have reported the presence of both volatile and non-volatile/semi-volatile compounds in ulmo honey, no studies have examined the chemical composition of its floral source. This study represents the first metabolomic profiling of E. cordifolia, providing extensive and detailed identification of the compounds present in its flowers, leaves, and honey.
Using the established methods, the honey extract and the fractions and extracts of leaves and flowers of E. cordifolia were analyzed by UHPLC-Q-TOF-MS. Analysis by LC-MS resulted in 24 tentative compound identifications in the honey, 22 in the leaf fractions, and 37 in the flower extracts of E. cordifolia. The Venn diagram in Figure 2 compares the metabolic profiles of these samples, revealing 10 compounds shared between the plant parts and the honey, among which 5 were common to both the leaves and flowers. These shared compounds were further scrutinized to identify potential botanical origin markers. Among the six candidate compounds that were present in the leaves, five were successfully identified through exact mass and high-resolution MS2 fragmentation patterns, compared with chromatographic data and [M−H]− data reported in the literature, as dihydroquercetin 3-O-rhamnoside, quercetin 3-O-rhamnoside, isorhamnetin, cyanidin 3-(p-coumaroyl)-glucoside, and eupatorin. On the other hand, nine were found to be common in flowers and honey, of which five were also shared with the leaves, as mentioned above. The remaining four compounds were identified as homovanillyl alcohol, naringenin, apigenin, and pinocembrin. Due to the shared presence of these compounds in both the plant parts and ulmo honey, and their absence in other honeys produced in the same region, the compounds dihydroquercetin 3-O-rhamnoside (astilbin), quercetin 3-O-rhamnoside (quercitrin), isorhamnetin, and eupatorin are potential candidates as chemical markers for ulmo honey (E. cordifolia).
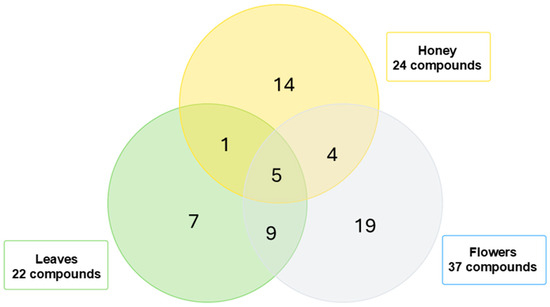
Figure 2.
Venn diagram illustrating the shared and unique metabolites identified in the leaves, flowers, and honey of Eucryphia cordifolia through metabolomic analysis.
The five flavonoids quercitrin, astilbin, isorharmnetin, cyanidin 3-(p-coumaroyl)-glucoside, and eupatorin are present in the ulmo honey analyzed herein and have not been reported to be simultaneously present in any type of Chilean honey to date.
On the other hand, the identification of quercitrin and astilbine in honey agrees with their reported isolation from the leaves of E. cordifolia [10]. As an additional contribution to the research, a set of phenolic compounds was quantified in the honey and flowers of E. cordifolia, along with an analysis of its leaves. This complementary analysis provided a broader perspective on the chemical composition of the species, exploring the potential transfer of metabolites from the plant to its honey. Although the primary objective of this study was to obtain a metabolomic profile of the honey of E. cordifolia and its relationship with the compounds present in the plant, the evaluation of phenolic compounds in the leaves offered valuable insights into the chemical variability of the species and its potential influence on the honey produced from its nectar. The identification of isorhamnetin by UPLC-MS/MS validated the findings obtained through UHPLC/Q-TOF-MS, providing additional confirmation that the presence of these compounds in honey originates from the E. cordifolia species.
The results in Table 6 highlight the variability in the composition of phenolic compounds of E. cordifolia extracts and the different honeys analyzed. Compounds such as gallic acid and pinocembrin were found at significantly higher concentrations in the ulmo honeys, particularly in sample UH056, which contained 1196.53 mg/kg of pinocembrin, suggesting the potential of this compound as a distinctive chemical marker for this variety. In contrast, compounds such as quercetin and ferulic acid were present in lower but still detectable concentrations, indicating their contribution to the unique chemical profile of each sample. This variability reflects the influence of the botanical and geographical origins of honey on its chemical composition and underscores the value of metabolomic analysis for their characterization. Previously, gallic acid, caffeic acid, coumaric acid, pinocembrin, chrysin, quercetin, abscisic acid, luteolin, and apigenin have been detected in E. cordifolia honey [6]. It is important to highlight that the polyphenols identified in ulmo honey have biological activity. For example, gallic acid has been reported to have antimicrobial, anticancer, and antiviral activities. Pinocembrin is a characteristic flavonoid of propolis and has been previously detected in honey from E. cordifolia [6] and European honey samples [36]. In addition, pinocembrin has shown anti-inflammatory, anti-asthmatic, and antitumor activities [37]. Similarly, isorhamnetin exerts beneficial effects in the areas of cardiovascular and cerebrovascular protection, antitumor activity, anti-inflammatory action, antioxidant properties, organ protection, obesity prevention, etc. Table 7 demonstrates that both E. cordifolia fractions and honeys analyzed herein exhibit antioxidant activity, which is closely correlated with their total phenol content [38]. The ethyl acetate and methanolic extracts of E. cordifolia flowers stood out for their high antioxidant activity, particularly in the DPPH and ABTS assays, with values ranging from 240.79 to 279.46 µmol TE/g DE in the DPPH and from 182.73 to 185.25 µmol TE/g DE in the ABTS assay, respectively. Meanwhile, the ulmo honeys exhibited moderate antioxidant activity, with sample UH057 showing superior performance in the DPPH and ABTS assays, which is potentially attributable to its higher content of bioactive compounds such as pinocembrin. These findings highlight the significance of phenolic compounds in determining the bioactivity of honeys and extracts, emphasizing their functional potential and their role in differentiating bee products.
5. Conclusions
This study contributes to the understanding of the metabolomics of the Eucryphia cordifolia plant, an endemic species of Chile. Chilean ulmo is an important source of monofloral honey with antioxidant properties. The three samples analyzed in this study feature various molecules from different plant parts and honey, including 22 compounds from the leaf fractions, 37 from the flower extracts, and 24 in the respective honeys of E. cordifolia. By examining and comparing the chemical profiles of ulmo honey and flowers using untargeted metabolomics, we report for the first time that dihydroquercetin 3-O-rhamnoside (astilbine), quercetin 3-O-rhamnoside (quercitrin), isorharmnetin, cyanidin 3-(p-coumaroyl)-glucoside, and eupatorin could serve as chemical markers. Notably, the leaves of E. cordifolia displayed a diverse and bioactive metabolomic profile, contributing significantly to the species’ overall chemical composition. Their rich contents of flavonoids, phenolic acids, and anthocyanins suggest that they may play an indirect but relevant role in the antioxidant potential of ulmo honey. These compounds could potentially act as chemical markers of floral origin for the honey of this species; however, a larger number of honey samples should be analyzed to determine a correlation between the compounds existing in the plant parts and honey of E. cordifolia.
Supplementary Materials
The following supporting information can be downloaded at: https://www.mdpi.com/article/10.3390/antiox14030292/s1. Figure S1: Total ionic current chromatogram (TIC) in EtOAc fraction of E. cordifolia leaves. Figure S2: Total ionic current chromatogram (TIC) in the aqueous fraction of E. cordifolia leaves. Figure S3: Total ionic current chromatogram (TIC) in EtOAc extract of flowers of E. cordifolia leaves. Figure S4: Total ionic current chromatogram (TIC) in MeOH extract of flowers of E. cordifolia leaves. Figure S5: Total ionic current chromatogram (TIC) in honey extract: UH055 (a), UH056 (b) and UH057 (c).
Author Contributions
Conceptualization, R.V. and F.C.Z.; methodology, R.V., A.G., G.M. and F.C.Z.; formal analysis, M.J.S. and R.V.; resources, R.V., A.G. and F.C.Z.; writing—original draft preparation, R.V. and F.C.Z.; writing—review and editing, R.V., A.G., G.M., M.J.S. and F.C.Z.; supervision and project administration, A.G. and F.C.Z. All authors have read and agreed to the published version of the manuscript.
Funding
The authors thank for financial support to FONDEQUIP under Grant EQM160042 and Gobierno Regional Metropolitano de Santiago Project FIC-R 2019-BIP 40026817-0. M.J.S acknowledge Fondecyt 1220075.
Institutional Review Board Statement
Not applicable.
Informed Consent Statement
Not applicable.
Data Availability Statement
Raw HPLC MS data is available upon request.
Acknowledgments
RV is thankful to Secretaría de Educación Superior, Ciencia, Tecnología e Innovación, Ecuador. We also want to thank Lars Ratjen for the English revision of this manuscript.
Conflicts of Interest
The authors declare no conflicts of interest.
References
- Inoue, K.; Murayama, S.; Seshimo, F.; Takeba, K.; Yoshimura, Y.; Nakazawa, H. Identification of Phenolic Compound in Manuka Honey as Specific Superoxide Anion Radical Scavenger Using Electron Spin Resonance (ESR) and Liquid Chromatography with Coulometric Array Detection. J. Sci. Food Agric. 2005, 85, 872–878. [Google Scholar] [CrossRef]
- Abd-El Aal, A.M.; El-Hadidy, M.R.; El-Mashad, N.B.; El-Sebaie, A.H. Antimicrobial Effect of Bee Honey in Comparison to Antibiotics on Organisms Isolated from Infected Burns. Ann. Burn. Fire Disasters 2007, 20, 83–88. [Google Scholar]
- Lobos, O.; Pávez, A. (Eds.) Apicultura En El Territorio Patagonia Verde, Región de Los Lagos [En Línea]; Boletín INIA—Instituto de Investigaciones Agropecuarias: Osorno, Chile, 2021; Volume 442. [Google Scholar]
- Acevedo, F.; Torres, P.; Oomah, B.D.; de Alencar, S.M.; Massarioli, A.P.; Martín-Venegas, R.; Albarral-Ávila, V.; Burgos-Díaz, C.; Ferrer, R.; Rubilar, M. Volatile and Non-Volatile/Semi-Volatile Compounds and in Vitro Bioactive Properties of Chilean Ulmo (Eucryphia cordifolia Cav.) Honey. Food Res. Int. 2017, 94, 20–28. [Google Scholar] [CrossRef] [PubMed]
- Viteri, R.; Giordano, A.; Montenegro, G.; Zacconi, F. Eucryphia cordifolia Extracts: Phytochemical Screening, Antibacterial and Antioxidant Activities. Nat. Prod. Res. 2022, 36, 4177–4181. [Google Scholar] [CrossRef]
- Velásquez, P.; Montenegro, G.; Leyton, F.; Ascar, L.; Ramirez, O.; Giordano, A. Bioactive Compounds and Antibacterial Properties of Monofloral Ulmo Honey. CyTA-J. Food 2020, 18, 11–19. [Google Scholar] [CrossRef]
- Bate-Smith, E.C.; Davenport, S.M.; Harborne, J.B. Comparative Biochemistry of Flavonoids-III. Phytochemistry 1967, 6, 1407–1413. [Google Scholar] [CrossRef]
- Tschesche, R.; Delhvi, S.; Sepulveda, S.; Breitmaier, E. Eucryphin, a New Chromone Rhamnoside from the Bark of Eucryphia cordifolia. Phytochemistry 1979, 18, 867–869. [Google Scholar] [CrossRef]
- Sepulveda-Boza, S.; Delhvi, S.; Cassels, B.K. Flavonoids from the Twigs of Eucryphia Glutinosa. Phytochemistry 1993, 32, 1301–1303. [Google Scholar] [CrossRef]
- Viteri, R.; Giordano, A.; Montenegro, G.; Zacconi, F.C. Flavonoids and Triterpenes Isolated from Eucryphia cordifolia (Cunoniaceae). Biochem. Syst. Ecol. 2022, 104, 104476. [Google Scholar] [CrossRef]
- Fuica-Carrasco, C.; Olivares-Caro, L.; Parra-Sepúlveda, C.; Pérez, A.J.; Mardones, C.; García-Cancino, A.; Hernández, V. Assessing Chemical Composition and Biological Activity in Eucryphia cordifolia Cav. (Cunoniaceae): A Study Applying the Ecological Niche Centrality Hypothesis. Food Biosci. 2024, 62, 104990. [Google Scholar] [CrossRef]
- Giordano, A.; Retamal, M.; Fuentes, E.; Ascar, L.; Velásquez, P.; Rodríguez, K.; Montenegro, G. Rapid Scanning of the Origin and Antioxidant Potential of Chilean Native Honey Through Infrared Spectroscopy and Chemometrics. Food Anal. Methods 2019, 12, 1511–1519. [Google Scholar] [CrossRef]
- Montenegro, G.; Gómez, M.; Casaubon, G.; Belancic, A.; Mujica, A.M.; Peña, R.C. Analysis of Volatile Compounds in Three Unifloral Native Chilean Honeys. Phyton 2009, 78, 61–65. [Google Scholar] [CrossRef]
- AOAC. Official Method of Analysis, 18th ed.; Association of Official Analytical Chemists (AOAC): Gaithersburgs, MD, USA, 2006. [Google Scholar]
- Zhao, L.; Ren, C.; Xue, X.; Lu, H.; Wang, K.; Wu, L. Safflomin A: A Novel Chemical Marker for Carthamus tinctorius L. (Safflower) Monofloral Honey. Food Chem. 2022, 366, 130584. [Google Scholar] [CrossRef] [PubMed]
- Thaipong, K.; Boonprakob, U.; Crosby, K.; Cisneros-Zevallos, L.; Hawkins Byrne, D. Comparison of ABTS, DPPH, FRAP, and ORAC Assays for Estimating Antioxidant Activity from Guava Fruit Extracts. J. Food Compos. Anal. 2006, 19, 669–675. [Google Scholar] [CrossRef]
- van den Berg, R.; Haenen, G.R.M.M.; van den Berg, H.; Bast, A. Applicability of an Improved Trolox Equivalent Antioxidant Capacity (TEAC) Assay for Evaluation of Antioxidant Capacity Measurements of Mixtures. Food Chem. 1999, 66, 511–517. [Google Scholar] [CrossRef]
- Ghareeb, M.A.; Mohamed, T.; Saad, A.M.; Refahy, L.A.-G.; Sobeh, M.; Wink, M. HPLC-DAD-ESI-MS/MS Analysis of Fruits from Firmiana simplex (L.) and Evaluation of Their Antioxidant and Antigenotoxic Properties. J. Pharm. Pharmacol. 2017, 70, 133–142. [Google Scholar] [CrossRef]
- Engels, C.; Gänzle, M.G.; Schieber, A. Fast LC–MS Analysis of Gallotannins from Mango (Mangifera indica L.) Kernels and Effects of Methanolysis on Their Antibacterial Activity and Iron Binding Capacity. Food Res. Int. 2012, 45, 422–426. [Google Scholar] [CrossRef]
- Barreto, J.C.; Trevisan, M.T.S.; Hull, W.E.; Erben, G.; de Brito, E.S.; Pfundstein, B.; Würtele, G.; Spiegelhalder, B.; Owen, R.W. Characterization and Quantitation of Polyphenolic Compounds in Bark, Kernel, Leaves, and Peel of Mango (Mangifera indica L.). J. Agric. Food Chem. 2008, 56, 5599–5610. [Google Scholar] [CrossRef] [PubMed]
- García-Salas, P.; Gómez-Caravaca, A.M.; Arráez-Román, D.; Segura-Carretero, A.; Guerra-Hernández, E.; García-Villanova, B.; Fernández-Gutiérrez, A. Influence of Technological Processes on Phenolic Compounds, Organic Acids, Furanic Derivatives, and Antioxidant Activity of Whole-Lemon Powder. Food Chem. 2013, 141, 869–878. [Google Scholar] [CrossRef] [PubMed]
- Schieber, A.; Berardini, N.; Carle, R. Identification of Flavonol and Xanthone Glycosides from Mango (Mangifera indica L. Cv. “Tommy Atkins”) Peels by High-Performance Liquid Chromatography-Electrospray Ionization Mass Spectrometry. J. Agric. Food Chem. 2003, 51, 5006–5011. [Google Scholar] [CrossRef]
- Huang, Z.-Q.; Chen, P.; Su, W.-W.; Wang, Y.-G.; Wu, H.; Peng, W.; Li, P.-B. Antioxidant Activity and Hepatoprotective Potential of Quercetin 7-Rhamnoside In Vitro and In Vivo. Molecules 2018, 23, 1188. [Google Scholar] [CrossRef] [PubMed]
- Thuy, N.M.; Minh, V.Q.; Ben, T.C.; Thi Nguyen, M.T.; Ha, H.T.N.; Tai, N. Van Identification of Anthocyanin Compounds in Butterfly Pea Flowers (Clitoria ternatea L.) by Ultra Performance Liquid Chromatography/Ultraviolet Coupled to Mass Spectrometry. Molecules 2021, 26, 4539. [Google Scholar] [CrossRef] [PubMed]
- Rivera-Chávez, J.; Bustos-Brito, C.; Aguilar-Ramírez, E.; Martínez-Otero, D.; Rosales-Vázquez, L.D.; Dorazco-González, A.; Cano-Sánchez, P. Hydroxy-Neo-Clerodanes and 5,10-Seco-Neo-Clerodanes from Salvia Decora. J. Nat. Prod. 2020, 83, 2212–2220. [Google Scholar] [CrossRef] [PubMed]
- Mieres-Castro, D.; Schmeda-Hirschmann, G.; Theoduloz, C.; Gómez-Alonso, S.; Pérez-Navarro, J.; Márquez, K.; Jiménez-Aspee, F. Antioxidant Activity and the Isolation of Polyphenols and New Iridoids from Chilean Gaultheria phillyreifolia and G. poeppigii Berries. Food Chem. 2019, 291, 167–179. [Google Scholar] [CrossRef] [PubMed]
- Du, J.; Zhong, B.; Subbiah, V.; Barrow, C.; Dunshea, F.; Suleria, H. LC-ESI-QTOF-MS/MS Profiling and Antioxidant Activity of Phenolics from Custard Apple Fruit and By-Products. Separations 2021, 8, 62. [Google Scholar] [CrossRef]
- Liu, W.; Kong, Y.; Zu, Y.; Fu, Y.; Luo, M.; Zhang, L.; Li, J. Determination and Quantification of Active Phenolic Compounds in Pigeon Pea Leaves and Its Medicinal Product Using Liquid Chromatography–Tandem Mass Spectrometry. J. Chromatogr. A 2010, 1217, 4723–4731. [Google Scholar] [CrossRef]
- Ha, T.J.; Park, J.E.; Lee, K.-S.; Seo, W.D.; Song, S.-B.; Lee, M.-H.; Kim, S.; Kim, J.-I.; Oh, E.; Pae, S.-B.; et al. Identification of Anthocyanin Compositions in Black Seed Coated Korean Adzuki Bean (Vigna angularis) by NMR and UPLC-Q-Orbitrap-MS/MS and Screening for Their Antioxidant Properties Using Different Solvent Systems. Food Chem. 2021, 346, 128882. [Google Scholar] [CrossRef]
- Di Donna, L.; Taverna, D.; Mazzotti, F.; Benabdelkamel, H.; Attya, M.; Napoli, A.; Sindona, G. Comprehensive Assay of Flavanones in Citrus Juices and Beverages by UHPLC–ESI-MS/MS and Derivatization Chemistry. Food Chem. 2013, 141, 2328–2333. [Google Scholar] [CrossRef] [PubMed]
- Nandutu, A.M.; Clifford, M.; Howell, N.K. Analysis of Phenolic Compounds in Ugandan Sweet Potato Varieties (NSP, SPK AND TZ). Afr. J. Biochem. Res. 2007, 1, 29–36. [Google Scholar]
- Akimoto, N.; Ara, T.; Nakajima, D.; Suda, K.; Ikeda, C.; Takahashi, S.; Muneto, R.; Yamada, M.; Suzuki, H.; Shibata, D.; et al. FlavonoidSearch: A System for Comprehensive Flavonoid Annotation by Mass Spectrometry. Sci. Rep. 2017, 7, 1243. [Google Scholar] [CrossRef] [PubMed]
- CODEX STAN 12-1981; Normas Internacionales de los Alimentos. Norma para la Miel. CODEX ALIMENTARIUS: Rome, Italy, 2001.
- Lin, L.-Z.; Harnly, J.M. Identification of the Phenolic Components of Chrysanthemum Flower (Chrysanthemum morifolium Ramat). Food Chem. 2010, 120, 319–326. [Google Scholar] [CrossRef]
- Cebrero, G.; Sanhueza, O.; Pezoa, M.; Báez, M.E.; Martínez, J.; Báez, M.; Fuentes, E. Relationship among the Minor Constituents, Antibacterial Activity and Geographical Origin of Honey: A Multifactor Perspective. Food Chem. 2020, 315, 126296. [Google Scholar] [CrossRef] [PubMed]
- Tomás-Barberán, F.A.; Martos, I.; Ferreres, F.; Radovic, B.S.; Anklam, E. HPLC Flavonoid Profiles as Markers for the Botanical Origin of European Unifloral Honeys. J. Sci. Food Agric. 2001, 81, 485–496. [Google Scholar] [CrossRef]
- Cauich-Kumul, R.; Segura Campos, M.R. Bee Propolis. In Bioactive Compounds; Elsevier: Amsterdam, The Netherlands, 2019; pp. 227–243. [Google Scholar]
- Alotibi, I.A.; Harakeh, S.M.; Al-Mamary, M.; Mariod, A.A.; Al-Jaouni, S.K.; Al-Masaud, S.; Alharbi, M.G.; Al-Hindi, R.R. Floral Markers and Biological Activity of Saudi Honey. Saudi J. Biol. Sci. 2018, 25, 1369–1374. [Google Scholar] [CrossRef] [PubMed]

Disclaimer/Publisher’s Note: The statements, opinions and data contained in all publications are solely those of the individual author(s) and contributor(s) and not of MDPI and/or the editor(s). MDPI and/or the editor(s) disclaim responsibility for any injury to people or property resulting from any ideas, methods, instructions or products referred to in the content. |
© 2025 by the authors. Licensee MDPI, Basel, Switzerland. This article is an open access article distributed under the terms and conditions of the Creative Commons Attribution (CC BY) license (https://creativecommons.org/licenses/by/4.0/).