
Parietal Alpha Oscillations: Cognitive Load and Mental Toughness
 , , and
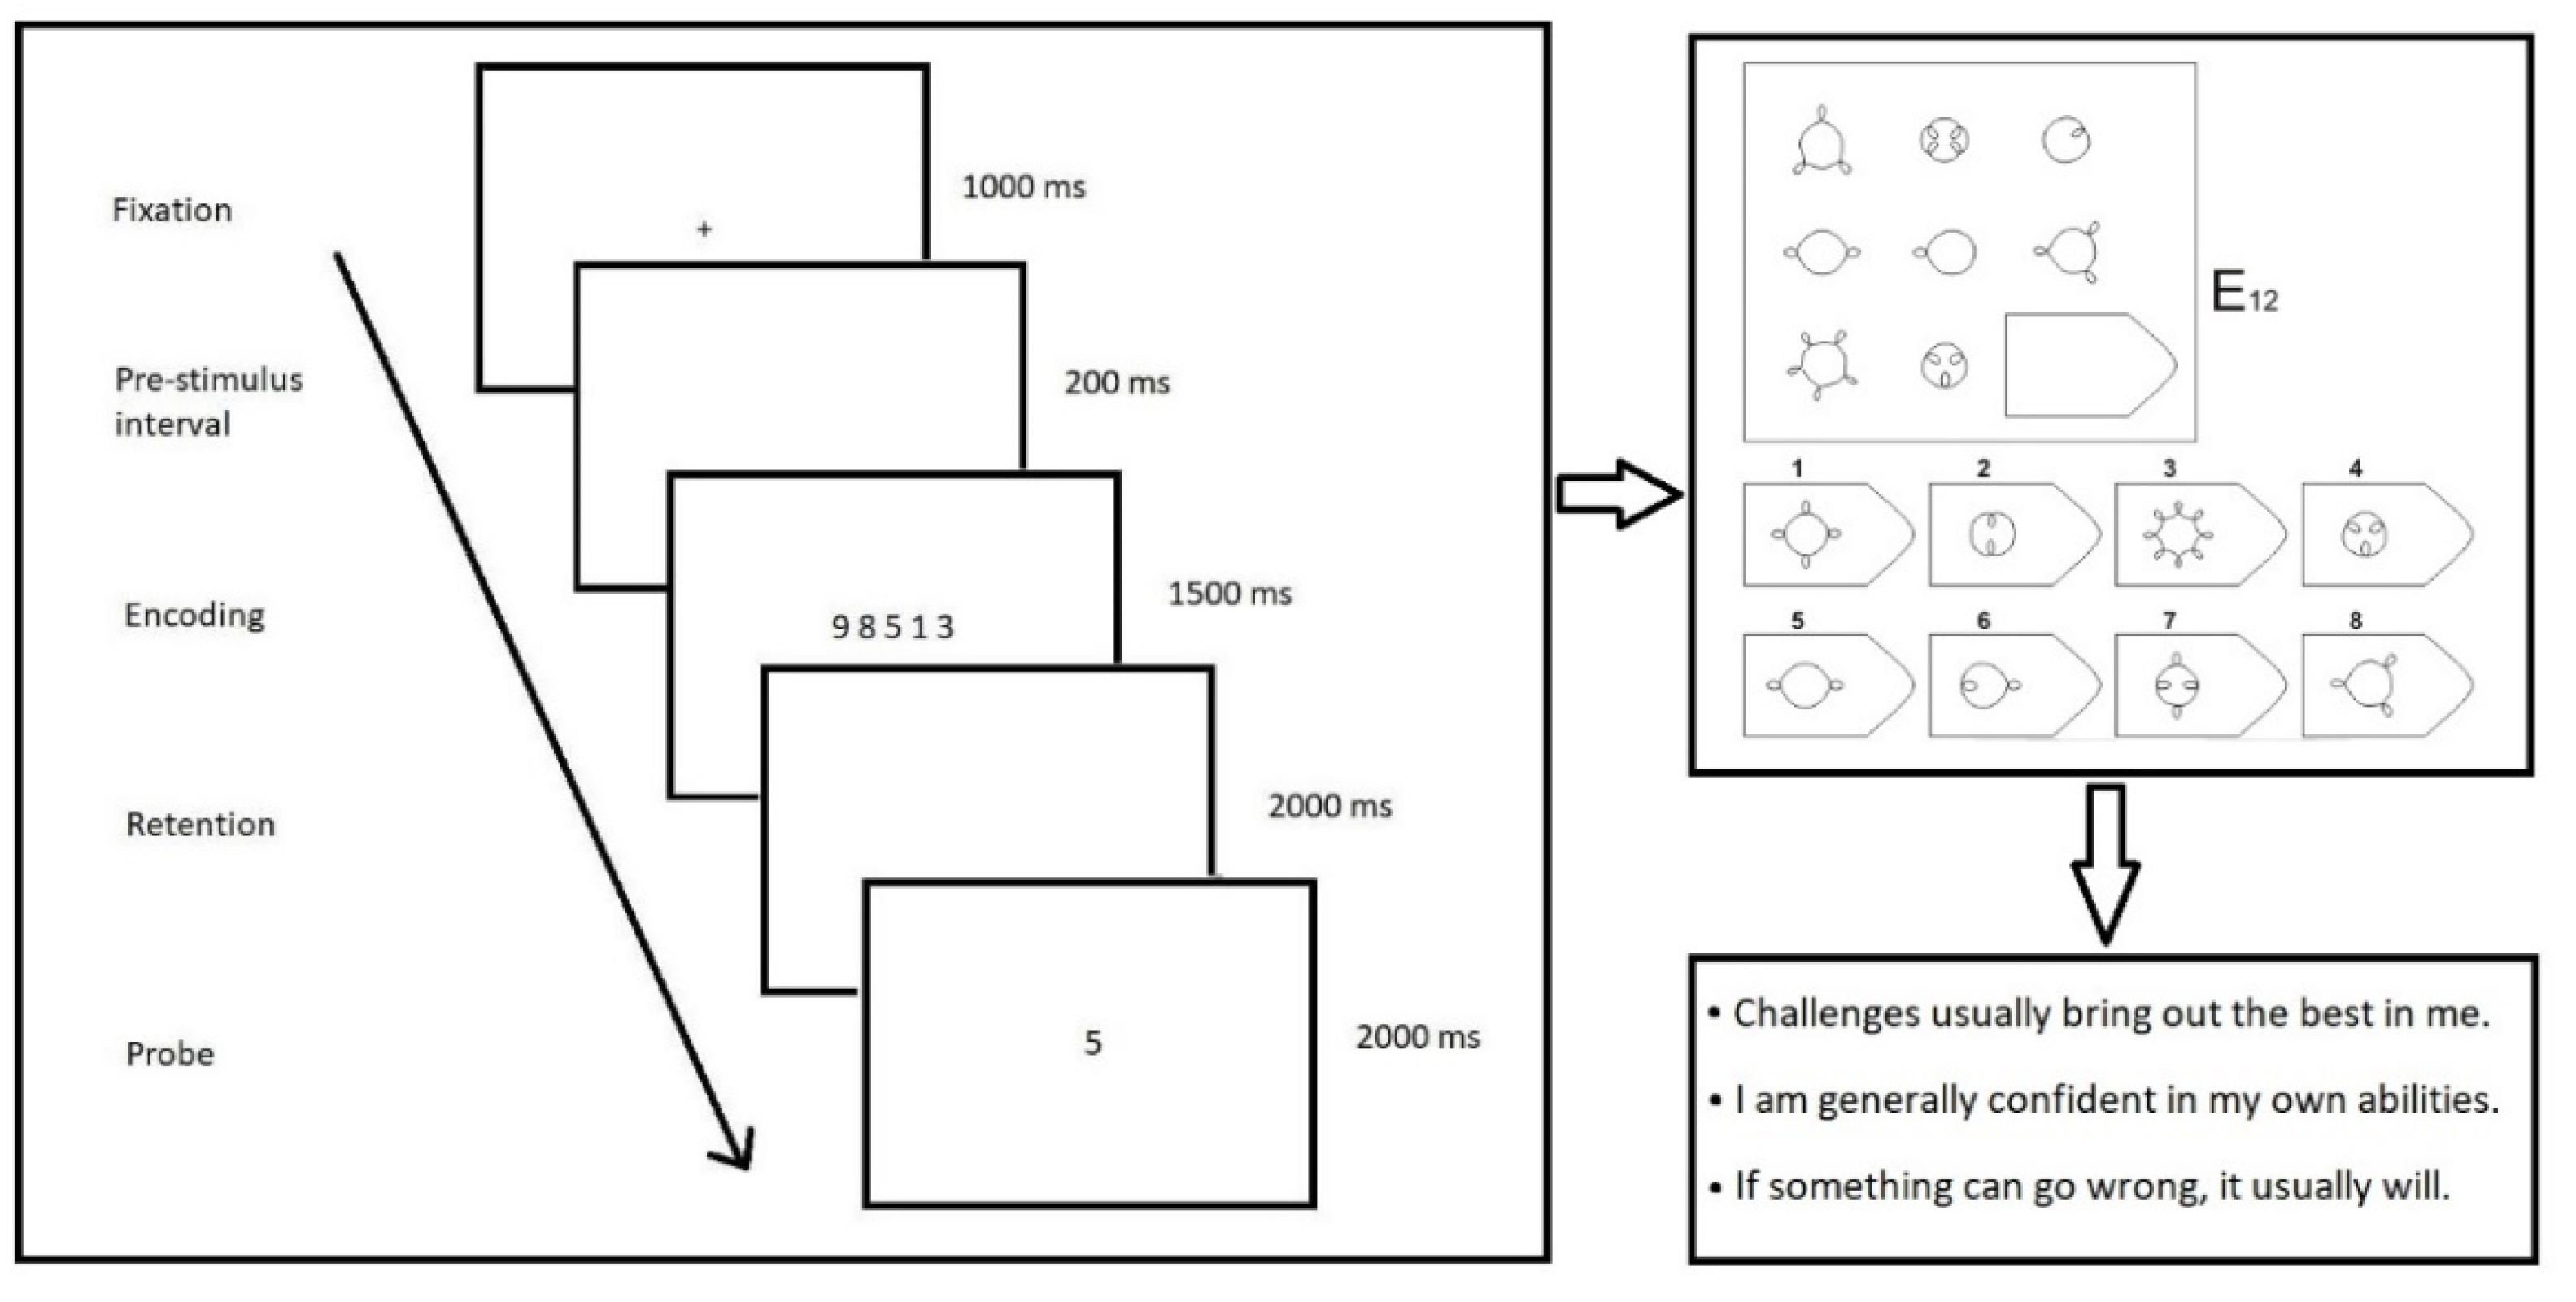
Abstract
:1. Introduction
2. Materials and Methods
2.1. Participants
2.2. Materials
2.3. EEG Equipment
2.4. Data Analysis
- ERD during encoding, ERS during retention, and ERD related to responding are related to task accuracy.
- A linear mixed effects model was fitted to test the effect of each EEG variable (e.g., ERD related to encoding) as a function of accuracy, using the following formula: a target variable—the EEG component, a predictor—accuracy (correct or error response), a random effect—participant ID. This random effect was used to control for individual differences in the EEG effect that can increase individual variability. The Wald z-statistic was used to test the coefficients of the model.
- For all subsequent analyses, only correct responses were selected.
- 2.
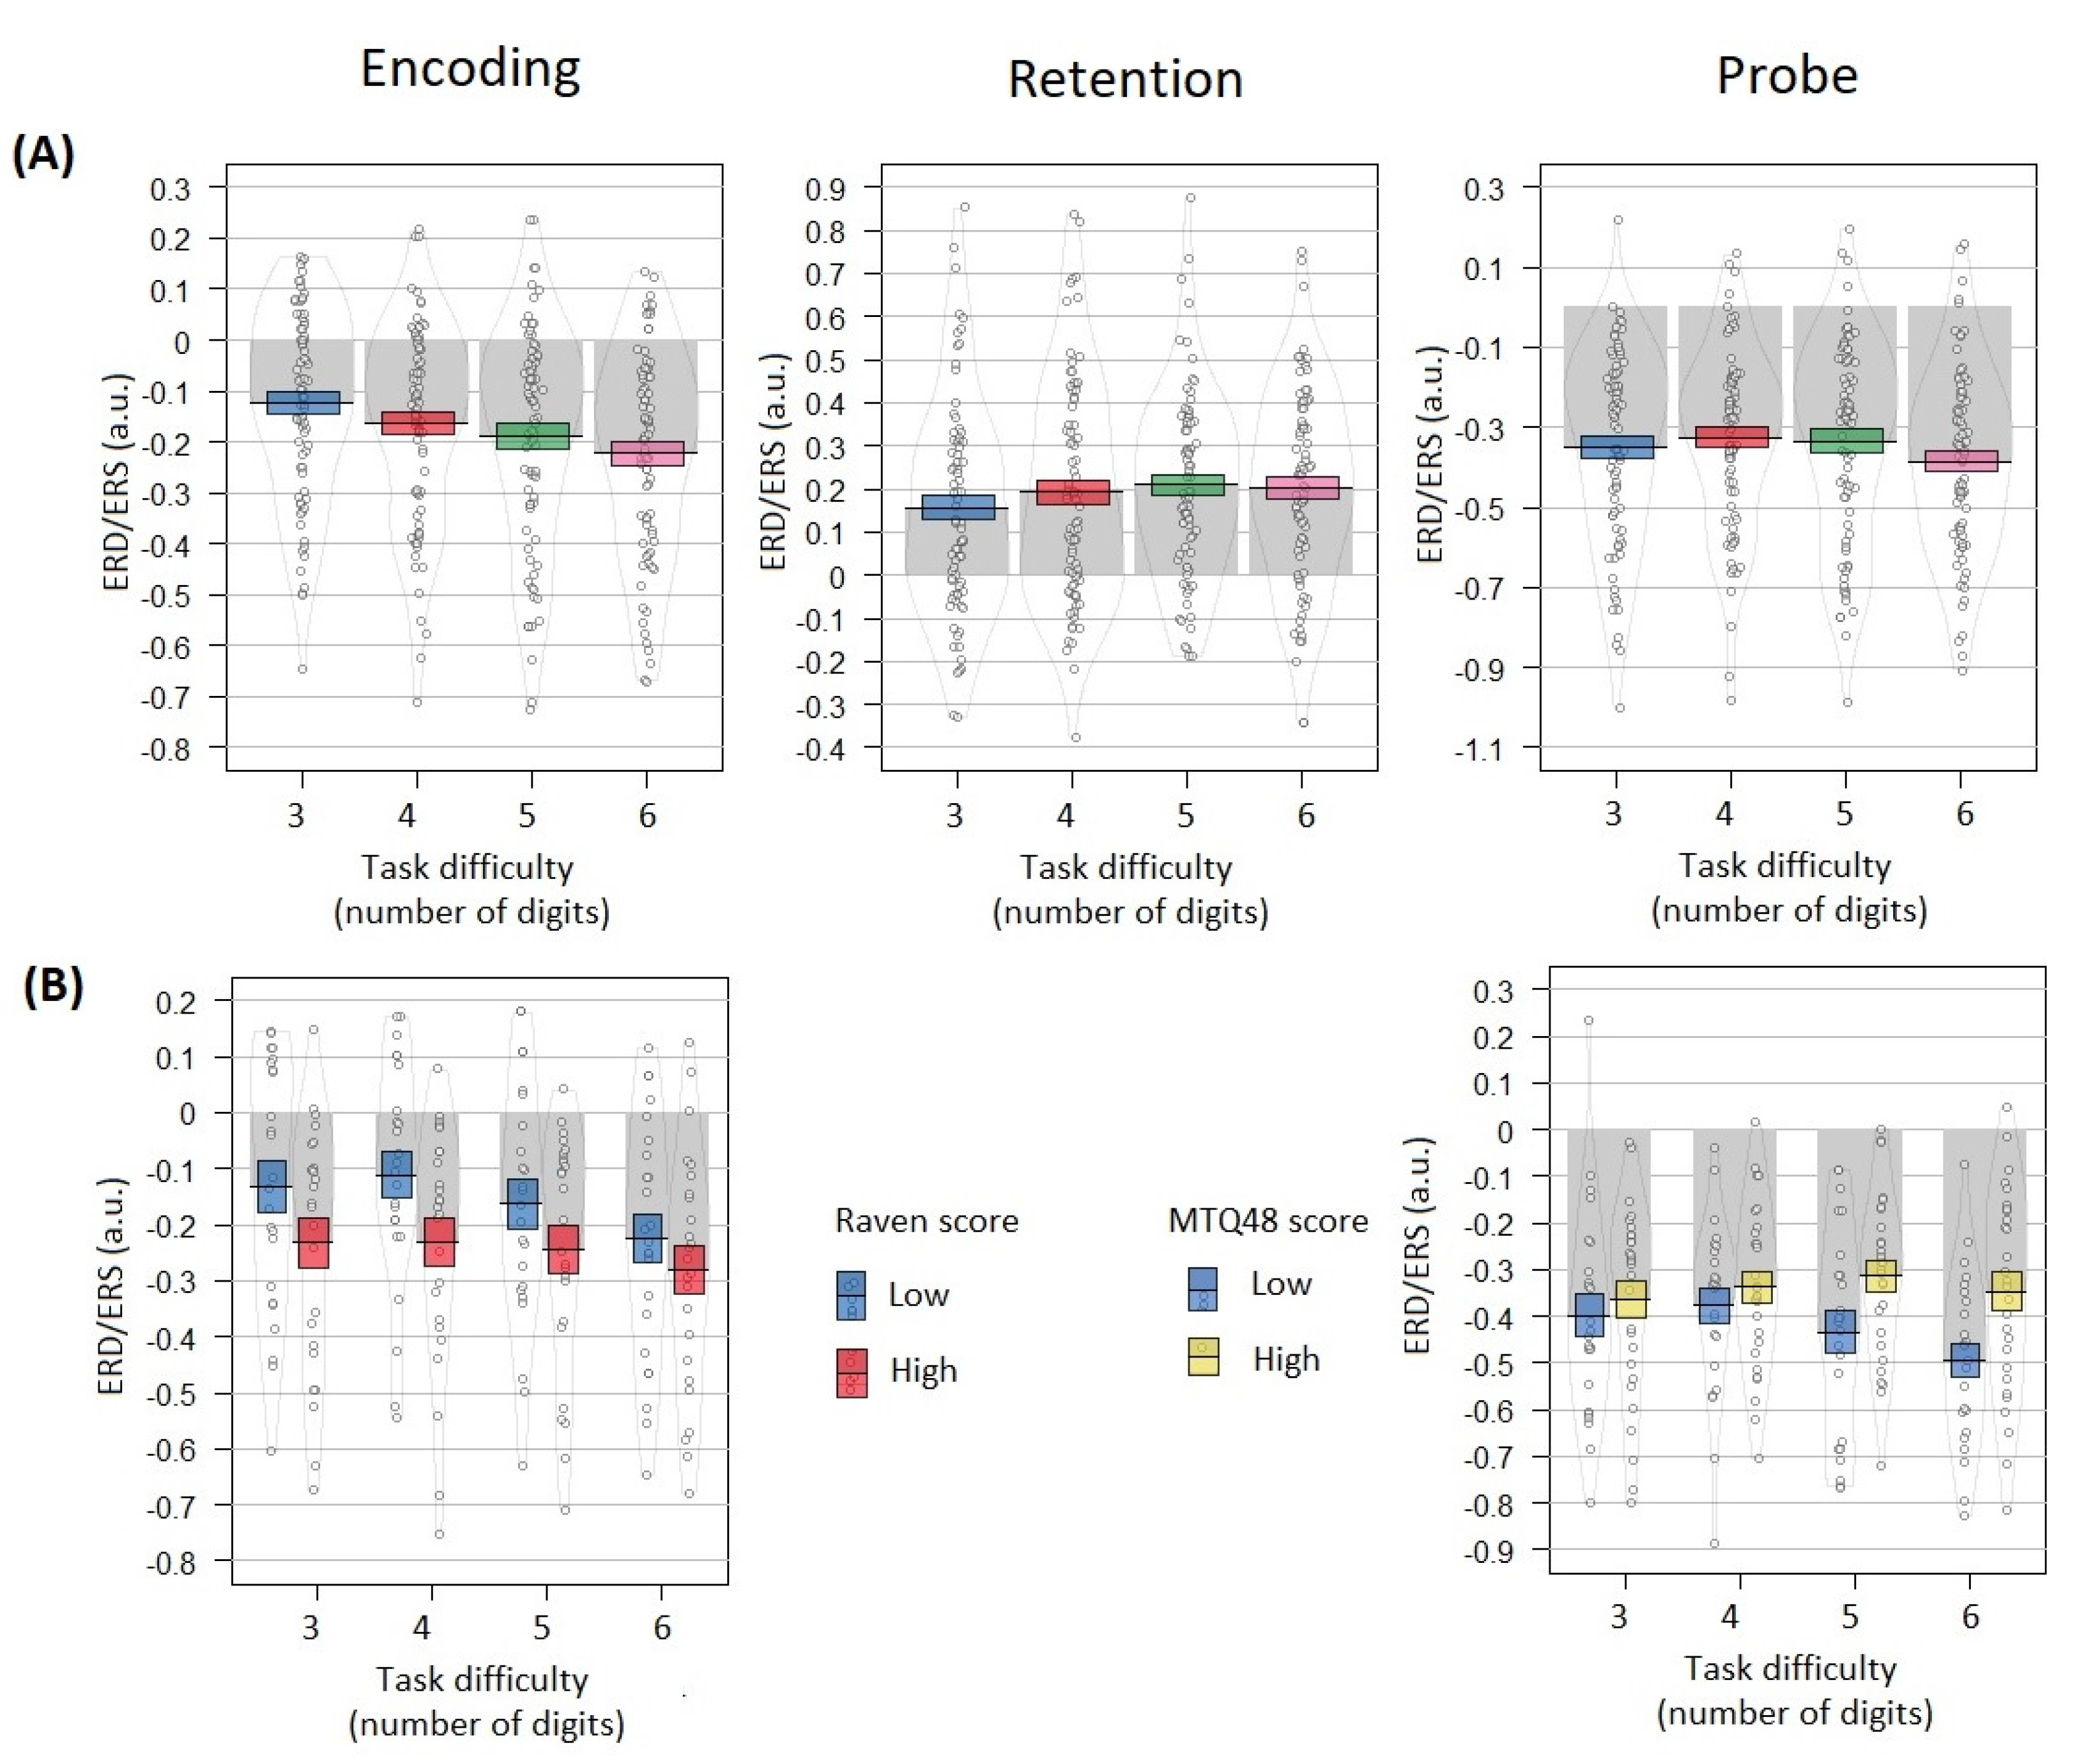
- ERD during encoding, ERS during retention and ERD related to responding increase with Sternberg task difficulty.
- For each EEG variable, a linear mixed effects model was fitted (using nlme package in R) with the following formula: a target variable—the EEG effect calculated for each participant, a predictor—task difficulty, a random effect—participant ID. To test the coefficients of the model, the Wald z-statistics was used.
- 3.
- For the easier task conditions, the variability of the severity of these effects is explained by the Raven scores
- For each EEG variable, a linear mixed effects model was estimated with the following formula: a target variable—the EEG scores, a predictors—task difficulty, Raven score (high or low) and their interaction, a random effect—participant ID. For these analyses, participants were divided into high-Raven (top 30%) and low-Raven (bottom 30%) groups using their total Raven score. To test the coefficients of the model, the Wald z-statistics was used.
- 4.
- For more difficult task conditions, the variability of the severity of these effects is explained by the mental toughness (MT) scores
- For each EEG variable, a linear mixed effects model was with the following formula: a target variable—the EEG effect, predictors—task difficulty, mental toughness score (high or low) and their interaction, a random effect—participant ID. For these analyses, participants were divided into high-MT (top 30%) and low-MT (bottom 30%) groups using their total MTQ-48 score. To test the coefficients of the model, the Wald z-statistics was used.
3. Results
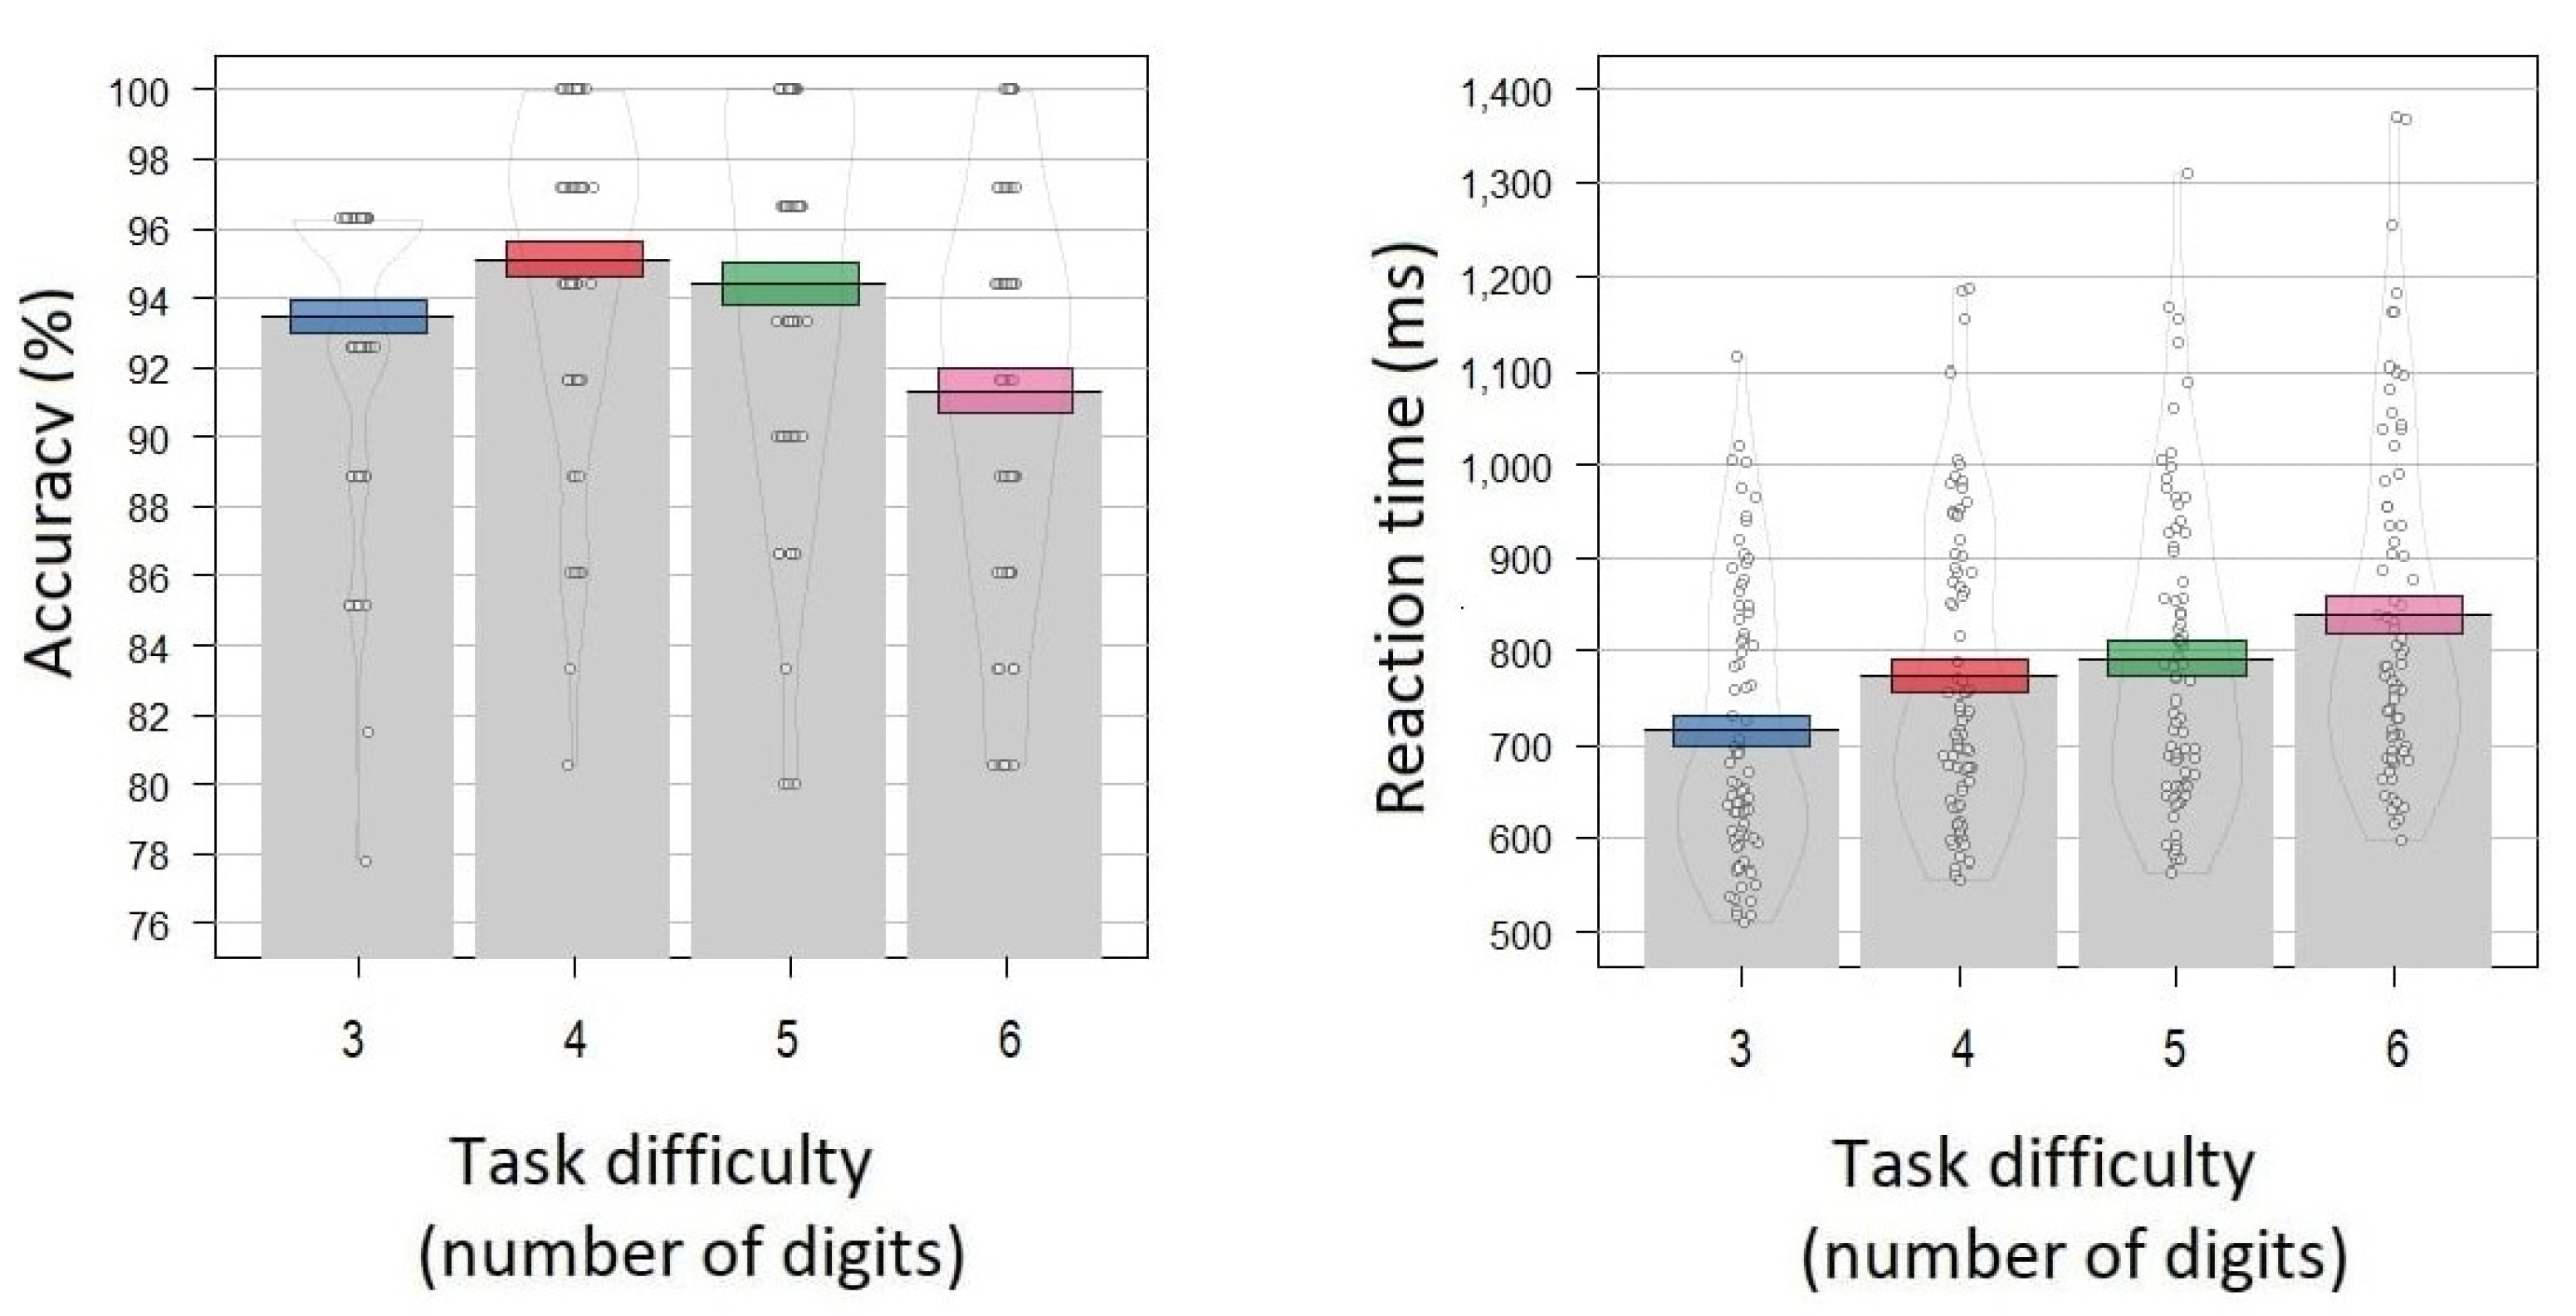
3.1. Behavioral Basic Statistics
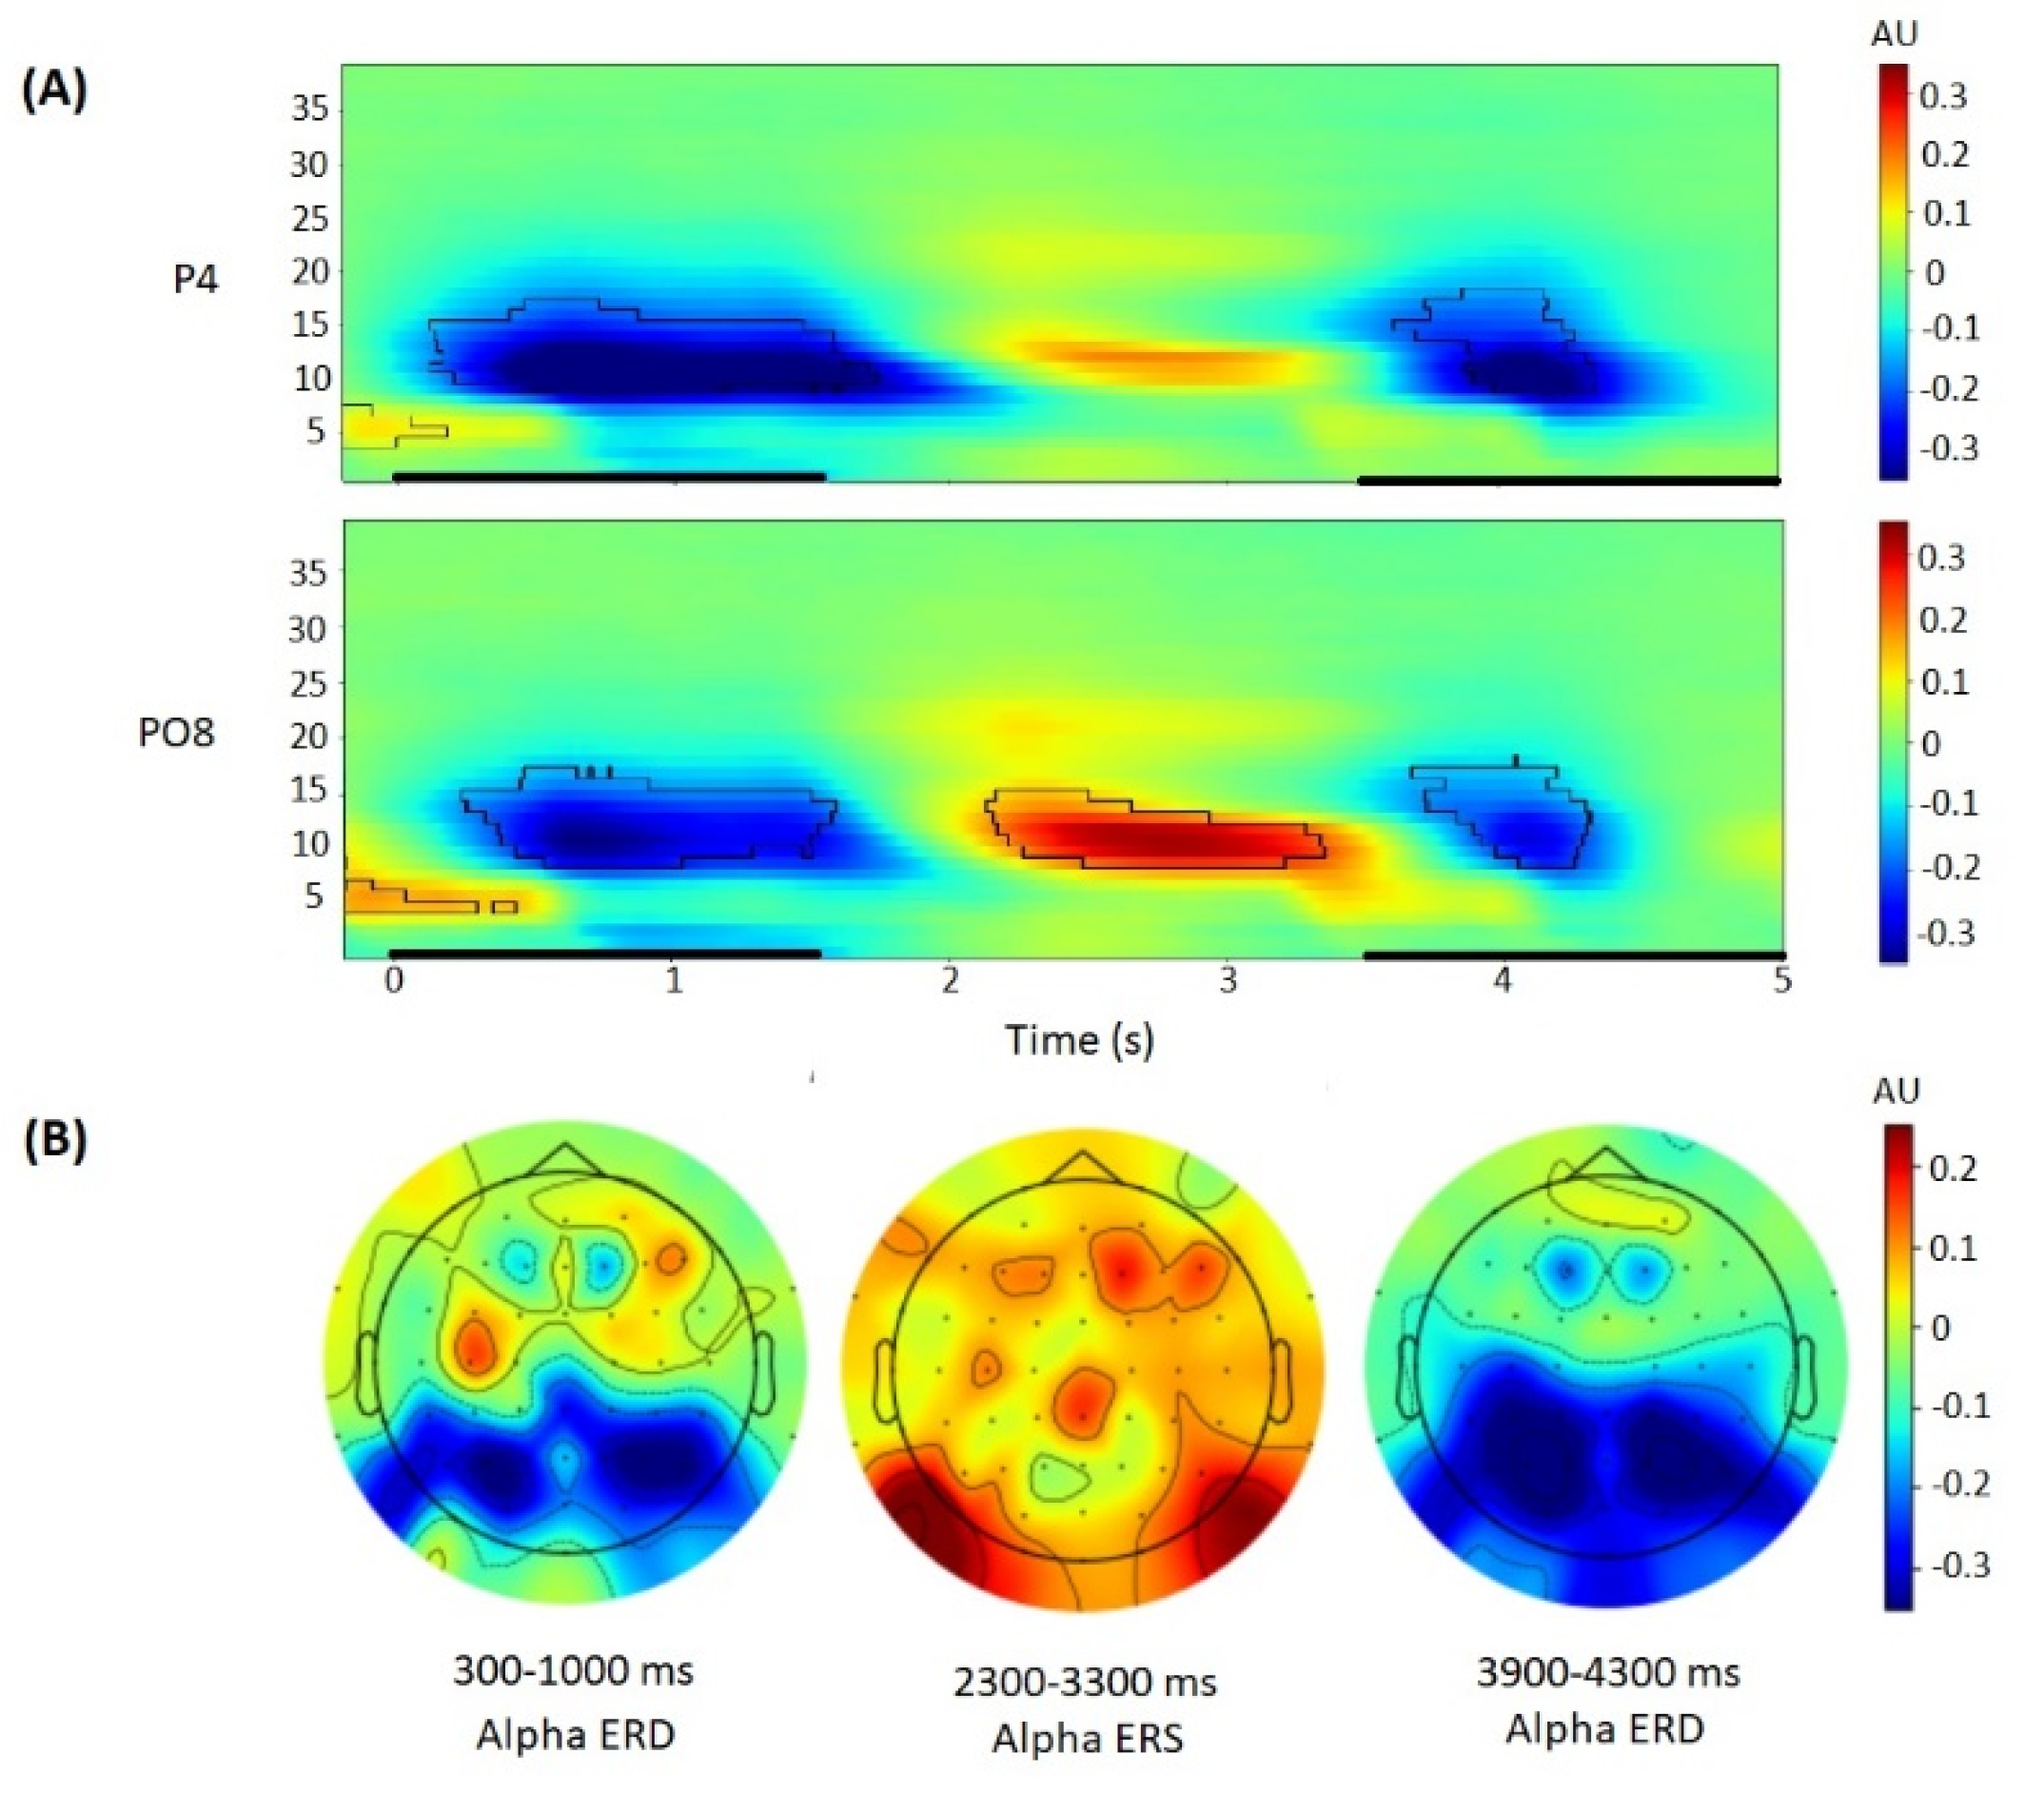
3.2. Alpha Power Correlates of the Sternberg Task
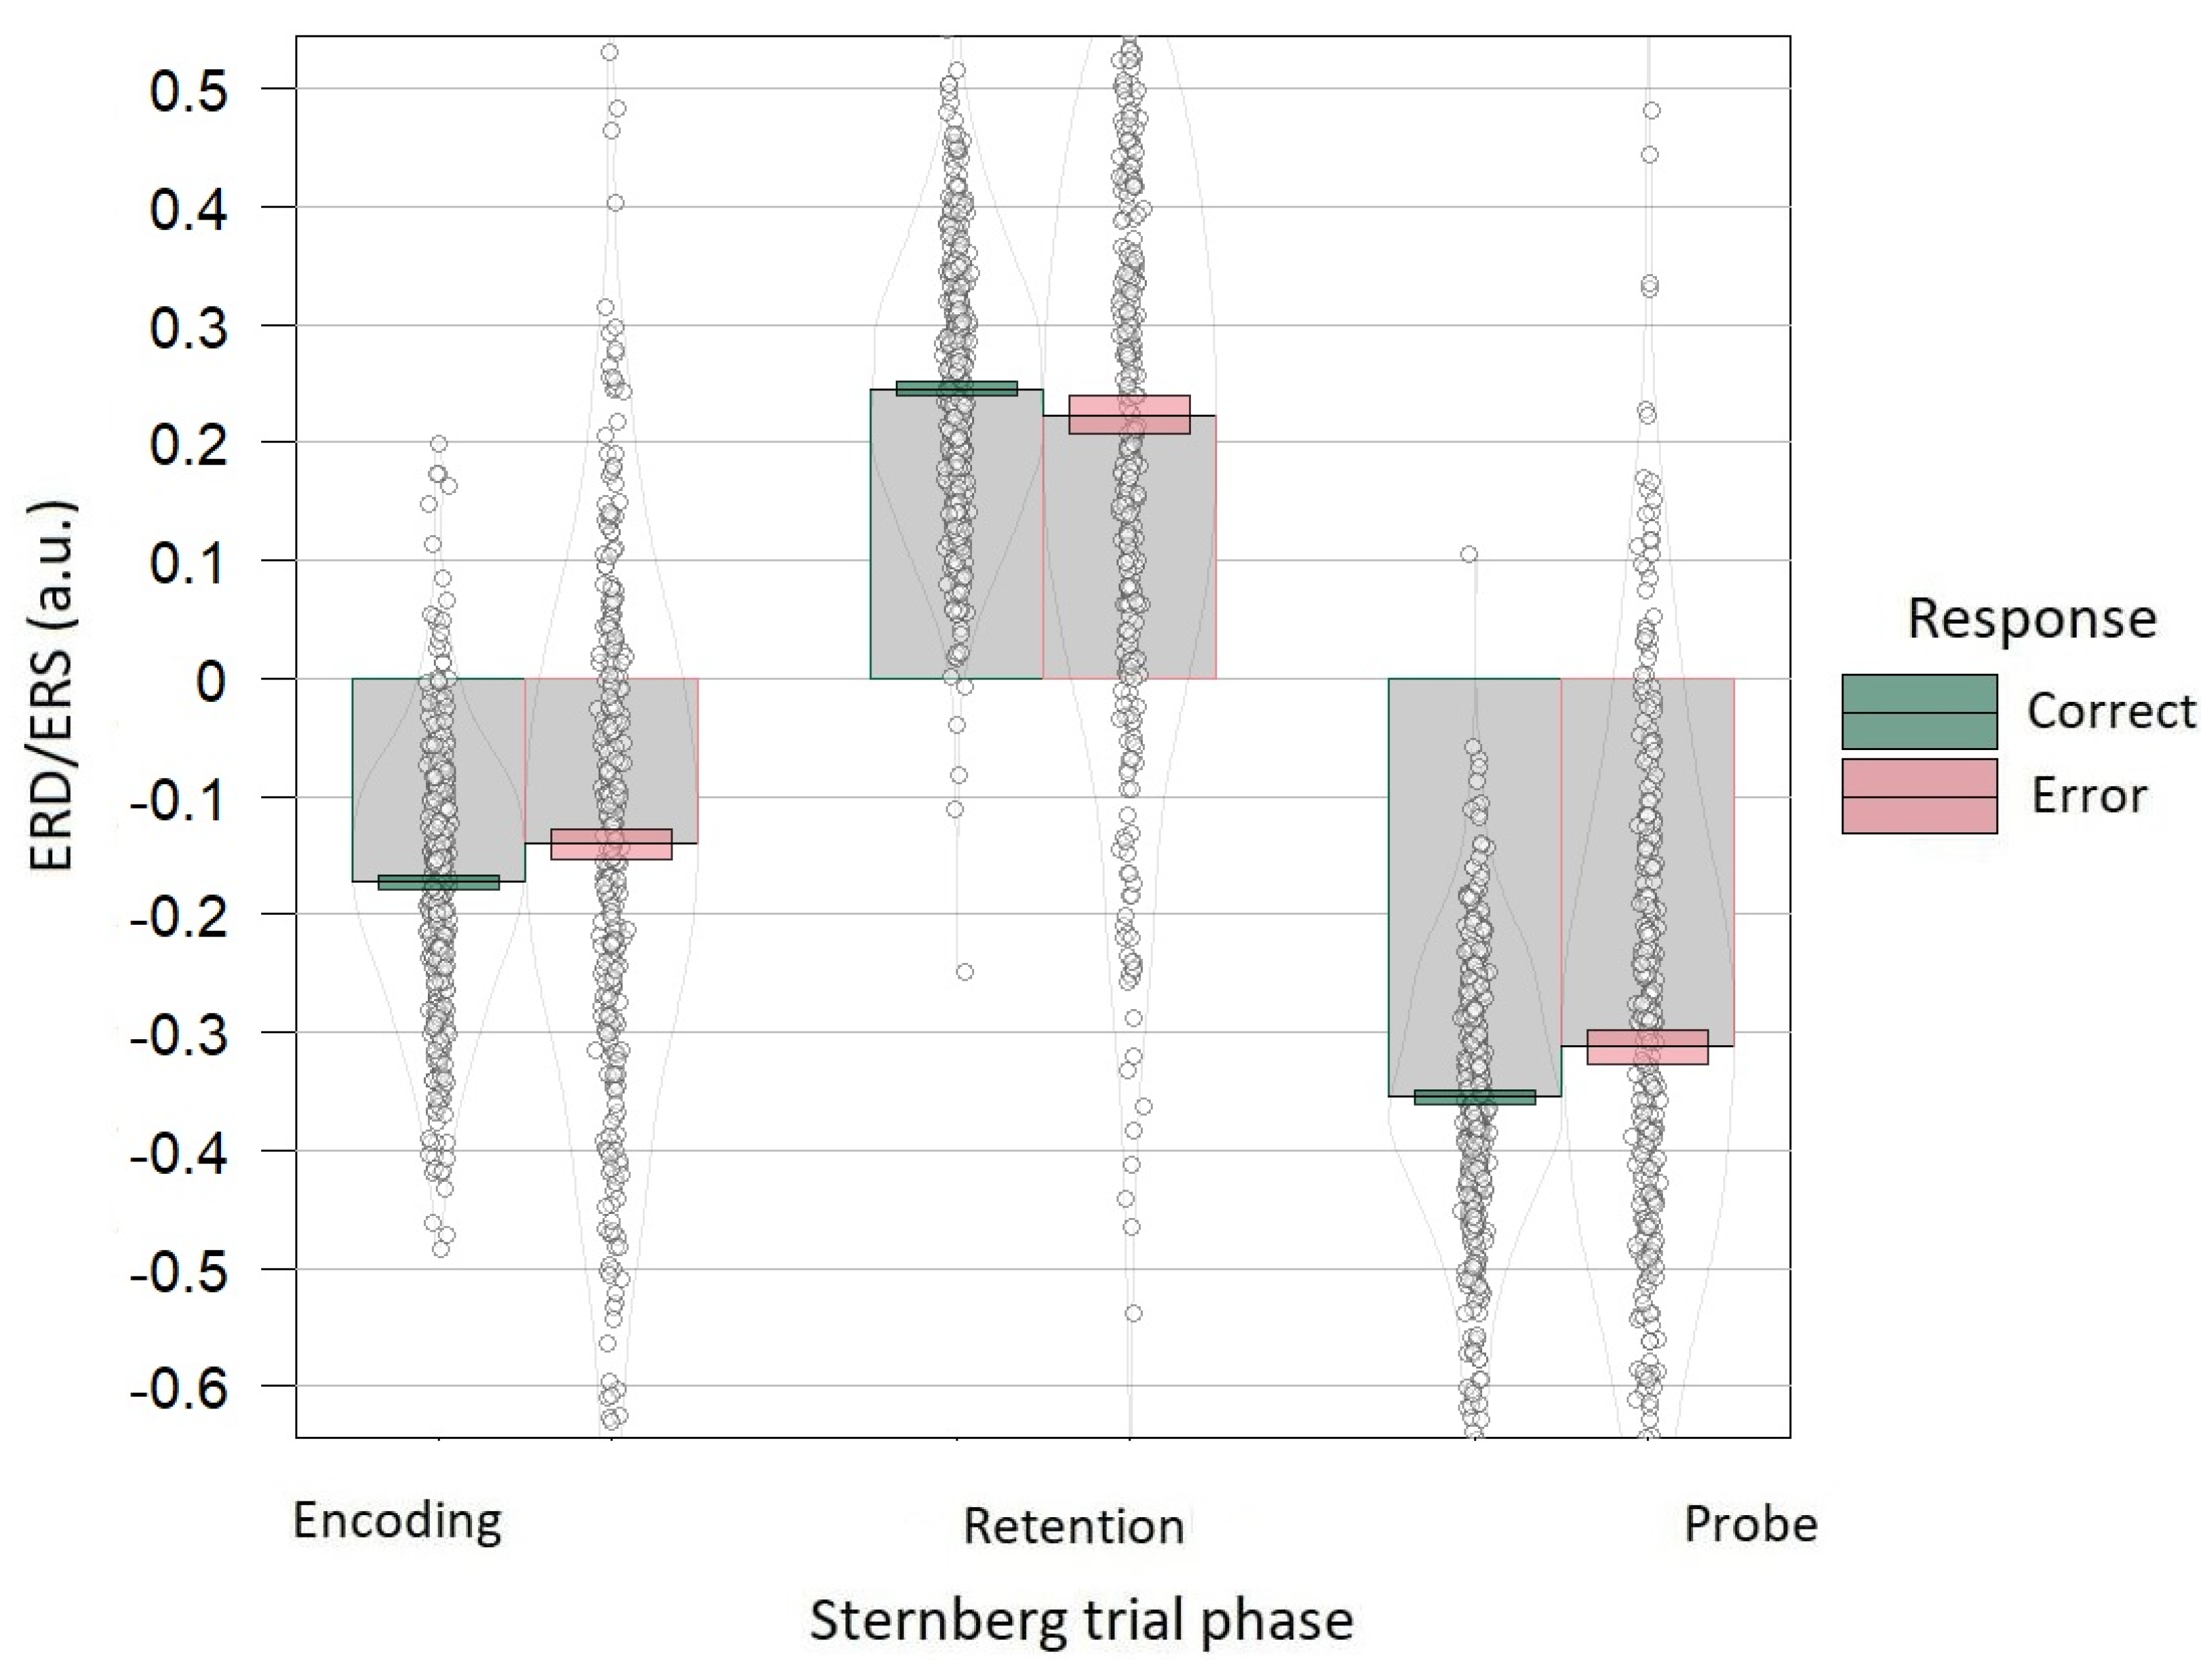
3.3. Accuracy Dependence on Alpha Power Correlates of the Sternberg Task
3.4. Alpha Power Correlates Dependence on Task Difficulty
3.5. Raven Scores Influence on Relation between EEG Effects and Task Difficulty
3.6. Mental Toughness Scores Influence on Relation between EEG Effects and Task Difficulty
4. Discussion
4.1. Behavioral Analysis
4.2. Alpha Power Correlates of the Sternberg Task
4.3. Accuracy Dependence on Alpha Power Correlates of the Sternberg Task
4.4. Alpha Power Correlates Dependence on Task Difficulty
4.5. Mental Toughness Scores Influence on Relation between EEG Effects and Task Difficulty
4.6. Raven Scores Influence on Relation between EEG Effects and Task Difficulty
4.7. Effort Distribution among Processes
4.8. Limitations
5. Conclusions
Author Contributions
Funding
Institutional Review Board Statement
Informed Consent Statement
Data Availability Statement
Conflicts of Interest
References
- Gucciardi, D.F.; Hanton, S.; Gordon, S.; Mallett, C.J.; Temby, P. The Concept of Mental Toughness: Tests of Dimensionality, Nomological Network, and Traitness. J. Pers. 2015, 83, 26–44. [Google Scholar] [CrossRef] [PubMed]
- St Clair-Thompson, H.; Giles, R.; McGeown, S.P.; Putwain, D.; Clough, P.; Perry, J. Mental toughness and transitions to high school and to undergraduate study. Educ. Psychol. 2017, 37, 792–809. [Google Scholar] [CrossRef]
- St Clair-Thompson, H.; Bugler, M.; Robinson, J.; Clough, P.; McGeown, S.P.; Perry, J. Mental toughness in education: Exploring relationships with attainment, attendance, behaviour and peer relationships. Educ. Psychol. 2015, 35, 886–907. [Google Scholar] [CrossRef]
- Dewhurst, S.A.; Anderson, R.J.; Cotter, G.; Crust, L.; Clough, P.J. Identifying the cognitive basis of mental toughness: Evidence from the directed forgetting paradigm. Pers. Individ. Differ. 2012, 53, 587–590. [Google Scholar] [CrossRef]
- Lin, Y.; Mutz, J.; Clough, P.J.; Papageorgiou, K.A. Mental Toughness and Individual Differences in Learning, Educational and Work Performance, Psychological Well-being, and Personality: A Systematic Review. Front. Psychol. 2017, 8, 1345. [Google Scholar] [CrossRef]
- Afif, I.Y.; Manik, A.R.; Munthe, K.; Maula, M.I.; Ammarullah, M.I.; Jamari, J.; Winarni, T.I. Physiological Effect of Deep Pressure in Reducing Anxiety of Children with ASD during Traveling: A Public Transportation Setting. Bioengineering 2022, 9, 157. [Google Scholar] [CrossRef]
- Delaney, P.F.; Goldman, J.A.; King, J.S.; Nelson-Gray, R.O. Mental toughness, reinforcement sensitivity theory, and the five-factor model: Personality and directed forgetting. Pers. Individ. Differ. 2015, 83, 180–184. [Google Scholar] [CrossRef]
- Wianda, E.; Ross, B. The roles of alpha oscillation in working memory retention. Brain Behav. 2019, 9, e01263. [Google Scholar] [CrossRef]
- Klimesch, W. EEG alpha and theta oscillations reflect cognitive and memory performance: A review and analysis. Brain Res. Rev. 1999, 29, 169–195. [Google Scholar] [CrossRef]
- Klimesch, W.; Sauseng, P.; Hanslmayr, S. EEG alpha oscillations: The inhibition–timing hypothesis. Brain Res. Rev. 2007, 53, 63–88. [Google Scholar] [CrossRef]
- Neubauer, A.C.; Fink, A. Intelligence and neural efficiency: Measures of brain activation versus measures of functional connectivity in the brain. Intelligence 2009, 37, 223–229. [Google Scholar] [CrossRef]
- Richter, M.; Gendolla, G.H.; Wright, R.A. Three decades of research on motivational intensity theory: What we have learned about effort and what we still don’t know. Adv. Motiv. Sci. 2016, 3, 149–186. [Google Scholar]
- Cohen, M.X.; Ridderinkhof, K.R. EEG Source Reconstruction Reveals Frontal-Parietal Dynamics of Spatial Conflict Processing. PLoS ONE 2013, 8, e57293. [Google Scholar] [CrossRef]
- Carp, J.; Compton, R.J. Alpha power is influenced by performance errors. Psychophysiol. 2009, 46, 336–343. [Google Scholar] [CrossRef]
- Compton, R.J.; Arnstein, D.; Freedman, G.; Dainer-Best, J.; Liss, A. Cognitive control in the intertrial interval: Evidence from EEG alpha power. Psychophysiology 2011, 48, 583–590. [Google Scholar] [CrossRef]
- Goldman, R.I.; Stern, J.M.; Engel, J., Jr.; Cohen, M.S. Simultaneous EEG and fMRI of the alpha rhythm. Neuroreport 2002, 13, 2487. [Google Scholar] [CrossRef]
- Laufs, H.; Kleinschmidt, A.; Beyerle, A.; Eger, E.; Salek-Haddadi, A.; Preibisch, C.; Krakowa, K. EEG-correlated fMRI of human alpha activity. NeuroImage 2003, 19, 1463–1476. [Google Scholar] [CrossRef]
- Van Diepen, R.M.; Foxe, J.J.; Mazaheri, A. The functional role of alpha-band activity in attentional processing: The current zeitgeist and future outlook. Curr. Opin. Psychol. 2019, 29, 229–238. [Google Scholar] [CrossRef]
- Compston, A. The Berger rhythm: Potential changes from the occipital lobes in man. Brain 2010, 133 Pt 1, 3–6. [Google Scholar] [CrossRef]
- Pfurtscheller, G.; Lopes da Silva, F.H. Event-related EEG/MEG synchronization and desynchronization: Basic principles. Clin. Neurophysiol. 1999, 110, 1842–1857. [Google Scholar] [CrossRef]
- van Diepen, R.M.; Mazaheri, A. Cross-sensory modulation of alpha oscillatory activity: Suppression, idling, and default resource allocation. Eur. J. Neurosci. 2017, 45, 1431–1438. [Google Scholar] [CrossRef] [Green Version]
- Berger, H. Über das Elektrenkephalogramm des Menschen, 4th report. Arch. Für Psychiatr. Und Nervenkrankh. 1932, 97, 6–26. [Google Scholar] [CrossRef]
- Creutzfeldt, O.; Grünewald, G.; Simonova, O.; Schmitz, H. Changes of the Basic Rhythms of the EEG during the Performance of Mental and Visuomotor Tasks. In Attention in Neurophysiology; Butterworths: London, UK, 1969; pp. 148–168. [Google Scholar]
- Pfurtscheller, G.; Klimesch, W. Event-related desynchronization during motor behavior and visual information processing. Electroencephalogr. Clin. Neurophysiol. Suppl. 1991, 42, 58–65. [Google Scholar]
- Pfurtscheller, G.; Klimesch, W. Event-Related Synchronization and Desynchronization of Alpha and Beta Waves in a Cognitive Task. In Induced Rhythms in the Brain; Springer: Berlin/Heidelberg, Germany, 1992; pp. 117–128. [Google Scholar]
- Boiten, F.; Sergeant, J.; Geuze, R. Event-related desynchronization: The effects of energetic and computational demands. Electroencephalogr. Clin. Neurophysiol. 1992, 82, 302–309. [Google Scholar] [CrossRef]
- Dujardin, K.; Bourriez, J.; Guieu, J. Event-related desynchronization (ERD) patterns during memory processes: Effects of aging and task difficulty. Electroencephalogr. Clin. Neurophysiol. Potentials Sect. 1995, 96, 169–182. [Google Scholar] [CrossRef]
- Krause, C.M.; Lang, H.; Laine, M.; Kuusisto, M.; Pörn, B. Cortical processing of vowels and tones as measured by event-related desynchronization. Brain Topogr. 1995, 8, 47–56. [Google Scholar] [CrossRef]
- Klimesch, W.; Doppelmayr, M.; Russegger, H.; Pachinger, T.; Schwaiger, J. Induced alpha band power changes in the human EEG and attention. Neurosci. Lett. 1998, 244, 73–76. [Google Scholar] [CrossRef]
- Klimesch, W.; Doppelmayr, M.; Hanslmayr, S. Upper alpha ERD and absolute power: Their meaning for memory performance. Prog. Brain Res. 2006, 159, 151–165. [Google Scholar] [CrossRef]
- Gundel, A.; Wilson, G.F. Topographical changes in the ongoing EEG related to the difficulty of mental tasks. Brain Topogr. 1992, 5, 17–25. [Google Scholar] [CrossRef]
- Pesonen, M.; Hämäläinen, H.; Krause, C.M. Brain oscillatory 4–30 Hz responses during a visual n-back memory task with varying memory load. Brain Res. 2007, 1138, 171–177. [Google Scholar] [CrossRef]
- Behrmann, M.; Geng, J.J.; Shomstein, S. Parietal cortex and attention. Curr. Opin. Neurobiol. 2004, 14, 212–217. [Google Scholar] [CrossRef] [PubMed]
- Gevins, A.; Smith, M.E.; McEvoy, L.; Yu, D. High-resolution EEG mapping of cortical activation related to working memory: Effects of task difficulty, type of processing, and practice. Cereb. Cortex 1997, 7, 374–385. [Google Scholar] [CrossRef] [PubMed] [Green Version]
- Stipacek, A.; Grabner, R.; Neuper, C.; Fink, A.; Neubauer, A. Sensitivity of human EEG alpha band desynchronization to different working memory components and increasing levels of memory load. Neurosci. Lett. 2003, 353, 193–196. [Google Scholar] [CrossRef] [PubMed]
- Krause, C.M.; Sillanmäki, L.; Koivisto, M.; Saarela, C.; Häggqvist, A.; Laine, M.; Hämäläinen, H. The effects of memory load on event-related EEG desynchronization and synchronization. Clin. Neurophysiol. 2000, 111, 2071–2078. [Google Scholar] [CrossRef]
- Hanslmayr, S.; Staudigl, T.; Fellner, M.-C. Oscillatory power decreases and long-term memory: The information via desynchronization hypothesis. Front. Hum. Neurosci. 2012, 6, 74. [Google Scholar] [CrossRef]
- Hanslmayr, S.; Staresina, B.P.; Bowman, H. Oscillations and Episodic Memory: Addressing the Synchronization/Desynchronization Conundrum. Trends Neurosci. 2016, 39, 16–25. [Google Scholar] [CrossRef]
- Griffiths, B.J.; Mayhew, S.D.; Mullinger, K.J.; Jorge, J.; Charest, I.; Wimber, M.; Hanslmayr, S. Alpha/beta power decreases track the fidelity of stimulus-specific information. Elife 2019, 8, e49562. [Google Scholar] [CrossRef]
- Gevins, A.; Smith, M.E.; Leong, H.; McEvoy, L.; Whitfield, S.; Du, R.; Rush, G. Monitoring Working Memory Load during Computer-Based Tasks with EEG Pattern Recognition Methods. Hum. Factors J. Hum. Factors Ergon. Soc. 1998, 40, 79–91. [Google Scholar] [CrossRef]
- Fairclough, S.H.; Ewing, K. The effect of task demand and incentive on neurophysiological and cardiovascular markers of effort. Int. J. Psychophysiol. 2017, 119, 58–66. [Google Scholar] [CrossRef]
- Fodor, Z.; Marosi, C.; Tombor, L.; Csukly, G. Salient distractors open the door of perception: Alpha desynchronization marks sensory gating in a working memory task. Sci. Rep. 2020, 10, 1–11. [Google Scholar] [CrossRef]
- Heinrichs-Graham, E.; Wilson, T.W. Spatiotemporal oscillatory dynamics during the encoding and maintenance phases of a visual working memory task. Cortex 2015, 69, 121–130. [Google Scholar] [CrossRef]
- Jensen, O.; Mazaheri, A. Shaping Functional Architecture by Oscillatory Alpha Activity: Gating by Inhibition. Front. Hum. Neurosci. 2010, 4, 186. [Google Scholar] [CrossRef] [Green Version]
- Palva, S.; Palva, J.M. New vistas for α-frequency band oscillations. Trends Neurosci. 2007, 30, 150–158. [Google Scholar] [CrossRef]
- Klimesch, W.; Schack, B.; Sauseng, P. The Functional Significance of Theta and Upper Alpha Oscillations. Exp. Psychol. 2005, 52, 99–108. [Google Scholar] [CrossRef]
- Scheeringa, R.; Petersson, K.M.; Oostenveld, R.; Norris, D.G.; Hagoort, P.; Bastiaansen, M.C. Trial-by-trial coupling between EEG and BOLD identifies networks related to alpha and theta EEG power increases during working memory maintenance. NeuroImage 2009, 44, 1224–1238. [Google Scholar] [CrossRef]
- Sternberg, S. High-Speed Scanning in Human Memory. Science 1966, 153, 652–654. [Google Scholar] [CrossRef]
- Proskovec, A.L.; Heinrichs-Graham, E.; Wilson, T.W. Load modulates the alpha and beta oscillatory dynamics serving verbal working memory. NeuroImage 2019, 184, 256–265. [Google Scholar] [CrossRef]
- Pavlov, Y.G.; Kotchoubey, B. Temporally distinct oscillatory codes of retention and manipulation of verbal working memory. Eur. J. Neurosci. 2021, 54, 6497–6511. [Google Scholar] [CrossRef]
- Bashivan, P.; Bidelman, G.M.; Yeasin, M. Neural correlates of visual working memory load through unsupervised spatial filtering of EEG. In Proceedings of 3rd Workshop on Machine Learning and Interpretation in Neuroimaging, Lake Tahoe, NV, USA, 9–10 December 2013. [Google Scholar]
- Ackerman, P.L.; Beier, M.E.; Boyle, M.O. Working memory and intelligence: The same or different constructs? Psychol. Bull. 2005, 131, 30. [Google Scholar] [CrossRef]
- Stankov, L. Attention and intelligence. J. Educ. Psychology 1983, 75, 471. [Google Scholar] [CrossRef]
- Haier, R.J.; Siegel, B.V., Jr.; Nuechterlein, K.H.; Hazlett, E.; Wu, J.C.; Paek, J.; Browning, H.; Buchsbaum, M.S. Cortical glucose metabolic rate correlates of abstract reasoning and attention studied with positron emission tomography. Intelligence 1988, 12, 199–217. [Google Scholar] [CrossRef]
- Perfetti, B.; Saggino, A.; Ferretti, A.; Caulo, M.; Romani, G.L.; Onofrj, M. Differential patterns of cortical activation as a function of fluid reasoning complexity. Hum. Brain Mapp. 2009, 30, 497–510. [Google Scholar] [CrossRef]
- Neubauer, A.C.; Fink, A. Intelligence and neural efficiency. Neurosci. Biobehav. Rev. 2009, 33, 1004–1023. [Google Scholar] [CrossRef]
- Doppelmayr, M.; Klimesch, W.; Sauseng, P.; Hödlmoser, K.; Stadler, W.; Hanslmayr, S. Intelligence related differences in EEG-bandpower. Neurosci. Lett. 2005, 381, 309–313. [Google Scholar] [CrossRef]
- Doppelmayr, M.; Klimesch, W.; Hödlmoser, K.; Sauseng, P.; Gruber, W. Intelligence related upper alpha desynchronization in a semantic memory task. Brain Res. Bull. 2005, 66, 171–177. [Google Scholar] [CrossRef]
- Grabner, R.H.; Neubauer, A.C.; Stern, E. Superior performance and neural efficiency: The impact of intelligence and expertise. Brain Res. Bull. 2006, 69, 422–439. [Google Scholar] [CrossRef]
- Preusse, F.; Elke, V.D.M.; Deshpande, G.; Krueger, F.; Wartenburger, I. Fluid Intelligence Allows Flexible Recruitment of the Parieto-Frontal Network in Analogical Reasoning. Front. Hum. Neurosci. 2011, 5, 22. [Google Scholar] [CrossRef]
- Larson, G.E.; Haier, R.J.; LaCasse, L.; Hazen, K. Evaluation of a “mental effort” hypothesis for correlations between cortical metabolism and intelligence. Intelligence 1995, 21, 267–278. [Google Scholar] [CrossRef]
- Shenhav, A.; Musslick, S.; Lieder, F.; Kool, W.; Griffiths, T.L.; Cohen, J.D.; Botvinick, M.M. Toward a Rational and Mechanistic Account of Mental Effort. Annu. Rev. Neurosci. 2017, 40, 99–124. [Google Scholar] [CrossRef]
- Brehm, J. A Theory of Motivational Suppression; Unpublished grant proposal; University of Kansas: Lawrence, KS, USA, 1975. [Google Scholar]
- Clough, P.; Earle, K.; Sewell, D. Mental toughness: The concept and its measurement. Solut. Sport Psychol. 2002, 1, 32–43. [Google Scholar]
- Gucciardi, D.F. Mental toughness profiles and their relations with achievement goals and sport motivation in adolescent Australian footballers. J. Sports Sci. 2010, 28, 615–625. [Google Scholar] [CrossRef] [PubMed]
- Madrigal, L.; Hamill, S.; Gill, D.L. Mind Over Matter: The Development of the Mental Toughness Scale (MTS). Sport Psychol. 2013, 27, 62–77. [Google Scholar] [CrossRef]
- Button, K.S.; Ioannidis, J.; Mokrysz, C.; Nosek, B.A.; Flint, J.; Robinson, E.S.; Munafò, M. Power failure: Why small sample size undermines the reliability of neuroscience. Nat. Rev. Neurosci. 2013, 14, 365–376. [Google Scholar] [CrossRef] [PubMed] [Green Version]
- Peirce, J.; Gray, J.R.; Simpson, S.; MacAskill, M.; Höchenberger, R.; Sogo, H.; Kastman, E.; Lindeløv, J.K. PsychoPy2: Experiments in behavior made easy. Behav. Res. Methods 2019, 51, 195–203. [Google Scholar] [CrossRef]
- Horsburgh, V.A.; Schermer, J.A.; Veselka, L.; Vernon, P.A. A behavioural genetic study of mental toughness and personality. Pers. Individ. Differ. 2009, 46, 100–105. [Google Scholar] [CrossRef]
- Raven, J.C.; Court, J.H. Raven’s Progressive Matrices and Vocabulary Scales; Oxford Pyschologists Press: Oxford, UK, 1998. [Google Scholar]
- Carpenter, P.A.; Just, M.A.; Shell, P. What one intelligence test measures: A theoretical account of the processing in the Raven Progressive Matrices Test. Psychol. Rev. 1990, 97, 404. [Google Scholar] [CrossRef]
- Raven, J.C.; Court, J.H.; Raven, J.E. Standard Progressive Matrices; Australian Council for Educational Research Limited: San Antonio, TX, USA, 1989. [Google Scholar]
- Firooz, S.; Setarehdan, S.K. IQ estimation by means of EEG-fNIRS recordings during a logical-mathematical intelligence test. Comput. Biol. Med. 2019, 110, 218–226. [Google Scholar] [CrossRef]
- Gramfort, A.; Luessi, M.; Larson, E.; Engemann, D.A.; Strohmeier, D.; Brodbeck, C.; Parkkonen, L.; Hämäläinen, M.S. MNE software for processing MEG and EEG data. NeuroImage 2013, 86, 446–460. [Google Scholar] [CrossRef]
- Rights, J.D.; Cole, D.A. Effect Size Measures for Multilevel Models in Clinical Child and Adolescent Research: New R-Squared Methods and Recommendations. J. Clin. Child Adolesc. Psychol. 2018, 47, 863–873. [Google Scholar] [CrossRef]
- Cohen, J. A power primer. Psychol. Bull. 1992, 112, 155–159. [Google Scholar] [CrossRef]
- Nakamura, J.; Csikszentmihalyi, M. The concept of flow. In Handbook of Positive Psychology; Oxford University Press: New York, NY, USA, 2002. [Google Scholar]
- Weissman, D.H.; Roberts, K.C.; Visscher, K.M.; Woldorff, M. The neural bases of momentary lapses in attention. Nat. Neurosci. 2006, 9, 971–978. [Google Scholar] [CrossRef]
- Deary, I. Looking Down on Human Intelligence: From Psychometrics to the Brain; Oxford University Press: New York, NY, USA, 2000. [Google Scholar]
- Jensen, A.R. Psychometric g: Definition and Substantiation. In The General Factor of Intelligence: How General Is It; Psychology Press: London, UK, 2002; pp. 39–53. [Google Scholar]
- Klimesch, W.; Fellinger, R.; Freunberger, R. Alpha Oscillations and Early Stages of Visual Encoding. Front. Psychol. 2011, 2, 118. [Google Scholar] [CrossRef]
- Fries, P.; Reynolds, J.H.; Rorie, A.E.; Desimone, R. Modulation of Oscillatory Neuronal Synchronization by Selective Visual Attention. Science 2001, 291, 1560–1563. [Google Scholar] [CrossRef] [Green Version]
- Händel, B.F.; Haarmeier, T.; Jensen, O. Alpha Oscillations Correlate with the Successful Inhibition of Unattended Stimuli. J. Cogn. Neurosci. 2011, 23, 2494–2502. [Google Scholar] [CrossRef]
- Payne, L.; Sekuler, R. The importance of ignoring: Alpha oscillations protect selectivity. Curr. Dir. Psychol. Sci. 2014, 23, 171–177. [Google Scholar] [CrossRef]
- Roux, F.; Uhlhaas, P.J. Working memory and neural oscillations: Alpha-gamma versus theta-gamma codes for distinct WM information? Trends Cogn. Sci. 2014, 18, 16–25. [Google Scholar] [CrossRef]
- Spadone, S.; Tosoni, A.; Della Penna, S.; Sestieri, C. Alpha rhythm modulations in the intraparietal sulcus reflect decision signals during item recognition. NeuroImage 2022, 258, 119345. [Google Scholar] [CrossRef]
- Arsalidou, M.; Pascual-Leone, J.; Johnson, J.; Morris, D.; Taylor, M.J. A balancing act of the brain: Activations and deactivations driven by cognitive load. Brain Behav. 2013, 3, 273–285. [Google Scholar] [CrossRef]
- Brehm, J.W.; Self, E.A. The Intensity of Motivation; Annual Reviews Inc.: San Mateo, CA, USA, 1989. [Google Scholar]
- Anokhin, A.; Vogel, F. EEG Alpha rhythm frequency and intelligence in normal adults. Intelligence 1996, 23, 1–14. [Google Scholar] [CrossRef]
- Wright, R.A. Brehm’s Theory of Motivation as a Model of Effort and Cardiovascular Response; Guilford Press: New York, NY, USA, 1996. [Google Scholar]
- Jansma, J.; Ramsey, N.; de Zwart, J.; van Gelderen, P.; Duyn, J. fMRI study of effort and information processing in a working memory task. Hum. Brain Mapp. 2007, 28, 431–440. [Google Scholar] [CrossRef]


Publisher’s Note: MDPI stays neutral with regard to jurisdictional claims in published maps and institutional affiliations. |
© 2022 by the authors. Licensee MDPI, Basel, Switzerland. This article is an open access article distributed under the terms and conditions of the Creative Commons Attribution (CC BY) license (https://creativecommons.org/licenses/by/4.0/).
Share and Cite
Zhozhikashvili, N.; Zakharov, I.; Ismatullina, V.; Feklicheva, I.; Malykh, S.; Arsalidou, M. Parietal Alpha Oscillations: Cognitive Load and Mental Toughness. Brain Sci. 2022, 12, 1135. https://doi.org/10.3390/brainsci12091135
Zhozhikashvili N, Zakharov I, Ismatullina V, Feklicheva I, Malykh S, Arsalidou M. Parietal Alpha Oscillations: Cognitive Load and Mental Toughness. Brain Sciences. 2022; 12(9):1135. https://doi.org/10.3390/brainsci12091135
Chicago/Turabian StyleZhozhikashvili, Natalia, Ilya Zakharov, Victoria Ismatullina, Inna Feklicheva, Sergey Malykh, and Marie Arsalidou. 2022. "Parietal Alpha Oscillations: Cognitive Load and Mental Toughness" Brain Sciences 12, no. 9: 1135. https://doi.org/10.3390/brainsci12091135
APA StyleZhozhikashvili, N., Zakharov, I., Ismatullina, V., Feklicheva, I., Malykh, S., & Arsalidou, M. (2022). Parietal Alpha Oscillations: Cognitive Load and Mental Toughness. Brain Sciences, 12(9), 1135. https://doi.org/10.3390/brainsci12091135