1. Introduction
As automotive lamps are highly integrated, the heat generated from bulbs reduces the light quantity and lifespan of the bulbs [
1]. In addition, the surrounding parts are deformed by thermal shocks at higher temperatures. Among the automotive lamp modules, the part subjected to the highest heat is the reflector that reflects the light of the bulb outside [
2]. To minimize the deformation of the reflector caused by thermal shocks, many studies have been actively conducted worldwide on heat dissipation design and material change for heat release [
3,
4,
5,
6].
As for studies on the geometry of the reflector, research has been conducted on the geometry that improves the heat dissipation performance by designing radiation fins on the reflector. The geometry that has the optimal heat dissipation performance was derived using the geometry of radiation fins as a design variable [
7]. There are also cases where materials were changed to improve heat transfer. For the projection lamp reflector, the aluminum die casting method was applied to release the heat generated from the bulb. Although aluminum is a light metal with high thermal conductivity, it is heavier than polymer materials (specific gravity: approximately 2.7 g/cm
3) and its molding process is limited. In addition, the cost of processing, such as anodizing, is high [
8,
9]. Research on the development of light and thermally conductive polymer composites is underway to replace metal materials [
10,
11]. Further, studies are being conducted on composites obtained by mixing lightweight, highly strong, and thermally conductive base materials and ceramic powders or fibers with appropriate particle sizes [
12,
13,
14]. In previous studies on composites, however, the mechanical characteristics [
15,
16] and thermal characteristics [
17,
18] were analyzed in the composite specimen stage, and few studies were conducted on the actual products.
Moreover, various methods [
19,
20,
21] have been introduced for molding products using composites, and most of them require long production times and involve processes requiring high production costs. Among the various manufacturing methods, the method that uses injection molding is suitable for the mass production of products with the same geometry, and it is one of the methods selected for the manufacture of automotive parts considering economic efficiency and productivity.
In this study, the mechanical, thermal, and morphological characteristics of polymer matrix composites containing alumina based on the alumina content were compared for their application to automotive lamp reflectors, and their flowability and injection moldability were analyzed. PBT and PB6 were used as the polymer matrix, and alumina was used as a thermally conductive filler. The various characteristics of composites according to the alumina content were analyzed. Among them, the case where 60% alumina was added to PA6 was selected.
To compare the performances of the selected composites with that of the fog lamp reflector manufactured with conventional PBT, fog lamp reflectors were fabricated under the same conditions as the reflector injection conditions. Lamps were mounted on the fabricated two reflectors, and the temperature changes of the reflectors were analyzed by creating an environment similar to actual use conditions. When 60% alumina was added, the thermal conductivity was improved and thus the maximum temperature of the lamp reflector was reduced and the heat was well transferred to the surroundings, compared to the fog lamp reflector fabricated with conventional PBT.
2. Materials and Methods
2.1. Materials and Specimen Fabrication
To apply polymer composites to automotive fog lamp reflectors, PBT and PA6 were used as the polymer matrix, and alumina was selected as a filler for improving the thermal conductivity of the polymers.
Ultradur B 4560 from BASF SE was used as PBT. It is a material created for the injection molding of automotive lamp bezels and has a medium viscosity grade. PA6 with Hyosung 1011br, RV 2.4 (Korea), was used as matrix resin in this work. In addition, alumina (Al
2O
3) was applied to improve the thermal conductivities of the polymers. The Al
2O
3 used in this study was provided by Dongkuk R&S Co. Ltd. (Gimhae, Korea). Spherical alumina with mean particle diameters of 5, 10, and 25 µm was selected. For the chemical composition, DSP-AS series with over 99.9% Al
2O
3, 245 ppm of free Na
+, and 11 ppm of free Cl
− were used. Spherical alumina was used to improve the flowability of the material during injection molding, and various sizes of 25, 10, and 5 µm were mixed to increase the packing density [
22,
23] required for thermal conductivity improvement [
24].
Pellets for injection were manufactured by a TSE 32 twin-screw extrude machine (UNEEPLUS Co. Ltd. Hwaseong, Korea) at a screw speed of 300 rpm, melt temperature at 250 °C. The screw diameter in the extruder machine was 32 mm, and the length–diameter ratio was 40.
Injection molding for specimen fabrication used NE-80 (80 Ton) (Woojinplaimm Co. Ltd. Boeun, Korea). For the fabrication of tensile specimens and spirals, the nozzle temperature was set to 260 °C. Specimens were fabricated under the same injection conditions, including the injection rate of 50%, an injection pressure of 6.5 MPa, and the cooling time of 20 s. Specimens for the measurement of the heat transfer coefficient of each sample were fabricated using a heat press. The specimens were fabricated by setting the temperature to 270 °C, the pressure to 0.6 MPa, and the pressing time to 5 min. The testing samples had a diameter and a thickness of 12.7 and 2 mm, respectively [
25].
Table 1 shows the compositions of the samples used in this study. The compositions were used to analyze the characteristics of the samples based on the polymers of PBT and PA6 according to the alumina content. For PA6, three cases with alumina contents of 50%, 60%, and 70% were compared and analyzed. For PBT, only 60% alumina was used because it was difficult to fabricate samples through injection molding after mixing alumina due to cooling shrinkage.
2.2. Characterization
Tensile strength (Ts) tests were carried out at room temperature according to American Society for Testing and Materials (ASTM) D638-14 [
26] using a QM 100TM universal testing machine (Qmesys Co. Ltd., Anyang-si, Gyeonggi-do, Korea) with a cross-head speed of 5 mm/min. Flexural tests were also conducted on the universal testing machine at room temperature according to ASTM D790-17 [
27]. The notched impact strengths of the composites were determined with a QM700A IZOD Type impact tester (Qmesys Co. Ltd., Anyang-si, Gyeonggi-do, Korea) at room temperature according to ASTM D256-10 [
28]. Each test was repeated three times to obtain each reported value.
The melt flow index (MI) was measured via a method that involved determining the rate of extrusion of molten thermoplastic resins using an extrusion plastometer [
29]. After a specified preheating time, the resin was extruded through a die with a specified length and orifice diameter under the prescribed conditions of temperature, load, and piston position in the barrel. The MI was measured after drying the sample at 100 °C for 2 h, using a QM280A (Qmesys Co. Ltd., Anyang-si, Gyeonggi-do, Korea) at a temperature of 235 °C and load of 1.0 kg according to ASTM D1238.
The flow behavior of plastic melts is of great importance for the injection of the molding and can be assessed in practical terms. This is achieved via the spiral test that employs spiral molds on commercial injection molding machines (NE-80). The flow path covered by the melt, which is also the length of the spiral, is a measure for the flowability of the processed material [
30]. The test was conducted using a transfer pressure of 6.9 MPa and a mold temperature of 260 ± 3 °C in accordance with the standards of ASTM D 3123-09.
The thermal conductivity (Tc) of the composites was examined by NETZSCH Geraetebau GmbH (LFA447), and the infrared (IR) source was a Xenon flash lamp. The thermal diffusivity was measured using a flash method, which is a noncontact measurement method, with no contact resistance with the sample, and the thermal conductivity test was carried out according to ASTM E1461.
Thermogravimetric analysis (TGA) was performed on a TA Instrument Model Q5000IR. The TGA temperature was calibrated with Curie temperature standards. Conventional TGA was performed under nitrogen flow (25 mL × min−1) from room temperature to 700 °C using a heating rate of 20 °C min−1.
The morphology of the composites was observed by SEM (Sigma 500, Carl-Zeiss, Jena, Germany) using an acceleration voltage of 10 kV. The sample surfaces were coated with platinum to enhance the image resolution and prevent electrostatic charging [
29,
31].
3. Analysis of Test Results
3.1. Analysis of Mechanical Characteristics
Mechanical characteristics according to the alumina content added to the polymers of PBT and PA6 were analyzed.
Table 2 lists the results of the test on the mechanical characteristics. It was found that both PBT and PA6 exhibited lowered performances when alumina was added compared to the mechanical strengths without alumina. For PBT, when 60% alumina was included, the tensile strength sharply decreased, making it impossible to perform an experiment. It was also not possible to properly measure the elongation. In the case of the flexural strength, the result was only half that of PBT without alumina. Moreover, the impact strength test was not possible in this study because the impact strength specimen tended to be damaged while it was fabricated. When the mechanical strengths were analyzed for PA6 mixed with alumina, the tensile strengths were slightly lower compared to that of PA6 without alumina, and the value showed a tendency to decrease as the alumina content increased. When the content increased from 60% to 70%, however, there was no significant difference in tensile strength. In the case of the elongation, however, the value continuously decreased as the alumina content increased. Both flexural and impact strengths were found to decrease as the alumina content increased.
The addition of a rigid filler restricts the chain mobility of polymer molecules; this may lead to the formation of micro-cracks in the composites. Furthermore, increased stress concentration at the ends of the filler is another reason for crack formation in the matrix. It is known that, when the extent of cracks in the specimen reaches a critical level, especially, in matrix surrounding filler, the matrix cannot resist applied load and then cracks initiate in those regions [
32,
33,
34,
35]. PBT and PA6 revealed different mechanical strength properties when alumina was added. The addition of alumina to PBT was significantly detrimental to the mechanical strength of PBT; further, it was difficult to even fabricate specimens by the addition of alumina. Conversely, in the case of PA6, the addition of alumina led to an extreme decrease in the elongation, but no significant degradation of other mechanical properties was observed. Therefore, in terms of mechanical strength, the addition of alumina to PA6 would evidently be more suitable for the production of injection-molded products compared to PBT.
3.2. Analysis of Thermal Conductivity Test Results
The thermal conductivity test was conducted on PBT and PA6, according to the Al
2O
3 content.
Table 3 summarizes the results of the test, which were obtained from the average values of three specimens. When 60% alumina was added to PBT, the thermal conductivity was found to be 1.21 W/mK, which was four times as high as the thermal conductivity of the PBT polymer (0.29) [
36]. For PA6, when the alumina content was 50%, the thermal conductivity was 0.425 W/mK, which was approximately 1.7 times higher compared to the case without alumina. The thermal conductivity was 1.13 W/mK for the alumina content of 60% and 1.163 W/mK for 70%. PA6 exhibited lower thermal conductivity than PBT. This appears to be because of the difference in thermal conductivity between the basic materials. The thermal conductivity of alumina is approximately 30 W/mK, but the mixtures of alumina and polymers exhibited low thermal conductivities because alumina was accumulated on the polymers and heat bridges could not be properly formed. Further, this is because the heat transfer is interrupted by a very small gap in the contact surface between the alumina and the polymer [
37,
38].
3.3. Analysis of Flowability Test Results
To analyze the flowability of ceramic polymer composites, MI measurement and a spiral flow (SF) experiment were performed.
Table 4 lists the MI measurements and the SF experiment results, and
Figure 1 shows the specimens injected by the SF experiment.
As shown in
Table 4, when 60% alumina was added to PBT, the spiral length decreased by 40 mm compared to PBT without alumina. The MI measurement also decreased from 80 to 68.5 g/10 min. For PBT, the experiment was attempted based on the alumina content, but the experiment could not be performed properly as the specimens showed a tendency to be damaged because of cooling shrinkage after the SF experiment.
For PA6, the spiral length decreased as the alumina content increased. When 70% alumina was added, the spiral length decreased by 88 mm compared to PA6 (0), confirming that the flowability significantly decreased. The spiral length of PA6 (0) was 385 mm and that of PA6 (50) was 340 mm; this was calculated as a 12% reduction in the spiral length. In the case of PA6 (60), the injection rate was 315 mm and the reduction rate was 7.4% when PA6 (50) was selected as the basis of comparison. In the case of PA6 (70), the reduction rate was 5.7% when based on PA6 (60). This implies that the reduction rate is not proportional to the alumina content. Compared to the initial 50% addition of alumina, additions of 10% and 50% or more had a greater effect on flowability as compared to the reduction of spiral length. Moreover, when PBT (60) and PA6 (60) were compared, PBT exhibited better flowability than PA6 (60); however, the specimen of PBT was damaged during cooling and subjected to nozzle clogging. In the case of PBT (60), the flow characteristics decreased by 9.1% when compared to PBT; in the case of PA6 (60), this decrease was 18.2% when compared to PA6 (0). The effect on flow due to the addition of alumina was confirmed to have a more profound influence on PA6 than on PBT.
Based on the results of the thermal conductivity test and SF experiment, samples were injected by adding 60% alumina to PBT and PA6, respectively.
Figure 2 shows the injection results of PBT (60) and PA6 (60). When injection was performed using a rectangular mold with round edges and a constant thickness, the PBT sample showed surface breakage while being cooled after injection. This appears to be because the resin of PBT was brittle. The PA6 sample did not exhibit any breakage. The experimental results provided by the MI, spiral test, and the square injection methods confirmed that the PA6 (60) did not possess suitable flowability characteristics when compared to the conventional PA6. However, there was no problem in injecting the shape, and the possibility of an additional reflector injection was confirmed.
3.4. Thermogravimetric Analysis
To study the thermal degradation observed by rheological analysis, PA6 and PBT were mixed with alumina and they were characterized by thermogravimetry (TGA). The results are presented in
Figure 3.
The weight loss caused by the decomposition of the pure PBT and Al2O3 composites was nearly the same up to a temperature of about 390 °C. After this point, the thermal degradation was influenced by the presence of 60% Al2O3 in the PBT matrix. The Al2O3 content in the polymer plays a pivotal role in the thermal degradation temperatures. In the case of the PBT containing 60% alumina, more than 60% of the weight is left at 600 °C. In addition, it was found that the weight reduction rate was lower compared to that of pure PBT.
In the case of pure PA6, thermal degradation could be observed from 450 °C and the residual weight was close to 0% at over 600 °C, making it possible to determine the residual amount according to the alumina content. In the case of PBT (0), it can be observed that the weight reduction occurs sharply from 390 °C; further, PA6 (0) shows a decrease in weight from 450 °C. When PBT and PA6 were compared, the thermal stability of PA6 was found to be superior [
39].
In addition, it was discovered that the rate of degradation increased with an increase in the alumina content [
40,
41]. The temperature at which the rate of weight reduction starts stopping is beyond 550 and 500 °C for PA6 (0) and PA6 (50), respectively. This temperature is gradually lowered to 480 and 470 °C for PA6 (60) and PA6 (50), respectively.
3.5. Microstructures of the Composites
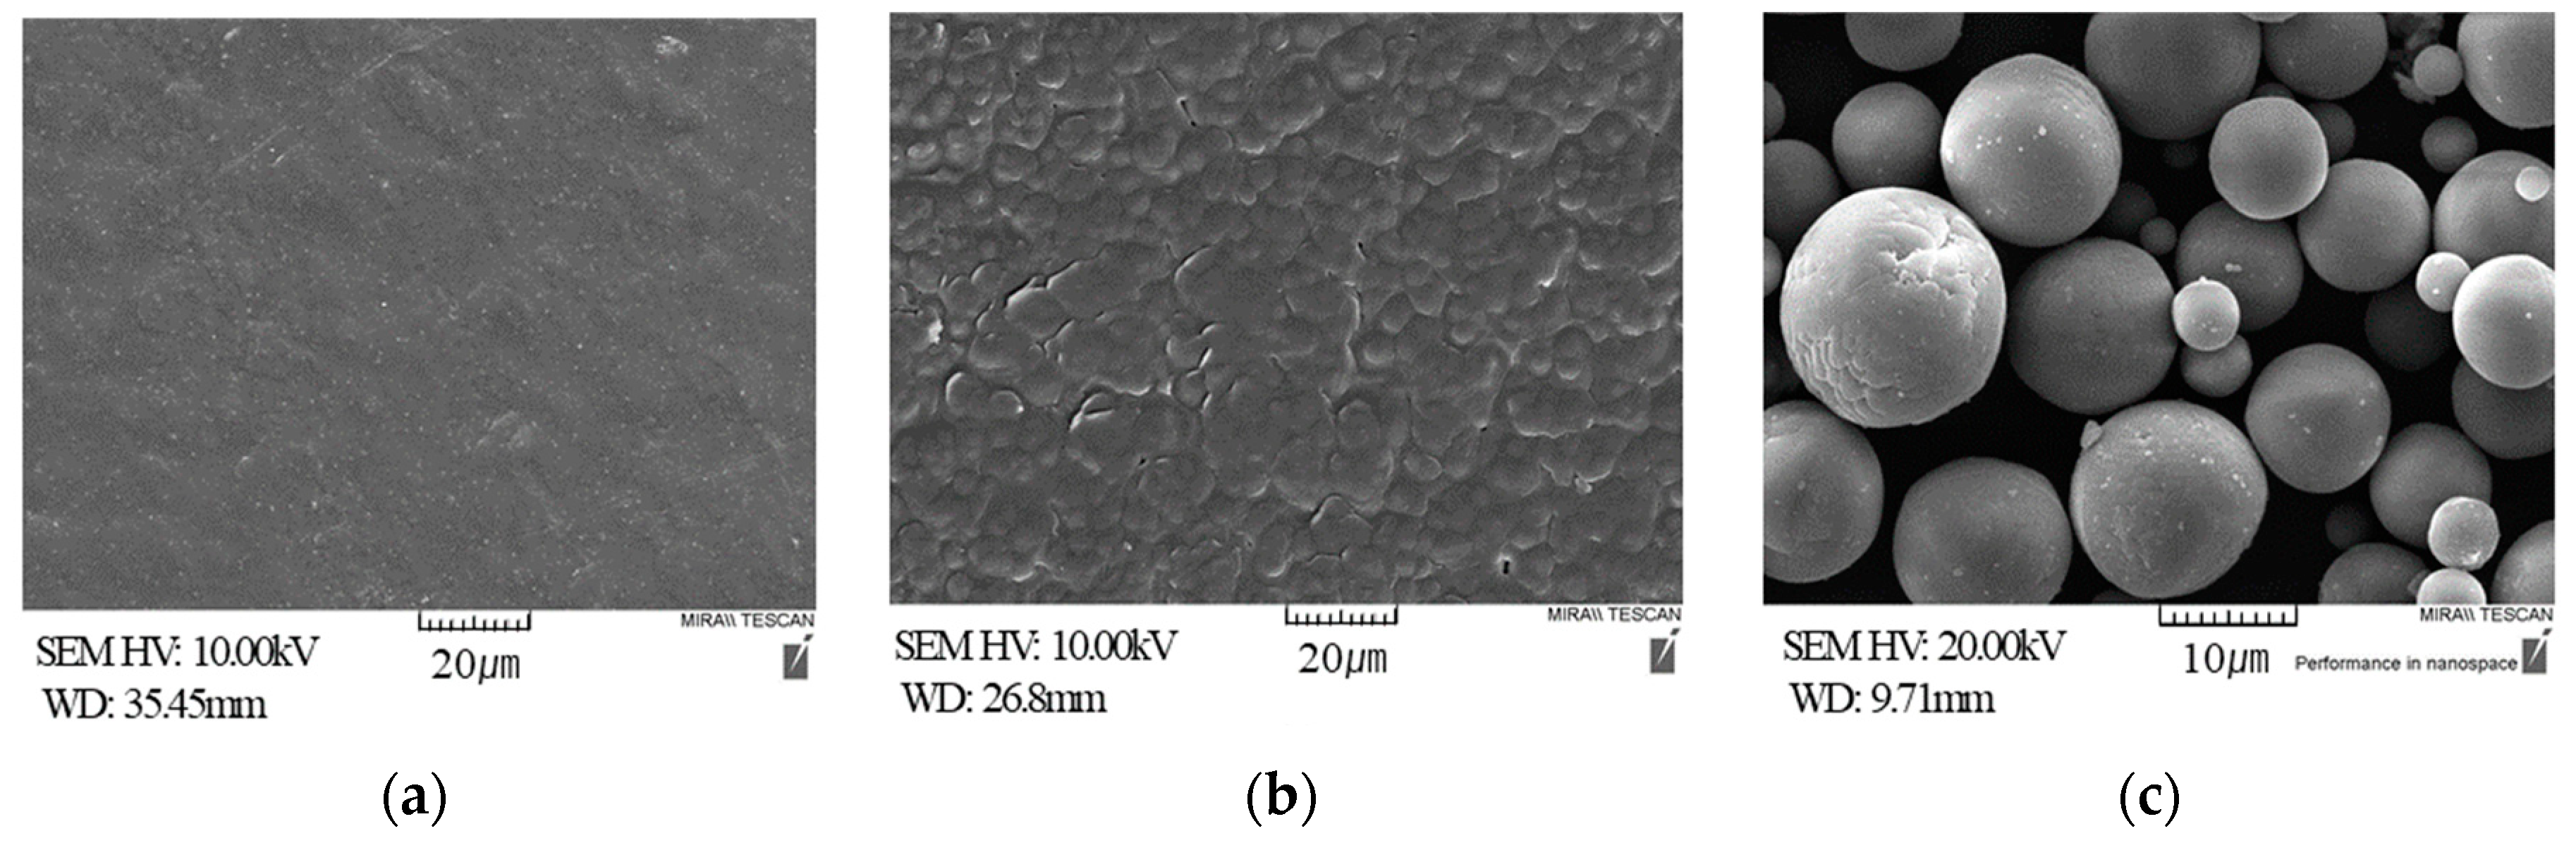
Figure 4 shows the SEM images of the raw materials. PBT is relatively smooth and uniform; PA (6) exhibited round patterns; and for alumina, spherical alumina was selected for improved flowability during injection, and the SEM measurement results confirmed that most alumina powders were maintaining the spherical shape.
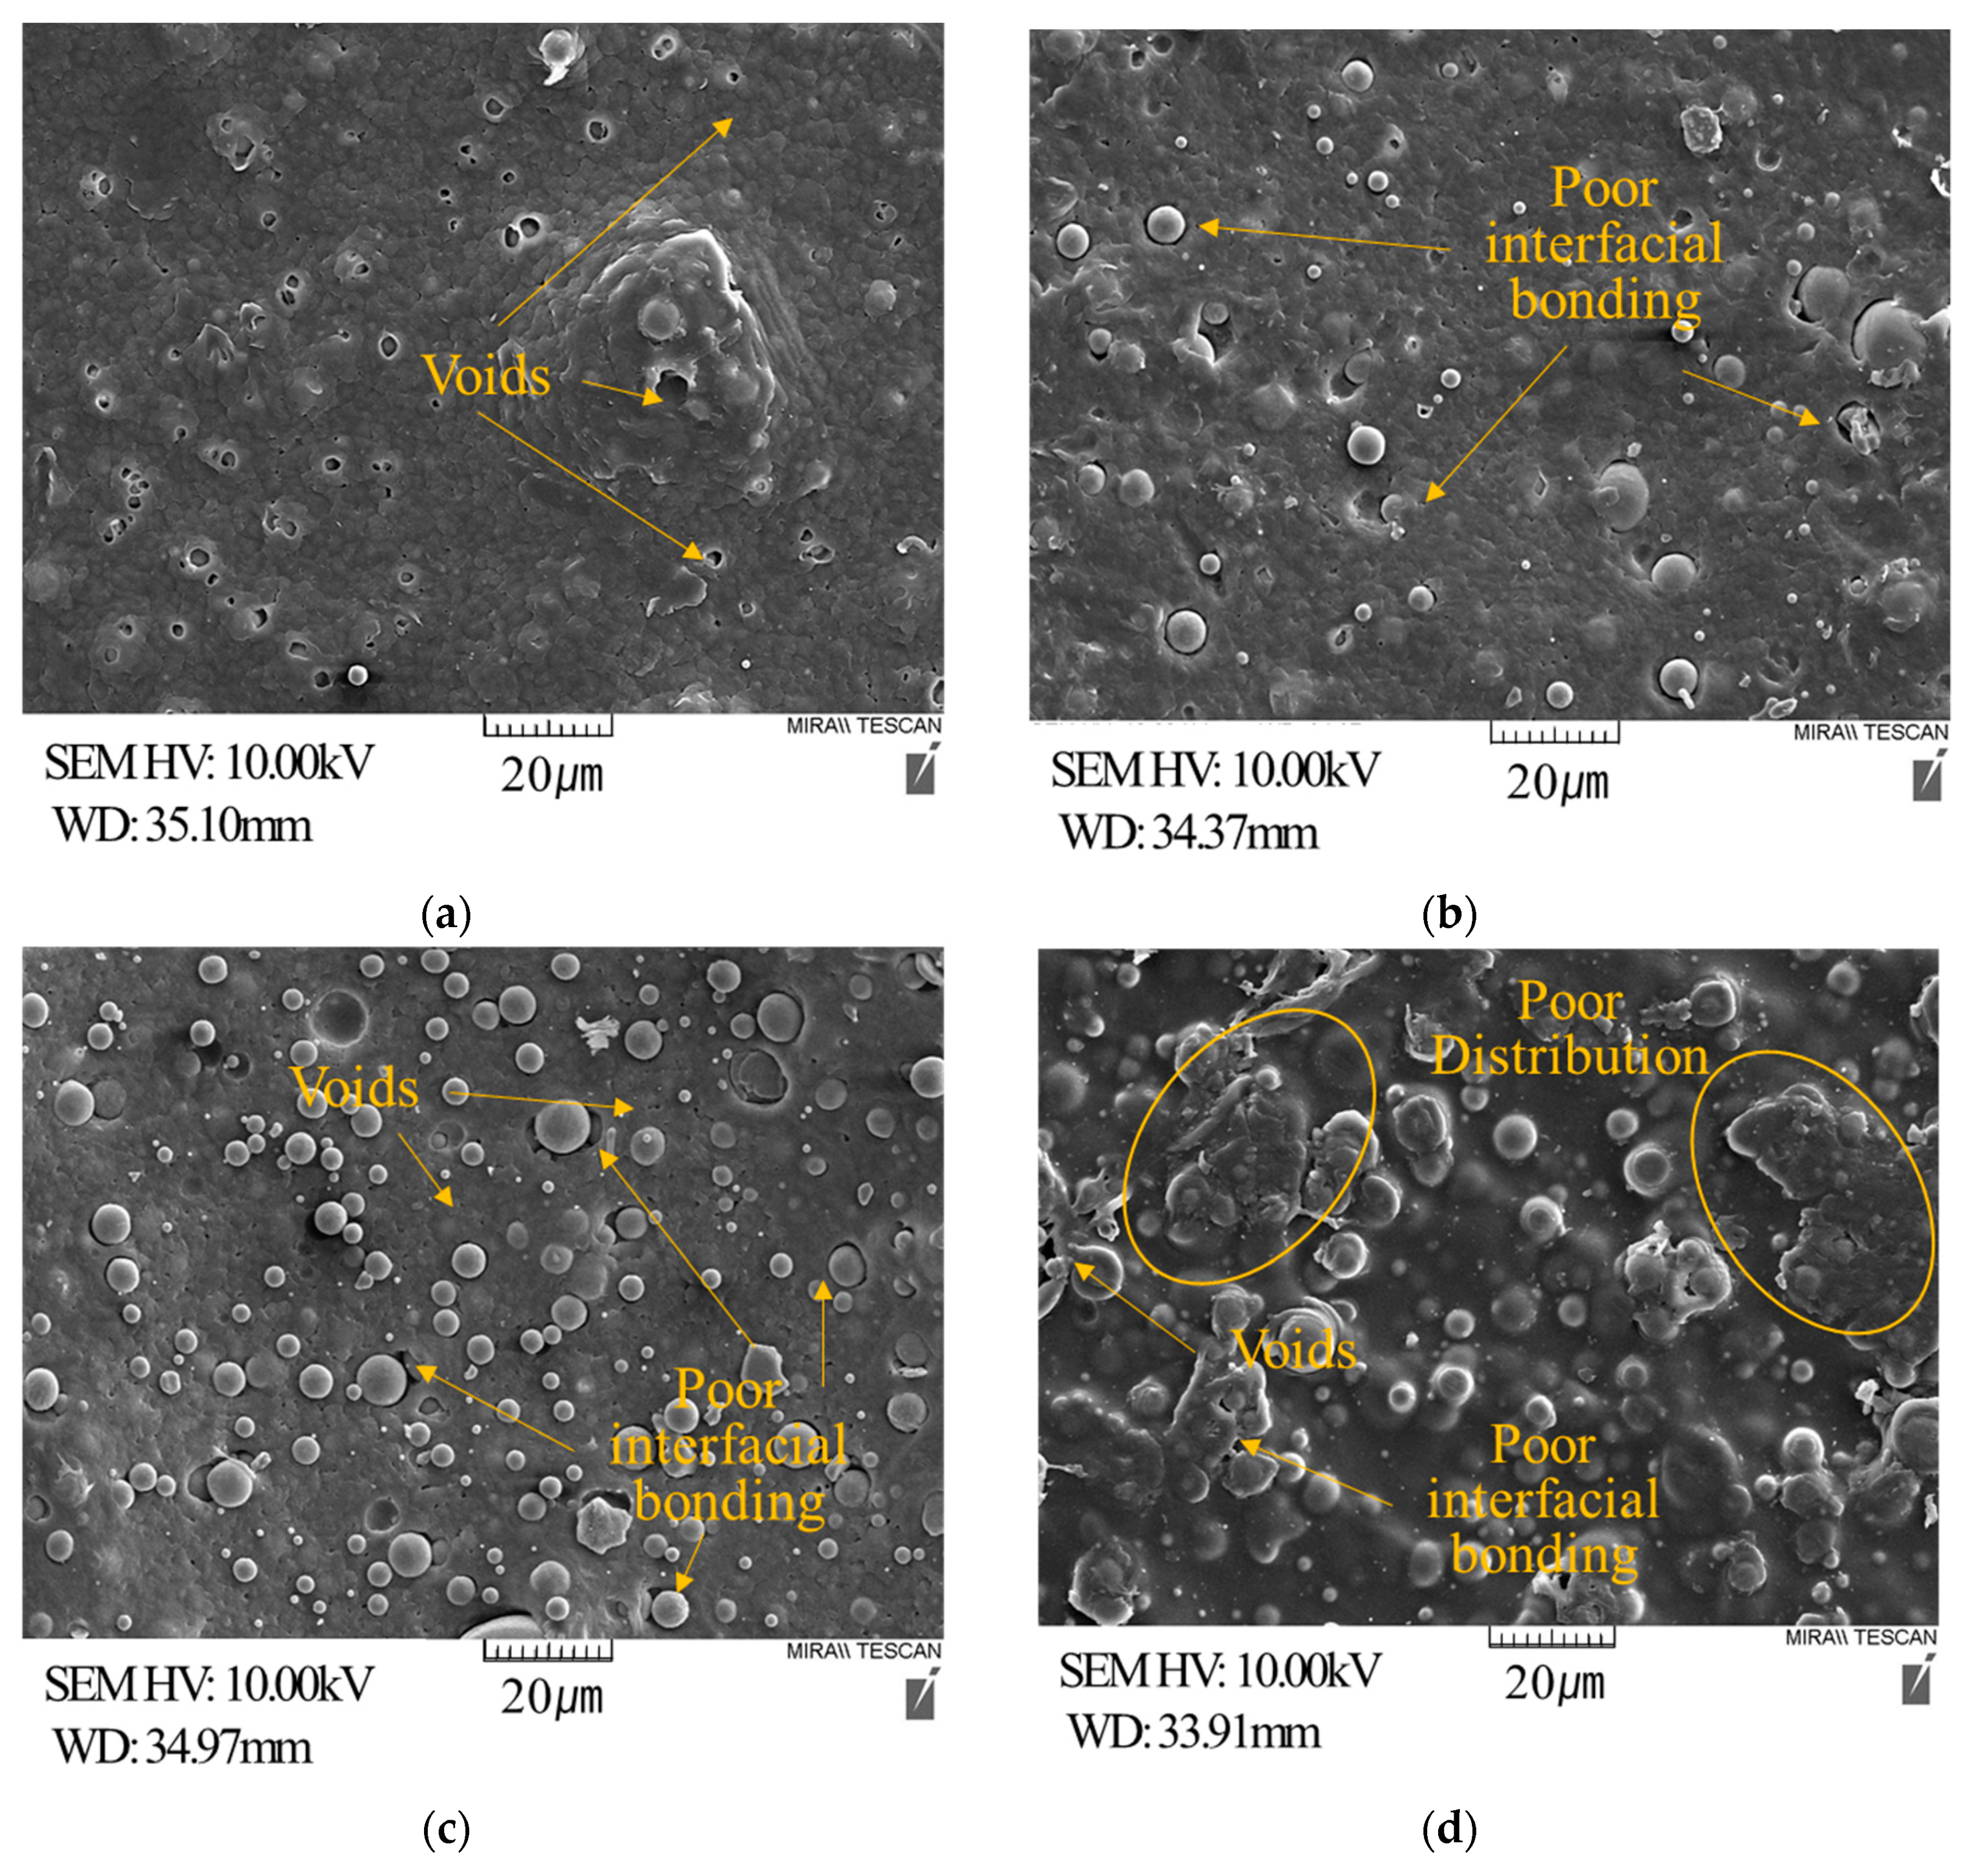
Figure 5 shows the SEM images of the cross sections of the PA6 (50), PA6 (60), PA6 (70), and PBT (60) samples. In the case of PA6 (50), the distribution of alumina was significantly low. As the alumina content increased, a large amount of alumina was visible on the surface, forming heat bridges. There were, however, gaps between the alumina and polymer, and voids increased owing to the filler addition of alumina. They increased as the alumina content increased, which degraded mechanical strength characteristics. For PBT, the dispersion state was not good in many cases. This phenomenon is a typical disadvantage of these composites, which deteriorates the overall mechanical and thermal properties. Subsequently, agglomeration occurred, and there were many voids between the agglomerated parts. This seems to have significantly reduced the mechanical strength of these composites.
4. Analysis of the Automotive Lamp Reflector Application Test
4.1. Reflector Fabrication Using Injection Molding
Reflectors were fabricated through injection molding for the temperature measurement test because of material change. The test was conducted on the fog lamp reflector, and the model applied to vehicle ‘S’ from company ‘H’ was used as the fog lamp.
For the temperature measurement test, the reflector fabricated using conventional PBT and the product fabricated using PA6 (60) tested above were compared. The SPE-250 model from Hyundai was used as the injection molding machine, and the reflectors used the same fog lamp mold for a comparison. As for the injection conditions, the injection pressure was set to 55 bars, the injection rate to (50%), and the nozzle temperature to 260 °C.
4.2. Analysis of the Reflector Temperature Distribution Test
To measure the temperature difference between the reflectors due to the material change, a system was constructed as shown in
Figure 6. Polycarbonate (PC) chambers were constructed to conduct the test in environments with conditions similar to the enclosed conditions wherein the reflector is mounted and used in a vehicle, and the fabricated PBT and PA6 (60) reflectors were set, respectively. The temperature measurement time was set to 50 min at which the temperature converged in a preliminary test, and the temperature of the reflector surface was measured after 50 min. A fog lamp h8 of 12 V and 35 W was used as the target lamp, and 12 V was applied using a power supply (SPS-2415). K-type thermocouples were attached to measure the temperature distributions of the reflectors. They were attached to three internal positions and three external positions above the lamp where the highest temperatures were predicted in the simulation [
42]. This position was found to be the highest temperature, similar to the results predicted by infrared thermal camera (FLIR T620). A thermocouple was used for more accurate temperature measurement.
Figure 7 shows the results of measuring the temperature of the reflector surface using a thermal imaging camera. The results obtained by the thermal imaging camera were not well defined for the accurate measurement of the temperature. This was due to the curvature offered by the reflector surface and the reflection of the surface itself; however, the trend of the overall temperature of the reflector surface was confirmed.
Figure 8 shows the temperature measurement results of the reflectors made of PBT (0) and PA6 (60). The measurement started simultaneously when the bulbs were turned on, and the measurement speed was set to 2 s. It was found that the temperature stabilized approximately 20 min after the start of the test.
Figure 9 shows the temperatures of the reflectors made of PBT (0) and PA6 (60). FT2 in
Figure 9a is the position closest to the lamp and, thus, it is the hottest position. The maximum temperature of the PBT reflector was 95.6 °C and that of the PA6 (60) reflector was 88.7 °C, which confirms the temperature of the reflector made of conventional PBT was approximately 7 °C higher. This is the result caused by the difference in heat transfer between the materials. Moreover, it was found that PA6 exhibited relatively higher temperatures at FT1 and FT3.
As PA6 (60) has higher thermal conductivity than PBT, it can be estimated that more heat transfer from FT2 increased the temperatures. While the difference between the maximum and minimum temperatures was approximately 32 °C for PBT, it was approximately 23 °C for PA6 (60).
Figure 9b shows the temperatures measured at three points outside the reflectors. The maximum temperature was observed at the position of BT2, and the value was 74.4 °C for the PBT reflector and 77 °C for the PA6 (60) reflector.
Among the temperatures behind the PBT reflector, those of BT1 and BT3 were 55.1 and 54.8 °C, respectively, indicating no significant temperature change. In the case of the PA6 (60) reflector, however, the temperatures rose to 60 and 64.8 °C, respectively. This appears to be because the temperature of the bulb was well transferred to the back of the reflector owing to the thermal conductivity of the material applied to the reflector. Therefore, the PA6 (60) reflector exhibited higher temperatures at all three points behind the reflector. This also appears to be because the internal temperature was transferred to the surroundings due to the relatively higher thermal conductivity of the PA6 (60) reflector.
The temperature deviation behind the reflector was measured to be 20 °C for PBT and 17 °C for PA6 (60). Moreover, when the temperatures of FT2 and BT2 were compared for each specimen, the temperature difference was 21.2 °C for PBT and 11.7 °C for PA6 (60). The analysis of the temperatures of the reflector surface revealed that the reflector made of PA6 (60) exhibited a lower maximum temperature and a reduction in temperature deviation for each section caused a high thermal conductivity compared to the reflector made of conventional PBT.
5. Conclusions
In this study, the mechanical, thermal, and morphological characteristics of polymer matrix composites containing alumina according to the alumina content were compared for their application to automotive lamp reflectors, and their flowability and injection moldability were analyzed. A fog lamp reflector was fabricated through injection molding using PA6 (60) selected based on the analysis results, and it was compared with the conventional PBT reflector to verify its applicability.
Owing to the alumina filler added to the polymers for thermal conductivity improvement, the thermal conductivity was clearly improved even though some of the mechanical characteristics of the polymers were degraded.
As for the injection ability of the polymer composites, the flowability decreased as the alumina content increased, and the injection ability of PBT was found to be significantly lower than that of PA6.
To analyze the applicability of the selected composites to the reflector, fog lamps were fabricated through injection molding using PBT, which is used in existing fog lamps, and the selected PA6 (60), and they were tested under conditions similar to the actual lamp use conditions. The test results confirmed that PA6 (60) reduced the maximum temperature and transferred heat well to the surroundings compared to the existing reflector.
Author Contributions
Y.S.K., J.K.K., S.J.N., and E.S.J. conceived and designed the experiments; Y.S.K., J.K.K., S.J.N., and E.S.J. performed the experiments; Y.S.K., J.K.K., S.J.N., and E.S.J. analyzed the data; Y.S.K., J.K.K., S.J.N., and E.S.J. contributed reagents/materials/analysis tools; Y.S.K., J.K.K., S.J.N., and E.S.J. wrote the paper.
Funding
This research was supported by the Ministry of Trade, Industry, and Energy, Korea Institute for Advancement of Technology through the Encouragement Program for the Industries of Economic Cooperation Region (P0006067).
Conflicts of Interest
The authors declare no conflict of interest.
References
- Dong, K.; Donguk, K.; Mirae, K.; Jaemyeong, L.; Ikhee, J.; Kyuchul, R.; Kyung, K. Velocity field measurement on natural convection inside an automotive headlamp using time-resolved stereoscopic particle image velocimetry. Int. J. Heat Fluid Fl. 2019, 77, 19–30. [Google Scholar] [CrossRef]
- Yoshihiro, O.; Takahide, N.; Takaki, N. CFD analysis of the flow in an automotive headlamp. JSAE Rev. 2002, 23, 95–100. [Google Scholar] [CrossRef]
- Kim, Y.S.; Na, S.J.; Jeon, E.S. Optimal plate-fin design for improving heat dissipation performance of automobile lamp reflectors. IJMET 2019, 10, 1170–1181. [Google Scholar]
- Sung, K.W. A study of the roust degradation model by analyzing the filament lamp degradation data. Trans. Korean Soc. Auto. Eng. 2012, 20, 132–139. [Google Scholar]
- Michael, B.; Srilakshmi, L.; Joseph, K.; Tanya, L.; Kenneth, G.; Jesse, T. Optimizing the design of composite phase change materials for high thermal power density. J. Appl. Phys. 2018, 124, 1–13. [Google Scholar]
- Mitschang, P.; Hildebrandt, K. 8—Polymer and composite moulding technologies for automotive applications. In Advanced Materials in Automotive Engineering; Woodhead Publishing: Sawston, UK, 2012; pp. 210–229. [Google Scholar]
- Shih, C.; Liu, G. Optimal Design Methodology of Plate-Fin Heat Sinks for Electronic Cooling Using Entropy Generation Strategy. IEEE Trans. Compon. Packag. Technol. 2004, 27, 551–559. [Google Scholar] [CrossRef]
- Leontiev, A.P.; Roslyakov, I.V.; Napolskii, K.S. Complex influence of temperature on oxalic acid anodizing of aluminium. Electrochim. Acta 2019, 319, 88–94. [Google Scholar] [CrossRef]
- Kozhukhova, A.E.; du Preez, S.P.; Bessarabov, D.G. Preparation of anodized aluminium oxide at high temperatures using low purity aluminium (Al6082). Surf. Coat. Technol. 2019, 378, 124970. [Google Scholar] [CrossRef]
- Karsli, N.G.; Ozkan, C.; Aytac, A.; Deniz, V. Eects of sizing materials on the properties of carbon fiber-reinforced polyamide 6,6 composites. Polym. Compos. 2013, 34, 1583–1590. [Google Scholar] [CrossRef]
- Eyob, W.; Zelalem, L.; Jooheon, K. Thermal conductivity and mechanical properties of thermoplastic polyurethane-/silane-modified Al2O3 composite fabricated via melt compounding. Polymers 2019, 11, 1103. [Google Scholar]
- Ahmed, M.; Leif, S.; Dieter, M.; Gerhard, Z. Eect of extruder elements on fiber dimensions and mechanical properties of Bast natural fiber polypropylene composites. J. Appl. Polym. Sci. 2014, 131, 1–15. [Google Scholar]
- Tan, Y.; Wang, X.; Wu, D. Preparation, microstructures, and properties of long-glass-fiber-reinforced thermoplastic composites based on polycarbonate/poly(butylene terephthalate) alloys. J. Reinf. Pastics Cinoisutes 2015, 34, 1804–1820. [Google Scholar] [CrossRef]
- Jinho, H.; Dong, P.; Sang, S. A Review on Thermal Conductivity of Polymer Composites Using Carbon-Based Fillers: Carbon Nanotubes and Carbon Fibers. Carbon Lett. 2010, 11, 347–356. [Google Scholar]
- Ismail, M. Mechanical Properties of Composite Materials Reinforced with Short Random Glass Fibers and Ceramics Particles. Int. J. Sci. Technol. Res. 2018, 7, 50–53. [Google Scholar]
- Abraham, R.; Thomas, S.; Kuryan, S.; Isac, J.; Varughese, K.; Thomas, S. Mechanical properties of ceramic-polymer nanocomposites. Express Polym. Lett. 2009, 3, 177–189. [Google Scholar] [CrossRef]
- Hongyu, C.; Valeriy, G.; Jian, Y.; Yunfeng, Y.; Wei, L.; Yan, H.; Libo, D.; Bin, C. Thermal conductivity of polymer-based composites: Fundamentals and applications. Prog. Polym. Sci. 2016, 59, 41–85. [Google Scholar]
- Ng, Y.; Lu, X.; Lau, K. Thermal Conductivity, Electrical Resistivity, Mechanical, and Rheological Properties of Thermoplastic Composites Filled with Boron Nitride and Carbon Fiber. Polym. Comp. 2005, 26, 66–73. [Google Scholar] [CrossRef]
- Centea, T.; Grunenfelder, L.K.; Nutt, S.R. A review of out-of-autoclave prepregs—Material properties, process phenomena, and manufacturing considerations. Compos. A Appl. Sci. Manuf. 2015, 70, 132–154. [Google Scholar] [CrossRef]
- He, D.; Salem, D.; Cinquin, J.; Piau, G.-P.; Bai, J. Impact of the spatial distribution of high content of carbon nanotubes on the electrical conductivity of glass fiber fabrics/epoxy composites fabricated by RTM technique. Compos. Sci. Technol. 2017, 147, 107–115. [Google Scholar] [CrossRef]
- Kim, D.-H.; Lee, W.I.; Friedrich, K. A model for a thermoplastic pultrusion process using commingled yarns. Compos. Sci. Technol. 2001, 61, 1065–1077. [Google Scholar] [CrossRef]
- Hettiarachchi, H.A.C.K.; Mampearachchi, W.K. Effect of vibration frequency, size ratio and large particle volume fraction on packing density of binary spherical mixtures. Powder Technol. 2018, 336, 150–160. [Google Scholar] [CrossRef]
- Kwan, A.K.H.; Chan, K.W.; Wong, V. A 3-parameter particle packing model incorporating the wedging effect. Powder Technol. 2013, 237, 172–179. [Google Scholar] [CrossRef]
- Chena, C.; Xueb, Y.; Lib, X.; Wenb, Y.; Liub, J.; Xueb, Z.; Shia, D.; Zhoub, X.; Xieb, X.; Maib, Y.-W. High-performance epoxy/binary spherical alumina composite as underfill material for electronic packaging. Comp. Part A Appl. Sci. Manuf. 2019, 118, 67–74. [Google Scholar] [CrossRef]
- ASTM E1461-13, Standard Test Method for Thermal Diffusivity by the Flash Method. Available online: https://www.astm.org/Standards/E1461.htm (accessed on 25 October 2019).
- ASTM D638-14, Standard Test Method for Tensile Properties of Plastics. Available online: https://www.astm.org/Standards/D638 (accessed on 25 October 2019).
- ASTM D790-17, Standard Test Method for Flexural Properties of Unreinforced and Reinforces Plastics and Electrical Insulating Materials. Available online: https://www.astm.org/Standards/D790.htm (accessed on 25 October 2019).
- ASTM D256-10, Standard Test Methods for Determining the Izod Pendulum Impact Resistance of Plastics. Available online: https://www.astm.org/Standards/D256 (accessed on 25 October 2019).
- ASTM D1238-13, Standard Test Method for Melt Flow Rates of Thermoplastics by Extrusion Plastometer. Available online: https://www.astm.org/Standards/D1238 (accessed on 25 October 2019).
- ASTM D 3123-09, Spiral Flow of Low-Pressure Thermosetting Molding Compounds. Available online: https://www.astm.org/Standards/D3123.htm (accessed on 25 October 2019).
- Seong, D.G.; Kang, C.; Pak, S.Y.; Kim, C.H.; Song, Y.S. Influence of fiber length and its distribution in three phase poly(propylene) composites. Compos. Part B 2019, 168, 218–225. [Google Scholar] [CrossRef]
- Illers, H. Polymorphie, kristallinität und schmelzwärme von poly(e-caprolactam), 2. Makromol. Chem. 1978, 179, 497–507. [Google Scholar] [CrossRef]
- Ozkoc, G.; Bayram, G.; Bayramlı, E. Short glass fiber reinforced ABS and ABS/PA6 composites: Processing and characterization. Polym. Compos. 2005, 26, 745–755. [Google Scholar] [CrossRef]
- Fu, S.Y.; Lauke, B.; Mader, E.; Hu, X.; Yue, C.Y. Tensile properties of short-glass-fiber and short-carbon-fiber-reinforced polypropylene composites. Compos. Part A Appl. Sci. Manuf. 2000, 31, 1117–1125. [Google Scholar] [CrossRef]
- Kim, Y.S.; Kim, J.K.; Jeon, E.S. Effect of the compounding conditions of polyamide 6, carbon fiber, and Al2O3 on the mechanical and thermal properties of the composite polymer. Materials 2019, 12, 3047. [Google Scholar] [CrossRef]
- Ebadi-Dehaghani, H.; Nazempour, M. Thermal conductivity of nanoparticles filled polymers. In Smart Nanoparticles Technology; IntechOpen: Rijeka, Croatia, 2012; pp. 519–540. Available online: http://www.intechopen.com/books/smart-nanoparticles-technology/thermal-conductivity-ofnanoparticles-filled-polymers- (accessed on 25 October 2019).
- Wuyan, S.; Xiaoxiang, H.; Yao, H.; Xiaolong, G.; Xiuting, Z.; Xupeng, Z.; Chong, L.; Fengchun, S.; Daming, W. Polydimethylsiloxane/aluminum oxide composites prepared by spatial confining forced network assembly for heat conduction and dissipation. RSC Adv. 2018, 8, 36007–36014. [Google Scholar]
- Hu, J.; Huang, Y.; Yao, Y. Polymer composite with improved thermal conductivity by constructing a Hierarchically ordered three-dimensional interconnected network of BN. ACS Appl. Mater. Interfaces 2017, 9, 13544–13553. [Google Scholar] [CrossRef] [PubMed]
- Dylan, J.; Boon, P.; Jean, P.; Amar, M.; Manjusri, M. Synergistic thermo-oxidative maleation of PA11 as compatibilization strategy for PA6 and PBT blend. Polymer 2019, 179, 121594. [Google Scholar] [CrossRef]
- Parvinzadeh Gashti, M.; Alimohammadi, F.; Shamei, A. Preparation of water-repellent cellulose fibers using a polycarboxylic acid/hydrophobic silica nanocomposite coating. Surf. Coat. Technol. 2012, 206, 3208–3215. [Google Scholar] [CrossRef]
- Mazeyar, P.; Roozbeh, H.; Mahyar, P. Morphological, optical and electromagnetic characterization of polybutylenem terephthalate/silica nanocomposites. Fiber. Polym. 2013, 14, 1324–1331. [Google Scholar]
- Jae, K.; Young, K.; Euy, J. Thermal Analysis of Thermal Conductivity of Headlamp Reflectors. Int. J. Appl. Eng. Res. 2017, 12, 15107–15111. [Google Scholar]
Figure 1.
Spiral lengths of the PBT and PA6 compounds according to the Al2O3 content (a) PBT (0): 440 mm, (b) PBT (60): 400 mm, (c) PA6 (0): 385 mm, (d) PA6 (50): 340 mm, (e) PA6 (60): 315 mm, (f) PA6 (70): 297 mm.
Figure 1.
Spiral lengths of the PBT and PA6 compounds according to the Al2O3 content (a) PBT (0): 440 mm, (b) PBT (60): 400 mm, (c) PA6 (0): 385 mm, (d) PA6 (50): 340 mm, (e) PA6 (60): 315 mm, (f) PA6 (70): 297 mm.
Figure 2.
Injection results of (a) PBT (60) and (b) PA6 (60).
Figure 2.
Injection results of (a) PBT (60) and (b) PA6 (60).
Figure 3.
Thermal weight decomposition and derivative thermograms of the various composites.
Figure 3.
Thermal weight decomposition and derivative thermograms of the various composites.
Figure 4.
SEM images of raw materials (a) PBT; (b) PA6; (c) Al2O3.
Figure 4.
SEM images of raw materials (a) PBT; (b) PA6; (c) Al2O3.
Figure 5.
SEM images of the reinforced composites with various ratios. (a) PA6 (50); (b) PA6 (60); (c) PA6 (70); (d) PBT (60).
Figure 5.
SEM images of the reinforced composites with various ratios. (a) PA6 (50); (b) PA6 (60); (c) PA6 (70); (d) PBT (60).
Figure 6.
Experimental setup for reflector temperature measurement, (a) reflector temperature measurement positions; (b) device setup.
Figure 6.
Experimental setup for reflector temperature measurement, (a) reflector temperature measurement positions; (b) device setup.
Figure 7.
Temperature distribution on reflector surface measured using a thermal imaging camera.
Figure 7.
Temperature distribution on reflector surface measured using a thermal imaging camera.
Figure 8.
Reflector temperature measurement results over time: (a) temperature distribution of the PBT reflector, (b) temperature distribution of the reflector made of PA6-based composites.
Figure 8.
Reflector temperature measurement results over time: (a) temperature distribution of the PBT reflector, (b) temperature distribution of the reflector made of PA6-based composites.
Figure 9.
Internal and external temperatures of the reflectors. (a) Internal temperatures, (b) external temperatures.
Figure 9.
Internal and external temperatures of the reflectors. (a) Internal temperatures, (b) external temperatures.
Table 1.
Content of PBT, PA6, and Al2O3 used for the preparation of polymer blends.
Table 1.
Content of PBT, PA6, and Al2O3 used for the preparation of polymer blends.
| Sample Designation | Composition (wt.%) |
|---|
| PBT | PA6 | Al2O3 |
|---|
| PBT (0) | 100 | | 0 |
| PBT (60) | 40 | | 60 |
| PA6 (0) | | 100 | 0 |
| PA6 (50) | | 50 | 10 |
| PA6 (60) | | 40 | 60 |
| PA6 (70) | | 30 | 70 |
Table 2.
Mechanical properties of PA6/PBT/Al2O3 composites with different weight ratios.
Table 2.
Mechanical properties of PA6/PBT/Al2O3 composites with different weight ratios.
| Parameters of Compounding Process | Tensile Strength (MPa) | Elongation (%) | Flexural Strength (MPa) | Impact Strength (kJ/m2) |
|---|
| PBT (0) | 66.7 | 250 | 93.2 | 2.5 |
| PBT (60) | 14.2 | 0.58 | 41.6 | - |
| PA6 (0) | 72.2 | 216 | 95.6 | 2.9 |
| PA6 (50) | 65.9 | 1.8 | 114.8 | 3.6 |
| PA6 (60) | 60.5 | 1.3 | 100.4 | 3.3 |
| PA6 (70) | 61.8 | 1.0 | 95.6 | 3.0 |
Table 3.
Thermal conductivity of PBT, PA6, and Al2O3 composites.
Table 3.
Thermal conductivity of PBT, PA6, and Al2O3 composites.
| Sample Designation | Thermal Conductivity (W/mK) |
|---|
| PBT (0) | 0.29 |
| PBT (60) | 1.21 |
| PA6 (0) | 0.25 |
| PA6 (50) | 0.425 |
| PA6 (60) | 1.13 |
| PA6 (70) | 1.163 |
Table 4.
Flow characteristics of PA6/PBT/Al2O3 composites with different weight ratios.
Table 4.
Flow characteristics of PA6/PBT/Al2O3 composites with different weight ratios.
| Parameters of Compounding Process | Melt Flow Rates (g/10 min) | Spiral Length (mm) |
|---|
| PBT (0) | 80 | 440 |
| PBT (60) | 68.5 | 400 |
| PA6 (0) | 63.0 | 385 |
| PA6 (50) | 50.4 | 340 |
| PA6 (60) | 46.2 | 315 |
| PA6 (70) | 36.0 | 297 |
© 2019 by the authors. Licensee MDPI, Basel, Switzerland. This article is an open access article distributed under the terms and conditions of the Creative Commons Attribution (CC BY) license (http://creativecommons.org/licenses/by/4.0/).


