Abstract
The use of rocks containing high amounts of natural zeolites (zeolitites) as soil amendment has been found as a valuable method for increasing agriculture sustainability. However, the potentialities and the effects of zeolitites on the biogeochemical cycles of nitrogen (N) and carbon (C) have still not been clearly addressed in the literature. The objective of this study was therefore to investigate the N and C pools and 15N distribution in an agricultural soil amended with both natural and NH4+-enriched zeolitites with the aim of understanding their effects on the soil-plant system, during sorghum cultivation, under fertilization reductions. Zeolitites were applied to an agricultural soil both at natural state (5 and 15 kg m−2) and in an enriched state with NH4+ ions from pig slurry (7 kg m−2). Both zeolitites at natural and enriched state increased soil cation exchange capacity and affected microbial biomass, causing an initial decrease of microbial C and N and then a possible increase of fungal population. N-NO3− content was lower in natural zeolitite treatments, that lead to a lower NO3− availability for denitrifying bacteria. Zeolitites slightly affected the fixed N-NH4+ pool. δ15N turnover indicated that N from NH4+-enriched zeolitites remained in the soil until the growing season and that fertilizers partially substituted the fixed pool. Leaf δ15N content indicated that plants assimilated N from NH4+-enriched zeolitites and evidenced a higher fertilization recovery in natural zeolitite treatments. Organic C tended to be higher in all zeolitite treatment rhizospheres. In soils amended with zeolitites at natural state (at both application rates) sorghum yield was similar (+3.7%) to that obtained in the control while it was higher (+13.9%) in the plot amended with NH4+-enriched zeolitites.
1. Introduction
The intensification of agricultural and zootechnical technology has brought food production to a high cost in terms of environmental quality [1,2,3,4]. The large use of fertilizers, as well as the need to apply manure, increase nutrients leaching and runoff risk to ground and surface water (e.g., eutrophication), soil desertification, biodiversity reduction and to an increase in greenhouse gases production (e.g., NH3, N2O, CO2) [4,5].
In this respect, natural zeolitites (NZ), particularly those containing clinoptilolite and chabazite, have been widely used in agriculture and horticulture. Zeolitites are rocks containing more than 50% of zeolites [6], hydrated minerals capable of binding NH4+ from solutions in their extra-framework sites, preventing NH4+ leaching by rainfalls and/or irrigation. In this way, zeolitites can increase nitrogen use efficiency (NUE) and behave as slow-releasing fertilizers, resulting in a more sustainable agriculture, where the amount of fertilizers can be decreased without lowering the production yield [6,7,8,9,10,11,12]. Due to their physic-chemical characteristics, zeolitites can be used as soil conditioners, carriers of fertilizers, antibacterial agents, insecticides, pesticides, as enhancer of soil biological activity and additional reducer of the Sodium Adsorption Ratio (SAR) index [13,14,15,16,17,18,19]. A yield increases of up to 65% in several crops (sorghum, wheat, corn, rice, marrow, chard, basil, tomato, radish, watermelon, lettuce, sunflower) in soils amended with natural or NH4+-enriched zeolitite (NEZ) were reported by several studies [6,20,21]. Analogously, Reháková et al. [14] found an increase of roots biomass in parsley (Petroselinum satilvum), carrots (Daucus carota), and onions (Allium cepa). The same authors detected an increase in strawberry (Senga sengana) yield and green biomass of 70% and 49%; respectively, when natural zeolitite was applied as fertilizer. The aforementioned studies provide very important and useful information regarding the beneficial effects obtained using NZ in terms of crop yield, environmental protection (reduction of nitrate leaching) and water use efficiency. Notwithstanding these promising results, a detailed study on the N and C pools dynamics in a zeolitite-amended field is still lacking.
The implementation of the Water Framework Directive (2000/60/EC) and the Nitrate Directive (91/976/EEC) led to the designation of large areas vulnerable to nitrate pollution (Nitrate Vulnerable Zone, NVZ) such as the Ferrara Province (Emilia Romagna, Italy). It lays at the end of the Po Plain where the intensive agricultural practices of the entire Emilia-Romagna are conveyed. The high number of breeding farms located on this territory and the consolidate agricultural practice of animal slurry spreading (liquid mixture of urine, water and feces), increases N2O emission by nitrification/denitrification and NO3− leaching, further emphasizing the vulnerability of this province [22].
In this framework, ZeoLIFE project (LIFE10+ ENV/IT/00321) was conceived to test different zeolitite treatments (ZT) at the field scale aiming at reducing the input of N from fertilizers and the irrigation water in agriculture. This project exploits the high cation exchange capacity (CEC) of this material by up-taking NH4+ from pig slurry using an especially designed prototype tank [23] or, alternatively, from chemical fertilizers directly in the field after addition to the soil [24].
The current scientific literature lacks field studies in which a detailed investigation of the dynamics of N and C pools in soil modified with natural zeolitites was conducted. In this paper, we present a detailed study on the dynamics, of both organic and inorganic N and C pools in soils amended with NZ and NEZ (e.g., exchangeable and fixed NH4+ in clay interlayers, nitrate, microbial biomass N and C, total organic carbon and carbon in humic substances).
Conventional agricultural practices (plowing, application of chemical fertilizers and monocropping) were compared with those related to the innovative zeolitite methods. Non-amended soils (control) were compared with both NZ and NEZ amended soils (applied at different rates), over a cultivation cycle of sorghum (Sorghum vulgare Pers.). The main objectives of this work were therefore the following:
- (1)
- Evaluate how the addition of NZ and NEZ affects N and C pool dynamics in the soil-plant system over one agronomic year;
- (2)
- Determine if the use of NZ or NEZ can allow a reduction in the application of chemical fertilizers to soil;
- (3)
- Determine if the use of NZ or NEZ have beneficial effects on crop yield.
Considering the global need of improving agricultural sustainability and reducing environmental pollution, this work may help to unveil the potential of these methodologies.
2. Materials and Methods
2.1. Zeolitites
The natural K-rich, Na-poor zeolitite used in this study is a byproduct from a quarry located near Sorano village (Italy, Grosseto province) (Figure 1, 42°41′20.65″ N; 11°44′26.29″ E) that is mainly exploited to obtain blocks and bricks for construction and gardening. It is a low-cost, natural and eco-friendly granular by-product of the quarrying activity, part of a large zeolitized pyroclastic deposit whose total zeolitic content is on average 70% (chabazite, 68.5%; Phillipsite, 1.8%; Analcime, 0.6%; [10]). The total CEC of the zeolitite is 2170 mmol kg−1, of which 1460 are due to Ca2+, 600 to K+, 70 to Na+ and 40 to Mg2+. The dry bulk density and water retention vary with grain size from 870 kg m−3 and 48.4% for Ø <3 mm to 560 kg m−3 and 34.2% for Ø 3–6 mm, respectively.

Figure 1.
Location of the exploited zeolitite quarry and ZeoLIFE experimental field.
The grain size distribution of the employed zeolitites are reported in Figure 2. Part of the NZ was subjected to an enrichment process, which allowed the saturation of the zeolitite with NH4+, creating the NEZ. The enrichment process was carried out by static mode in a prototype tank where the zeolitite is mechanically mixed with pig slurry (average NH4+ content of 2000 mg L−1) at specific solid/liquid ratio, stirring and resting times, gaining between 400 and 800 mmol of NH4+ per kg of material [23]. N and C pools of this material are reported in Table 1.

Figure 2.
Particle size analysis of the employed zeolitites.

Table 1.
Average N and C pools of NH4+-enriched zeolitite (NEZ). Standard deviation within brackets.
2.2. Experimental Field Setting
The experimental field is located near Codigoro town (Italy), 40 km eastward of Ferrara (Figure 1, 44°50’33’’ N and 12°05’45’’ E) and 15 km from the Adriatic Sea in a reclaimed area at an average altitude of 3 m below sea level. The average daytime temperatures ranges from 3°C in January and 25 °C in July and the marine thermoregulation generally maintains the minima over zero, reducing the number of night frosts. The average rainfall is between 500 and 700 mm per year, representing the regional pluviometric minimum with peaks in autumn and summer (sub-continental climate).
The area belongs to the eastern Po River plain, where ancient interdistributary bays and brackish marshes were recently (1860–1960) reclaimed [25,26]. The soil of the experimental field belongs to the cartographic unit FOR1-LCO1 of the Emilia Romagna 1:50,000 Soil Map (www.regione.emiliaromagna.it), and consisting of recent interfluvial silty-clay deposits classifiable as Calcaric Gleyic Cambisol [26,27]. The average grain size of the upper soil horizon is constituted by 0.6 ± 0.1% of medium sand (200–630 µm), 7.4 ± 0.3% of fine sand (63–200 µm), 49.2 ± 3.1 of silt (2–63 µm) and 42.0 ± 3.4% of clay (<2 µm) [28]. The average organic matter content is 8.1 ± 1.5%, hydraulic conductivity of the soil is 1.7 ± 2.4 m day−1 while the average bulk density is 1.15 ± 0.05 kg m−3 [28]. The upper soil horizon is also generally well drained due to the presence of a sub-surface drainage system at −1 m.b.g.l. Soil mineralogical composition is characterized by quartz, feldspar, calcite and clay minerals (illite, smectite, clorite, serpentine and mixed-layer) [10].
The experimental field was parceled in order to compare the different zeolitite treatments with the traditional practices. The parcels were designed linear and continuous in order to facilitate the movements of farm machines. In each parcel, three different sub-parcels were considered to consider inter parcel variability and to have statistical significance. One parcel (0.5 ha) was amended with 7 kg m−2 (7CZ) of NEZ (Ø < 3mm); two parcels (1 ha each) were amended with 5 (5NZ) and 15 (15NZ) kg m−2 of coarse-grained (Ø 3–6mm) NZ, respectively, and 3.5 ha were used as control (CNTR). The smaller size of 7CZ parcel was due to the long time required to produce the NEZ using the “ZeoLIFE” prototype tank [23,24], which has a limited production rate of about 250 kg day−1. Addition and spreading into the field of NZ and NEZ were carried out between October 7th and November 6th, 2012. NEZ supplied approximately 410 kg N ha−1 in the 7CZ parcel. Immediately after spreading, the field was ploughed and the zeolitite was located until an approximate depth of 30–40 cm. According to ZeoLIFE plan, in the first year of field experiment, sorghum (Sorghum vulgare Pers.) was sowed on May, 9th, 2013. Nitrogen fertilizers were distributed in two steps: di-ammonium phosphate during the sowing, with an application of 21.6 kg N ha−1 in all parcels and urea on June 3rd, 2013, with different doses in the various parcels. In the CNTR parcel, an average of 170 (±16) kg N ha−1 were supplied, while a reduction of approximately 30% and 50% of urea in NZ (both 5NZ and 15NZ for 122 and 127 kg N ha−1, respectively) and NEZ parcels (81 kg N ha−1) was applied, respectively. Harvest occurred in September, 23rd, and the yield was separately evaluated for each treatment.
2.3. Soil and Plant Sampling
A total of 60 soil samples (from 0 to 30 cm depth) were collected in the three sub-parcels for each treatment by manual drilling using an Ejielkamp Agrisearch auger. Soil samplings were carried out in four periods of the agronomical year: (1) November 2012 (Nov-2012), after the zeolitite application; (2) May 2013 (May-2013), before sowing and the first fertilization; (3) June 2013 (Jun-2013), after the urea addition; (4) September 2013 (Sep-2013), at the harvest. Soil samples collected at the harvest were subdivided in bulk soil and rhizosphere. The rhizosphere was separated by gently shaking the plant roots. Three representative plants from each treatment and each sub-parcel were sampled during the harvest; each plant was subdivided in roots, stems, leaves and panicles that were subsequently dried at 50 °C and milled (total of 48 samples).
2.4. Analytical Techniques
CEC and exchangeable bases were determined using the Co(NH3)6Cl3 method [29,30] on both bulk soil and rhizosphere samples collected in Sep-2013, pH was determined on 1:5 (w:v) extracts using a pH-meter, while carbonate content was determined using the volumetric method. Total nitrogen (TN) and organic C (TOC) of soil and plant samples were determined by an elemental CHNS-O EA 1110 Thermo Fisher Scientific analyzer coupled with mass spectrometry (Delta Plus, Finnegan, Thermo-Fisher). Soil samples were weighted in silver pots and treated with HCl to eliminate the inorganic C, while plant samples were weighted in tin pots. 15N natural abundance was measured in total and fixed nitrogen pools (TN and Fix N-NH4+) and in sorghum organs; the natural abundance was expressed in δ‰ (Equation (1); [31]), where δ represents the difference from the standard atmospheric N2 (0.3663% 15N):
To evaluate the influence of the N source on the plant N isotopic signature, mixing lines were built between each end-member represented by soil, NEZ and urea.
NO3− was extracted with Milli-Q (Millipore USA) water in a 1:5 (w/v) ratio, the solution was shaken for 1 hour and then filtered. NO3− was determined by ion chromatography using an isocratic dual pump ion chromatography ICS-1000 Dionex. An AS-40 Dionex auto sampler was employed to run the analysis; Quality Control (QC) samples were run every 10 samples and the standard deviation for all QC samples was better than 4%.
Exchangeable N-NH4+ was extracted with 1M KCl in a 1:10 (w/v) ratio, the solution was shaken for 1 hour and then filtered. The solution was diluted and analyzed with an Ion Selective Electrode (ISE) Orion 95-12 connected to a Thermo Fisher Orion 4star pH-ISE benchtop. Interferences with Cl− and K+ were verified and excluded by comparing measurement made with NH4Cl, CH3COONH4 + 1M KCl and CH3COONH4 + H2O standard solutions.
After the elimination of organic and exchangeable N, fixed N-NH4+ (Fix N-NH4+) was determined by adding 20 mL of KBrO to 2 g of air-dried soil samples in two replicates. After 2 hours, 40 mL of distilled water was added and a heating cycle of 10 min in a microwave oven was applied. Then, 20 mL of Milli-Q H2O was added and samples were left still for 24 hours. Finally, samples were centrifuged at 5000 rpm for 10 min and washed 2 times with 0.5 M KCl and analyzed by elemental analysis for the evaluation of TN and δ15N [32].
Total extractable carbon (TEC) was obtained adding 100 mL of 0.1 M NaOH + 0.1 M NaP2O7·10H2O to 10 g of air-dried soil. The solution was left in a Dubnoff bath at 60°C for 24 hours and then centrifuged at 6600 rpm for 15 min and filtered at 0.45 mm (Millipore). Part of this solution was acidified with HCl 1:1 to reach pH < 2 to allow the precipitation of Humic Acids (HA), which were separated after centrifugation at 7000 rpm for 25 min by the Non-Humic-Substances (NHS) and Fulvic Acids (FA). The separation of FA from NHS was performed by solid chromatography using a polyvinylpyrrolidone (PVP) polymer in acid ambient, which allows the retention of FA on the PVP and lets NHS pass through the column. The FA was then recovered by bringing the pH of the column to alkaline values with 0.5 M NaOH. The evaluation of C contained in TEC, HA and FA was obtained by reverse titration with 0.2 N Fe2SO4 after oxidation of the C contained in the sample to CO2 adding 5 mL of 1 N K2Cr2O7 + 20 mL of H2SO4 and heating at 150 °C for 10 min [33]. The C extraction was carried out on one replicate.
Humification Index (HI) and Humification Degree (HD) were calculated as the ratio of C contained into NHS divided by the C contained into Humic Substances (HS) and as the ratio between HS and TEC expressed as percentage respectively (Equations (2) and (3), [33,34]).
where HI is the Humification Index, DH is the Humification Degree, TEC is Total Extractable C, HA is Humic Acids and FA are Fulvic Acids.
C and N immobilized by microbial biomass (Cmic and Nmic) were obtained by the chloroform fumigation-extraction method [35]. Following this, 10 g of soil samples in four replicates were humidified until 60% of water holding capacity (WHC) and incubated at room temperature for 1 week at constant WHC. After this period, two replicates were extracted with 0.5 M K2SO4, representing the non-fumigate sample (NF). On the other two samples, CHCl3 was added in a closed drier equipped with a void pump to allow CHCl3 volatilization at room temperature. In these fumigate (F) samples the presence of CHCl3 atmosphere guarantees the death of the microbial biomass and allows release of the immobilized C and N after the same extraction with 0.5 M K2SO4 performed for NF. After the extraction, both NF and F samples were analyzed with a Shimadzu Total Organic Carbon Analyser TOC-V CPN coupled with a TN unit (TNM-1). Sorghum harvest was carried out with a harvester and the total yield of each parcel was weighted separately directly in the farm using the local vehicle scale. It was not possible to harvest separately the three sub parcels of each treatment, as this practice would have required an excessive time and precision not compatible with the host farm agricultural practices.
2.5. Statistical Analysis
At least three replicates per treatments have been analyzed at each sampling point to have statistical significance. For evaluating significant differences between the treatments, parametric statistic was applied to the dataset. Two-Way ANOVA was employed (after verifying normality of data distribution with Shapiro-Wilk test) for testing significant differences within factors time and treatments and for testing interactions between factors (treatments*time). Successively, a series of One-Way ANOVA and Tukey (HSD) post-hoc pairwise multiple comparison tests were applied at each sapling time at “p” level of 0.05 using Sigmaplot 12.0. Correlation analyses were also performed (using Pearson coefficient “ρ”) in order to quantify linear associations between variables for each treatment.
3. Results
After the enrichment process with pig slurry, NEZ gains a total N load of 5.84 (± 0.90) g kg−1 (Table 1). Most of the N was present in the form of Exch N-NH4+, while Fix N-NH4+ is considerably lower. N-NO3− load is on average 148 mg kg−1 (the material is not washed after the treatment before the introduction into the soil system). NEZ is characterized by a very high Nmic and a low Cmic, resulting in a Cmic/Nmic ratio lower than 1. TOC content is quite low (10.3 g kg−1 on average) resulting in a low C/N. Soil pH was not affected by the addition of both NZ and NEZ (p > 0.05), remaining close to neutral values in all treatments (with exception of Jun-2013 where after urea addition an increase toward sub-alkaline values (p < 0.05), Figure 3). CEC increased significantly (p < 0.05) in the bulk soil of all ZT. Ca2+ and Mg2+ were the major exchangeable bases, followed by K+ and Na+, with the latter always higher in 7CZ than in the other treatments (Table 2). No significant differences were found between the various treatments regarding exchangeable K+ (p > 0.05), while Ca2+ and Mg2+ are generally higher in ZT, especially in the bulk soil with respect to the rhizosphere (p < 0.05).

Figure 3.
Mean soil pH for each treatment. Error bars represent standard deviation.
Table 2.
Average of exchangeable bases and cation exchange capacity (CEC) of soil samples, both bulk soil and rhizosphere. Standard deviation within brackets. Significant (p < 0.05) or non-significant (p > 0.05) differences between treatments at each sampling time are indicated by capital letters.
3.1. Nitrogen and Carbon Pools in Soil
Soil N pools significantly differed (p < 0.05) between the treatments and among the sampling times, with the exception of TN that shows significant differences among sampling times only (p < 0.05) (Table S1, Supplementary Materials). High TN were detected in Nov-2012 and Sep-2013, while a depletion was observed in May-2013 and Jun-2013.
Similar behavior is recorded for Fix N-NH4+ pool but in this case, all ZT shows slightly lower values (p < 0.05) in Nov-2012 with respect to the CNTR, while in Jun-2013 only 15NZ treatment is significantly lower (Table S1, Supplementary Materials). At the beginning of the experiment, N-NO3− content was significantly higher in the CNTR and 7CZ parcels than in those amended with NZ (5NZ and 15NZ, respectively) (p < 0.05). In May-2013 a general depletion of N-NO3− pool is noticed in all the treatments, increasing in Jun-2013 after urea addition especially in CNTR parcel. N-NO3− values of ZT (especially 5NZ and 15NZ) were remarkably lower in this period with respect to the CNTR (p < 0.05) (Table S1, Supplementary Materials). Exch N-NH4+ was significantly affected by NEZ addition in Nov-2012 (p < 0.05) (138 mg kg−1 vs 50 mg kg−1 of 7CZ and CNTR, respectively) while starting from May-2013 these differences completely disappeared (p > 0.05). In Jun-2013, there were no differences between the treatments (p > 0.05) while a relative enrichment of the bulk soil Exch N-NH4+ with respect to the rhizosphere was apparent in Sep-2013.
Generally, at the beginning of the experiment, all treatments showed a low Nmic content, following the order 7CZ > CNTR > 5NZ = 15NZ, suggesting that zeolitites differentially affected the Nmic pool. Nmic was increased by NEZ addition while it was decreased by NZ addition. The Nmic pool increases in May, while it decreases in June after the chemical fertilization; as expected, Nmic content in rhizospheric soil is higher than that determined in the bulk soil at the harvest (Table S1, Supplementary Materials). A remarkable increase of Cmic and Nmic and a contemporaneous decrease of N-NO3− in all the treatments was observed in May-2013 (Figure 4).
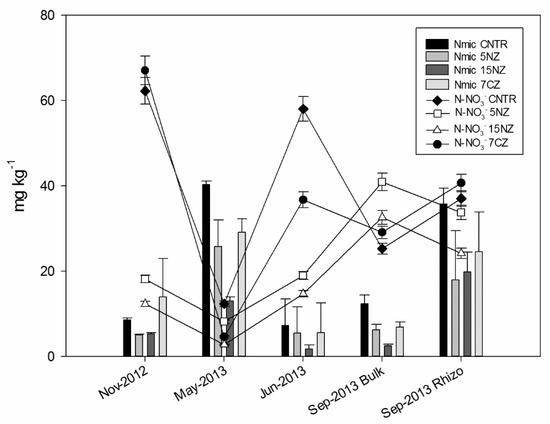
Figure 4.
Nmic (columns) and N-NO3− (lines) content of soil samples across the monitoring period.
During the monitored period, Cmic ranged from 16 to 432 mg kg−1. At the beginning of the experiment large differences (p < 0.05) were detected among the various treatments. In this period, Cmic content decreases following the order CNTR (148 mg kg−1) >15NZ (98.5 mg kg−1) > 7CZ (43.2 mg kg−1) > 5NZ (16.1 mg kg−1). In May-2013, Cmic increased in all treatments, except for 15NZ, and decreased again in Jun-2013. As expected, Cmic content in the rhizosphere is higher than that determined in the bulk soil. The average Cmic/Nmic ratio ranges from 3.3 to 94 (Figure 5). In Nov-2012, low values of Cmic/Nmic were observed in 5NZ and 7CZ treatments; concerning 5NZ, the low ratio is due to the lower Cmic with respect to the other treatments, while for 7CZ the low ratio may have been due to the high Nmic. All ZT have a higher Cmic/Nmic ratio than CNTR after May-2013 because of the lower Nmic; on average, Cmic/Nmic ratio increased in order of 15NZ > 5NZ > 7CZ > CNTR. TOC showed significant differences between the treatments and among the sampling times (p < 0.05). In particular, a depletion of TOC content was observed in 7CZ in Nov-2012 and in Jun-2013, after urea addition (Table S1, Supplementary Materials). As expected, TOC content in Sep-2013 was higher in rhizosphere than in the bulk soil and there was a significant correlation between TN and TOC (ρ = 0.83, p < 0.05). Soil C/N ratio showed significant differences among the treatments only at the beginning of the experiment because of the higher TN of 7CZ (p < 0.05), while during the rest of the monitored period, soil C/N ratio remained constant around 10 (Table S1, Supplementary Materials). HS C content was reported in Table 3. TEC content ranged from 8.3 to 19.2 g kg−1 (data not shown), whereas the extraction ratio ranged between 41 to 87%. Notably, the highest extraction ratio was observed in 15NZ parcel, followed by 5NZ. Generally, HA C content is higher than that determined in FA, with exception of 7CZ in Nov-2012, in which the FA/HA ratio is higher than 1. A low HI was generally recorded in all the treatments with the exception of 5NZ, where especially in May, June and Spet-2013 Bulk, HI increases through values above 0.5, highlighting a prevalence of NHS. The HD% generally varied between 30% and 50%, with the exception of 15NZ that showed large variations (from 27.8% in Nov-2012 to 68.2% in May-2013).

Figure 5.
Microbial biomass C/N ratio over the monitoring period.
Table 3.
C content of Humic Acids (HA) and Fulvic Acids (FA), percentage of Total Extractable and Total Organic Carbon (TEC/TOC) ratio, Humification Index (HI) and Humification Degree (HD) according to Ciavatta et al. [33] and Sequi et al. [34].
3.2. Total N and C Content in Sorghum Plant Components
No significant differences in TN and TOC content were detected in the sorghum organs (e.g., roots, stems, leaves and panicles) among the treatments (p > 0.05) (Table S2, Supplementary Materials). Generally, leaves and panicles had a higher TN content than roots and stems, while TOC was similar in all the plant organs, resulting in decline of the C/N ratio following the order stems > roots > panicles > leaves.
3.3. δ15N Natural Abundance in Soil and Sorghum Organs
TN and Fix N-NH4+ δ15N differs significantly (p < 0.05) among treatments and time (Table 4). At the beginning of the experiment (Nov-2012), 7CZ shows a remarkably higher isotopic signature (δ15N of 7.46‰ and 8.27‰ for TN and Fix N-NH4+, respectively) with respect to the other treatments (p < 0.05). Furthermore, without considering 7CZ treatment, Fix N-NH4+ pool showed a high δ15N variability (from 4.55‰ to 6.00‰) with respect to the TN pool (from 3.38‰ to 3.86‰). In May-2013, TN δ15N is still significantly higher (p < 0.05) in 7CZ treatment, while no significant differences were observed regarding Fix N-NH4+ pool. In Jun-2013 (after the chemical fertilization), all treatments showed a homogeneous δ15N in both TN and Fix N-NH4+ pools (p > 0.05). In Sep-2013, rhizosphere samples show higher δ15N with respect to the bulk soils in both TN and Fix N-NH4+ pools (especially in the latter). The isotopic signatures of NEZ, urea and di-ammonium phosphate were: +18.4 (± 0.5) ‰, −1.18 (± 0.06) ‰ and −0.89 (± 0.09) ‰, respectively (Table 5). Isotopic analysis on the harvested plants indicated that the δ15N of plant tissues was influenced by the different agricultural managements employed in the experimentation (Table 5). δ15N was significantly higher in 7CZ plants leaves and significantly lower in all 5NZ plants organs with respect to the CNTR plants (p < 0.05). In Figure 6, the TN vs δ15N of the different plants’ organs are plotted together with urea, NEZ and bulk soil. It is evident that the 7CZ leaves are strongly affected by NEZ contribution, while 5NZ plants are more influenced by a low δ15N N-source.
Table 4.
Average 15N natural abundance in soil N pools (TN and Fix N-NH4+). Standard deviation within brackets. Significant (p < 0.05) or non-significant (p > 0.05) differences between treatments at each sampling time are indicated by capital letters. “*” and “x” symbols indicates the presence or the absence, respectively, of a significant difference among the variables for Treatments and Time in the experiment period and correlating treatments with time (Treatment*Time).
Table 5.
Average 15N natural abundance in sorghum organs at the harvest. SD within brackets. Significant (p < 0.05) or non-significant (p > 0.05) differences between treatments for each organ are indicated by capital letters.

Figure 6.
δ15N vs total nitrogen (TN) mixing diagram for sorghum plant organs. Chemical fertilizers, NEZ and Soil have been chosen as end-members.
3.4. Sorghum Yield
The CNTR parcel returned a yield of 5818 kg ha−1. The two NZ returned 6032 kg ha−1 each, while 7CZ parcel gave 6627 kg ha−1. Compared with the CNTR, the three zeolitite-treated parcels gained from 3.7 to 13.9%, although the yield results are not statistically significant.
4. Discussion
As expected, CEC was generally higher in ZT with respect to the CNTR, especially in the bulk soil. Ozbahce et al. [36] and Gholamhoseini et al. [20] found a similar tendency after mixing zeolitite in the first 30 cm of soil or after the spreading in combination with cattle manure. Both bulk and rhizosphere soils in the 7CZ parcel showed higher exchangeable Na+ with respect to the other treatments, likely because of the NEZ enrichment process with pig slurry.
4.1. NEZ Influence on Soil N and C Pools.
4.1.1. NEZ Effects on N Pool Size and Isotopic Signature
The addition of NEZ into the soil (7CZ treatment) did not lead to significant differences in TN or Fix N-NH4+ content regardless the N input of about 410 kg of N ha−1 brought by NEZ introduction. On the other hand, this N input has clearly influenced Exch N-NH4+, N-NO3− and Nmic pools, increasing their size. Through the application of a simple mass balance equation, it was estimated that the increment in 7CZ Exch N-NH4+ pool corresponded to the amount of N introduced with NEZ in the first 30 cm of soil.
As it is known, NH4+-enriched zeolites can act as slow-released fertilizer [37,38,39] and in our experiment this behavior was clarified by the isotopic signature of the TN pool during the agricultural management. The δ15N increase of TN pool in 7CZ with respect to that found in the other treatments is in fact due to the N isotopic signature of the pig slurry contained into the NEZ. Dittert et al. [40] found a δ15N of 5.90‰ in agricultural soil treated with slurry while a δ15N of 3.90‰ was found in soils treated with inorganic fertilizers. Pig slurry usually has high δ15N values, as a result of the fractionation processes occurring during volatilization of NH3 after the excretion, which causes an enrichment in the heavier 15N atoms in the substrate (slurry) with respect to the product (ammonia gas) [40,41,42,43,44]. The significantly higher δ15N of TN in May-2013 suggested that a significant amount of N introduced with NEZ was still present in the soil before the sowing. At the beginning of the experimentation, the organic C cycle of 7CZ treatment was affected by the high N input provided by NEZ, resulting in a decrease of TOC content and C/N ratio; furthermore, an increase of FA fraction can be interpreted as an increase in depolymerization processes.
4.1.2. NEZ Specific Effects on Soil Microbial Biomass
On the other hand, Nmic increment in 7CZ parcel was not counterbalanced by a parallel Cmic increment, resulting in a strong decrease of the Cmic/Nmic and likely in an increase of organic matter (OM) mineralization processes [44]. No evidence of enhanced nitrification was observed in 7CZ parcel after the zeolitite spreading as N-NO3− content was very similar to the CNTR notwithstanding the large N input provided by NEZ spreading (with residual N-NO3− from the pig slurry treatment). The agronomic year before the experimental cultivation was low in precipitation and the drought caused low yield and accumulation of high amounts of N from fertilizers in the upper soil horizon, thus no differences were expected between CNTR and ZT. A possible explanation of this behavior is that controlled retention and release capacity of NH4+ contained in the microsite of the open-ring structure of the mineral. These ions are physically protected and likely less available to nitrifying bacteria (leading consequently to a lesser N-NO3− content in the pore-waters) [45,46,47,48]. This hypothesis is plausible but not supported by a direct measurement of gross nitrification rates (e.g., by the mean of 15N pool dilution technique). In this light, further studies are urgently needed where gross N transformation rates are measured in soil amended with NEZ and NZ to efficiently quantify gross N production and consumption through mineralization, nitrification and denitrification processes.
In May-2013, Cmic and Nmic increased significantly in all treatments, while N-NO3− pool significantly decreased (but not Exch N-NH4+ pool with the exception of 7CZ) (Figure 4), suggesting that microbial immobilization prevailed over mineralization [49]. In addition to NO3− decrease, 7CZ treatment showed a reduction of Exch N-NH4+ pool, where the N surplus caused by the NEZ introduction completely disappeared. A fraction of this mineral N depletion can be attributable to NO3− leaching and/or to N2-N2O losses through denitrification process (probably enhanced by waterlogged conditions; [25]). It is important to consider that NEZ introduction affected mainly the Exch N-NH4+ and not the Fix N-NH4+ pool and that 7CZ still had high TN δ15N in May-2013, confirming that an important fraction of NEZ-N was still present in the soil system. It is thus possible that a large fraction of the exchangeable N contained into NEZ has been immobilized by the microbial biomass [50,51].
4.1.3. NEZ Specific Effects on Fixed N-NH4+ Pool
A possible hypothesis is that Fix N-NH4+ pool is in dynamic equilibrium with exchangeable and soluble N-NH4+ pools [52,53]. In our case, this hypothesis is supported by the δ15N turnover of fixed pool that suggested a continuous N replacement during the monitoring period. At the start of the experimentation, Fix δ15N of CNTR and NZ treatments was probably still affected by previous slurry treatments as shown by the higher isotopic signature. Generally, microbial activity increases with the increase of soil temperature, affecting the other N pools, in particular, a decrease in N-NO3− and Exch N-NH4+ pools (as in May-2013 sampling) can alter the equilibrium with fixed interlayer ammonium. This decrease can cause a release of N from Fix N-NH4+ pool in order to maintain equilibrium, with a continuous N turnover and a consequent change in δ15N. No δ15N turnover of fixed ammonium was observed immediately after the chemical fertilization applied in Jun-2013, while the addition of urea was marked by a pH increase [54]. On the contrary, in Sep-2013, a probable storage of N from chemical fertilization was visible in Fix N-NH4+ pool (and consequently in TN pool), as demonstrated by the significantly lower δ15N (very close to the δ15N of urea and di-ammonium phosphate). This behavior is recorded only in the bulk soil, where the exploitation by the plant roots is less important than in the rhizosphere.
4.2. NZ Influence on Soil N and C Pools
The introduction of natural zeolitites (5NZ and 15NZ, respectively) affected the soil C and N pools. The decrease in the total reserve of Fix N-NH4+ in 15NZ in Nov-2012 was probably due to a dilution effect operated by the high amount of NZ (devoid of N) introduced. Instead, the decrease of Fix N-NH4+ during the growing season suggest an exploitation by plants, confirming the active role of this pool in crop nutrition [55,56]. Nevertheless, no significant differences in the amount of Fix N-NH4+ pool were found between the various treatments, suggesting that the N subjected to CEC processes by zeolitites belongs to the exchangeable pool. The generally lower N-NO3− content in the NZ treatments may be attributed both to the aforementioned controlled retention of NH4+ by the zeolitite, which can reduce the availability of N to nitrifying bacteria and to the lower amount of N fertilizer (from 30 to 50%) with respect to CNTR (where N-NO3− pool increased significantly). The introduction of NZ also affected microbial biomass N and C immobilization. In Nov-2012, lower Cmic was observed in all ZT, especially in 5NZ, suggesting that NZ introduction cause an initial disequilibrium in microbial biomass. During the sorghum-growing season (Jun-2013), microbial biomass was probably influenced by the competition with the plants, resulting in a consistent decrease in Cmic and Nmic in all the treatments. Apparently, 15NZ treatment had a stronger influence on microbial biomass N, resulting in a lower N immobilization that was already visible in May-2013 (in this case even Cmic pool was affected) and lasted until Sep-2013, suggesting more zeolitite was in the soil the less N was easily available to soil microorganisms. The C/N ratio of microbial biomass may give information regarding bacterial or fungal prevalence in the microbial community; usually bacteria have on average a lower C/N than fungi because of a lower N requirement by the latter [57,58]. Agricultural management (tillage or no-tillage), nutrient availability, soil pH, temperature and moisture may influence fungal/bacterial ratio [15,59,60]. In this respect, Cmic/Nmic ratio suggested that the introduction of natural zeolitites caused a shift in microbial population through a greater fungal prevalence [15,59,60] especially in 15NZ. A greater fungal/bacteria biomass ratio can be often interpreted as marker of a more sustainable agricultural system, where the nutrients required for the plant growth are supplied by OM decomposition and N mineralization with probably lesser N loss in the environment [15,59,60]. It is thus likely that the presence of zeolites caused a lower N accessibility into the N soil pools, making it less available to soil microorganisms and favoring the development of fungal biomass. These implications on microbial biomass affect the soil C cycle, where a lower HI and a greater FA fraction content can contribute to lower C immobilization.
4.3. Zeolitite Influence on Rhizosphere
At the harvest, rhizosphere was depleted in Exch N-NH4+ with respect to bulk soils but significantly enriched in microbial biomass C-N, TOC, HA and TN. It is reasonable that the decrease in the exchangeable pool was due to an exploitation by plant roots while bulk soil results relatively enriched. Rhizosphere is known to be a zone with higher metabolic activity, thus the release of organic compounds from roots may explain the increase in microbial biomass, TOC, HA and TN [61,62] and also the slight fractionation observed in TN and Fix N-NH4+ pools δ15N. It is interesting to note that at the end of the growing season, rhizosphere TOC was probably influenced by zeolitite addition (especially in 15NZ), showing an increase with respect to the CNTR. This evidence suggests a higher efficiency of microbial biomass, but this is not supported by a parallel increment in Cmic and Nmic with respect to CNTR. On the other hand, Ozbahce et al. [36] found that the application of NZ mixed in the first 30cm soil layer increased OM content, although a clear explanation of this phenomenon was not given. Italian zeolitic tuffs can adsorb a significant amount of HS from solutions, especially when divalent cations (such as Ca2+) act as bridge between the negatively charged mineral surface and the organic phase [63]. A plausible hypothesis is that zeolitite can adsorb HS reducing in this way organic C losses and increasing thus TOC in the soil [64]. Ca2+ is indeed the major exchangeable base of the studied NZ and it can act as bridge for the sorption of HS in zeolitic tuff. Further studies are required to confirm this very important aspect.
4.4. Plant-Zeolitite Interactions
N is preferentially allocated in leaves and panicles and the lack of significant differences in N content with respect to the distinct treatments suggests that, notwithstanding the fertilization reductions, plants uptake similar N amounts, reflecting a higher fertilizer recovery or N use efficiency. As reported in literature [65,66] δ15N of leaves is determined by the physiological mechanism within the plants and by the isotopic ratio of external N sources. Moreover, intra-plant N isotopic variations, between roots and leaves can be due to different patterns of N assimilation or reallocation. These intra-plant δ15N variations were recognizable in the sorghum plants, where leaves δ15N was generally greater (from 2 to 3‰) than that determined in roots, except for 7CZ where differences were even greater (about 6‰). Many authors used 15N natural abundance of leaves in order to trace the N source in the soil [65,66,67,68,69] mostly because leaves represent the primary sink of N and the largest plant N pool [41]. Average δ15N of 7CZ leaves was very close to NEZ δ15N and significantly higher than the leaves from the other parcels (Figure 6). The higher isotopic signature of 7CZ leaves indicated that during the growing season, an uptake from a significantly higher δ15N occurred. Assuming negligible fractionation effects during uptake, the main N source was probably represented by NEZ-N. Indeed, 7CZ is the only parcel where a high δ15N input (represented by pig slurry) was added during the experimentation. It has been demonstrated that crops grown under chemical fertilizers (such as urea) have lower δ15N with respect to plants grown under organic fertilizers (which have usually higher δ15N) [70,71,72]. It is important to consider that the other N inputs were urea and di-ammonium phosphate, which have a negative δ15N and were applied to all treatments, supporting the hypothesis that NEZ was an efficient slow release fertilizer and retained N even after several months and with no important N losses occurring (from leaching or denitrification). Most N in soil is bound in forms not immediately available to plants [41,71], so usually the δ15N of TN is not a good approximation of the isotopic signature of the N source preferentially used by plants. Anyhow, 15N natural abundance in leaves of CNTR, 15NZ and especially 5NZ reflect the use of N characterized by a lower δ15N and related to chemical fertilizers signature. It is important to note that notwithstanding the lower urea application (−30% with respect to the CNTR), in 5NZ and 15NZ treatments, leaves δ15N is similar or even lower with respect to CNTR. In particular, as visible from the mixing model (Figure 6), 5NZ plants showed the lowest δ15N not only in leaves but also in roots, stems and panicles, suggesting a higher efficiency in the uptake of N from a source with lower δ15N, i.e., chemical fertilizers.
The positive yield results of all ZT must be attributed also to the soil physical properties amelioration induced by zeolitite amendments. In our case, zeolitites can in fact increase soil water retention and, thanks to their coarser size with respect to the fine-grained soil (particle-size analysis performed within ZeoLIFE project are not shown in this work) they can also increase soil permeability and aeration [28,36].
5. Conclusions
In this work, a detailed investigation of the N-C pools and δ15N dynamics in the soil-sorghum system were studied in a field amended with natural and NH4+-enriched zeolitites, under fertilization reductions. ZT generally had a weak influence on the total reserve of Fix N-NH4+ pool. However, its reserve decreased during the growing season and a δ15N turnover occurs, confirming both its active role in plant nutrition and its dynamic equilibrium with the other soil N pools. Moreover, Fix δ15N turnover indicate that part of N from chemical fertilizers was probably stored in this pool at the end of the agronomic year. The N introduced in the soil system with NEZ increased the Exch N-NH4+ reserve, suggesting that N adsorbed by zeolitites preferentially affected this pool. ZT (especially NZ) influenced the N-NO3− pool, resulting in lower nitrate contents suggesting a possible nitrification and denitrification rate reduction. Microbial activity was strongly affected by NEZ and NZ introduction which seems to cause at first a disorder, then a possible change in microbial population towards a fungal prevalence, usually indicative of a system with lower N accessible to microorganisms. 15N natural abundance in soils and plants, together with the positive yield results, suggested that plants benefited from N NEZ. However, in all likelihood, plants did not directly exploit N from NEZ, but rather the transfer involves complex interactions among soil microbial biomass. Further investigations focused on this biotic mediation are needed. Most of the N-C pools dynamics were not affected by NZ amendments but, in all likelihood, an increase in fertilizers recovery by plants occurred. The spreading of zeolitites may improve soil physical-chemical properties, enhance nutrient use efficiency as well as augment economical and an environmental saving.
Supplementary Materials
The following are available online at https://www.mdpi.com/2076-3417/9/21/4524/s1, Table S1: Average of N and C pools. Table S2: Average of TN, TOC and C/N of sorghum organs.
Author Contributions
G.F., L.V.A. and M.C. conceptualized the research project. G.F., L.V.A., B.F. and D.D.G., designed the study and analyzed the data. All authors contributed to the writing of the manuscript.
Funding
This work has been sustained by the EU-funded ZeoLIFE project (LIFE+10/ENV/IT000321).
Acknowledgments
We gratefully acknowledge Francesco Droghetti for his help during sampling procedures, Paola Gioacchini for her support in EA-IRMS analyses and Marco Natale for his help in laboratory runs and anonymous reviewers for the valuable comments and suggestions.
Conflicts of Interest
The authors declare no conflict of interest.
References
- Conway, G. The Double Green Revolution: Food for All in the 21st Century; Penguin: London, UK, 1997; p. 334. [Google Scholar]
- Smil, V. Nitrogen in crop production: An account of global flows. Glob. Biogeochem. Cycles 1999, 13, 647–662. [Google Scholar] [CrossRef]
- Tilman, D.; Fargione, J.; Wolff, B.; D’Antonio, C.; Dobson, A.; Howarth, R.; Schindler, D.; Schlesinger, W.H.; Simberloff, D.; Swackhamer, D. Forecasting agriculturally driven global environmental change. Science 2001, 292, 281–284. [Google Scholar] [CrossRef] [PubMed]
- Oenema, O.; Kros, H.; Vries, W. Approaches and uncertainties in nutrient budgets: Implications for nutrient management and environmental policies. Eur. J. Agron. 2003, 20, 3–16. [Google Scholar] [CrossRef]
- Kroeze, C.; Aerts, R.; Breemen, N.; Dam, D.; Hoek, K.; Hofschreuder, P.; Hoosbeek, M.; Klein, J.; Kros, H.; Oene, H.; et al. Uncertainties in the fate of nitrogen I: An overview of sources of uncertainty illustrated with a Dutch case study. Nutr. Cycl. Agroecosyst. 2003, 66, 43–69. [Google Scholar] [CrossRef]
- Passaglia, E. Zeoliti Naturali, Zeolititi e Loro Applicazioni; Arvan: Padova, Italy, 2008; p. 104. [Google Scholar]
- Wu, Q.; Chi, D.; Xia, G.; Chen, T.; Sun, Y.; Song, Y. Effects of Zeolite on Drought Resistance and Water—Nitrogen Use Efficiency in Paddy Rice. J. Irrig. Drain. Eng. 2019, 145, 4019024. [Google Scholar] [CrossRef]
- Wu, Q.; Chen, T.; Chi, D.; Xia, G.; Sun, Y.; Song, Y. Increasing nitrogen use efficiency with lower nitrogen application frequencies using zeolite in rice paddy fields. Int. Agrophys. 2019, 33, 263–269. [Google Scholar] [CrossRef]
- Li, Z.; Zhang, Y.; Li, Y. Zeolite as slow release fertilizer on spinach yields and quality in a greenhouse test. J. Plant Nutr. 2013, 36, 1496–1505. [Google Scholar] [CrossRef]
- Malferrari, D.; Laurora, A.; Brigatti, F.; Coltorti, M.; Di Giuseppe, D.; Faccini, B.; Vezzalini, M. Open-field experimentation of an innovative and integrated zeolitite cycle: Project definition and material characterization. Rend. Lincei-Sci. Fis. 2013, 24, 141–150. [Google Scholar] [CrossRef]
- Colombani, N.; Di Giuseppe, D.; Faccini, B.; Ferretti, G.; Mastrocicco, M.; Coltorti, M. Estimated water saving in an agricultural field amended with natural zeolites. Environ. Process. 2016, 3, 617–628. [Google Scholar] [CrossRef]
- Di Giuseppe, D.; Ibáñez Insa, J.; Melchiorre, M.; Coltorti, M. On the potential effect of micronized zeolites on seed germination: A prospective study. Period. Mineral. 2018, 85, 179–183. [Google Scholar]
- Ferretti, G.; Di Giuseppe, D.; Faccini, B.; Coltorti, M. Mitigation of sodium risk in a sandy agricultural soil by the use of natural zeolites. Environ. Monit. Assess. 2018, 190, 646. [Google Scholar] [CrossRef] [PubMed]
- Reháková, M.; Čuvanová, S.; Dzivák, M.; Rimár, J.; Gaval’ová, Z. Agricultural and agrochemical uses of natural zeolite of the clinoptilolite type. Curr. Opin. Solid State Mater. Sci. 2004, 8, 397–404. [Google Scholar] [CrossRef]
- Ferretti, G.; Keiblinger, K.M.; Di Giuseppe, D.; Faccini, B.; Colombani, N.; Zechmeister-Boltenstern, S.; Coltorti, M.; Mastrocicco, M. Short-term response of soil microbial biomass to different chabazite zeolite amendments. Pedosphere 2018, 28, 277–287. [Google Scholar]
- Bernardi, A.C.C.; Oliviera, P.P.A.; Monte, M.B.M.; Souza-Barros, F. Brazilian sedimentary zeolite use in agriculture. Microporous Mesoporous Mater. 2013, 167, 16–21. [Google Scholar] [CrossRef]
- Colombani, N.; Mastrocicco, M.; Di Giuseppe, D.; Faccini, B.; Coltorti, M. Variation of the hydraulic properties and solute transport mechanisms in a silty-clay soil amended with natural zeolites. Catena 2014, 123, 195–204. [Google Scholar] [CrossRef]
- Ferretti, G.; Keiblinger, K.M.; Zimmermann, M.; Di Giuseppe, D.; Faccini, B.; Colombani, N.; Mastrocicco, M.; Zechmeister-Boltenstern, S.; Mentler, A. High resolution short-term investigation of soil CO2, N2O, NOx and NH3 emissions after different chabazite zeolite amendments. Appl. Soil Ecol. 2017, 119, 138–144. [Google Scholar] [CrossRef]
- Ferretti, G.; Di Giuseppe, D.; Natali, C.; Faccini, B.; Bianchini, G.; Coltorti, M. CN elemental and isotopic investigation in agricultural soils: Insights on the effects of zeolitite amendments. Chem. Der Erde 2017, 77, 45–52. [Google Scholar] [CrossRef]
- Gholamhoseini, M.; Ghalavand, A.; Khodaei-Joghan, A.; Dolatabadian, A.; Zakikhani, H.; Farmanbar, E. Zeolite-amended cattle manure effects on sunflower yield, seed quality, water use efficiency and nutrient leaching. Soil Tillage Res. 2013, 126, 193–202. [Google Scholar] [CrossRef]
- Di Giuseppe, D.; Ferretti, G.; Faccini, B.; Blasi, E.; Passeri, N.; Bianchini, G.; Coltorti, M. Is it possible to cultivate corn in a sustainable way using a quarry waste? Period. Mineral. 2016, 85, 179–183. [Google Scholar]
- Arcara, P.G.; Gamba, C.; Bidini, D.; Marchetti, R. The effect of urea and pig slurry fertilization on denitrification, direct nitrous oxide emission, volatile fatty acids, water-soluble carbon and anthrone-reactive carbon in maize-cropped soil from the Po plain (Modena, Italy). Biol. Fertil. Soils 1999, 29, 270–276. [Google Scholar] [CrossRef]
- Faccini, B.; Di Giuseppe, D.; Malferrari, D.; Coltorti, M.; Abbondanzi, F.; Campisi, T.; Laurora, A.; Passaglia, E. Ammonium-exchanged zeolitite preparation for agricultural uses: From laboratory tests to large-scale application in ZeoLIFE project prototype. Period. Mineral. 2015, 84, 303–321. [Google Scholar]
- Faccini, B.; Di Giuseppe, D.; Ferretti, G.; Coltorti, M.; Colombani, N.; Mastrocicco, M. Natural and NH4+-enriched zeolitite amendment effects on nitrate leaching from a reclaimed agricultural soil (Ferrara Province, Italy). Nutr. Cycl. Agroecosyst. 2018, 110, 327–341. [Google Scholar] [CrossRef]
- Mastrocicco, M.; Colombani, N.; Di Giuseppe, D.; Faccini, B.; Coltorti, M. Contribution of the subsurface drainage system in changing the nitrogen speciation of an agricultural soil located in a complex marsh environment (Ferrara, Italy). Agric. Water Manag. 2013, 119, 144–153. [Google Scholar] [CrossRef]
- Di Giuseppe, D.; Faccini, B.; Mastrocicco, M.; Colombani, N.; Coltorti, M. Reclamation influence and background geochemistry of neutral saline soils in the Po River Delta Plain (Northern Italy). Environ. Earth Sci. 2014, 72, 2457–2473. [Google Scholar] [CrossRef]
- IUSS Working Group. World Reference Base for Soil Resources. International Soil Classification System for Naming Soils and Creating Legends for Soil Maps; World Soil Resources Reports, No. 106; FAO: Rome, Italy, 2007. [Google Scholar]
- Colombani, N.; Di Giuseppe, D.; Faccini, B.; Ferretti, G.; Mastrocicco, M.; Coltorti, M. Inferring the interconnections between surface water bodies, tile-drains and an unconfined aquifer-aquitard system: A case study. J. Hydrol. 2016, 537, 86–95. [Google Scholar] [CrossRef]
- Orsini, L.; Rèmy, J.C. Utilization du chlorure de cobaltihexammine pour la déterminantion simultanée de la capacité d′èchange et des bases échangeables des sols. Sci. Sol. 1976, 4, 269–275. [Google Scholar]
- Ciesielsky, H.; Sterckeman, T. Determination of cation exchange capacity and exchangeable cations in soils by means of cobalt heamine trichloride. Effects of experimental conditions. Agronomie 1997, 17, 1–7. [Google Scholar]
- Mariotti, A. Natural N-15 abundance measurements and atmospheric nitrogen standards. Nature 1984, 311, 251–252. [Google Scholar] [CrossRef]
- Silva, J.A.; Bremner, J.M. Determination and isotope-ratio analysis of different forms of nitrogen in soils: 5 Fixed ammonium. Soil Sci. Soc. Am. J. 1966, 30, 587–594. [Google Scholar] [CrossRef]
- Ciavatta, C.; Govi, M.; Vittori Antisari, L.; Sequi, P. Characterization of humified compounds by extraction and fractionation on solid polyvinylpyrrolidone. J. Chromatogr. 1990, 509, 41–146. [Google Scholar] [CrossRef]
- Sequi, P.; De Nobili, M.; Leita, L.; Cercignani, G. A new index of humification. Agrochimica 1986, 30, 175–179. [Google Scholar]
- Vance, E.D.; Brookes, P.C.; Jenkinson, D.S. An extraction method for measuring soil microbial biomass C. Soil Biol. Biochem. 1987, 19, 703–707. [Google Scholar] [CrossRef]
- Ozbahce, A.; Tari, A.F.; Gönülal, E.; Simsekli, N.; Padem, H. The effect of zeolite applications on yield components and nutrient uptake of common bean under water stress. Arch. Agron. Soil Sci. 2015, 61, 615–626. [Google Scholar] [CrossRef]
- Barbarick, K.A.; Pirela, H.J. Agronomic and horticultural uses of zeolites: A review. In Zeo-Agriculture: Use of Natural Zeolites in Agriculture and Aquaculture; Pond, W.G., Mumpton, F.A., Eds.; Westview Press: Boulder, CO, USA, 1984; pp. 93–103. [Google Scholar]
- Eslami, M.; Khorassani, R.; Coltorti, M.; Malferrari, D.; Faccini, B.; Ferretti, G.; Di Giuseppe, D.; Fotovat, A.; Halajnia, A. Leaching behaviour of a sandy soil amended with natural and NH4+ and K+ saturated clinoptilolite and chabazite. Arch. Agron. Soil Sci. 2018, 64, 1142–1151. [Google Scholar] [CrossRef]
- Dwairi, I.M. Evaluation of Jordanian zeolite tuff as a controlled slow-release fertilizer for NH4+. Environ. Geol. 1998, 34, 1–4. [Google Scholar] [CrossRef]
- Dittert, K.; Georges, T.; Sattelmacher, B. Nitrogen turnover in soil after application of animal manure and slurry as studied by the stable isotope 15N: A review. Z. Pflanzenernähr. Bodenkd. 1998, 161, 453–463. [Google Scholar] [CrossRef]
- Högberg, P. Tansley review No. 95 15N natural abundance in soil-plant systems. N. Phytol. 1997, 137, 179–203. [Google Scholar]
- Schmidt, O.; Ostle, N.J. Tracing nitrogen derived from slurry in earthworms using 15N/14N stable isotope ratios at natural abundances. Appl. Soil Ecol. 1999, 12, 7–13. [Google Scholar] [CrossRef]
- Sang-Sun, L.; Woo-Jung, C.; Jyn-Hyeob, K.; Jae-Woon, J.; Scott, X.C.; Han-Yong, K.; Kwang-Sik, Y.; Soo-Myung, C. Nitrogen and carbon isotope responses of Chinese cabbage and chrysanthemum to the application of liquid pig manure. Plant Soil 2007, 295, 67–77. [Google Scholar]
- Kitayama, K.; Iwamoto, K. Patterns of natural 15N abundance in the leaf-to-soil continuum of tropical rain forests differing in N availability on Mount Kinabalu, Borneo. Plant Soil 2001, 229, 203–212. [Google Scholar] [CrossRef]
- Gualtieri, A.F.; Passaglia, E. Rietveld structure refinement of NH4-exchanged natural chabazite. Eur. J. Mineral. 2006, 18, 351–359. [Google Scholar] [CrossRef]
- Hedström, A. Ion exchange of ammonium in zeolites: A literature review. J. Environ. Eng. 2001, 127, 673–681. [Google Scholar] [CrossRef]
- Widiastuti, N.; Wu, H.; Ang, H.M.; Zhang, D. Removal of ammonium from greywater using natural zeolite. Desalination 2011, 277, 15–23. [Google Scholar] [CrossRef]
- Malekian, R.; Abedi-Koupai, J.; Eslamian, S.S. Influences of clinoptilolite and surfactant-modified clinoptilolite zeolite on nitrate leaching and plant growth. J. Hazard. Mater. 2011, 185, 970–976. [Google Scholar] [CrossRef]
- Azam, F.; Malik, K.A.; Hussain, F. Microbial biomass and mineralization-immobilization of nitrogen in some agricultural soils. Biol. Fertil. Soils 1986, 2, 157–163. [Google Scholar] [CrossRef]
- Ito, O.; Watanabe, I. Immobilization, mineralization and availability to rice plants of nitrogen derived from heterotrophic nitrogen fixation in flooded soil. Soil Sci. Plant Nutr. 1981, 27, 169–176. [Google Scholar] [CrossRef]
- Schulten, H.R.; Schnitzer, M. The chemistry of soil organic nitrogen: A review. Biol. Fertil. Soils 1998, 26, 1–15. [Google Scholar] [CrossRef]
- Meurant, G. Soil Organic Matter and Its Role in Crop Production; Elsevier Science: Amsterdam, The Netherlands, 1973; p. 634. [Google Scholar]
- Scherer, H.W.; Werner, W. Significance of soil microorganisms for the mobilization of nonexchangeable ammonium. Biol. Fertil. Soils 1996, 22, 248–251. [Google Scholar] [CrossRef]
- Martens, D.A.; Bremner, J.M. Urea hydrolysis in soils: Factors influencing the effectiveness of phenylphosphorodiamidate as a retardant. Soil Biol. Biochem. 1984, 16, 515–519. [Google Scholar] [CrossRef]
- Li, C.; Fan, X.; Mengel, K. Turnover of interlayer ammonium in loess-derived soil grown with winter wheat in the Shaanxi Province of China. Biol. Fertil. Soils 1990, 9, 211–214. [Google Scholar] [CrossRef]
- Marzadori, C.; Vittori Antisari, L.; Gioacchini, P.; Sequi, P. Turnover of interlayer ammonium in soil cropped with sugar beet. Biol. Fertil. Soils 1994, 18, 27–31. [Google Scholar] [CrossRef]
- Hodge, A.; Robinson, D.; Fitter, A. Are microorganisms more effective than plants at competing for Nitrogen? Trends Plant Sci. 2000, 5, 304–308. [Google Scholar] [CrossRef]
- Nannipieri, P.; Ascher, J.; Ceccherini, M.T.; Landi, L.; Pietramellara, G.; Renella, G. Microbial diversity and soil functions. Eur. J. Soil Sci. 2003, 54, 655–670. [Google Scholar] [CrossRef]
- Vries, F.T.; Hoffland, E.; Eekeren, N.; Brussaard, L.; Bloem, J. Fungal/bacterial ratios in grasslands with contrasting nitrogen management. Soil Biol. Biochem. 2006, 38, 2092–2103. [Google Scholar] [CrossRef]
- Strickland, M.S.; Rousk, J. Considering fungal:bacterial dominance in soils—Methods, controls, and ecosystem implications. Soil Biol. Biochem. 2010, 42, 1385–1395. [Google Scholar] [CrossRef]
- Merckx, R.; Van Ginkel, J.H.; Sinnaeve, J.; Cremers, A. Plant induced changes in the rhizosphere of maize and wheat. I. Production and turnover of root-derived material in the rhizosphere of maize and wheat. Plant Soil 1986, 96, 85–93. [Google Scholar] [CrossRef]
- Liljeroth, E.; Van Veen, J.A.; Miller, H.J. Assimilate translocation to the rhizosphere of two wheat cultivars and subsequent utilization by rhizosphere microorganisms at two soil nitrogen levels. Soil Biol. Biochem. 1990, 22, 1015–1021. [Google Scholar] [CrossRef]
- Capasso, S.; Salvestrini, S.; Coppola, E.; Buondonno, A.; Colella, C. Sorption of humic acid on zeolitic tuff: A preliminary investigation. Appl. Clay Sci. 2005, 28, 159–165. [Google Scholar] [CrossRef]
- Söderström, B.; Hedlund, K.; Jackson, L.E.; Kätterer, T.; Lugato, E.; Thomensen, I.K.; Jørgensen, H.B. What are the effects of agricultural management on soil organic carbon (SOC) stocks? Environ. Evid. 2014, 3, 2. [Google Scholar] [CrossRef]
- Evans, D.R. Physiological mechanism influencing plant nitrogen isotope composition. Trends Plant Sci. 2001, 6, 121–126. [Google Scholar] [CrossRef]
- Evans, D.R.; Bloom, A.J.; Sukrapanna, S.S.; Ehleringer, J.R. Nitrogen isotope composition of tomato (Lycopersicum Esculentum Mill. cv. T-5) grown under ammonium or nitrate nutrition. Plant Cell Environ. 1996, 19, 1317–1323. [Google Scholar] [CrossRef]
- Erskine, P.D.; Bergstrom, D.M.; Schmidt, S.; Stewart, G.R.; Tweedie, C.E.; Shaw, J.D. Subantarctic Macquarie Island ± a model ecosystem for studying animal-derived nitrogen sources using 15N natural abundance. Oecologia 1998, 117, 187–193. [Google Scholar] [CrossRef] [PubMed]
- Hulton, B.Z.; Sigman, D.M.; Schuur, E.A.G.; Edin, L.O. A climate-driven switch in plant nitrogen acquisition within tropical forest communities. Proc. Natl. Acad. Sci. USA 2007, 114, 8902–8906. [Google Scholar] [CrossRef] [PubMed]
- Kahmen, A.; Wanek, W.; Buchmann, N. Foliar d15N values characterize soil N cycling and reflect nitrate or ammonium preference of plants along a temperate grassland gradient. Oecologia 2008, 156, 861–870. [Google Scholar] [CrossRef] [PubMed]
- Choi, W.J.; Ro, H.M.; Hobbie, E.A. Patterns of natural 15N in soils and plants from chemically and organically fertilized uplands. Soil Biol. Biochem. 2003, 35, 1493–1500. [Google Scholar] [CrossRef]
- Bateman, A.S.; Kelly, S.D.; Jickells, T.D. Nitrogen Isotope Relationships between Crops and Fertilizer: Implications for Using Nitrogen Isotope Analysis as an Indicator of Agricultural Regime. J. Agric. Food Chem. 2005, 53, 5760–5765. [Google Scholar] [CrossRef]
- Yun, S.I.; Ro, H.M.; Choi, W.J.; Chang, S.X. Interactive effects of N fertilizer source and timing of fertilization leave specific N isotopic signatures in Chinese cabbage and soil. Soil Biol. Biochem. 2006, 38, 1682–1689. [Google Scholar] [CrossRef]


© 2019 by the authors. Licensee MDPI, Basel, Switzerland. This article is an open access article distributed under the terms and conditions of the Creative Commons Attribution (CC BY) license (http://creativecommons.org/licenses/by/4.0/).