Abstract
The magnetic properties of various families of nanocomposite materials containing nanoparticles of transition metals or transition-metal compounds are reviewed here. The investigated magnetic nanocomposites include materials produced either by dissolving a ferrofluid containing pre-formed nanoparticles of desired composition and size in a fluid resin submitted to subsequent curing treatment, or by generating the nanoparticles during the very synthesis of the embedding matrix. Two typical examples of these production methods are polymer nanocomposites and ceramic nanocomposites. The resulting magnetic properties turn out to be markedly different in these two classes of nanomaterials. The control of nanoparticle size, distribution, and aggregation degree is easier in polymer nanocomposites, where the interparticle interactions can either be minimized or exploited to create magnetic mesostructures characterized by anisotropic magnetic properties; the ensuing applications of polymer nanocomposites as sensors and in devices for Information and Communication Technologies (ICT) are highlighted. On the other hand, ceramic nanocomposites obtained from transition-metal loaded zeolite precursors exhibit a remarkably complex magnetic behavior originating from the simultaneous presence of zerovalent transition-metal nanoparticles and transition-metal ions dissolved in the matrix; the applications of these nanocomposites in biomedicine and for pollutant remediation are briefly discussed.
1. Introduction
Nanocomposite (NC) materials have been the subject of exhaustive study for more than three decades. The interest towards inhomogeneous systems containing a nanoparticle (NP) phase has arisen—and is still high—because of their present and prospective functional applications. These are basically related to the high surface-to-volume ratio and the high total interfacial area of the embedded NPs; moreover, their many size-dependent functional properties can enrich the hosting materials with interesting multifunctionalities [1].
Magnetic NPs are among the most popular functional nanofillers [2,3]. The magnetic properties of the resulting NCs are affected and sometimes limited by many factors, such as the degree of dispersion/aggregation of NPs, the strength of interparticle interactions, and the effect of surface on NP magnetism [4,5]. Some aspects are still unclear, such as the extent to which the interface between magnetic NPs and a given matrix influences their properties [6,7].
Although the basic principles of nanomagnetism have been long since established [8], a general predictive picture of the magnetic properties of a given NC, or a family of NCs, is still lacking. This is because a number of ill-known parameters hinder the knowledge of the physical processes at the nanoscale and affect the interpretation of the measured magnetic properties. On the other hand, in view of the applicability of magnetic NCs, the need for easy, cheap, and eco-sustainable preparation and processing is a central issue; another challenge concerns the stability in time and the disposal at the end of life (EOL) of these materials [9,10].
Often, the differences in magnetic behavior found in different magnetic NCs are ascribed to contrasting morphologic features, such as nature of the particle size distribution (e.g., monodisperse vs. polydisperse particles) and degree of particle coupling (e.g., independent vs. interacting particles, or isolated vs. aggregated particles).
However, remarkable differences among final products may be directly related to the nature and features of the preparation procedure. In this respect, two main strategies can be envisaged: in one case, the magnetic NPs are first prepared as a nanopowder by means of a suitable chemical route, and subsequently dissolved by mixing/stirring in an initially fluid host, which finally becomes a solid through an appropriate process (a typical example being polymer NCs obtained by suitably curing a fluid resin loaded with a dispersion of magnetic NPs) [11,12,13]; alternatively, the magnetic particles and the solid host matrix can be simultaneously obtained (a typical example being ceramic NCs obtained by thermal treatment of a transition metal-loaded zeolite precursor) [14].
In this review, a number of magnetic NCs prepared according to both strategies will be discussed, mostly focusing on the resulting magnetic properties; these will be shown to critically depend on the type of host matrix and on the preparation technique, indicating that a general theory of magnetism in NC materials can hardly be put forward; on the contrary, each magnetic NC system needs its own detailed characterization able to provide a specifically tailored picture, or model, inherently based on both magnetic and morphologic data.
2. A Survey of Magnetic Measurements and Typical Magnetic Parameters of Nanocomposite Systems
2.1. Magnetic Measurements in Nanocomposite Materials
Typical magnetic nanocomposites of relevance for applications exhibit magnetization values ranging between 1 and 10 emu/g and coercive fields ranging from about zero to some hundreds of Oe. The low magnetization values are explained considering that the nanoparticulate magnetic fraction is typically much smaller than the diamagnetic host fraction. The above reported values imply that small or thin samples (exhibiting, for example, magnetic moments of much less than 10−2 emu) must be measured using high-sensitivity magnetometers; in this case, extraction methods are not advisable, whereas vibrating sample magnetometers (maximum sensitivity around 10−6 emu (10−9 Am2)) or Superconducting Quantum Interference Device (SQUID) magnetometers (maximum sensitivity around 10−8 emu (10−11 Am2)) offer the best performances and provide results virtually free from experimental uncertainties. Static magnetic measurements give information on the behavior of major hysteresis loops as functions of temperature (whence typical hysteretic parameters such as coercive field and magnetic remanence are easily obtained) and on magnetic susceptibility (both initial and maximum). A central role in static magnetic measurements is played by field-cooled (FC) and zero-field-cooled (ZFC) magnetization curves because of the information content about nanoparticle size, size distribution, effective anisotropy, and interactions that can be attained by careful analysis of the shape of these curves [15]. The FC/ZFC protocol involves, in principle, measuring the initial susceptibility or the low-field magnetization of a sample after demagnetization at a temperature higher than the blocking temperature (where all particle moments are randomly oriented), and subsequent cooling without applied field down to the lowest temperature (typically, a few K); a small field is then applied to measure the sample’s response during the temperature rise up to the starting temperature. The complementary FC curve is obtained by repeating the same process after cooling the sample under a small applied field.
FC/ZFC curves are particularly interesting because it is easy to estimate useful magnetic properties (e.g., the blocking temperature, the effective anisotropy, and—to a lesser extent—the strength of interaction between particles) of a nanoparticle system just by looking at the graphs of temperature dependence of low-field magnetization. In ZFC conditions at low temperature, the magnetization of each particle is aligned along a direction that minimizes the total energy given the anisotropy and the applied field. As the temperature increases, thermal fluctuations allow the magnetization to rotate towards the applied field direction, thus resulting in an increase of the net magnetization up to a maximum value reached at temperature Tmax. As the temperature is further increased, thermal agitation starts to compete with the aligning effect of the applied field; as a consequence, the net magnetization starts reducing. The competition between the aligning field and the disordering effects of temperature determines, on the time scale of experiment, the blocking temperature TB, which is closely related to Tmax (and often taken equal to Tmax). In the FC condition, the magnetic moments are again blocked at a low temperature, but now they are no longer randomly oriented in space, being partially aligned along the field direction. As in the case of the ZFC curve, the magnetization decreases as a result of thermal activation. The FC and the ZFC curves merge at the irreversibility temperature Tirr, that is, when all the magnetic moments have become unblocked. Above Tirr, the superparamagnetic regime is achieved (see Section 2.2) and the two merged curves reach the temperature at which the experiment has begun.
Knowing TB ≈ Tmax, it is possible to get the average NP size if the effective anisotropy Keff (see Section 2.2) is known or estimated; or, it is possible to evaluate Keff knowing the average NP size (e.g., from Transmission Electron Microscopy (TEM) image analysis). Often, many assumptions are made to simplify the calculations, such as considering the particles as perfect spheres or neglecting the effects of magnetic (dipolar or exchange) interactions, as well as assuming that magnetic anisotropy is the same for the whole set of nanoparticles.
Although static magnetic measurements play the most prominent role in the literature on magnetic nanocomposites and will be discussed in detail in the subsequent sections, some valuable information can be extracted by implementing specific time- or frequency-resolved measurements. Time relaxation experiments may be useful to study relaxation dynamics of a system of nanoparticles at different temperatures [15]. AC susceptibility measurements done as functions of the exciting field frequency allow one to get information about the dynamic aspects of nanoparticle moment ordering; the dependence of the imaginary part of the AC susceptibility permits determining nanoparticle volume distributions, as well as to study magnetic interaction effects and the state of aggregation of nanoparticles [16].
2.2. Typical Magnetic Parameters and Quantities in Nanoparticle Systems
(i) Magnetic anisotropy: crystal. In real ferromagnetic materials, the experimental evidence typically indicates a directional dependence of the magnetic response on an applied field. This phenomenon, corresponding to a directional preference for the magnetization vector, is known as the magnetic anisotropy. Magnetic materials display various types of anisotropies, the most important being crystal anisotropy. This anisotropy, determined by crystal structure and having an entirely intrinsic nature, results in a variation of the magnetic properties of the material with respect to a specific crystallographic orientation. The crystallographic axes along which the magnetization is oriented are called easy axes and a state of minimum energy exists when the magnetization vector lies along one of the preferred orientations. If, by application of a magnetic field, the magnetization vector is turned away from this position, work must be done against the anisotropy forces that tend to hold the vector aligned to the easy direction. Crystal anisotropy plays an important role in single crystals and in magnetic NPs, which are typically characterized by a well-defined crystal structure (at least in their core).
(ii) Magnetic anisotropy: shape. If a ferromagnetic sample is not perfectly spherical, then one or more specific directions become easy magnetization axes solely because of the sample shape. This phenomenon, related to magnetostatic energy, is known as shape anisotropy. In an ellipsoidal sample, the demagnetizing field is stronger along a short axis than along a long axis. Therefore, an external field applied along the short axis has to be stronger to produce the same true field inside the specimen than if applied along the long axis. Therefore, shape alone can be a source of magnetic anisotropy. Shape anisotropy plays a central role in magnetic NPs, where it can be comparable in strength to crystal anisotropy. In granular systems, shape anisotropy plays a role both at the level of single NPs (if the particles are not perfectly spherical) or in the presence of strong NP aggregation, when the aggregates take an elongated/ellipsoidal shape in the sample.
Often, in NP systems including nanocomposites, a central role is played by the so-called effective anisotropy Keff, which encompasses crystal, shape, and surface anisotropy in a single parameter. Surface anisotropy is an additional term, negligible in macroscopic ferromagnetic bodies, which emerges because of the break of lattice periodicity at and around the NP surface. Typically, FC/ZFC curves (see Section 2.1) give information about Keff.
(iii) DC magnetic parameters. Isothermal magnetization loops are the typical outcome of dc magnetic measurements (see Section 2.1). Here, the important parameters of the hysteresis loop are briefly highlighted. If a previously demagnetized ferromagnetic body is submitted to a very strong magnetic field along one direction, it will eventually reach the positive magnetic saturation Ms under sufficiently large fields. This corresponds to having all magnetic moments oriented along the field direction. If the field is removed, the material in general will no longer reach the point (0,0) in the H,M plane. Instead, it will reach a point (0,MR) on the vertical axis, with MR being the magnetization that “remains” in the material (positive remanent magnetization or magnetic remanence). In order to reach the condition M = 0, a magnetic field must be applied in the opposite (negative) direction. The point (−HC, 0) on the horizontal axis represents the negative coercive field or coercivity of the material. If the negative H is further increased in magnitude, the negative magnetic saturation is eventually reached. If H is first brought to zero and then increased again in the positive region, the material will pass through the negative remanence and the positive coercive field, finally reaching the positive saturation state. In a symmetric loop, the two values of saturation magnetization, remanence, and coercive field are equal in magnitude and opposite in sign. Under an alternating magnetic field, the magnetization will cyclically change, describing a closed loop. The demagnetized state (0,0) is not easily accessed; it can be obtained by submitting the sample to a cyclic magnetizing field of slowly decreasing amplitude. It should be remarked that magnetic hysteresis stems from irreversible magnetization processes leading to a loss of energy, which is measured by the loop area. The magnetic susceptibility χ provides a measure of the magnetic response of a ferromagnetic or a paramagnetic material. In the former case, one can consider either the initial susceptibility χ0 (measured on the first magnetization curve close to H = 0) and the maximum susceptibility on the loop χmax (which corresponds to the maximum loop slope). In paramagnetic materials, χ0 is measured to get information about the number of magnetic ions per unit volume and/or the magnetic moment per ion.
In granular systems, hysteresis loops appear only when the NPs are in the blocked state (i.e., when the measurement temperature is below the blocking temperature TB, see Section 2.1). Above the blocking temperature, NPs are in the so-called superparamagnetic regime, which is characterized by complete reversibility of the magnetization process.
(iv) Superparamagnetic state. When the size of a particle composed of magnetic atoms is small enough, the energy necessary to divide itself into magnetic domains (as in macroscopic ferromagnetic bodies) is higher than the energy needed to remain in a state of uniform magnetization; therefore, the particle hosts just one magnetic domain (single-domain particle). The magnetic properties of an assembly of single-domain particles are usually studied within the framework of the superparamagnetic theory. The first assumption of this theory is to consider that all the magnetic moments of the particle rotate coherently, so that the net magnetic moment can be represented by a single classical vector, with magnitude corresponding to the sum over all aligned atomic moments. Usually, the particle’s effective anisotropy Keff is assumed to take the simplest form (i.e., a uniaxial anisotropy with a single easy axis and two equivalent (“up” and “down”) directions); this leads to an energy barrier to the magnetization vector, which is proportional to KeffV, where V is the NP volume. The switch of the NP magnetization between the two antiparallel directions on the same easy axis can be described by an Arrhenius-type law with time constant , where kB is the Boltzmann constant and is the jump attempt frequency of the magnetization between the opposite directions of the easy axis. In NP systems, the observed magnetic behavior strongly depends on the value of the characteristic measuring time tM with respect to the intrinsic system relaxation time. If tM >> τ, the magnetization jumps at a very high rate during a single measurement, allowing the system to be viewed as being at thermodinamical equilibrium. The NPs are then in the superparamagnetic regime. In this case, the magnetization process displays no irreversibility; the coercivity of the system is equal to zero and the M(H) curve takes a smooth form similar to the response of a classical paramagnetic system (Langevin function). On the contrary, if tM << τ, the magnetization jumps exceedingly slowly, and one can observe quasi-static properties as in an ordered, macroscopic magnetic system. Such NPs are said to be in the blocked regime. In this case, a hysteresis loop is measured. The temperature that divides both regimes is called the blocking temperature TB (see Section 2.1). The superparamagnetic theory is based on many (over-)simplifying assumptions. For instance, even well-dispered, not touching magnetic NPs in a nanocomposite interact via a non-contact interaction (the magnetic dipolar interaction), a fact that is not taken into account by the standard superparamagnetic model. When the strength of the dipolar interaction is small but non negligible, the interacting superparamagnetic (ISP) model explains very well the measured anomalies in the magnetic response with respect to the predictions of the simple superparamagnetic theory [17].
(v) Verwey transition temperature. Magnetite NPs are one of the most popular fillers in magnetic nanocomposites. Bulk magnetite is characterized by a low-temperature phase transition occurring near TV = 125 K, associated with changes in magnetic, electrical, and thermal properties. Upon warming, through the Verwey transition temperature, the magnetite crystal lattice changes from a monoclinic structure to the cubic inverse spinel structure that persists at room temperature. Although the most important changes between T < TV and T > TV are associated with the material’s electrical properties, the change in structure entails a change in crystal anisotropy with measurable consequences on the shape of hysteresis loops. The presence and relevance of the magnetic Verwey transition in magnetite NPs is still debated (see Section 3.1).
3. Polymer Nanocomposites
Magnetic NPs dispersed within polymer matrices can be exploited for a number of applications, thanks to the interesting properties that result from the combination of inorganic components and polymers. These NCs exhibit interesting magnetic [11,18,19,20] properties for use in micro- and nanoelectronics. On the other hand, significant contributions to fundamental studies in nanoscale physics have been made by studying these materials, including quantum tunneling of magnetization, spin-reversal mechanism in single-domain particles, and quantum size effects [21,22,23].
Polymer NCs can be prepared by curing of a ferrofluid obtained by mixing a dispersion of magnetic NPs in a resin, which is polymerized by thermal or ultraviolet-light treatment, forming a solid film. Magnetite is a cheap material with a lower degree of toxicity when compared with other metallic ferromagnets, and it can be easily synthesized through a variety of low-cost techniques, such as the thermochemical route and the non-hydrolytic sol–gel process [24,25]. Thermal/UV curing are also cheap techniques (in particular, UV curing is presently appealing for use with coatings) [26]. In this process, UV light induces the polymer formation, allowing one to obtain a fast transformation of the liquid monomer into the solid film with tailored physico-chemical and mechanical properties. It is an environmental friendly technique because it is a solvent free process. The substrate does not need to be heated as in the traditional thermal curing, therefore it guarantees energy saving. The magnetic response of a polymer NC is strongly affected by the properties of the embedded NPs (density in the matrix, size distribution degree of dispersion, aggregation) [26].
Data analysis is much easier in magnetic nanocomposites containing particles uniform in size. Such a condition would be beneficial to many practical applications of NP systems too. However, the existing preparation techniques are not able to produce strictly monodisperse nanoparticle systems; as a consequence, real particle systems are characterized by a particle size distribution p(D), which is typically estimated by measuring the particle size D from TEM images of different parts of the material; the p(D) distribution in granular systems often follows either a gaussian or a log-normal distribution function. For each particle size distribution, there is a corresponding distribution of particle volumes p(V), leading to a range of particle moments and of blocking temperatures (both quantities being proportional to volume V). The latter effect may bring about a difficulty in interpreting experimental data because superparamagnetic and blocked particles may be simultaneously present in the same material at a given temperature.
Typical values of static magnetic quantities measured in polymer nanocomposites are reported in Table 1 (top).

Table 1.
Room temperature values of saturation magnetization, remanent magnetization, and coercive field of typical polymer/ceramic nanocomposites; coercive field at low temperature; saturation magnetization of the embedded nanoparticles at room temperature; maximum temperature of the zero-field-cooled (ZFC) curve (close to the blocking temperature of magnetic nanoparticles). Each nanocomposite is identified by the label referred to in the text. Ceramic nanocomposites were not obtained starting from a magnetic nanopowder.
It should be noted that in polymer nanocomposites, particle aggregation effects are particularly apparent only in the case of low magnetite content; in fact, a better dispersion of magnetite nanoparticles is typically observed in materials with a higher filler content. Such counterintuitive behavior has been explained by invoking the formation of a particle surface with a relatively low surface energy and with better compatibility with the surrounding matrix. As a matter of fact, the magnetite content of a nanocomposite is typically increased by synthesizing the nanoparticles with an increasingly higher precursor concentration, keeping constant the amount of reactive solvent. The higher amount of precursor results in a change of the reaction rate and in the variation of nanoparticle growth, in turn affecting particle size, shape, and surface. In particular, the increased amount of precursor produces a higher quantity of carboxylate species bound to the nanoparticle surface [13], resulting in a comparatively lower surface energy and a better compatibility with the surrounding polymer matrix. In fact, this trend is common to the majority of the analyzed systems, regardless of the reactive solvent used. Instead, thermal or UV curing play a minor role on the quality of the particle dispersion.
3.1. Polymer Nanocomposites Containing Weakly Interacting Magnetic Nanoparticles
An example of polymer NC containing a homogeneous distribution of almost monodisperse magnetite NPs (Figure 1, top left) is shown in Figure 1 (top center). The NPs have sizes distributed according to a Gaussian curve around a mean value of 5.6 nm with a root mean square (r.m.s.) value of 0.1 nm [27].
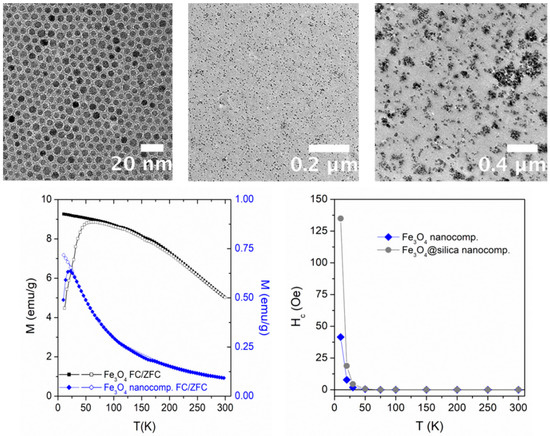
Figure 1.
(Top left) transmission electron microscopy (TEM) image of bare magnetite nanoparticles (NPs) characterized by a narrow size distribution. Reprinted from the work of [11] with permission from Elsevier; (top center) TEM image of a magnetic nanocomposite (NC) obtained from the bare NPs shown in Figure 1. Reprinted from the work of [11] with permission from Elsevier; (top right) TEM image of a polymer NC containing Fe3O4@silica NPs. Reprinted from the work of [11] with permission from Elsevier; (bottom left) field-cooled (FC)/zero-field-cooled (ZFC) curves measured from T = 10 K to T = 300 K in an almost monodisperse magnetite nanopowder (top left) and in the corresponding NC (top center); (bottom right) temperature behavior of the coercive field of NCs containing bare magnetite NPs and Fe3O4@silica NPs.
In this case, the synthesized NPs (entirely made of pure Fe3O4) were dispersed into a hyperbranched photocurable matrix (HBP) as a reference resin. TEM micrographs of the UV-cured films containing 0.7 vol.% of bare Fe3O4 NPs show a uniform dispersion of the magnetic filler in the polymeric matrix (Figure 1, top center).
The FC/ZFC curves of the Fe3O4 nanopowder and of the corresponding NC containing 0.7 vol.% of bare Fe3O4 NPs taken under a field of 200 Oe are shown in Figure 1 (bottom left). A broad maximum of the ZFC curve is observed for bare Fe3O4 NPs around 60 K; above which the FC and ZFC curves closely approached each other, actually merging above about 250 K. The features would be compatible with a large average size and a broad size distribution for these NPs, which is in contrast with the evidence from TEM images [11]. On the other hand, the shape of the curves taken on the NC is notably different; the ZFC curve maximum shifts down to about 20 K and both curves become remarkably steeper. In the NC, the merging of FC and ZFC curves immediately follows the maximum of the ZFC curve. The difference between nanopowder and NC is clearly related to a different aggregation state of magnetic NPs: the powder is clearly characterized by a high degree of interactions (either dipolar or contact); on the other hand, in the NC, the degree of aggregation of bare NPs has been significantly reduced by polymer mixing and stirring; this is confirmed by the TEM image (Figure 1, top center), which shows a uniform distribution of well-separated particles.
It should be remarked that this material does not show any trace of the Verwey transition. As a matter of fact, this transition is a rather elusive effect in systems of magnetite nanoparticles: for instance, the recent literature indicates a strong reduction [28,29,30,31] or even a complete disappearance [32,33] of the Verwey transition temperature TV in small particles. Moreover, the particle shape plays an important role in the Verwey transition, at least in ultrasmall nanoparticles [34]. As recently pointed out [35], the most important role in determining the existence of the Verwey transition is, however, played by the quality (both structural and chemical) of magnetite particles; in fact, the observation of TV in nanometer-sized magnetite has recently been proven to be directly connected to the high quality of the sample [36]. In the present case, the particles are so small that the intrinsic defectiveness related to the high surface-to-volume ratio is effective in suppressing the transition.
An example of the hysteresis properties of the magnetic NC is shown in Figure 1 (bottom right), where the coercive field (Hc) is reported as a function of temperature (blue symbols). Apparently, the hysteresis disappears at T = 30 K, indicating that all bare magnetite NPs have become magnetically unblocked there, that is, have reached the thermal equilibrium state, in good agreement with the position of the maximum of the corresponding ZFC curve (Figure 1, bottom left).
In this material, as well as in almost all systems containing magnetite nanoparticles, the particle magnetization appears to be considerably reduced with respect to the bulk value (in this case, a value around 60 emu/g is measured at room temperature (see Table 1), compared with 92 emu/g of bulk magnetite). This fact has been explained by invoking the presence of a magnetically dead layer at the particle surface [37]; the thickness of such a layer is of the order of 0.5–1 nm. The term “dead layer” means a magnetically disordered, extra-hard phase whose contribution to one nanoparticle’s net magnetic moment is negligible because of spin compensation; the magnetic field needed to align the frustrated magnetic moments in the dead layer is much higher than the maximum field used in the present measurements. The magnetic disorder of the dead layer arises from competition among magnetic energies (exchange, anisotropies) affected by the symmetry breaking at the boundary of the particle [4]; as a consequence, such a layer is expected to continuously envelop a nanoparticle’s core.
In the considered NC, the mean interparticle distance (about 25 nm, as deduced from Figure 1, top center) is so large that dipolar interparticle interactions are almost completely negligible (the root mean square (r.m.s.) dipolar energy in this case being as small as erg [38]). Therefore, this material can be viewed as containing basically non-interacting, individual NPs of known composition and shape. As a consequence, one should expect that above blocking temperature, the material is in the ideal superparamagnetic (SP) regime. This is not exactly the case, however, because of the small dipolar interactions existing among NPs, as proven by Figure 2, where two scaling laws are compared: the standard SP scaling law, which applies to bona-fide SP systems (top left panel), and the ISP scaling law (top right panel), which applies to systems where the effects of dipolar interactions, although small, are not completely negligible [17,39]. The abscissa in the top right panel is the ISP scaling parameter, whose expression has been discussed in detail elsewhere [40]; here, Ms is the saturation magnetization, kB is the Boltzmann’s constant, N is the total number of particles per unit volume, and α is a constant measuring the dipolar energy.
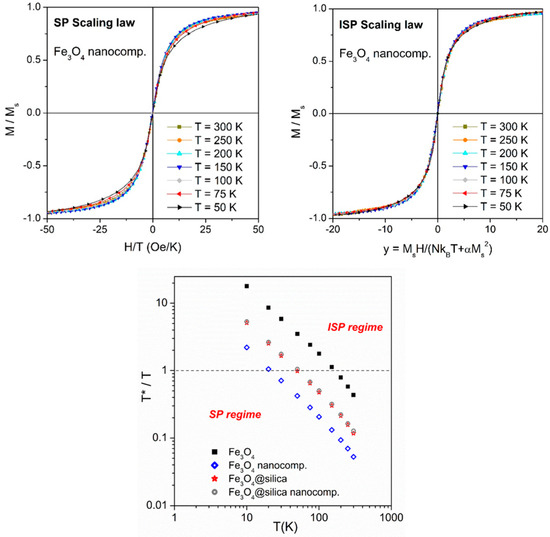
Figure 2.
Top panels: Scaling laws in the polymer NC containing bare Fe3O4 NPs. Left: standard superparamagnetic (SP) scaling; right: interacting superparamagnetic (ISP) scaling; bottom: temperature behavior of the ratio T*/T in the same system.
The dipolar temperature T*, a quantity measuring the strength of the dipolar interaction in the ISP model, is very small in this case compared with other NP systems, as shown in Figure 2 (bottom panel, open blue symbols). This magnetic NC is basically in the SP regime (corresponding to T*/T < 1) above 20 K. Instead, the nanopowder has a much higher degree of interaction.
Quite interestingly, when the same magnetite NPs are inserted in the same polymeric matrix after being encapsulated into a diamagnetic shell of silica (SiO2), the magnetic properties of the NC change remarkably. Particle coating with silica was done as follows: a dispersion of oleylamine-coated Fe3O4 NPs in cyclohexane was added to cyclohexane and mixed with Igepal CO-520. The pH was adjusted to ≅10 through the addition of ammonium hydroxide and the formation of a transparent brown microemulsion was ensured with the aid of a sonicator. Then, tetraethoxysilane (TEOS) was added and the reaction was stirred at room temperature for 48 h. Subsequently, the reaction mixture was washed with ethanol and particles underwent different cycles of centrifugation and redispersion to remove the surfactant. Finally, silica particles containing magnetite NPs (Fe3O4@silica) were dried under vacuum. The average size of silica particles was 25.6 nm; TEM image analysis revealed that each silica shell hosts 3–4 magnetite NPs [11].
The appearance of the NC containing Fe3O4@silica NPs is shown in Figure 1 (top right). Although the hysteretic properties of this NC are generally similar to the ones measured in the NC hosting bare Fe3O4 NPs, both the coercive field at low temperatures and the fictive dipolar interaction temperature T* are much higher (Figure 1, bottom right and 2, bottom panel). This behavior is consistent with an increase in the interparticle interactions in the NC. It should be remarked that the T*/T curve of Fe3O4@silica nanopowder and of the associated NC is identical (Figure 2, bottom panel), indicating that the strength of interaction among NPs is basically the same; in fact, the dominant interparticle interaction is the one among the magnetite NPs hosted by the same silica shell, while interaction among different silica particles is much smaller.
Both NCs containing almost unimodal, pure-Fe3O4 NPs (either bare or surrounded by the silica shell) are thus apt to be studied through a model, which applies to independent (non-interacting) magnetic units. In one case, these units are coincident with the bare NPs themselves; in the other case, the magnetic units are silica particles containing a small number of interacting magnetite NPs.
The model, based upon a rate-equation approach to ordering/disordering of double-well systems [27], allows one to evaluate the size distribution p(D) of a system of non-interacting NPs starting from the ZFC curve:
where Keff is an effective magnetic anisotropy constant (considered to be temperature-independent over narrow temperature intervals); MZFC, M′ZFC are the ZFC curve and its derivative with respect to temperature; Ms is the NP saturation magnetization; and H is the measurement field. An example of p(D) curves resulting from the application of Equation (1) to the experimental ZFC curves of both NCs (shown in Figure 3, top panel) is given in the middle panel of Figure 3.
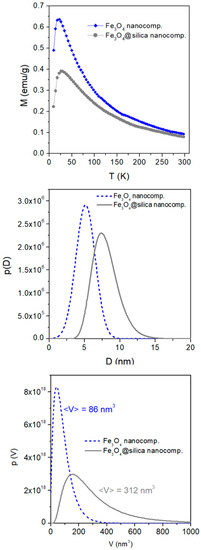
Figure 3.
(Top panel) experimental ZFC magnetization curves of the Fe3O4 and Fe3O4@silica NCs; (center panel) corresponding normalized p(D) curves obtained from Equation (1); (bottom panel) corresponding volume distribution functions p(V). <V> is the resulting mean value of magnetic-unit volume.
The mean size of bare magnetic NPs is in good agreement with the TEM data; instead, the mean volume of magnetic units in the Fe3O4@silica NC appears to be 3.6 times larger than the mean volume of bare Fe3O4 NPs. This is in very good agreement with the number of magnetite NPs per silica particle estimated from TEM image analysis (3–4 magnetite NPs). The p(V) curve shown in Figure 3 (bottom panel) is directly obtained from the p(D) function through the relation , which applies to spheroidal particles of diameter D and volume .
3.2. Anisotropic Magnetic Structures in Polymer Nanocomposites
NCs containing a fine, even dispersion of magnetic NPs, such as the ones discussed so far, are intrinsically isotropic. On the contrary, NCs exhibiting remarkable anisotropic magnetic properties can be obtained by means of magnetic field-assisted curing of precursor resins. Anisotropic magnetic properties are expedient, for example, in the realization of direction-sensitive magnetic sensors and devices [41,42,43,44].
A typical example consists of core-shell particles of titania (TiO2) encompassing a large number of aggregate magnetite NPs, which are first dispersed in an epoxy monomer; subsequent curing under a strong inhomogeneous magnetic field produces stable chains constituted of magnetite-charged titania particles (Fe3O4@TiO2) formed in the matrix by field-assisted self-assembly, and is responsible for a distinctly anisotropic magnetic behavior.
The TEM images of bare Fe3O4 NPs and of a typical titania particle containing a number of magnetite NPs are given in Figure 4 (top panels).
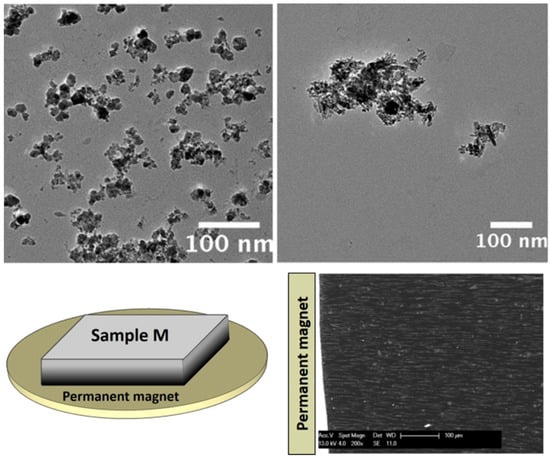
Figure 4.
TEM images of bare magnetite NPs (top left) and Fe3O4@TiO2 NPs (top right) used to prepare anisotropic NCs. Reprinted from the work of [41] with permission from Elsevier; (bottom left) sketch of the setup used to produce anisotropic magnetic NCs; (bottom right) micrometer-sized chains, which have been aligned along the direction of magnetic flux lines. Reprinted in modified form from the work of [41] with permission from Elsevier.
In this case, the bare NPs have mean diameter of 19.2 nm with standard deviation of 3.3 nm (Figure 4, top left); a typical particle of magnetite-charged titania contains large aggregates of Fe3O4 NPs (tens to hundreds of NPs); these Fe3O4@TiO2 particles are characterized by highly irregular shapes (Figure 4, top right) and by a wide distribution of sizes.
NC slabs containing Fe3O4@TiO2 particles obtained by applying a suitable magnetic field gradient show the formation of high-aspect ratio structure (micrometer-size chains aligned along the direction of the magnetic flux lines and along the short axis of the slab); here, we focus on a 0.5-mm thick sample kept adjacent to the magnet during the curing process (sample M; Figure 4, bottom left). The exploited geometry ensures that the magnetic force on NPs is high throughout the slab. This NC displays a high chain length and density (Figure 4, bottom right). In particular, the average chain length is estimated to be 70 μm.
According to a simple model, these chains can be thought of as prolate rotation ellipsoids made up of a large number of titania particles, each of them containing in turn a number of magnetite NPs with crystal axes at random with respect to the major ellipsoid’s axis. The chain structure and substructure are depicted in Figure 5. Contact interaction among NPs is neglected because they do not touch each other, being enveloped by the titania layer. Within each chain, titania particles self-assemble by effect of electrostatic and magnetostatic interactions under the strong magnetic force applied during the process of monomer curing; however, the irregular shape of titania particles (see Figure 4, bottom right) implies that their degree of compaction is not very high, and the hosting polymer fills the interstices among a given titania particle and the adjacent ones. Therefore, a single chain is composed mostly of diamagnetic media, with a low overall magnetic fraction. A strong dipolar interaction is expected to arise among NPs treated as magnetic dipoles; the density of magnetic units is large enough to predict long-range directional magnetic order of NP moments sustained by dipolar interaction. As a result, each chain is characterized by a net global magnetization: the magnetic dipoles tend to align along the major axis of the ellipsoid when no field is applied and a demagnetizing field appears when the external field is applied along the ellipsoid’s short axis.
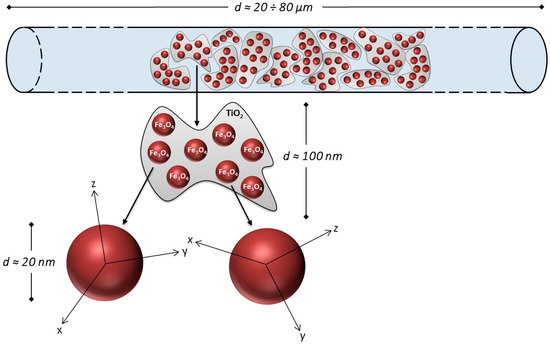
Figure 5.
Morphology of a magnetic chain in the Fe3O4@TiO2 NC (not to scale). Within the chain, the crystal axes of magnetite NPs are randomly directed. Reprinted in modified form from the work of [41] with permission from Elsevier.
The anisotropic morphology of this NC is reflected in the anisotropy of its magnetic properties. For instance, the coercive field measured along directions parallel/perpendicular to the chains is shown in Figure 6 (top left) as a function of measurement temperature. Generally speaking, the coercive field of hysteresis loops increases with decreasing temperature, as usual; however, it also depends on the direction of the applied field. The uncertainty on the Hc values being typically less than 1 Oe, the measured differences arise from a real effect. This anisotropy is simply explained by considering the effect of the demagnetizing field. As shown in Figure 6 (top right), when the loops measured (in this case, at T = 50 K) in the parallel and perpendicular field configuration are plotted (red and blue dotted curves, respectively), they are different, with the loop taken in the parallel configuration being steeper. However, when the data taken in the perpendicular configuration are plotted against the true field Htrue = H − Hdem = H − 2πM(H) [41], the curve (blue full symbols) becomes almost perfectly superimposed to the one obtained in the parallel configuration, and the difference between coercive fields vanishes. In the parallel configuration, the applied field is coincident with the true field, with Hdem being negligible in this case.
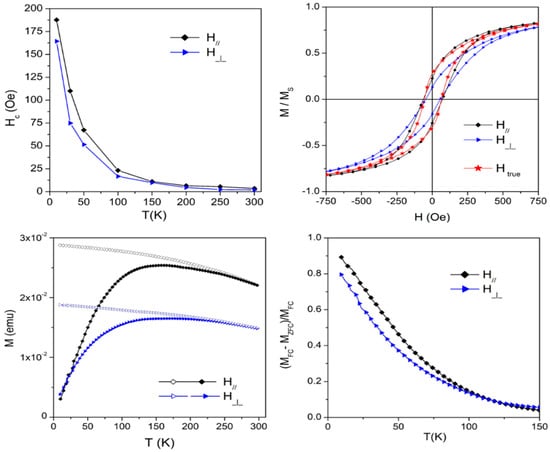
Figure 6.
(Top left): anisotropic coercive field as a function of temperature; (top right): hysteresis loops measured at T = 50 K. The loops are different when plotted vs. the applied field; they become coincident when plotted vs. the true field; (bottom left): anisotropic FC/ZFC curves (applied field: 100 Oe); (bottom right): reduced FC-ZFC curve differences in parallel and perpendicular field configurations.
Anisotropic effects are also observed in FC/ZFC curves, as shown in Figure 6 (bottom left). Here, a magnetic field of 100 Oe was applied parallel and perpendicular to the chains; the resulting FC/ZFC curves are not only different in magnitude, but also in shape, as shown by the bottom right panel of Figure 6.
Both ZFC curves display a broad maximum before merging with the FC curves. In both measuring configurations, the ZFC curve maxima are at Tmax = 160 K and the ZFC/FC curves merge at TMERG = 250 K. In the considered sample, the curves taken in the parallel configuration (i.e., along the short axis of the sample) are higher than the ones observed in the perpendicular configuration. The general features of FC/ZFC curves can only partially be explained by the spread in the NP size determined through TEM image analysis, and probably also arise from dipolar interparticle interactions. Note that the ZFC curve is closer to the corresponding FC when the field is applied perpendicular to the chains.
This anisotropic behavior has been explained by a model that takes into account the role of chain shape anisotropy (a mesoscopic effect) in determining the choice of the easy axis of local crystal anisotropy (a nanoscale effect), along which the magnetization of each NP blocks on cooling in the absence of a magnetic field. Shape anisotropy, favoring dipole alignment along the major axis of the chains, is responsible for the directional dependence of the ZFC curve, which becomes closer to the corresponding FC curve when the measurement configuration is perpendicular.
The magnetic behavior of this NC implies that the elongated chains present in the sample basically behave as individual magnetic entities at the mesoscale; their behavior originates from the embedded magnetite NPs whose magnetic moments interact at the nanoscale. As in macroscopic magnetic bodies, dipolar magnetic interaction provides the link between nanoscale and mesoscale magnetic properties.
4. Ceramic Nanocomposites
Magnetic metal–ceramic nanocomposites, consisting of a dispersion of transition metal (TM = Fe, Co, Ni) nanoparticles into a ceramic matrix, are being actively studied in view of a variety of applications associated with their porous structure, ranging from environmental issues (e.g., water remediation [45,46,47], treatment of pollutants [48,49,50,51,52]) to catalysis [53,54,55,56] and biomedicine [57,58]).
The magnetic nanocomposites whose magnetic behavior is reviewed in this work were obtained from zeolite precursors by means of a smart and scalable process [14,59,60,61]. Through such a patented process, the final products are obtained by thermal treatment under reducing atmosphere of commercial zeolites (precursors) loaded with TM ions. Treatment temperatures are relatively moderate, as discussed below. During thermal treatment, the starting zeolite structure is almost totally degraded, and the final product of the process is an NC material that contains metallic TM NPs (with sizes ranging from few nanometers or tenths of nanometers) evenly dispersed in a mostly amorphous silica and alumina matrix. This NC is almost completely devoid of the features of the parent zeolite from which it originated; however, it exhibits an irregular residual porosity, associated with the starting zeolite precursor, which can be exploited for a number of applications including water remediation [62] and DNA adsorption and separation [63]. Nanocomposites studied in the literature [14,59,60,61,62,63] exhibit magnetic properties [64] owing to the presence therein of Fe0, Co0, or Ni0 ferromagnetic nanoparticles deriving from Fe2+, Co2+, or Ni2+ reduction, respectively.
The steps of the preparation process can be summarized as follows: the parent zeolite is first contacted with a solution containing the selected TM ions at a low temperature for a suitable time; the solid is separated from the liquid through filtration and contacted anew with a fresh solution; the above procedure is iterated in order to control the exchange between TM and the cation(s) originally present in the zeolite. Cation-exchange operations are described in the literature [65,66,67]. Subsequently, the powders are heated from room temperature up to the target temperature (typically ranging between 600 °C and 850 °C) under a reducing atmosphere (created by a flow of a 2% vol. H2 gaseous mixture with Ar) and are either kept at that temperature for a selected time, or immediately cooled down within the furnace to room temperature. During such thermal treatments under a reducing atmosphere, the following phenomena are known to occur [68,69]:
- (1)
- Reduction of the TM cation to 0 oxidation number with possible structural damage of the zeolite framework.
- (2)
- Migration of the new formed metallic atoms to form metallic clusters located into the cavities of the microporous zeolite structure.
- (3)
- Migration of the new formed metallic atoms out of the cavities and channels present in the microporous zeolite structure to form metallic particles located on the outer surface of zeolite grains.
- (4)
- Thermal collapse of the microporous zeolite structure.
- (5)
- Possible crystallization of ceramic structures.
It must be evidenced that it is not said that these phenomena occur in the reported order as they may superimpose each other.
As is evident from the short description of the smart and scalable process used, the proposed technique of production of magnetic nanocomposites is very simple and cheap. Despite this, our technique allows strict control of the structure and texture of the nanocomposites by simply operating on a number of key parameters. Such strict control results in a careful tuning of their technological properties. The main key parameters are reported hereafter together with a short explanation of how they work:
- (1)
- The type of the parent zeolite. This strongly affects both the features of the ceramic matrix and the number, dimension, distribution, and morphology of magnetic metal nanoparticles. In actual fact, different zeolites exhibit different Si/Al ratios, frameworks, and cation locations. It is evident that the Si/Al ratio affects the ceramic matrix, whereas the cation location in the framework of the zeolite affects the features of the TM magnetic nanoparticles as they arise from the migration of the newly formed TM atoms from their original cation sites.
- (2)
- Cation exchange procedure. Through cation exchange, different TM cations (also more than one contemporaneously) may be introduced in the zeolite framework to a various extent, which affects the magnetic metal(s) nanoparticles. Moreover, through cation exchange as well as alkaline-earth cations (e.g., Ba2+ and Sr2+) may be introduced into the zeolite framework, thus giving rise to ceramic phases, which modify the features of the ceramic matrix [70,71].
- (3)
- The temperature and time of the thermal treatment under the reducing atmosphere. These affect the extent to which the reduction of TM cation(s) to 0 oxidation number and the thermal collapse of the zeolite framework occur. Moreover, the migration of the newly formed TM atoms and, therefore, the dimension and morphology of the magnetic nanoparticles, are also strongly dependent on these key parameters.
It must be noted that this simple and cheap process appears to be strongly related to a peculiarity of zeolites. In actual fact, it is well known that cations are bound to the zeolite framework by ionic bonds weakened by the action of zeolitic water acting as a dielectric medium [72,73]. The thermal treatments at relatively moderate temperatures (600–850 °C), under a reducing atmosphere, to which the TM-exchanged zeolites are subjected, are able to reduce the TM cations only on account of such peculiarity. Thus, other different classes of ceramic functional materials do not seem, at least at a first sight, as likely precursors for metal–ceramic nanocomposites.
Typical values of static magnetic quantities measured in ceramic nanocomposites are reported in Table 1 (bottom).
4.1. Ceramic Nanocomposites Containing CoFe
The details of the thermal treatment and the choice of the transition metal ions are critical to the realization of a properly tailored NC material. Evidence of this is given by the study of NCs obtained by loading the parent zeolite with a mixture of two different magnetic metal ions, such as Fe2+ and Co2+. These metal–ceramic nanocomposites were obtained as follows: a sample of commercial zeolite A was contacted with a [Co2+] = 0.1 M aqueous solution for 3 h at solid/liquid ratio 1/50, under continuous stirring. The solid was separated from the liquid through filtration and these operations were iterated seven times. Then, the solid was washed with distilled water and came into contact twice with a [Fe2+] = 0.1 M aqueous solution for 40 min at solid/liquid ratio 1/50, under continuous stirring. This sample of (Co-Fe)-exchanged zeolite A contained Fe2+ 7.2 and Co2+ 14.8 wt. %. Finally, two different aliquots of the (Co-Fe)-exchanged zeolite A were thermally treated for 2 h (10 °C/min heating rate) at 750 and 800 °C under a reducing atmosphere created by a flow H2–Ar gaseous mixture (2 vol.% H2). The room temperature hysteresis loops of the resulting metal–ceramic nanocomposites are shown in the left panel of Figure 7. Note the enlarged scale used to enhance the low-field details; of course, the magnetization curves are fully saturated at H = 17 kOe. The saturation magnetization of the whole sample (including the diamagnetic host) is 1.14 and 0.71 emu/g (the higher value corresponding to the sample treated at the lower temperature).
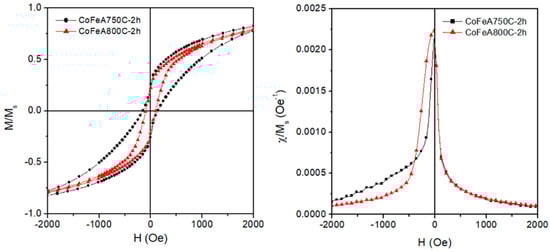
Figure 7.
(Left panel) magnetic hysteresis loops measured at room temperature on two CoFe ceramic NCs obtained starting from A zeolite; (right panel) normalized magnetic susceptibility of the same samples.
The remarkable differences between loops include a generally steeper, more regular loop and a smaller coercive field in sample CoFeA800C-2 h when compared with the other sample. In fact, sample CoFeA750C—2 h displays a notably asymmetric shape, which is better observed looking at the susceptibility curves (Figure 7, right panel). In the latter sample, the loop slope suddenly changes around H = 0 on both loop branches. This is usually the hallmark of a biphasic magnetic system, that is, a system containing two phases with different magnetic anisotropy; it is suggested that in these material Fe-rich and Co-rich NPs are simultaneously present, with the change in slope of the M(H) curve being related to the interplay of the different anisotropy constants of the transition metals. However, an increase of 50 K in the treatment temperature is enough to generate a magnetically more homogeneous NP system. It is suggested that in this case, most of the metallic NPs contain a Co–Fe alloy.
4.2. Ceramic Nanocomposites Containing Fe
In order to avoid interpretation problems arising from compositional inhomogeneity of NPs, single TM species can be used to load the precursor zeolite. The room temperature loops of four metal–ceramic NCs obtained by applying different thermal treatments and exchange processes to an A zeolite loaded with Fe2+ ions are shown in Figure 8.
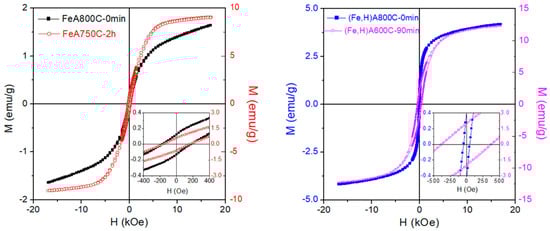
Figure 8.
Room temperature hysteresis loops of four Fe NCs obtained from an A-type zeolite under different thermal treatments and exchange processes.
These metal–ceramic nanocomposites were obtained as previously described for nanocomposites bearing Co and Fe. In particular, the samples shown in the left-side panel of Figure 8 were obtained by eight iterations the exchange of Na+ ions with Fe 2+ ions [63]; despite the high number of iterations, the exchange of TM ions for Na+ did not reach completion; on the contrary, the samples in the right-side panel were obtained by implementing an exchange of NH4+ for Na+ first, followed by the exchange of Fe2+ for NH4+ and the residual Na+, resulting in a more complete substitution of non-magnetic ions with magnetic ions [62]. The shape and hysteretic properties of the loops measured on samples FeA750C—2 h (obtained by keeping the parent materials at 750 °C for two hours [63]) and FeA800C—0 min (obtained by heating the parent materials up to 800 °C with subsequent immediate cooling [63]) are typical of a magnetization process involving both magnetization rotation and domain-wall motion, usually observed in Fe particles with a size of several tens of nanometers, which are in a magnetic multi-domain state. The coercive field is of the order of 170 Oe in both samples. Sample FeA800C—0 min displays a much weaker magnetic signal and clear unsaturating behavior of the M(H) curve at high fields. Such behavior can be explained by the presence of very small iron NPs or clusters, although the contribution of a paramagnetic signal (either from isolated Fe ions or from a compound such as fayalite, Fe2SiO4) cannot be excluded. This implies that a non-negligible fraction of the starting TM ions has not completely coalesced to form zerovalent Fe NPs. The same effect is observed in all other samples, although the efficiency of the TM ion exchange is generally improved by adding the preliminary NH4+ exchange. The different amount and morphology of the magnetic phases present in the final products result in a very different magnetic behavior, as shown in Figure 8, right panel [62]. The NC (Fe,H)A600C—90 min exhibits an overall magnetic response stronger than (Fe,H)A800C—0 min, as expected from the estimated amounts of ferro/ferrimagnetic phases present there (magnetite = 7.1 and metallic Fe = 4.8 wt.% in the former sample; magnetite = 5.4 and metallic Fe = 0.2 wt.% in the latter). The NC (Fe,H)A800C—0 min, particularly rich in magnetite, has a coercivity typical of Fe3O4 NPs (≅45 Oe), while the coercive field of magnetic NC (Fe,H)A600C—90 min (Hc ≅ 375 Oe) is fully compatible with the presence of higher-anisotropy NPs of metallic Fe. Once again, it is found that although the process is effective in producing zerovalent Fe NPs dispersed in the ceramic matrix, a fraction of the starting TM ions is not included and either takes part in magnetic compounds or remains dissolved in the host.
In spite of such an incomplete transformation, the magnetic properties of the considered Fe NCs are compatible with usage in practical applications; these materials have been successfully exploited in water remediation [62] and DNA separation [63], as shown in Figure 9.
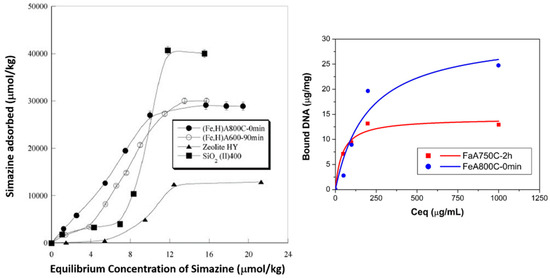
Figure 9.
(Left) sorption isotherm of simazine on (Fe,H)A800C—0 min (full circles), (Fe,H)A600C—90 min (empty circles), zeolite H–Y(full triangle), and SiO2(II)400 (full square) samples. Reprinted from the work of [62] with permission from Elsevier; (right) adsorption isotherm for DNA equilibrium concentration in FeA800C—0 min (circles) and FeA750C—2 h (squares) sample suspensions. Solid lines: Langmuir curve-fits.
The sorption isotherm of simazine on (Fe,H)A800C—0 min and (Fe,H)A600C—90 min samples is reported in Figure 9 (left), with other competing materials (zeolite H–Y and micro- and meso-porous silica SiO2(II)400) being included for comparison. The simazine concentration in the practice of water remediation from agrochemicals is typically in the range 9–10 μmol/L to below a law limit of 0.25 μmol/L [74,75]; in such a concentration range, the adsorption isotherm of magnetic adsorbents (Fe,H)A800C—0 min and (Fe,H)A600C—90 min lies far above those of both silica sample SiO2(II)400 and zeolite H–Y, thus certifying their higher efficiency in the simazine adsorption process.
Standard DNA adsorption isotherms using samples FeA800C—0 min and FeA750C—2 h are illustrated in Figure 9 (right). Both samples exhibit a sufficient magnetic response, allowing an easy separation of the solid adsorbent from the supernatant liquid by exposition to an external magnet. Considering the porosity and adsorption behavior of the final products, sample FeA800C—0 min, although characterized by a weaker magnetic signal, exhibits a far higher surface area than sample FeA750C—2 h, which explains the better performance in DNA adsorption in the former sample. From this viewpoint, the thermal treatment used to obtain sample FeA800C—0 min generates a more suitable NC than the treatment used to obtain sample FeA750C—2 h.
4.3. Ceramic Nanocomposites Containing Ni
The interplay between NPs containing a zerovalent TM and residual TM ions still present in the ceramic matrix has been elucidated through a detailed investigation of Ni2+ exchanged A/X zeolites, which can be considered a study case for the general understanding of the magnetic behavior of this class of nanomaterials [14]. The complex sequence of operations implemented to obtain the magnetic NCs is shown in Figure 10; the NCs are the result of a variety of cation exchange procedures and thermal treatments.
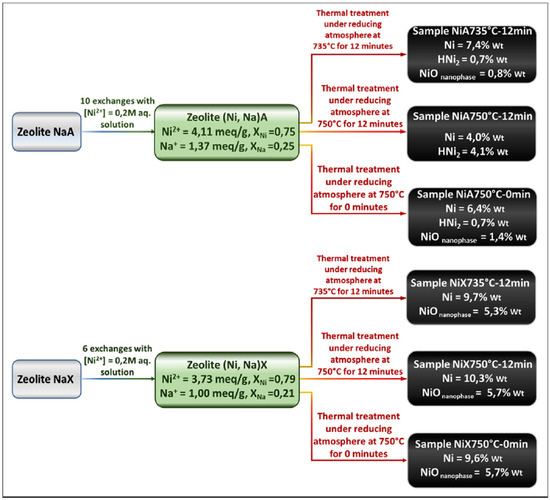
Figure 10.
Sequence of the operations implemented in the preparation of Ni NCs. Reprinted from the work of [64] with permission from Elsevier.
Three representative TEM images of the ceramic NCs are shown in Figure 11, Figure 12 and Figure 13; these images clearly show the presence of a large fraction of Ni NPs; the corresponding particle size distributions are also reported.
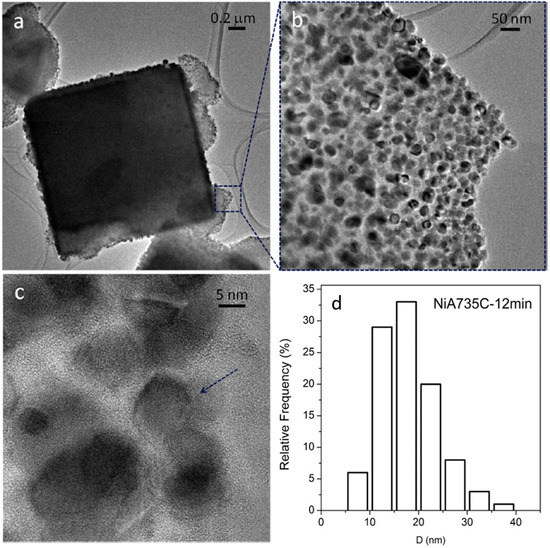
Figure 11.
TEM (a,b) and HR-TEM (high resolution TEM) (c) images of the NiA735C—12 min sample. Instrumental magnification: 6000×, 30,000×, and 400,000×. Reprinted in modified form from the work of [14] with permission from Elsevier. (d) Ni particle size distribution.
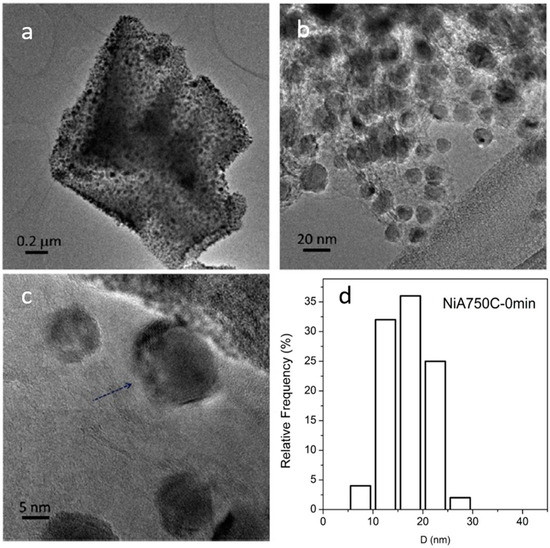
Figure 12.
TEM (a–c) and HR-TEM (d) images collected of the NiA750C—0 min sample. Instrumental magnification: 8000×, 30,000×, 100,000×, and 400,000×. Reprinted in modified form from the work of [14] with permission from Elsevier. (d) Ni particle size distribution.
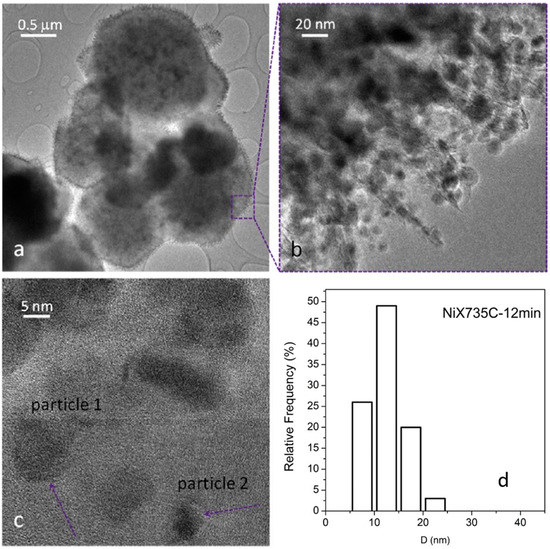
Figure 13.
TEM (a,b) and HR-TEM (c) images of the NiX735C—12 min sample. Instrumental magnification: 4000×, 100,000×, and 400,000×. Reprinted in modified form from the work of [14] with permission from Elsevier. (d) Ni particle size distribution.
The nanoparticulate phase of these NCs is dominated by Ni0 particles, although a little fraction of HNi2 particles has also been detected (in A zeolite-derived materials only, see Figure 10). The room temperature saturation magnetization is observed to linearly increase with the total content of Ni in the nanoparticulate phase, as shown in Figure 14.
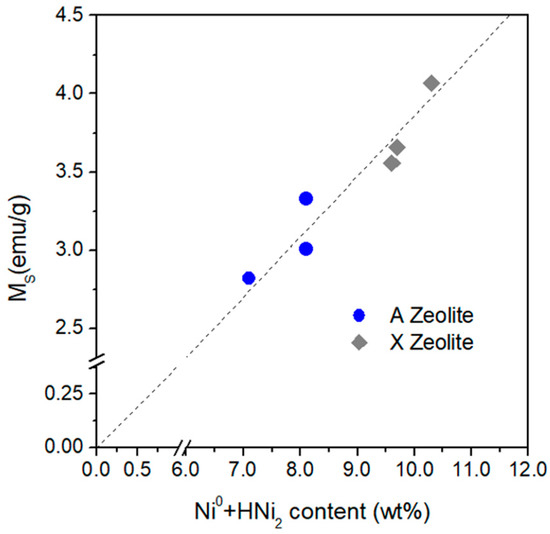
Figure 14.
Room temperature saturation magnetization Ms as a function of the total content of metallic Ni and hexagonal nickel hydride.
However, a study of the magnetic response of these NCs as a function of temperature down to T = 2 K clearly indicates that a non-negligible fraction of Ni does not belong to the nanoparticulate phase. This can be easily understood by examining the changes taking place in the shape of the hysteresis loops of the entire family of NCs when the temperature is lowered; for the sake of simplicity, one representative example of a sample not containing HNi2 compound (see Figure 10) (sample NiX735C—12 min) will be discussed here. The hysteresis loops are shown in Figure 15; the upper/lower insets show the high-field magnetization as a function of temperature and some loops in the low field region, respectively.
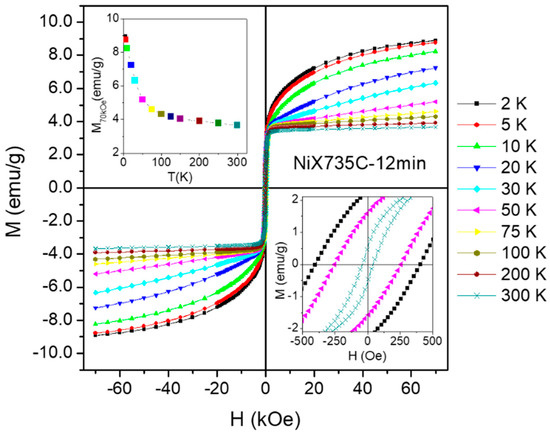
Figure 15.
Hysteresis loops measured in sample NiX735C—12 min in the temperature interval 2–300 K and in the field range −70 kOe ≤ H ≤ 70 kOe. Upper inset: high-field magnetization as a function of temperature; lower inset: detail of the low-field region for three temperatures.
A strong non-ferromagnetic signal is observed to increasingly emerge with lowering of the temperature; this signal adds to the saturating behavior of the M(H) curve that dominates above 250 K. Such an effect is reflected by the temperature behavior of the high-field magnetization M70kOe shown in the inset Figure 15. The non-saturating contribution to M(H) is linear above 30 K, but a downward curvature appears below this temperature. An accurate estimate of the non-saturating (paramagnetic) fraction is based on the analysis of the curves reported in Figure 15 and is supported by QPA (quantitative phase analysis) of powder diffraction patterns under synchrotron radiation [64]; in this material, the paramagnetic fraction turns out to be as high as 46% of the total loaded Ni.
The FC/ZFC curve measured in sample NiX735C—12 min is shown in the left panel of Figure 16 (top left).
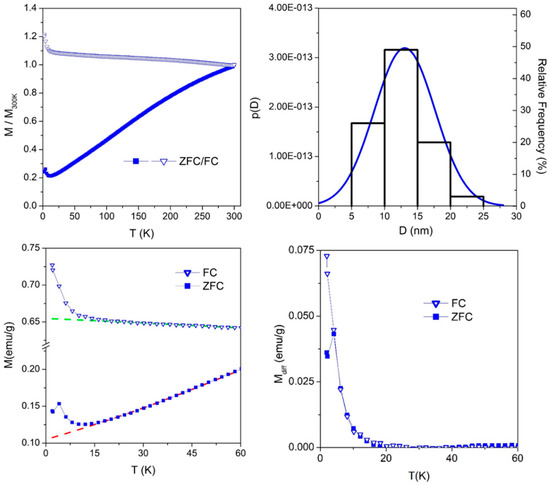
Figure 16.
(Top left) FC/ZFC curves of sample NiX735C—12 min; (top right) NP size distribution derived from the ZFC curve analysis (blue line), superimposed to the experimental histogram (Figure 13d); (bottom left) magnification of the low-temperature structures of FC/ZFC curves in sample NIX735C—12 min; (bottom right) low-temperature structures resulting after subtraction of the baseline.
The two curves become separate at exactly room temperature, indicating that the blocking temperature of zerovalent Ni NPs is well above room temperature [27]; see Table 1. The FC/ZFC curves are almost featureless over nearly the whole examined temperature range (i.e., above 20 K), with the FC curve being almost flat and the ZFC magnetization increasing almost linearly with T. The rate-equation model developed to evaluate the size distribution p(D) of a system of non-interacting NPs starting from the ZFC curve can be tentatively applied even in this case, although the density of NPs indicates that they must be somewhat interacting. Applying Equation (1) to the ZFC curve of Figure 16 (top left) above 20 K (in order to exclude the low-temperature anomaly, which will be discussed in due time), one gets the Gaussian p(D) curve shown in the top right panel; a comparison with the histogram obtained from TEM image analysis indicates that the model is able to approximately predict the size distribution even in the case of interacting NPs.
High-field magnetic susceptibility measurements were performed on sample NiX735C—12 min to identify the non-ferromagnetic phase in these NCs. The linear behavior of the reciprocal high-field susceptibility plotted as a function of temperature (Figure 17, left panel) clearly indicates the existence of a pure paramagnetic phase at high T; at intermediate temperatures (50 K ≤ T ≤ 200 K), the experimental curve deviates from the linear behavior, showing a small downward concavity; at even lower temperatures, a broad minimum followed by a new increase of is observed. The deviations from the linear behavior observed with all the samples above 50 K indicate that an interaction exists among paramagnetic ions in these materials. This is substantiated by plotting the product χHFT as a function of temperature (Figure 17, right panel). Both the downward concavity of the χHF−1 versus T curve above 50 K and the shallow minimum in the χHFT curve, followed by an increase at lower temperatures [76,77,78], indicate that the interaction among paramagnetic ions is basically ferrimagnetic.
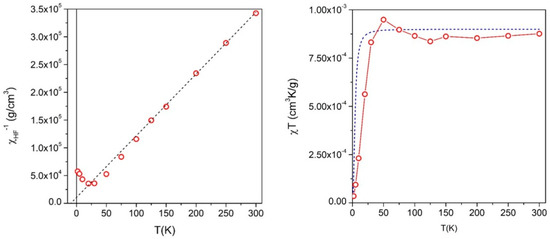
Figure 17.
(Left panel) reciprocal of the high-field susceptibility χHF−1 as a function of temperature in sample NiX735C—12 min. Symbols: experimental data, dotted line: high-temperature linear fit; (right panel) χHFT product as a function of temperature. Symbols: experimental data, line: expected behavior using the magnetic moment per ion obtained fitting the linear part of the χHF−1 curve to a modified Curie law.
Further information comes from the analysis of the low-temperature anomaly of FC/ZFC curves, as shown in Figure 16 (bottom left): a monotonic increase and a bump of the magnetization are superimposed to the featureless FC and ZFC curves, respectively. The effect can be singled out by extrapolating the FC/ZFC curves down to a low temperature, as shown by the dashed lines in the bottom left panel of Figure 16, and by subtracting this baseline from the experimental data, as shown in the bottom right panel of Figure 16. Although the peak in the ZFC curve is not perfectly defined because of the extremely low temperature range where the effect develops, the very same behavior is observed in all samples [64], indicating that the maximum of the ZFC curve is not an artifact.
The low-temperature structure of FC/ZFC curves indicates some blocking effect at a temperature TB of the order of 4 K in sample NIX735C—12 min. The magnetic nanostructures that undergo this blocking cannot be the zerovalent Ni NPs, which have a blocking temperature above 300 K. As a consequence, we infer that at low temperatures, the interaction among individual Ni2+ ions shown by the χHF−1 and χHFT curves (Figure 17) results in the formation of ferrimagnetic-like clusters of interacting Ni2+ ions whose magnetic moments are thought to be collectively responding to the magnetic field; cluster moments undergo blocking in the temperature range 3–4.5 K, depending on the sample.
This complete magnetic study shows that NCs produced from Ni-loaded precursor A/X zeolites contain two magnetic phases. Firstly, at room temperature, the dominant magnetic signal comes from the nanoparticulate phase mostly comprised of Ni0 and—to a much lesser extent—HNi2 NPs and is characterized by a saturating magnetization loop. Secondly, at lower temperatures, the contribution from a non-negligible fraction of dispersed Ni2+ ions begins to play a role, exhibiting a complex behavior, that is, the pure paramagnetic response observed at high temperatures is modified by interactions among ionic moments, which result in the appearance below ca. 20 K of ferrimagnetic-like ionic clusters, which become the low temperature individual ordering units and which undergo individual blocking below 5 K.
5. Conclusions
The magnetic properties of several NCs obtained by a variety of preparation techniques and containing nanoparticles composed of different transition metals or compounds have been reviewed. It has been shown that the magnetic behavior of these materials critically depends on NP size distribution, interaction, and degree of aggregation. In diluted samples, the magnetic properties can be described in terms of non-interacting or weakly interacting NPs; in more concentrated samples, dipolar interaction can lead to the formation of mesoscopic structures comprised of a number of NPs and behaving as single magnetic units; this effect is responsible for a remarkable anisotropic behavior of the NC. In NCs produced starting from TM-exchanged zeolites, NPs with sizes in the 10–20 nm range and much smaller magnetic units coexist in the ceramic matrix; such magnetic units can either be single transition-metal ions or ion clusters. The presence of two magnetic phases is best shown by low temperature measurements.
As a general rule, a sound interpretation of the magnetic properties of a given NC cannot be done without simultaneously considering the effects of composition, structure, and morphology; often, the complex magnetic behavior of a NC material can only be explained by doing measurements over a wide range of temperatures and by making use of precise, well-assessed structural and morphological data.
Precise tailoring of the magnetic properties of an NC material for a particular application is made difficult by the number of physical and chemical parameters (often ill-defined), which play a role in the various steps of the preparation process. However, in spite of the problems still concerning precise control and efficient optimization of the magnetic NPs dispersed in the host matrix, the interest of the scientific community towards magnetic NCs remains very high because of the many new opportunities these functional materials have given in high-impact areas of modern science and technology, as proven by the examples of applications to environmental and biochemical issues highlighted in this paper.
Author Contributions
Conceptualization, P.A. and M.P.; investigation, G.B., B.B., S.E., A.M., Y.L. and P.T.; validation, G.B., B.B., S.E., A.M., Y.L. and P.T.; data curation, G.B., B.B., S.E., A.M., Y.L. and P.T.; writing—original draft preparation, G.B., P.A. and M.P.; writing—review and editing, G.B., P.A. and M.P.; visualization, G.B.; supervision, P.A., Y.L. and M.P.
Funding
This research received no external funding.
Acknowledgments
The Authors thank Tommaso Nardi (formerly at EPFL) for preparing the polymer nanocomposites and for the corresponding TEM images.
Conflicts of Interest
The authors declare no conflicts of interest.
References
- Chou, T.-W.; Sun, C.-T. Nanocomposites; DEStech Publications: Lancaster, PA, USA, 2012; ISBN 9781605950730. [Google Scholar]
- Ajayan, P.M.; Schadler, L.S.; Braun, P.V. Nanocomposite Science and Technology; Wiley-VCH Verlag GmbH & Co. KGaA: Weinheim, Germany, 2003; ISBN 3527303596. [Google Scholar]
- Alamri, H. Synthesis of New Magnetic Nanocomposite Materials for Data Storage. Master’s Thesis, University of Waterloo, Waterloo, ON, Canada, 2012. [Google Scholar]
- Koksharov, Y.A. Magnetism of Nanoparticles: Effects of Size, Shape, and Interactions. In Magnetic Nanoparticles; Gubin, S.P., Ed.; Wiley-VCH Verlag GmbH & Co. KGaA: Weinheim, Germany, 2009; pp. 197–254. [Google Scholar]
- Allia, P.; Barrera, G.; Tiberto, P.; Nardi, T.; Leterrier, Y.; Sangermano, M. Fe3O4 nanoparticles and nanocomposites with potential application in biomedicine and in communication technologies: Nanoparticle aggregation, interaction, and effective magnetic anisotropy. J. Appl. Phys. 2014, 116. [Google Scholar] [CrossRef]
- Manna, P.K.; Yusuf, S.M. Two interface effects: Exchange bias and magnetic proximity. Phys. Rep. 2014, 535, 61–99. [Google Scholar] [CrossRef]
- Binns, C.; Domingo, N.; Testa, A.M.; Fiorani, D.; Trohidou, K.N.; Vasilakaki, M.; Blackman, J.A.; Asaduzzaman, A.M.; Baker, S.; Roy, M.; et al. Interface exchange coupling in Co nanoparticles dispersed in a Mn matrix. J. Phys. Condens. Matter 2010, 22. [Google Scholar] [CrossRef] [PubMed]
- Coey, J.M.D. Magnetism and Magnetic Materials; Cambridge University Press: Cambridge, UK, 2009; ISBN 9780521816144. [Google Scholar]
- Colvin, V.L. The potential environmental impact of engineered nanomaterials. Nat. Biotechnol. 2003, 21, 1166–1170. [Google Scholar] [CrossRef] [PubMed]
- Meyer, D.E.; Curran, M.A.; Gonzalez, M.A. An examination of existing data for the industrial manufacture and use of nanocomponents and their role in the life cycle impact of nanoproducts. Environ. Sci. Technol. 2009, 43, 1256–1263. [Google Scholar] [CrossRef] [PubMed]
- Nardi, T.; Sangermano, M.; Leterrier, Y.; Allia, P.; Tiberto, P.; Månson, J.A.E. UV-cured transparent magnetic polymer nanocomposites. Polymer 2013, 54, 4472–4479. [Google Scholar] [CrossRef]
- Allia, P.; Tiberto, P.; Coisson, M.; Chiolerio, A.; Celegato, F.; Vinai, F.; Sangermano, M.; Suber, L.; Marchegiani, G. Evidence for magnetic interactions among magnetite nanoparticles dispersed in photoreticulated PEGDA-600 matrix. J. Nanopart. Res. 2011, 13, 5615–5626. [Google Scholar] [CrossRef]
- Sciancalepore, C.; Bondioli, F.; Messori, M. Non-hydrolytic sol–gel synthesis and reactive suspension method: An innovative approach to obtain magnetite–epoxy nanocomposite materials. J. Sol-Gel Sci. Technol. 2017, 81, 69–83. [Google Scholar] [CrossRef]
- Esposito, S.; Dell’Agli, G.; Marocco, A.; Bonelli, B.; Allia, P.; Tiberto, P.; Barrera, G.; Manzoli, M.; Arletti, R.; Pansini, M. Magnetic metal-ceramic nanocomposites obtained from cation-exchanged zeolite by heat treatment in reducing atmosphere. Microporous Mesoporous Mater. 2018, 268, 131–143. [Google Scholar] [CrossRef]
- Knobel, M.; Nunes, W.C.; Socolovsky, L.M.; De Biasi, E.; Vargas, J.M.; Denardin, J.C. Superparamagnetism and Other Magnetic Features in Granular Materials: A Review on Ideal and Real Systems. J. Nanosci. Nanotechnol. 2008, 8, 2836–2857. [Google Scholar] [CrossRef]
- Landi, G.T.; Arantes, F.R.; Cornejo, D.R.; Bakuzis, A.F.; Andreu, I.; Natividad, E. AC susceptibility as a tool to probe the dipolar interaction in magnetic nanoparticles. J. Magn. Magn. Mater. 2017, 421, 138–151. [Google Scholar] [CrossRef]
- Allia, P.; Coisson, M.; Tiberto, P.; Vinai, F.; Knobel, M.; Novak, M.A.; Nunes, W.C. Granular Cu-Co alloys as interacting superparamagnets. Phys. Rev. B Condens. Matter Mater. Phys. 2001, 64, 144420. [Google Scholar] [CrossRef]
- Shull, R.D.; Kerch, H.M.; Ritter, J.J. Magnetic properties of colloidal silica: Potassium silicate gel/iron nanocomposites. J. Appl. Phys. 1994, 75, 6840–6842. [Google Scholar] [CrossRef]
- Sohn, B.H.; Cohen, R.E.; Papaefthymiou, G.C. Magnetic properties of iron oxide nanoclusters within microdomains of block copolymers. J. Magn. Magn. Mater. 1998, 182, 216–224. [Google Scholar] [CrossRef]
- Sangermano, M.; Vescovo, L.; Pepino, N.; Chiolerio, A.; Allia, P.; Tiberto, P.; Coisson, M.; Suber, L.; Marchegiani, G. Photoinitiator-Free UV-Cured Acrylic Coatings Containing Magnetite Nanoparticles. Macromol. Chem. Phys. 2010, 211, 2530–2535. [Google Scholar] [CrossRef]
- Zhang, X.X.; Hernandez, J.M.; Tejada, J.; Ziolo, R.F. Magnetic properties, relaxation, and quantum tunneling in CoFe2O4 nanoparticles embedded in potassium silicate. Phys. Rev. B 1996, 54, 4101–4106. [Google Scholar] [CrossRef]
- Awschalom, D.D.; Di Vincenzo, D.P.; Smith, J.F. Macroscopic quantum effects in nanometerscale magnets. Science 1992, 258, 414–421. [Google Scholar] [CrossRef] [PubMed]
- Papaefthymiou, G.C. Nanometer-sized structures and the transition from the molecular to the solid state. Phys. Rev. B 1992, 46, 10366–10375. [Google Scholar] [CrossRef]
- Sun, S.; Zeng, H. Size-Controlled Synthesis of Magnetite Nanoparticles. J. Am. Chem. Soc. 2002. [Google Scholar] [CrossRef]
- Sangermano, M.; Allia, P.; Tiberto, P.; Barrera, G.; Bondioli, F.; Florini, N.; Messori, M. Photo-cured epoxy networks functionalized with Fe3O4 generated by non-hydrolytic sol-gel process. Macromol. Chem. Phys. 2013, 214, 508–516. [Google Scholar] [CrossRef]
- Allia, P.; Sangermano, M.; Chiolerio, A. Magnetic Properties of Polymer Nanocomposites. In Functional and Physical Properties of Polymer Nanocomposites; Dasari, A., Njuguna, J., Eds.; John Wiley & Sons, Ltd.: Chichester, UK, 2016; pp. 119–137. [Google Scholar]
- Allia, P.; Barrera, G.; Tiberto, P. Linearized rate-equation approach for double-well systems: Cooling- and temperature-dependent low-field magnetization of magnetic nanoparticles. Phys. Rev. B 2018, 98, 134423. [Google Scholar] [CrossRef]
- López Maldonado, K.L.; De La Presa, P.; Flores Tavizón, E.; Farias Mancilla, J.R.; Matutes Aquino, J.A.; Hernando Grande, A.; Elizalde Galindo, J.T. Magnetic susceptibility studies of the spin-glass and Verwey transitions in magnetite nanoparticles. J. Appl. Phys. 2013, 113, 2013–2016. [Google Scholar] [CrossRef]
- Markovich, G.; Fried, T.; Poddar, P.; Sharoni, A.; Katz, D.; Wizansky, T.; Millo, O. Observation of the Verwey Transition in Fe3O4 Nanocrystals. MRS Proc. 2002, 746, Q4.1. [Google Scholar] [CrossRef]
- Goya, G.F.; Berquó, T.S.; Fonseca, F.C.; Morales, M.P. Static and dynamic magnetic properties of spherical magnetite nanoparticles. J. Appl. Phys. 2003, 94, 3520–3528. [Google Scholar] [CrossRef]
- Hevroni, A.; Bapna, M.; Piotrowski, S.; Majetich, S.A.; Markovich, G. Tracking the Verwey Transition in Single Magnetite Nanocrystals by Variable-Temperature Scanning Tunneling Microscopy. J. Phys. Chem. Lett. 2016, 7, 1661–1666. [Google Scholar] [CrossRef] [PubMed]
- Arelaro, A.D.; Brandl, A.L.; Lima, E.; Gamarra, L.F.; Brito, G.E.S.; Pontuschka, W.M.; Goya, G.F. Interparticle interactions and surface contribution to the effective anisotropy in biocompatible iron oxide nanoparticles used for contrast agents. J. Appl. Phys. 2005, 97, 2003–2006. [Google Scholar] [CrossRef]
- Wang, J.; Chen, Q.; Li, X.; Shi, L.; Peng, Z.; Zeng, C. Disappearing of the Verwey transition in magnetite nanoparticles synthesized under a magnetic field: Implications for the origin of charge ordering. Chem. Phys. Lett. 2004, 390, 55–58. [Google Scholar] [CrossRef]
- Mitra, A.; Mohapatra, J.; Meena, S.S.; Tomy, C.V.; Aslam, M. Verwey Transition in Ultrasmall-Sized Octahedral Fe3O4 Nanoparticles. J. Phys. Chem. C 2014, 118, 19356–19362. [Google Scholar] [CrossRef]
- Shepherd, J.P.; Koenitzer, J.W.; Aragón, R.; Spalek, J.; Honig, J.M. Heat capacity and entropy of nonstoichiometric magnetite Fe3(1−δ)O4: The thermodynamic nature of the Verwey transition. Phys. Rev. B 1991, 43, 8461. [Google Scholar] [CrossRef]
- Schmitz-Antoniak, C.; Schmitz, D.; Warland, A.; Svechkina, N.; Salamon, S.; Piamonteze, C.; Wende, H. Reversed ageing of Fe3O4 nanoparticles by hydrogen plasma. Sci. Rep. 2016, 6, 20897. [Google Scholar] [CrossRef]
- Chen, J.P.; Sorensen, C.M.; Klabunde, K.J.; Hadjipanayis, G.C.; Devlin, E.; Kostikas, A. Size-dependent magnetic properties of MnFe2O4 fine particles synthesized by coprecipitation. Phys. Rev. B 1996, 54, 9288–9296. [Google Scholar] [CrossRef]
- Morup, S. Superparamagnetism and Spin Glass Ordering in Magnetic Nanocomposites. Europhys. Lett. 1994, 28, 671–676. [Google Scholar] [CrossRef]
- Allia, P.; Tiberto, P. Dynamic effects of dipolar interactions on the magnetic behavior of magnetite nanoparticles. J. Nanopart. Res. 2011, 13, 7277–7293. [Google Scholar] [CrossRef]
- Allia, P. Fe-oxide Nanoparticles: A natural playground for testing the ISP model. J. Phys. Conf. Ser. 2014, 521, 7–11. [Google Scholar] [CrossRef]
- Allia, P.; Barrera, G.; Nardi, T.; Leterrier, Y.; Tiberto, P. Anisotropic magnetic polymer nanocomposite with self-assembled chains of titania-coated magnetite nanoparticles. Mater. Today Commun. 2016, 7, 32–41. [Google Scholar] [CrossRef]
- Sahoo, Y.; Cheon, M.; Wang, S.; Luo, H.; Furlani, E.P.; Prasad, P.N. Field-Directed Self-Assembly of Magnetic Nanoparticles. J. Phys. Chem. B 2004, 108, 3380–3383. [Google Scholar] [CrossRef]
- Fragouli, D.; Buonsanti, R.; Bertoni, G.; Sangregorio, C.; Innocenti, C.; Falqui, A.; Gatteschi, D.; Cozzoli, P.D.; Athanassiou, A.; Cingolani, R. Dynamical Formation of Spatially Localized Arrays of Aligned Nanowires in Plastic Films with Magnetic Anisotropy. ACS Nano 2010, 4, 1873–1878. [Google Scholar] [CrossRef]
- Krommenhoek, P.J.; Tracy, J.B. Magnetic Field-Directed Self-Assembly of Magnetic Nanoparticle Chains in Bulk Polymers. Part. Part. Syst. Charact. 2013, 30, 759–763. [Google Scholar] [CrossRef]
- Ambashta, R.D.; Sillanpää, M. Water purification using magnetic assistance: A review. J. Hazard. Mater. 2010, 180, 38–49. [Google Scholar] [CrossRef]
- Zhu, J.; Wei, S.; Chen, M.; Gu, H.; Rapole, S.B.; Pallavkar, S.; Ho, T.C.; Hopper, J.; Guo, Z. Magnetic nanocomposites for environmental remediation. Adv. Powder Technol. 2013, 24, 459–467. [Google Scholar] [CrossRef]
- Brigante, M.; Pecini, E.; Avena, M. Magnetic mesoporous silica for water remediation: Synthesis, characterization and application as adsorbent of molecules and ions of environmental concern. Microporous Mesoporous Mater. 2016, 230, 1–10. [Google Scholar] [CrossRef]
- Tang, C.; Huang, Y.H.; Zeng, H.; Zhang, Z. Reductive removal of selenate by zero-valent iron: The roles of aqueous Fe2+ and corrosion products, and selenate removal mechanisms. Water Res. 2014, 67, 166–174. [Google Scholar] [CrossRef]
- Ling, L.; Pan, B.; Zhang, W. Removal of selenium from water with nanoscale zero-valent iron: Mechanisms of intraparticle reduction of Se(IV). Water Res. 2015, 71, 274–281. [Google Scholar] [CrossRef]
- Tang, C.; Huang, Y.; Zhang, Z.; Chen, J.; Zeng, H.; Huang, Y.H. Rapid removal of selenate in a zero-valent iron/Fe3O4/Fe2+ synergetic system. Appl. Catal. B Environ. 2016, 184, 320–327. [Google Scholar] [CrossRef]
- Sun, Y.; Chen, S.S.; Tsang, D.C.W.; Graham, N.J.D.; Ok, Y.S.; Feng, Y.; Li, X.-D. Zero-valent iron for the abatement of arsenate and selenate from flowback water of hydraulic fracturing. Chemosphere 2017, 167, 163–170. [Google Scholar] [CrossRef]
- Ma, Z.; Shan, C.; Liang, J.; Tong, M. Efficient adsorption of Selenium(IV) from water by hematite modified magnetic nanoparticles. Chemosphere 2018, 193, 134–141. [Google Scholar] [CrossRef]
- Mirzaei, A.A.; Being babaei, A.; Galavy, M.; Youssefi, A. A silica supported Fe–Co bimetallic catalyst prepared by the sol/gel technique: Operating conditions, catalytic properties and characterization. Fuel Process. Technol. 2010, 91, 335–347. [Google Scholar] [CrossRef]
- Meeks, N.D.; Smuleac, V.; Stevens, C.; Bhattacharyya, D. Iron-Based Nanoparticles for Toxic Organic Degradation: Silica Platform and Green Synthesis. Ind. Eng. Chem. Res. 2012, 51, 9581–9590. [Google Scholar] [CrossRef]
- Keyvanloo, K.; Mardkhe, M.K.; Alam, T.M.; Bartholomew, C.H.; Woodfield, B.F.; Hecker, W.C. Supported Iron Fischer–Tropsch Catalyst: Superior Activity and Stability Using a Thermally Stable Silica-Doped Alumina Support. ACS Catal. 2014, 4, 1071–1077. [Google Scholar] [CrossRef]
- Liu, B.; Zhang, Z. Catalytic Conversion of Biomass into Chemicals and Fuels over Magnetic Catalysts. ACS Catal. 2016, 6, 326–338. [Google Scholar] [CrossRef]
- Gupta, A.K.; Gupta, M. Synthesis and surface engineering of iron oxide nanoparticles for biomedical applications. Biomaterials 2005, 26, 3995–4021. [Google Scholar] [CrossRef]
- Chao, M.; Chuanyan, L.; Nongyue, H.; Fang, W.; Ningning, M.; Liming, Z.; Zhuoxuan, L.; Zeeshan, A.; Zhijiang, X.; Xiaolong, L.; et al. Preparation and Characterization of Monodisperse Core–Shell Fe3O4@SiO2 Microspheres and Its Application for Magnetic Separation of Nucleic Acids from E. coli BL21. J. Biomed. Nanotechnol. 2012, 8, 1000–1005. [Google Scholar] [CrossRef]
- Esposito, S.; Marocco, A.; Bonelli, B.; Pansini, M. Produzione di Materiali Compositi Metallo-Ceramici Nano Strutturati da Precursori Zeolitici. Brevetto Italiano n. MI 2014 A 000522, 27 October 2014. [Google Scholar]
- Esposito, S.; Marocco, A.; Bonelli, B.; Pansini, M. Production of Magnetic Metal Nanoparticles Embedded in a Silica-Alumina Matrix. U.S. Patent WO 2015/145230 A1, 6 March 2015. [Google Scholar]
- Marocco, A.; Dell’Agli, G.; Esposito, S.; Pansini, M. Metal-ceramic composite materials from zeolite precursor. Solid State Sci. 2012, 14, 394–400. [Google Scholar] [CrossRef]
- Pansini, M.; Sannino, F.; Marocco, A.; Allia, P.; Tiberto, P.; Barrera, G.; Polisi, M.; Battista, E.; Netti, P.A.; Esposito, S. Novel process to prepare magnetic metal-ceramic nanocomposites from zeolite precursor and their use as adsorbent of agrochemicals from water. J. Environ. Chem. Eng. 2018, 6. [Google Scholar] [CrossRef]
- Pansini, M.; Dell’Agli, G.; Marocco, A.; Netti, P.A.P.A.; Battista, E.; Lettera, V.; Vergara, P.; Allia, P.; Bonelli, B.; Tiberto, P.; et al. Preparation and Characterization of Magnetic and Porous Metal-Ceramic Nanocomposites from a Zeolite Precursor and Their Application for DNA Separation. J. Biomed. Nanotechnol. 2017, 13, 337–348. [Google Scholar] [CrossRef]
- Barrera, G.; Tiberto, P.; Esposito, S.; Marocco, A.; Bonelli, B.; Pansini, M.; Manzoli, M.; Allia, P. Magnetic clustering of Ni2+ ions in metal-ceramic nanocomposites obtained from Ni-exchanged zeolite precursors. Ceram. Int. 2018, 44, 17240–17250. [Google Scholar] [CrossRef]
- Marocco, A.; Pansini, M.; Dell’Agli, G.; Esposito, S. Parameters Expediting the Thermal Conversion of Ba-Exchanged Zeolite A to Monoclinic Celsian. Adv. Mater. Sci. Eng. 2010, 2010, 683429. [Google Scholar] [CrossRef]
- Marocco, A.; Dell’Agli, G.; Esposito, S.; Pansini, M. The role of residual Na+ and Li+ on the thermal transformation of Ba-exchanged zeolite A. Solid State Sci. 2011, 13, 1143–1151. [Google Scholar] [CrossRef]
- Esposito, S.; Marocco, A.; Dell’Agli, G.; De Gennaro, B.; Pansini, M. Relationships between the water content of zeolites and their cation population. Microporous Mesoporous Mater. 2015, 202, 36–43. [Google Scholar] [CrossRef]
- Breck, D.W. Zeolite Molecular Sieves: Structure, Chemistry and Use; John Wiley & Sons Inc.: New York, NY, USA, 1974. [Google Scholar]
- Dwyer, F.G. An Introduction to Molecular Sieves Zeolite; J. Wiley and Sons: Chichester, UK, 1988. [Google Scholar]
- Marocco, A.; Liguori, B.; Dell’Agli, G.; Pansini, M. Sintering behaviour of celsian based ceramics obtained from the thermal conversion of (Ba, Sr)-exchanged zeolite A. J. Eur. Ceram. Soc. 2011, 31, 1965–1973. [Google Scholar] [CrossRef]
- Ferone, C.; Liguori, B.; Marocco, A.; Anaclerio, S.; Pansini, M.; Colella, C. Monoclinic (Ba, Sr)-celsian by thermal treatment of (Ba, Sr)-exchanged zeolite A. Microporous Mesoporous Mater. 2010, 134, 65–71. [Google Scholar] [CrossRef]
- Albino, V.; Cioffi, R.; Pansini, M.; Colella, C. Disposal of Lead-Containing Zeolite Sludges in Cement Matrix. Environ. Technol. 1995, 16, 147–156. [Google Scholar] [CrossRef]
- Cioffi, R.; Pansini, M.; Caputo, D.; Colella, C. Evaluation of Mechanical and Leaching Properties of Cement-Based Solidified Materials Encapsulating Cd-Exchanged Natural Zeolites. Environ. Technol. 1996, 17, 1215–1224. [Google Scholar] [CrossRef]
- Sannino, F.; Ruocco, S.; Marocco, A.; Esposito, S.; Pansini, M. Cyclic process of simazine removal from waters by adsorption on zeolite H-Y and its regeneration by thermal treatment. J. Hazard. Mater. 2012, 229–230, 354–360. [Google Scholar] [CrossRef]
- Sannino, F.; Ruocco, S.; Marocco, A.; Esposito, S.; Pansini, M. Simazine removal from waters by adsorption on porous silicas tailored by sol–gel technique. Microporous Mesoporous Mater. 2013, 180, 178–186. [Google Scholar] [CrossRef]
- Hagiwara, M.; Minami, K.; Narumi, Y.; Tatani, K.; Kindo, K. Magnetic Properties of a Quantum Ferrimagnet: NiCu(pba)(D2O)3 2D2O. J. Phys. Soc. Jpn. 1998, 67, 2209–2211. [Google Scholar] [CrossRef]
- Kou, H.Z.; Gao, S.; Li, C.H.; Liao, D.Z.; Zhou, B.C.; Wang, R.J.; Li, Y. Characterization of a soluble molecular magnet: Unusual magnetic behavior of cyano-bridged Gd(III)-Cr(III) complexes with one-dimensional and nanoscaled square structures. Inorg. Chem. 2002, 41, 4756–4762. [Google Scholar] [CrossRef]
- Zagaynova, V.S.; Makarova, T.L.; Spitsina, N.G.; Boukhvalov, D.W. Synthesis and Magnetic Properties of Mn12-Based Single Molecular Magnets with Benzene and Pentafluorobenzene Carboxylate Ligands. J. Supercond. Nov. Magn. 2011, 24, 855–859. [Google Scholar] [CrossRef]
© 2019 by the authors. Licensee MDPI, Basel, Switzerland. This article is an open access article distributed under the terms and conditions of the Creative Commons Attribution (CC BY) license (http://creativecommons.org/licenses/by/4.0/).