Abstract
Owing to the development of medical technology, devices to assess resonance (hypernasality and hyponasality) which result from conditions such as cleft palate and brain injury are being studied. In general, nasometric instruments are used to support clinical judgments of these disorders. For conventional separation-type nasometric instruments, there is an acoustic feedback effect between oral and nasal sounds. Recently, a mask-type nasometric instrument was developed for acoustic feedback insensitivity, but it has not yet been popularized. In this study, we analyzed the acoustic characteristics of the mask-type structure according to existing nasometric instruments. We evaluated the acoustic collection characteristics of the structure through the lumped-element model with an electromechanical-equivalent circuit. The analysis confirmed that the optimum area of the acoustic hole was obtained and a closed-type mask structure could be designed. In addition, we obtained voice data from a healthy control group and examined significant differences in the structure of the separation-type and mask-type nasometric instruments. Consequently, we confirmed a significant difference in nasalance according to the acoustic collection structure of the nasometric instruments.
1. Introduction
With the development of medical technology, interest in rehabilitation welfare is increasing and various rehabilitation devices are being researched and developed [1,2,3,4,5]. Among them, speech therapy devices are increasingly attracting attention owing to rehabilitation and welfare support for people with communication disabilities such as hearing impairments. Individuals with cleft palate, and those who have dysarthria following a brain impairment, may present with hypernasal speech (too much nasal resonance). Hypernasality results when the velopharyngeal mechanism does not function as it should. As a result, speech is nasalized and distorted, making it difficult for speech to be understood [6,7]. Nasometric instruments have been utilized by speech therapists to measure the degree of nasalance in speech [8,9,10,11]. For the treatment of resonance disorders, accurate measurements of the generated sound pressure by the oral and nasal cavity should be collected, and in particular, there should be no interference between the oral and nasal sounds. However, in the case of separation-type nasometric instruments (e.g., NAS-1 separator, Glottal Enterprises, Syracuse NY, USA), the signal processing technique and effect of acoustic feedback on the microphone, which captures the nasal cavity, are insufficient. Recently, a closed mask-type device (NAS-1 Mask, Glottal Enterprises) was introduced to minimize the interference effects of oral and nasal sounds.
In this study, we investigated the structural problems of conventional separation plate-type nasometric instruments and the effect of acoustic feedback between the oral and nasal cavities. In addition, we investigated the frequency characteristics of the acoustic collection structure simulated by an electromechanical-equivalent model. Furthermore, we analyzed the frequency characteristics, correlation coefficients, and nasalance values of voice signals collected from a healthy control group using nasal and oral microphones in the nasometric instrument structure. Finally, we compared the characteristics of the closed mask-type nasometric instrument. Through experiments, the nasalance was confirmed to be about 3% to 15% higher in the case of the mask structure than the separator-type structure.
2. Conventional Nasometric Instruments
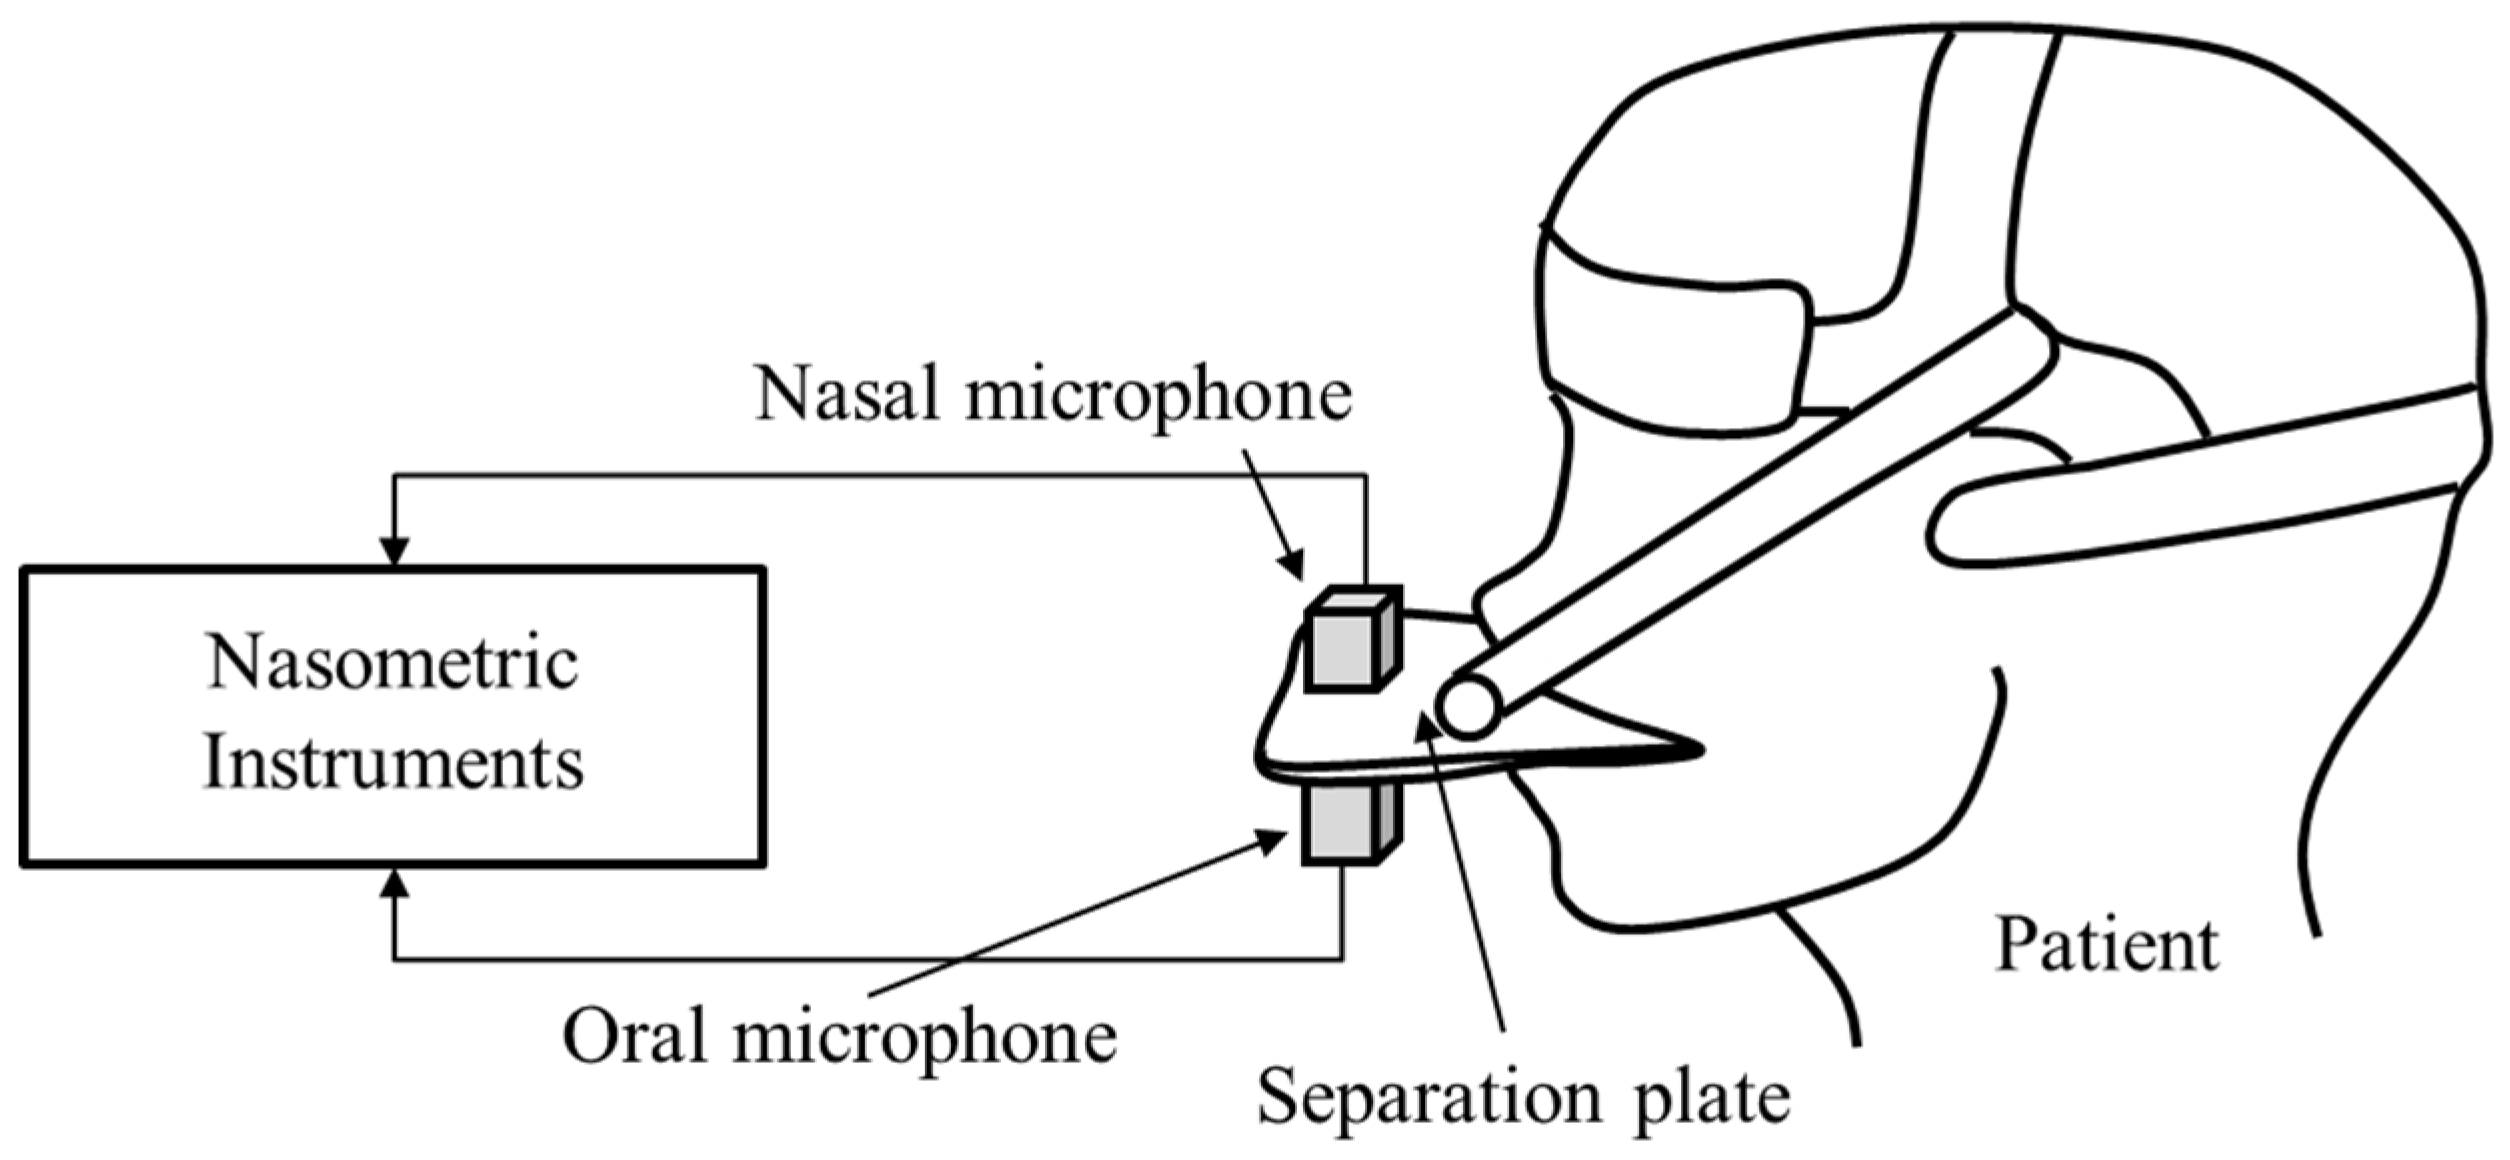
2.1. Characteristics and Structure of the Nasometric Instrument
A nasometric instrument schematic of the conventional separation plate structure for the measurement of nasalance is shown in Figure 1. Within the module of the nasometric instrument, there is an oral microphone for collecting oral sounds under the separating plate, and a nasal microphone for collecting the nasal sounds is located above the separating plate. These microphones collect acoustic signals at the same time during speech and calculate nasalance, as shown in Equation (1) [9,11].
Figure 1.
Schematic of a conventional nasometric instrument for a patient.
In this study, we analyzed the characteristics of microphones using the structure of separator-type nasometric instruments. The most important components of nasometric instruments are the microphones that collect external sound signals and transmit them to the signal processing device. The microphones are required to have excellent sensitivity and a wide frequency band as input devices [12,13,14]. Figure 2 is an experimental block diagram for analyzing the microphone characteristics using the nasometric instrument structure, and a photograph of the experimental environment is shown in Figure 3.
Figure 2.
Experimental schematic using the structure of conventional nasometric instruments.
Figure 3.
Experimental environment (a) picture and (b) sensitivity results of the attached microphone ((Electret Condenser Microphone, ECM) sensitivity in the nasometric instrument.
In the 0.1 to 10 kHz band, pure tone sounds of 74 and 94 dB SPL (sound pressure level) were applied to the microphone in the structure of the separation-type nasometric instrument and a reference microphone (ER10B, Etymotic, Elk Grove Village, USA) at a distance of 1 m from a standard speaker (FR16WP, Visaton, Haan, Germany). The microphone sensitivity was measured through a signal generation and acquisition device (NI DAQ-9137, National Instruments, Austin, USA). The oral and nasal directional microphones showed resonance at about 1 kHz and averaged −38 and −58 dB (0 dB = 1 V/Pa) when applying the 74 and 94 dB SPL, respectively. The frequency characteristics of the two microphones in the nasometric instrument structure were similar and showed a difference of more than 4 dB after the 7 kHz band.
2.2. Acoustic Feedback Effect of Separation-Type Nasometric Instrument
In the case of a conventional nasometric instrument, which includes a separator plate, signals generated by the nasal cavity can be collected by the oral microphone. This may affect the reliability in the nasalance calculation of Equation (1). In this study, we analyzed the effect of acoustic feedback on the separation-type nasometric instrument. The experimental setup and results are shown in Figure 4.
Figure 4.
Experimental results: (a) block diagram and (b) the acoustic feedback effect.
For analysis of the influence of acoustic feedback, pure tone sounds of 74 dB SPL in the 0.1 to 10 kHz band were applied to the oral and nasal directional microphone through a standard speaker.
In the separator-type structure, the interference effect of the acoustic feedback to the oral to nasal direction was measured as 12 to 18 dB. In the opposite case, the nasal to oral direction was measured as 11 to 17 dB. An average interference effect of about 15 dB was observed in the 0.1 to 10 kHz band, and it showed a somewhat higher characteristic above the 2 kHz band. The influence of acoustic feedback has been mentioned in previous studies. Gildersleeve-Neumann and Dalston noted that a separation-type nasometric instrument has a sound-separation characteristic of approximately 25 dB [15]. Although the difference of 25 dB from the previous study is about 7–14 dB, it is indirectly known that these interference values can also have a considerable effect. This effect produces an undesirable value for the actual patient’s nasalance calculation.
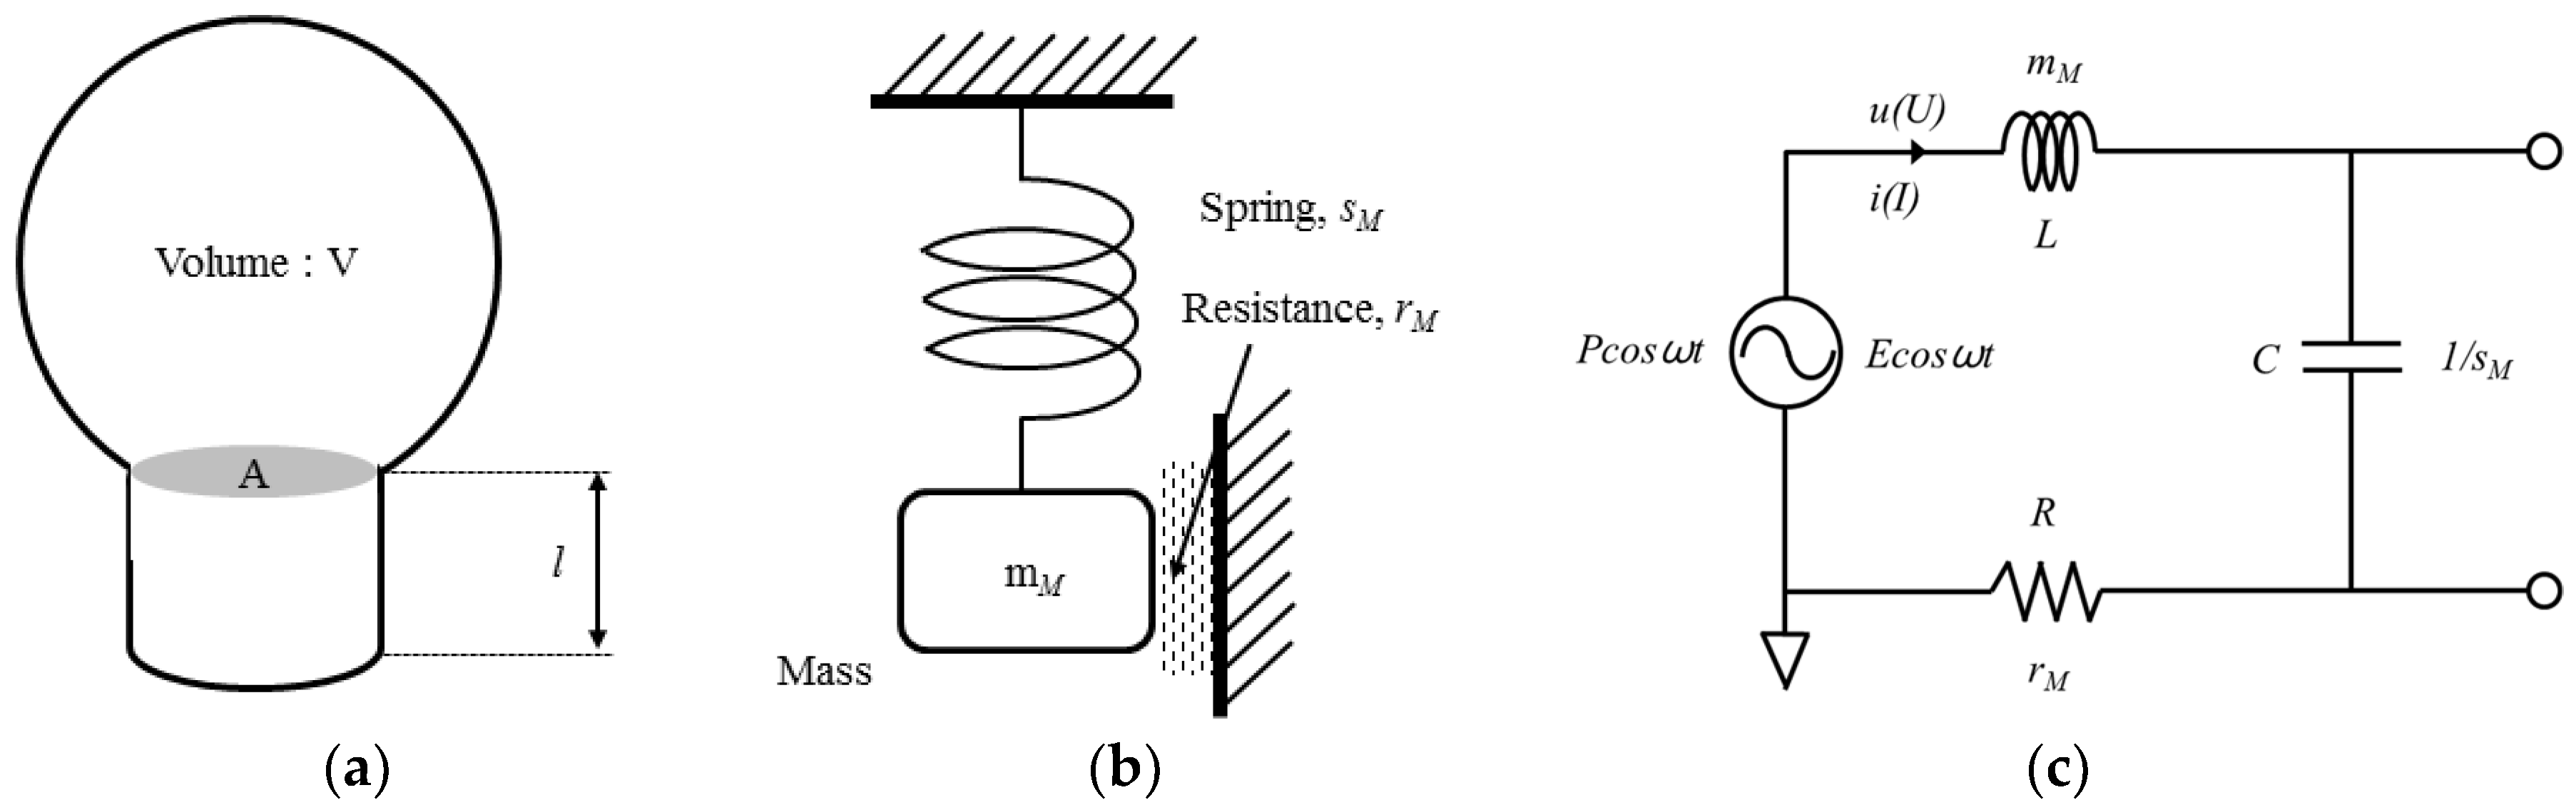
2.3. Lumped-Element Model for Closed Mask-Type Nasometric Instrument
Recently, a closed mask-type nasometric instrument was implemented to minimize the influence of the mentioned acoustic feedback. However, its utilization is low. Speech therapists in the field still rely on subjective judgment using simple instruments. In some cases, a separator-type nasometric instrument is used intermittently. In practice, there are many opinions about the theoretical considerations and effects of the acoustic feedback brought about by the structure of the nasometric instrument.
In this study, the frequency characteristics of the mask-type nasometric instrument were analyzed through the electromechanical-equivalent model. A mask containing an acoustic hole was attached to the face surface. In this case, the attached mask could be attached to a Helmholtz resonator having a closed volume and a short tube.
Generally, the Helmholtz resonator demonstrates low-pass-filter characteristics when the sizes of the closed volume and the short entrance tube are smaller than the applied acoustic wavelength [16]. Figure 5 shows the physical structure, mechanical model, and equivalent circuit corresponding to the Helmholtz resonator. This can be applied to the mask-type nasometric instrument.
Figure 5.
(a) Schematic of Helmholtz resonator, (b) mechanical model of Helmholtz resonator, and (c) equivalent circuit corresponding to the Helmholtz resonator.
The Helmholtz resonator structure in Figure 5a can be represented by a single-degree-of-freedom resonance system, as shown in Figure 5b. When a driving force of Fcosωt is applied to the center of the resonator, the equation of motion is expressed by Equation (2).
Here, if the variable x is changed to the speed v = dx/dt, Equation (3) is obtained.
The single-degree-of-freedom resonance system in Figure 5b is expressed as an electrical equivalent circuit, as shown in Figure 5c. The equation for the current I in the series resonant circuit is shown in Equation (4).
By comparing Equations (3) and (4), we have the force F, velocity υ corresponding to the equivalent circuit voltage E, current I, which corresponds to the sound pressure P, and volume velocity μ of the acoustic system. Furthermore, the mass mM, resistance rM, and stiffness sM correspond to L, R, and 1/C of the electrical circuit, respectively [17,18,19,20]. The corresponding physical quantities of electrical and mechanical systems are shown in Table 1.
Table 1.
Correspondence relationship between a mechanical and electrical system.
Here, the velocity υ of the mechanical system is expressed by Equation (5).
ZM represents the mechanical impedance of the vibration system. The frequency f0 at which the reactance part of the mechanical impedance becomes zero is expressed by the following (Equation (6)).
It is the same as the series resonance characteristics of the equivalent circuit in which the resonance occurs at f0 and the speed and amplitude become maximum. Therefore, the sound pressure Ph in the volume is expressed in Equation (7).
Ph corresponds to the voltage of the capacitance C corresponding to E = I/jωC of the equivalent circuit. In addition, the parameters of the mechanical model can be expressed as a spring constant, mass, and the resistance of air, as shown in Equation (8).
ρ is the density of air (1.2 kg/m2), A is the area of the acoustic hole, l is the height of the acoustic hole (2 mm), c is the speed of air (343 m/s), and V is the volume of the closed cavity (approximately 15 cm3). In this study, a frequency characteristic simulation is performed based on the structure of the actual mask-type nasometric instrument. The silicon mask is similar to the structure of a Helmholtz resonator, which includes a mesh-shaped acoustic hole. A simulation of the equivalent circuit was performed using a multi-sim program, and the frequency characteristics were analyzed according to the variation in acoustic holes. The parameters and resonant frequency characteristics for the analysis are shown in Table 2 and Figure 6.
Table 2.
Simulation parameters and calculation frequency according to the acoustic hole size.
Figure 6.
Simulation results for resonant frequency characteristics according to the equivalent circuit.
From the simulation results, it can be expected that the mask-type nasometric instrument will exhibit a low-pass filter-type acoustic characteristic having a resonance at about 558 Hz. Furthermore, the smaller the area of the acoustic hole, the lower the resonant frequency. However, ventilation for air circulation is inevitable for application to the actual mask structure of the nasometric instrument.
3. Nasalance Characteristics according to the Structure of the Nasometric Instrument
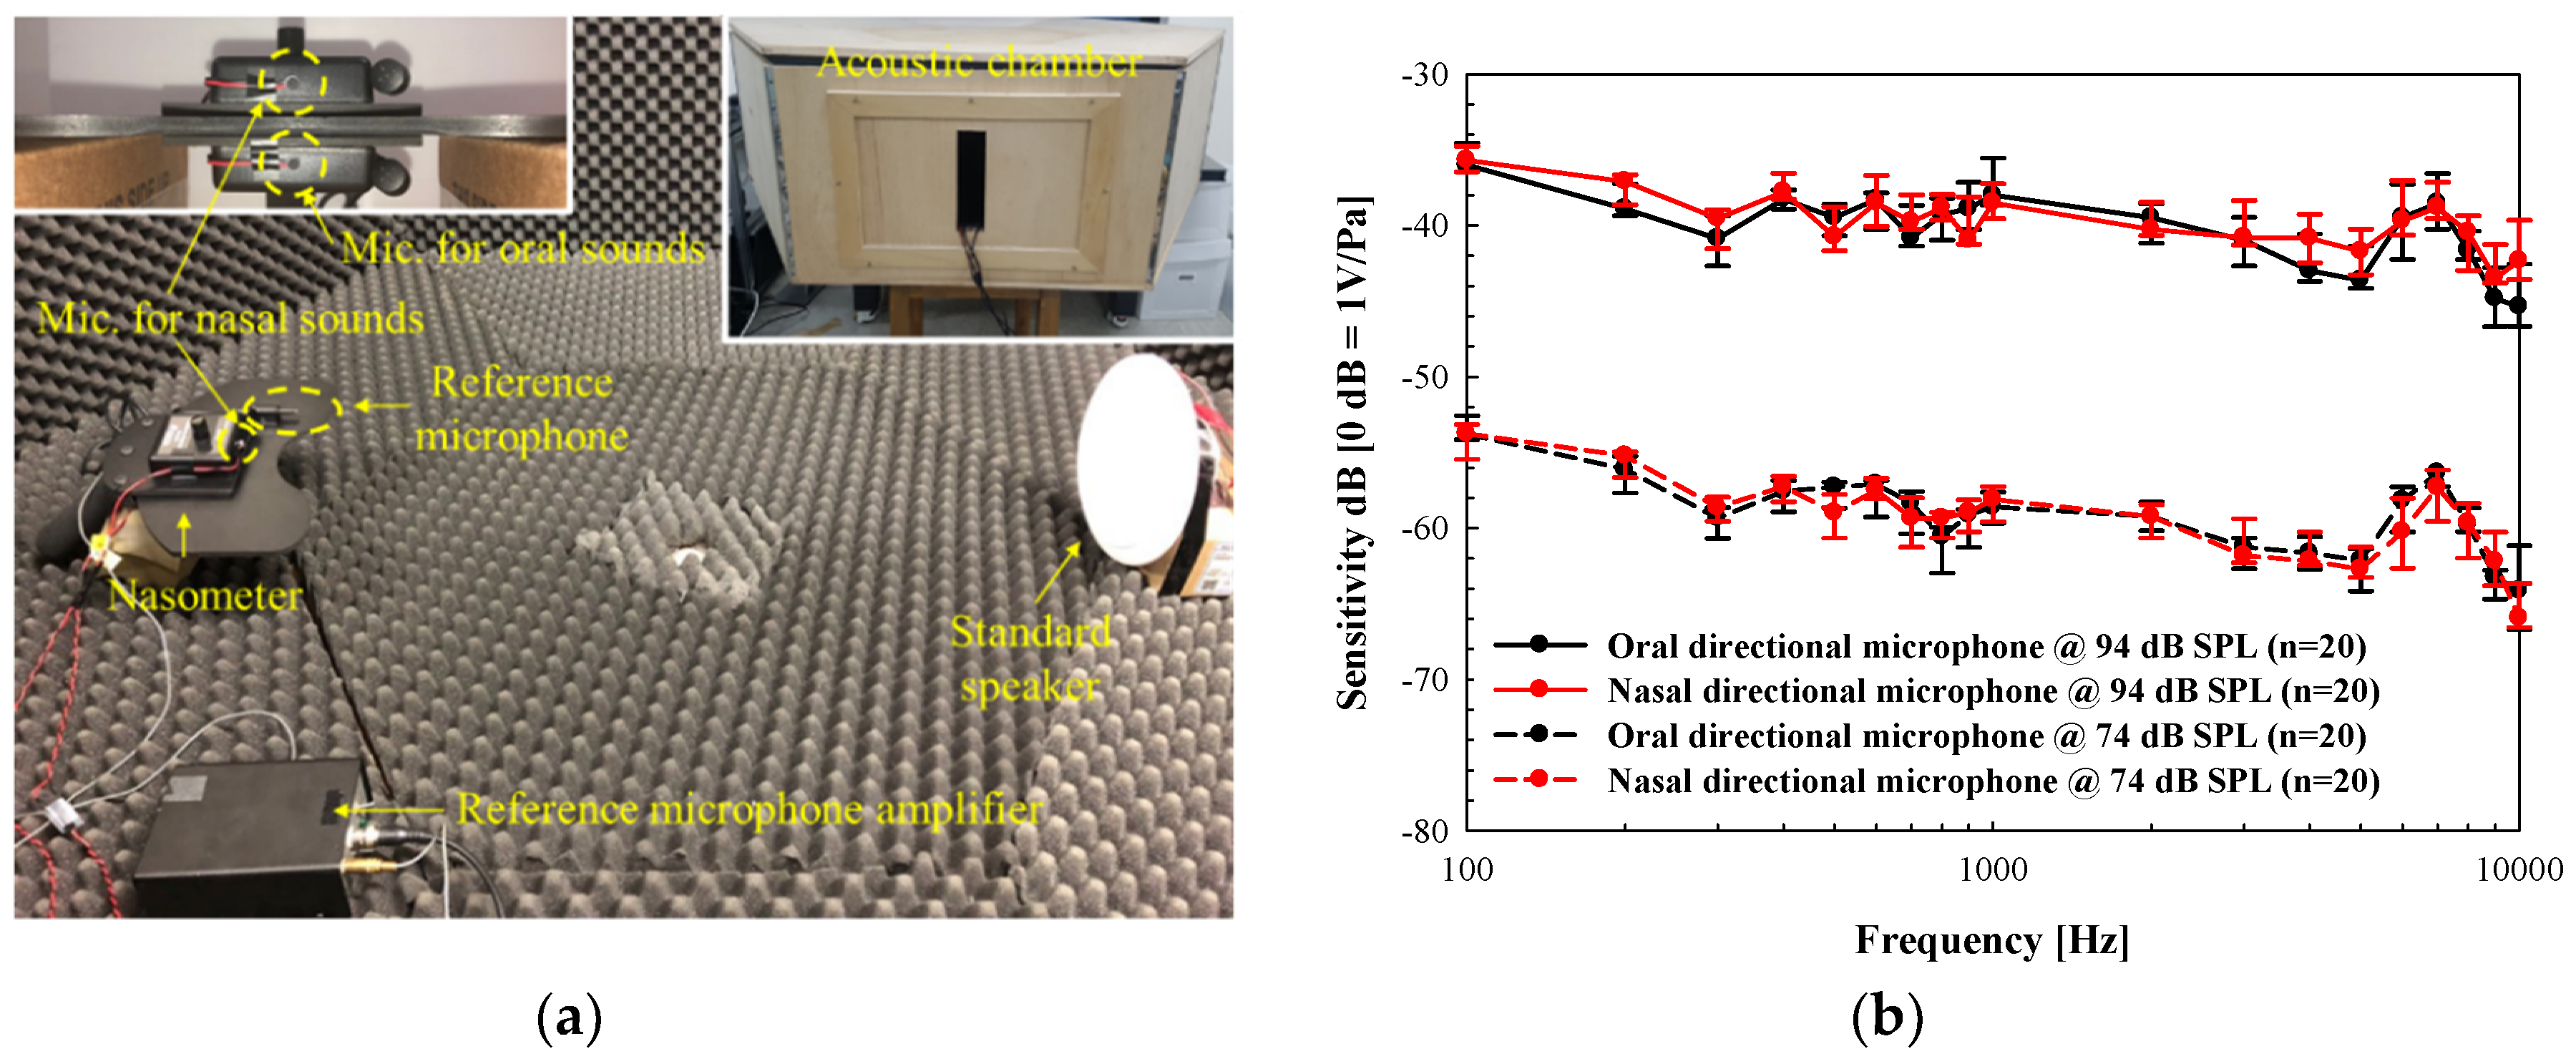
3.1. Clinical Experiments for the Nasalance Evaluation
To analyze the characteristics according to the acoustic collection structure of the nasometric instrument, frequency characteristics, correlation coefficients, and nasalance according to the articulation of a healthy control group were analyzed using the separator plate-type and mask-type nasometric instruments. The healthy control group consisted of three males, ranging in age from 30 to 35 years (mean age 33.0 years), and three females ranging in age from 33 to 35 years (mean age 34.0 years). There was no disease at all.
The control group uttered an extended low vowel /a/ and the nasal words /mama/ and /mimi/ into the oral and nasal microphones of the nasometric instrument. The measured voice signals were recorded via an audio module (M-track, M-Audio, Cumberland, USA) and passed to a signal generation and acquisition device. An experimental block diagram and photographs for the analysis of the nasalance characteristics according to the nasometric instrument structure are shown in Figure 7.

Figure 7.
(a) Experimental schematic and (b) environment picture using the nasometric instruments of the separation-type structure and mask-type structure.
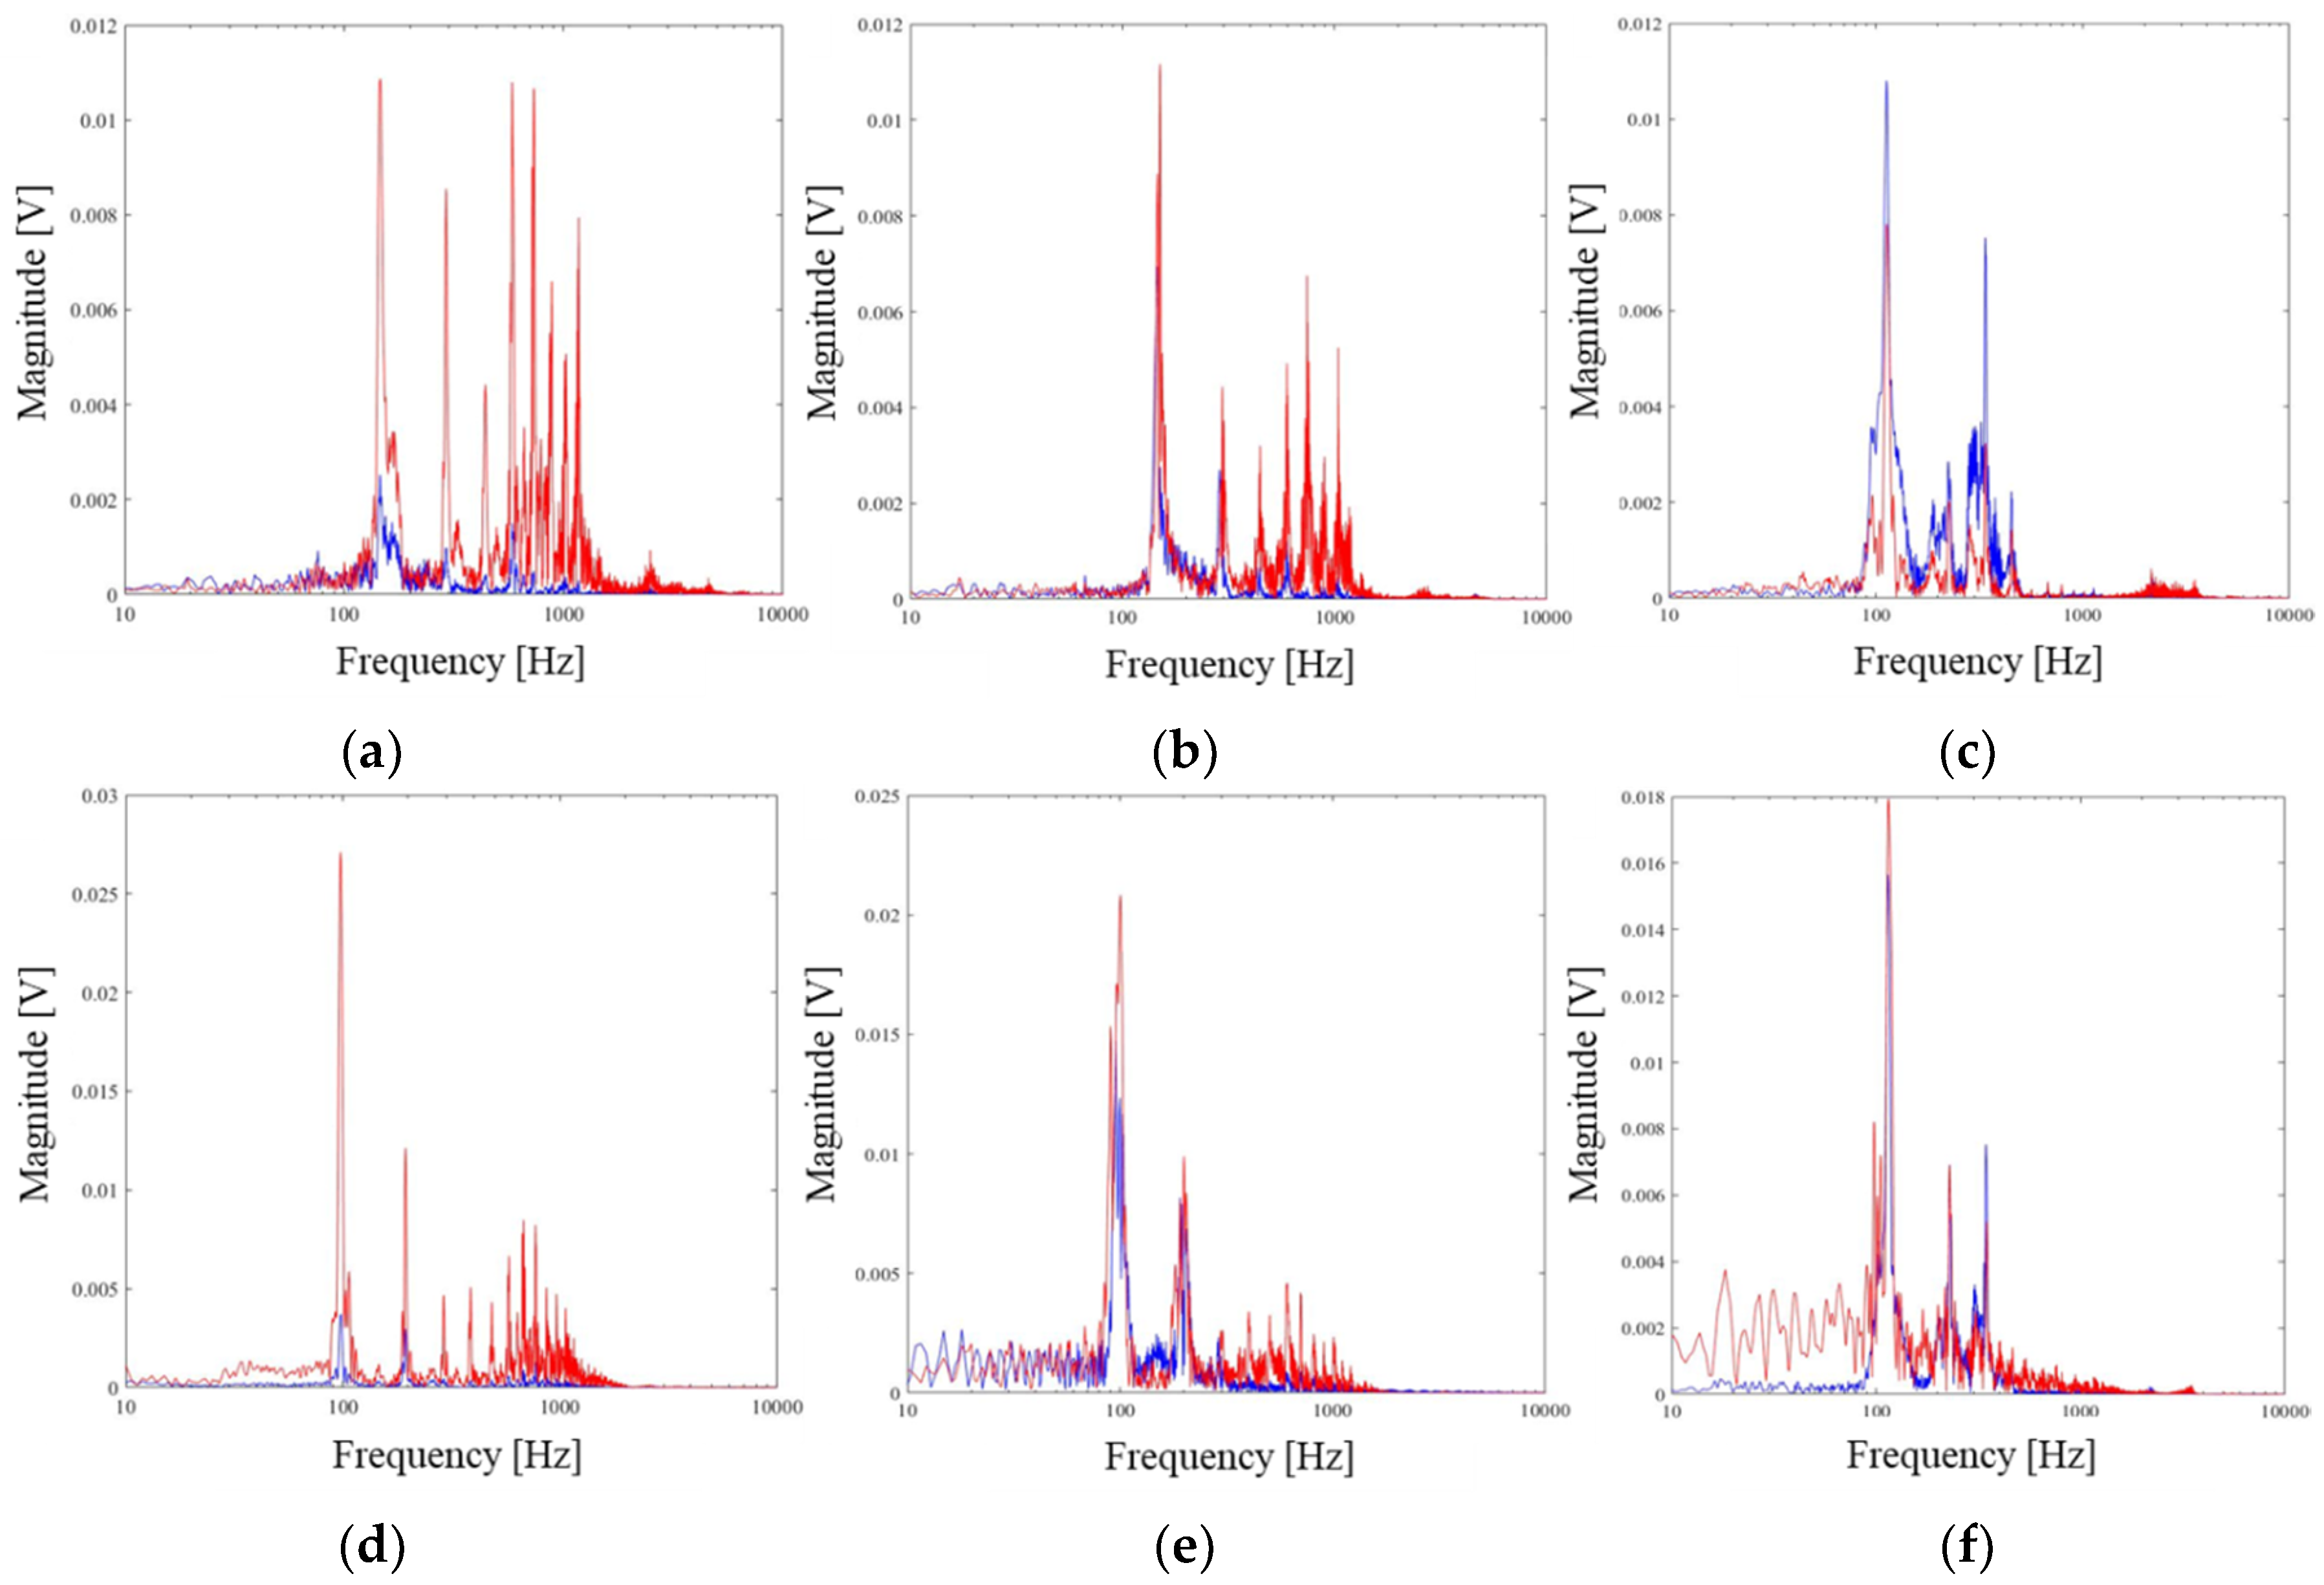
3.2. Experimental Results
The frequency characteristics of measured voice signals from the separate plate- and mask-structure nasometric instruments were analyzed using the MATLAB program. The analysis results are shown in Figure 8 and Figure 9. Figure 8 and Figure 9 are the frequency characteristics for the emitted /a/, /mama/, and /mimi/ sounds of males and females, respectively. The measured voice signal (Figure 8d–f and Figure 9d–f) through the mask-type nasometric instrument was suppressed in the range above 500 Hz relative to the measured voice signal (Figure 8a–c and Figure 9a–c) through the separation-type nasometric instrument.
Figure 8.
Measured spectrum of vocal signal of males using the separation-type structure for (a) /a/, (b) /mama/, and (c) /mimi/, and measured spectrum of vocal signal of males using the mask-type structure for (d) /a/, (e) /mama/, and (f) /mimi/ (the red line is the microphone output in the oral direction and the blue line is the microphone output in the nasal direction).
Figure 9.
Measured spectrum of vocal signal of females using the separation-type structure for (a) /a/, (b) /mama/, and (c) /mimi/, and measured spectrum of vocal signal of females using the mask-type structure for (d) /a/, (e) /mama/, and (f) /mimi/ (the red line is the microphone output in the oral direction and the blue line is the microphone output in the nasal direction).
This result reflects the frequency filter characteristics of the mask-type structure in the nasometric instrument and is similar to the simulated result based on the electrical-mechanical-equivalent circuit. It can be observed that it is less sensitive to the influence of acoustic feedback than the separation plate type.
In addition, the correlation coefficient between the collected speech signals through the separation plate-type and mask-type nasometric instruments is expressed by Equation (9). In general, the correlation coefficient can be calculated using the sample mean and , and standard deviation of the two signals x and y [4,12], where x and y are the voice signals measured through a microphone in the nasal and oral directions, respectively. Correlation coefficients were analyzed using the two measured vocal signals through the oral and nasal microphones when speaking the same word. Thus, these values are used to show the similarity of voice data in the nasal and oral directions measured by the microphone in the separation and mask structure.
The nasalance of the healthy control group using the two nasometric instrument structures is expressed as Equation (10), in which t1 and t2 are the lengths of the measured vocal signals through the oral and nasal microphones, respectively.
The calculated correlation coefficients and nasalance results by Equations (9) and (10) are shown in Table 3.
Table 3.
Correlation coefficients and nasalance results of the healthy control group.
In general, the vowel extension /a/ was less than 20% in nasalance, and the nasal words /mama/, /mimi/ were about 40% and 60% to 80%, respectively. In the case of /a/, there was no consonant component affecting the nasalance, and /mama/ and /mimi/ were somewhat higher as a standard nasal term. The reason why the nasalance of /mama/ and /mimi/ is different is that the /a/ component of the /mama/ word is a posterior low vowel characteristic and the tip of tongue is located at the lower side. Furthermore, the /i/ component of the /mimi/ word has anterior high vowel characteristics, which is expected to be the result of a mechanism that enhances the separation of the nasal and oral cavity [21]. The differences in the calculated index through the separation plate-type and mask-type nasometric instruments are shown in Figure 10.

Figure 10.
Calculated nasalance results comparison for (a) males and (b) females, and correlation coefficient results comparison for (c) males and (d) females.
In the case of the male mean nasalance for /a/, /mama/, and /mimi/, it was measured about 5% to 10% lower than that of the mask-type nasometric instrument. In the case of female mean nasalance, it was also measured as low as 3% to 15%.
In the case of the male mean correlation coefficient between oral and nasal speech signals, the mask type was found to be about 0.20 to 0.45 (/a/, /mama/) higher than that of the separation plate type. In the case of /mimi/ words, the result was slightly higher (0.01). The average correlation coefficient of the female was also found to be about 0.2 to 0.38 for /a/ and /mama/ sounds; /mimi/ words showed results about 0.02 higher.
Referring to Figure 10, as the correlation coefficient increases, the nasalance tends to decrease, which means that the nasalance is lower as the signals of the oral and nasal sounds are similar. The design of the mask-type nasometric instrument to minimize the influence of acoustic feedback is less affected by the interference than the nasometric instrument of the separator type and exhibits a relatively high correlation between the oral and nasal signals.
The higher the correlation, the lower the nasalance of the healthy control group. The mask-type nasometric instrument results are about 5% to 15% lower than the separator-type nasometric instrument results. This is because the mask structure, based on the low-pass filter, suppresses frequency components above about 500 Hz of the measured speech signal, and it is relatively similar to the nasal signal component in the low-frequency band.
4. Discussion and Conclusions
In this study, we analyzed the characteristics of a conventional nasometric instrument structure for patients with a resonance disorder. Acoustic collection characteristics were measured with an attached commercial microphone (Electret Condenser Microphone, ECM) in the nasometric instrument structure when pure tone sounds of 74 and 94 dB SPL were applied. Furthermore, we investigated the structural problems of the separation plate-type nasometric instrument. We confirmed the effect of acoustic feedback on the separation plate structure when applying the 74 dB SPL. In addition, the experimental results showed interference effects with values of about 11 to 18 dB. This acoustic feedback effect can cause problems in the accurate nasalance calculation of nasometric instruments.
In addition, we simulated the frequency characteristics of the mask-type nasometric instrument with an electrical-mechanical-equivalent model, which is designed to minimize the effects of acoustic feedback. Simulation results show that the frequency properties were low-pass filter characteristics at 518 Hz due to the mask structure in the nasometric instrument.
In addition, the acoustic collection characteristics of the conventional separation-type and mask-type nasometric instruments were tested on a healthy control group and the results were analyzed. In the case of the mask type, the similarity of the frequency characteristics to those of the simulation results was confirmed.
Voice data were obtained through the healthy control group using the vowel extension /a/ and the standard nasal words /mama/ and /mimi/. The frequency suppression characteristics according to the acoustic collection structure were confirmed through frequency domain analysis. The closed structure mask type exhibited a low-pass filter characteristic based on a band of about 500 Hz. Consequently, the mask-type structure had a higher correlation between the oral and nasal sounds than the separation plate type and the nasalance was lowered.
We also confirmed that the nasalance was different depending on the location of the tongue when the healthy control group spoke the word. In the case of /mama/ and /mimi/, the nasalance was different owing to the structure of the tongue of the posterior low vowel /a/ and the high vowel /i/ component of the anterior type. In this regard, the results of this study can be referred to the research of nasalance values according to the position of the tongue.
Author Contributions
Study design, measurements, data analysis, and discussion by S.T.W., Y.B.P., D.H.O., J.-W.H., all authors have approved the submitted manuscript, the manuscript has not been submitted elsewhere nor published.
Funding
This research was supported by Basic Science Research Program through the National Research Foundation of Korea (NRF) funded by the Ministry of Education (Nos. 2018R1D1A1B07051072 and 2019S1A5A2A03054267) and the Daegu-Gyeongbuk Medical Innovation Foundation funded by the Gyeongsan-si.
Conflicts of Interest
The authors declare no conflict of interest.
References
- Joseph, C.S.; Edie, R.H. Voice Theraphy: Clinical Case Studies, 4th ed.; Plural Publishing: San Diego, CA, USA, 2019; pp. 13–31. [Google Scholar]
- Borden, D.R.; Borden, S.C. The Voice and Voice Theraphy, 1st ed.; Allyn & Bacon: Boston, MA, USA, 2000; pp. 165–172. [Google Scholar]
- Kang, J.E. The Relationship between Speaker Factors and Speech Intelligibility of Children with Cleft Palate. Commun. Sci. Disord. 2009, 14, 338–348. [Google Scholar]
- Lee, J.N.; Lee, G.H.; Na, S.D.; Seong, G.W.; Cho, J.H.; Kim, M.N. Noise Cancellation Algorithm of Bone Conduction Speech Signal using Feature of Noise in Separated Band. J. Korea Multimed. Soc. 2016, 19, 128–137. [Google Scholar] [CrossRef]
- Shin, H.G. Assessment and Treatment of the Cleft Palate Speech Disorder by Use of the Nasometer. Korean Cleft Lip Assoc. 2008, 11, 1–11. [Google Scholar]
- Lim, S.E. Nasalance Scores of 5 to 7-Year-Old Korean Children. J. Korean Acad. Speech Lang. Pathol. Audiol. 2005, 10, 71–88. [Google Scholar]
- Kang, S.G. Study on Nasalance of in Five-age Children. J. Korean Soc. Spec. Educ. 2000, 1, 12–22. [Google Scholar]
- Kang, S.J.; Choi, H.J. Effect of Percentage of Correct Consonants and Nasalance Score on the Speech Intelligibility and Acceptability in Adults with Dysarthria. J. Rehabil. Int. Korea 2016, 20, 67–82. [Google Scholar]
- Ziade, G.; Kasti, M.; Sarieddine, D. Clinical Application of Nasometry in Patients with Nasal Obstruction. Ear Nose Throat J. 2017, 96, 1–4. [Google Scholar] [CrossRef] [PubMed]
- Shin, H.S. Treatment Device for Voice Disorders. Patents Korea (No. 10-1114920). Available online: https://patents.google.com/patent/KR101114920B1/ko (accessed on 10 October 2018).
- Watterson, T.; Lewis, K.; Brancamp, T. Comparison of Nasalance Scores Obtained with the Nasometer 6200 and the Nasometer II 6400. Cleft Palate-Craniofac. J. 2005, 42, 574–579. [Google Scholar] [CrossRef] [PubMed]
- Woo, S.T.; Han, J.H.; Lee, J.H.; Seong, K.W.; Cho, J.H.; Choi, M.H. Realization of a High Sensitivity Microphone for a Hearing Aid using a Graphene−PMMA Laminated Diaphragm. ACS Appl. Mater. Interfaces 2017, 9, 1237–1246. [Google Scholar] [CrossRef] [PubMed]
- Eargle, J. The Microphone Book; Taylor and Francis Group: Abingdon, UK, 2005; pp. 102–154. [Google Scholar]
- Omori, T.; Usui, T.; Watabe, K.; Nguyen, M.D.; Matsumoto, K.; Shimoyama, I. Elastic Wave Mearsurement using a MEMS AE Sensor. Appl. Sci. 2017, 7, 737. [Google Scholar] [CrossRef]
- Gildersleeve-Neumann, C.E.; Dalston, R.M. Nasalance Scores in Noncleft Individuals: Why Not Zero? Cleft Palate-Craniofac. J. 2001, 38, 106–111. [Google Scholar] [CrossRef] [PubMed]
- Rokhlin, V. Diagonal Forms of Translation Operators for the Helmholtz Equation in Three Dimensions. Appl. Comput. Harmon. Anal. 1993, 1, 82–93. [Google Scholar] [CrossRef]
- Bai, M.R.; Chen, R.L.; Wang, C.J. Electroacoustic Analysis of an Electret Loudspeaker using Combined Finite-element and Lumped-parameter Models. J. Acoust. Soc. Am. 2009, 125, 3632–3640. [Google Scholar] [CrossRef] [PubMed]
- Lohfink, A.; Eccardt, P.C. Linear and Nonlinear Equivalent Circuit Modeling of CMUTs. IEEE Trans. Ultrason. Ferroelectr. Freq. Control 2005, 52, 2163–2172. [Google Scholar] [CrossRef] [PubMed]
- Mohamad, N.; Iovenitti, P.; Vinay, T. Modelling and Optimisation of a Spring-supported Diaphragm Capacitive MEMS Microphone. Sci. Res. 2010, 2, 762–770. [Google Scholar] [CrossRef]
- Tilmans, H.A.C. Equivalent Circuit Representation of Electromechanical Transducer Ⅱ. Distributed-Parameter Systems. J. Micromech. Microeng. 1996, 7, 157–176. [Google Scholar] [CrossRef]
- Raphael, L.J. Speech Science Primer; Lippincott Williams & Wilkins: Philadelphia, PA, USA, 2013; pp. 58–77. [Google Scholar]
© 2019 by the authors. Licensee MDPI, Basel, Switzerland. This article is an open access article distributed under the terms and conditions of the Creative Commons Attribution (CC BY) license (http://creativecommons.org/licenses/by/4.0/).