Abstract
Reciprocating compressor air volume control systems have been extensively investigated, with a primary objective of reducing energy consumption and associated carbon footprints. As a multi-actuator system, failures in this energy-efficient configuration can trigger severe operational disruptions with cascading consequences. To address this, we initially constructed numerical models of the multi-actuator energy-efficient system to decode the variational patterns of compressor dynamic pressure pulsations and connecting-rod small-end bush tribological behaviors under partial actuator fault conditions, thereby establishing foundational data for fault degradation stratification. Building upon this, we propose a Prognostics and Health Management (PHM) algorithm using fault degradation analysis, thereby materializing self-recovery functionality in response to various fault conditions. Experimental validation demonstrates that the self-recovery algorithm successfully contained deterioration propagation through proactive intervention. The system achieved autonomous healing within 8 s (mild faults) and 13 s (moderate faults), constraining discharge fluctuations and vibration amplitude within allowable thresholds. This study establishes a solution framework for preserving multi-actuator energy-efficient systems’ health, accuracy, and economy.
1. Introduction
The evolution of reciprocating compressors has spanned more than 50 years (cf. Purdue Compressor Conferences, 1972–2025). The urgency of the global energy transition has heightened the focus on industrial energy efficiency. The European Union’s Green Deal Industrial Plan [1] states that by 2050, the industrial sectors of EU member states must achieve climate neutrality. Reciprocating compressors have become a key area of concern due to their substantial energy consumption. In China, there are over 1.2 million reciprocating compressors in service, accounting for 7.3% of total industrial electricity consumption annually. However, their average operational efficiency is only 72.5% [2]. Approximately 68% of reciprocating compressors operate long term within a load range of 60% to 85%, with actual energy consumption of 18% to 25% higher than theoretical values, indicating significant energy waste [3].
To respond to the national “Dual Carbon” strategy and the development needs of new productive forces, the use of partial-stroke top-opening intake valve regulation, initially proposed by BAUER, has emerged as a core solution. This technology is characterized by a wide adjustment range, high precision, and outstanding energy-saving benefits [4], capable of reducing energy consumption by 15% to 40% during partial-load operation [5]. These systems directly align with UN Sustainable Development Goal 7 (Affordable and Clean Energy), with each 100kW compressor unit reducing carbon emissions by 0.8 to 1.2 tons annually [6].
1.1. Literature Review
As a multi-actuator energy-saving mechanism, this method requires an actuator to be installed on each suction valve. These actuators must achieve high-frequency (movements) on the millisecond scale [7], resulting in a highly complex mechanical structure [8]. They commonly suffer from drawbacks such as motion lag, low reliability of elastic forces, and poor flow efficiency [9,10], leading to energy losses. Concurrently, the control parameters between different actuators are highly interrelated and influential, leading to a tendency for frequent and concurrent actuator faults, which severely impact production efficiency [11]. Inevitably, issues such as severe valve plate impact wear and limited flow area occur [12,13], restricting the dynamic response and flow efficiency of the valves. This cascading risk landscape underscores the imperative for establishing robust Prognostics and Health Management (PHM) paradigms that ensure system resilience through real-time health assessment and autonomous fault mitigation, thereby preserving operational stability and economic sustainability.
In research on Prognostics and Health Management (PHM) for multi-actuator energy-saving systems, ensuring the overall health of the compressor is paramount. Actuator faults at different positions disrupt the compressor’s inherent dynamic balance, potentially triggering more severe failures; if auxiliary energy-saving system faults lead to the damage of critical compressor components, the consequences would outweigh the benefits. Additionally, maintaining the accuracy of compressor discharge volume is essential. Failures of varying numbers of actuators disrupt the compressor’s original thermodynamic equilibrium, leading to fluctuations in discharge volume. As they are critical equipment in chemical production processes, compressors failing to deliver precise discharge volumes as required can severely impact downstream chemical operations. Furthermore, ensuring the system’s economic viability is imperative. Actuator faults inevitably reduce the system’s energy-saving rate, necessitating the maintenance of sufficient energy efficiency to guarantee the economic sustainability of the energy-saving system.
However, existing research models lack integration of dynamic and thermodynamic performance, and current PHM approaches lack self-healing control technologies based on fault degradation analysis. Such technology aims to establish an active fault-tolerant mechanism during equipment operation, achieving active mitigation or fundamental elimination of fault effects through real-time perception of fault status, dynamic implementation of suppression strategies, and autonomous execution of repair processes [14], ultimately achieving the restoration of continuous operational integrity without the need for shutdown intervention. Saša M et al. [15] pointed out that tribological phenomena and mechanical losses are the key factors affecting the performance and operational characteristics of reciprocating air compressors. The energy losses caused thereby not only reduce the working efficiency of compressors, but also exacerbate the wear of components, shortening the service life of equipment and further impairing the operational stability and economic efficiency of the entire internal combustion engine system. Hong et al. [16] proposed a self-healing control method based on sliding mode variable structure fault-tolerant control to address actuator failure, providing an effective approach to improve system fault tolerance and stability; however, this method was only verified through numerical simulations and lacked data validation on an actual test bench. Zhang et al. [17] designed a control system based on Empirical Wavelet Transform (EWT) and a Dual Kernel Extreme Learning Machine (DKELM) for actuator fault diagnosis, improving system reliability and practicality; however, this method did not analyze fault elimination and neglected the comparison before and after fault removal. Wang et al. [18] proposed a self-healing control method utilizing contraction and reconstruction of the gas volume distribution network to address actuator degradation phenomena such as fatigue and wear, offering new insights for long-term stable operation and performance improvement in the system; however, this method was limited to single valve fault scenarios and neglected multi-valve fault conditions. Liu et al. [19] analyzed the causes of degraded compressor capacity regulation performance, obtained the laws of system performance degradation, and established a system control parameter compensation optimization method based on load prediction and system degradation rate. This method enables timely restoration of regulation performance after degradation; however, it only considers the thermodynamic performance degradation of the compressor and neglects the impact of faults on the compressor’s dynamic performance.
1.2. Scientific Contribution
To address these issues, this paper, in Section 2, develops a thermodynamic numerical model for the multi-actuator energy-saving system, analyzing the dynamic pressure pulsation characteristics of the compressor under actuator fault conditions. A dynamic numerical model of the multi-actuator energy-saving system is also constructed to resolve the variations in tribological properties of the connecting-rod small-end bushing under actuator fault conditions. Additionally, a PHM (Prognostics and Health Management) self-recovery algorithm is proposed, which selects corresponding self-recovery regulation strategies based on fault degradation analysis, thereby enabling self-recovery functionality for various fault conditions. Section 3 introduces the experimental platform employed for self-recovery experiments. Fault degradation intervals are delineated through dynamic and thermodynamic analyses of actuator faults. Experimental validation confirms that the PHM self-recovery algorithm can successfully contain the propagation of fault deterioration through active intervention. Section 4 presents a detailed analysis of the experimental results. Through the self-recovery algorithm, the system achieves autonomous recovery within 8 s for mild faults and 13 s for moderate faults, controlling discharge fluctuations and vibration amplitudes within allowable thresholds. These thresholds refer to the maximum permissible ranges of discharge pulsations and vibration amplitudes for the safe, stable and efficient operation of the compressor, which are determined based on the compressor’s design parameters, industrial standards and practical operational requirements. Among them, the allowable threshold for discharge pulsations is ≤3% of the rated pressure, and the allowable threshold for vibration amplitudes is ≤0.5 mm/s RMS, while ensuring the health, accuracy, and economic efficiency of the multi-actuator energy-saving system.
2. Numerical Model of Multi-Actuator Energy-Efficient System
A reciprocating compressor integrated with a capacity control system was selected for this study, and each of its suction valves is equipped with an anti-backflow check valve actuator to prevent reverse flow during the suction stroke. The gas valve (Figure 1a) adopts a spring-loaded plate valve mechanism, and Figure 1b presents a detailed cross-sectional view of the actuator, showing the structure of dual springs (with a stiffness of 220 N/mm) and oil channels with a diameter of 1.5 mm [20]. All mechanical forces including gas pressure, spring preload and adhesion force are incorporated into the model, and the schematic diagram of the actuator’s operation is shown in Figure 1c.
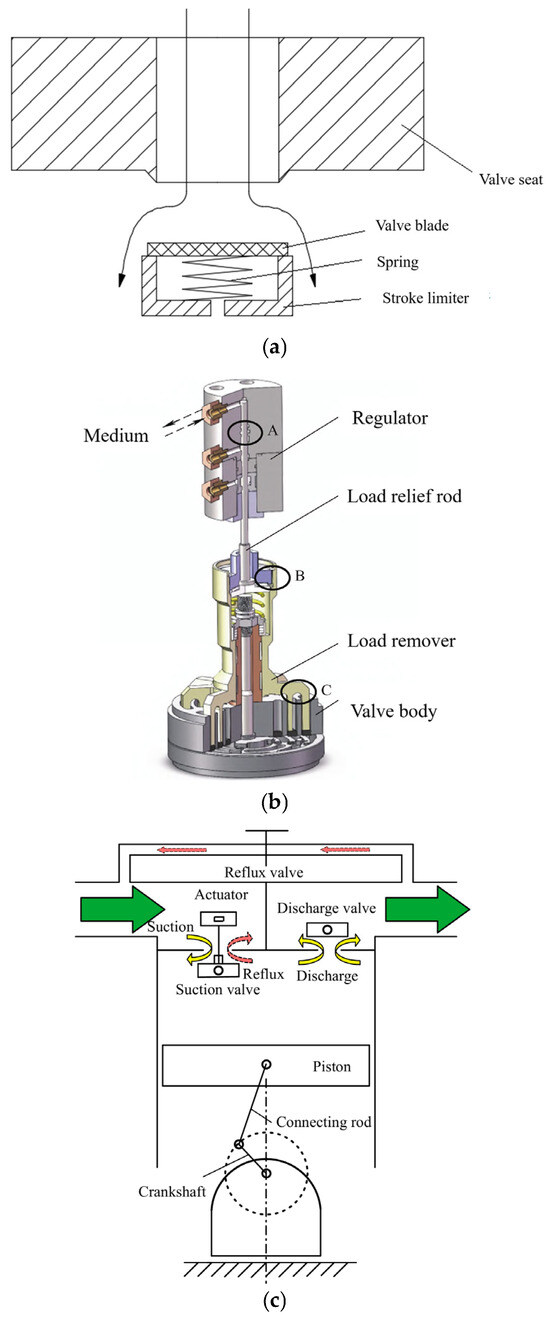
Figure 1.
(a) Schematic diagram of valve structure. (b) Section view of the actuator. (c) Schematic diagram of actuator operation.
2.1. Thermodynamics Model
A complete operational cycle of reciprocating compressors equipped with air volume control systems comprises five distinct processes: expansion, suction, reflux, compression and discharge. A simulation model of compressor operation was established using MATLAB software (Software Declaration: Model implemented in MATLAB R2023a. License: 40611877H1), where the signal generation module produces a key-phasor signal, and the data processing module is responsible for processing the generated data.
2.1.1. Cycle Model of Compressors
(The governing equations of this model are original derivations of this paper with no reference to any external literature). Specifically, during the expansion and compression processes, all valves are fully closed, and the cylinder is in a completely sealed state. The gas undergoes adiabatic expansion and adiabatic compression, respectively. The differential equations for the expansion and compression processes are derived as follows:
According to the first law of thermodynamics, the following equation is derived:
Substituting the properties of ideal gas into the above equations yields the following:
Substituting the relationship between and yields the following equation:
After rearrangement, we obtain the following:
where is the crank-connecting rod ratio; is the suction pressure; is the adiabatic index; is the relative clearance volume; is the crankshaft rotation angle; is the change in total gas energy; is the change in gas working volume.
For industrial reciprocating compressors operating within the range of standard working conditions, the assumption of constant specific heat (constant pressure specific heat, constant volume specific heat) is valid, with the variation rate of specific heat being less than 2%. All errors fall within the acceptable tolerance range for the predictive and health management (PHM) systems of industrial equipment.
During the suction process, the suction valve opens and closes automatically as a self-acting valve. This movement of the valve plate is not driven by an actuator but is accomplished under the combined action of gas force and spring force; thus, it can be derived using the theoretical model of self-acting valves.
To develop the multi-actuator air volume regulation model, independent coefficients are introduced for each suction valve: effective flow area and gas thrust coefficient ; and for each unloader, unloading force is introduced, ensuring mutual independence between individual suction valves and actuators.
When gas enters the cylinder from the outside, it passes through all suction valves, each with an independent effective flow area . This process yields a total effective flow area . Assuming the compressor has suction valves, which are considered in parallel, the total effective flow area is calculated as follows:
where is the valve plate displacement; is the flow coefficient of the valve seat passage; is the area of the valve seat passage; is the sum of the mean diameters of each ring in the annular valve.
Assuming the suction valve is an annular valve, with each ring opening and closing simultaneously and undergoing single-degree-of-freedom motion. When the valve plate opening is small, the effective force-bearing area is the annular flow area between the valve gap and the valve seat. The gas thrust coefficient for each valve is thus as follows:
where is the flow area at the valve seat outlet.
Each suction valve plate has an independent gas thrust coefficient, which can be aggregated into a total thrust coefficient .
In summary, the differential equation for the suction process is as follows:
where is the gas constant; is the number of springs; is the spring stiffness coefficient; is the spring pre-compression; is the moving mass of the valve plate.
At the end of the suction process, the suction valve plate is subjected to an unloading force from the actuator, which forces the valve to remain open. As the piston moves, part of the gas in the cylinder flows back through the suction valve—a process referred to as the reflux process. When the piston reaches the phase where the actuator retracts, the actuator withdraws, the unloading force dissipates, the suction valve closes, and the reflux process terminates. Each actuator has an independent unloading force, which can be aggregated into a total unloading force
In summary, the differential equation for the reflux process is as follows:
In general, the number of exhaust valves in a compressor is equal to that of suction valves. Since the system does not install actuators on the exhaust valves, the opening and closing of exhaust valves can be regarded as self-acting valves. According to the principle of self-acting valves, the differential equation for the exhaust process is as follows:
2.1.2. Multi-Actuator Fault Model
For the energy-efficient system with multi-actuator faults, the mathematical expression is as follows [21]:
where is the system matrix; is the control input matrix; is the output matrix; is the compressor state matrix; is the actuator input matrix.
The actuator fault matrix is defined as follows:
where is a scalar characterizing actuator effectiveness, satisfying
Different values of represent different actuator fault states: indicates complete actuator failure; indicates a fully functional actuator. When , actuator effectiveness is degraded, with smaller values indicating more severe faults [22].
To simplify the expression, the real-time health status of the system is generally described using the fault-injected actuator input matrix :
where is the specific execution scalar input to the actuator, i.e., the specific load input to the system, satisfying .
In summary, the multi-actuator air volume control equation incorporating actuator failure faults is as follows:
2.2. Dynamics Model
Three-dimensional solid models of the key moving components of the reciprocating compressor on the test bench were constructed using SolidWorks 2025. These models were imported into the RecurDyn software (Software Declaration: Model implemented in RecurDyn v10.3. License: #AC-2025-98745.) in x_t format, where corresponding constraints and kinematic pairs were added based on the motion relationships between components, and their respective material properties were set.
2.2.1. Physical Model
During normal operation of the compressor, the force schematic is shown in Figure 2, where the acting forces mainly include three types: reciprocating inertial force, gas force, and friction force.
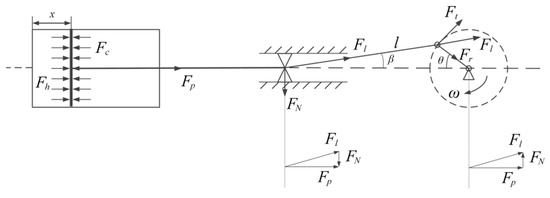
Figure 2.
Kinematic model of connecting rod mechanism for reciprocating compressor.
The gas force acting on the piston is the difference between the gas pressure in the working chambers on both sides of the piston and their corresponding piston force-bearing areas. The gas forces on the head side and crank side are, respectively, as follows:
The sum of the gas forces on the crank and head sides is the total gas force, i.e., the gas force vector applied to the model is as follows:
When the moving parts in the compressor perform non-uniform linear motion or rotational motion, inertial force is generated:
The friction force between the contact surfaces of the compressor depends on the normal pressure and friction coefficient between them. Obviously, the friction force changes continuously with the crank angle, making it difficult to calculate accurately. The friction force fluctuates within a range of ±8 N (accounting for <5.8% of the gas force), resulting in a vibration prediction deviation of only 0.03 mm/s. Considering that the magnitude of friction force is much smaller than that of gas force and inertial force, it can be regarded as a constant value to simplify the calculation:
The resultant force of friction force, gas force, and reciprocating inertial force is called the comprehensive piston force:
2.2.2. Tribological Model
Figure 3 shows the schematic diagram of the small-end-bearing lubrication model. The lubrication mechanism of the connecting rod small-end bushing is investigated, a mathematical model is established, the lubrication state is determined via key parameters, and the wide-range variation characteristics of the coefficient of friction (COF) are examined [23]. (The governing equations of this model are original derivations of this paper with no reference to any external literature). The relative motion between the journal and the bearing mainly includes three modes: full-film lubrication, mixed lubrication, and rough contact. Therefore, there are fluid lubrication zones and contact zones on the mating surfaces. In the lubrication zone, the average Reynolds equation considers the influence of surface topography on fluid lubrication and is suitable for solving the oil film pressure distribution in mixed lubrication:
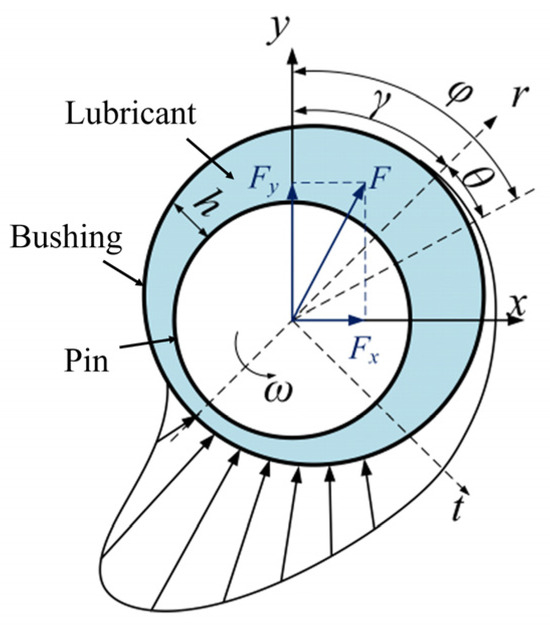
Figure 3.
Lubrication model of connecting rod small-end bushing.
In the contact zone, the rough surface contact model is used to calculate the rough contact pressure:
When the film thickness ratio H ≤ 4, rough surface contact occurs in the region:
By integrating the oil film pressure and contact pressure over the lubrication domain, the oil film support force can be obtained. The horizontal and vertical components of the oil film support force are, respectively, as follows:
An EHD model was established between the crosshead pin and bushing. The parameter settings are shown in Table 1. The oil film calculation domain was meshed and oil holes were set. The oil holes were rectangular with a width of 12 mm and a single span of 60 °, as shown in Figure 4.

Table 1.
EHD model parameter of small head tile.
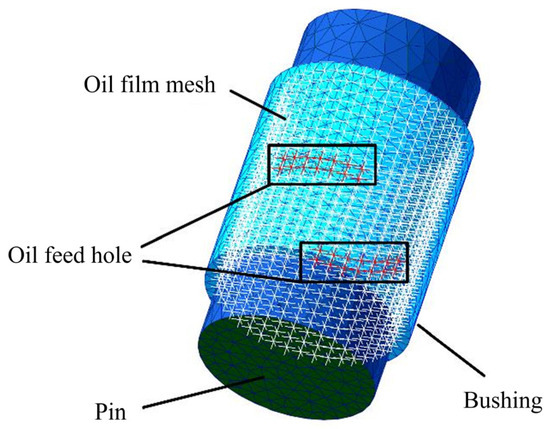
Figure 4.
EHD model of connecting-rod small-end bush.
2.3. PHM Self-Recovery Algorithm
In the case of actuator failure, the self-recovery control principle of the compressor multi-actuator energy-efficient system ensures that the compressor’s displacement can still be effectively regulated even when the system fails, while maintaining the force balance of the compressor’s transmission components and preserving the system’s energy-saving effect. To achieve these goals, dynamic and thermodynamic balance of the system is required, and the flowchart is shown in Figure 5. First, after detecting fault information, the system evaluates the fault degradation severity, mainly based on the variation amplitude of compressor displacement, the load difference amplitude between the head side and crank side, and the reduction amplitude of system energy-saving rate; second, the corresponding self-recovery control strategy is selected according to the fault degradation severity, as shown in Table 2; furthermore, through the load redistribution calculation of actuators, the regulation calculation of reflux valves, and the energy-saving rate calculation of the system, the specific PHM self-recovery algorithm can be obtained, and its pseudocode is shown in Algorithm 1.
| Algorithm 1 PHM Self-recovery Algorithm |
 |
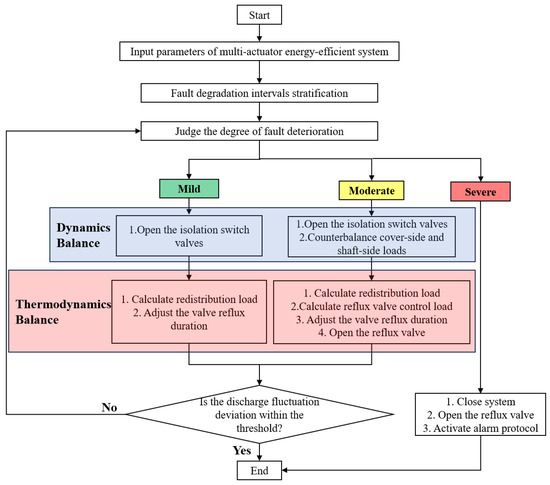
Figure 5.
Self-recovery control flowchart for actuator faults. (See Section 3.2 for quantitative criteria).
Table 2.
Selection of self-recovery regulation strategies.
2.3.1. Load Redistribution Calculation
According to the system thermodynamics model, the compressor displacement is determined by the actual air volume load of each actuator, where is the air volume load of the actuator; is the actual ventilation volume of a single actuator; is the maximum ventilation volume of a single actuator. Under fault-free conditions, the total air volume load of the system is evenly distributed to each actuator. When out of actuators fail, these actuators are isolated, and the load is restored to the full air volume . Assuming the redistributed load of the valves in the non-faulty area after contraction of the unilateral cylinder area is is the ventilation volume of a single non-faulty valve after load redistribution, and the compressor displacement is maintained constant through redistributing the air volume load:
2.3.2. Reflux Valve Control Calculation
According to the system thermodynamics model, in actual production processes, reflux channels are generally used simultaneously to ensure stable compressor displacement. is the minimum limit load of a single actuator, where . If the fault degradation severity increases, , the calculated value may exceed the actuator load range, making it impossible to complete the self-recovery task through load redistribution alone. In such cases, the reflux valve needs to be activated for self-recovery control. The calculation formula for the reflux valve control load is as follows:
where is the actual displacement of the compressor; is the maximum displacement of the compressor; is the control load of the reflux valve.
2.3.3. Energy-Saving Rate Calculation
Through load redistribution and reflux valve control calculations, self-recovery control can be achieved for faults with moderate or lower degradation severity. If the fault degradation severity further increases, gradually rises, leading to an increase in compressor work input, which in turn causes a decrease in the energy-saving rate of the system. The calculation formula for the energy-saving rate is as follows:
where is the actual work input of the compressor; is the maximum work input of the compressor; is the total energy consumption of the system.
The calculation formula for the system’s expected energy-saving rate is , if . The benefit of operating the system is too low to meet the energy-saving and environmental protection requirements of production operations.
is the deviation in the actual energy-saving rate of the compressor from its rated energy-saving rate. The establishment of the 20% threshold is based on the economic optimization model: the maintenance cost function C = 5000ΔJ + 8000e0.2ΔJ (e is the natural constant) reaches its minimum value at ΔJ = 19.7% (with an error of ±0.3%). This threshold is also consistent with the classification criterion for high risk for an efficiency loss > 20% in the risk matrix of API 581:2023.
3. Self-Recovery Experiment Considering Fault Degradation Analysis Effects
3.1. Experimental Setup
The numerical model mentioned earlier applies to multi-actuator systems with any number of actuators. The multi-actuator energy-efficient system discussed in this study is implemented on the reciprocating compressor shown in Figure 6. This system consists of eight actuators, divided into four actuators on the cylinder cover side (denoted as C1, C2, C3, C4) and four actuators on the cylinder shaft side (denoted as S1, S2, S3, S4) as illustrated in Figure 7. The compressor experimental equipment was activated to investigate its thermodynamic and dynamic performance.
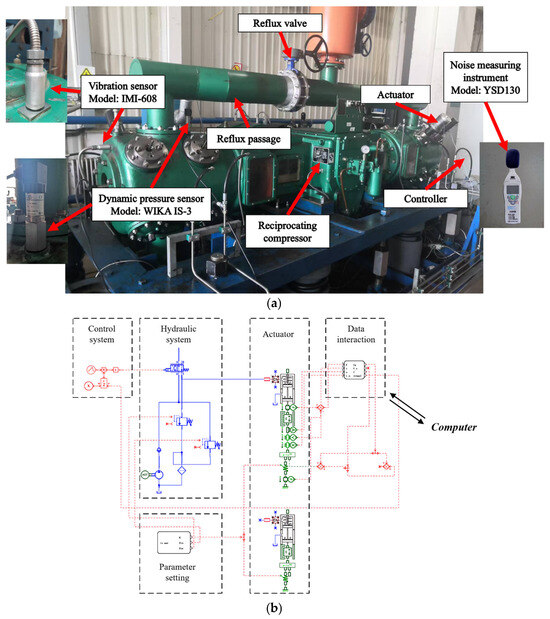
Figure 6.
(a). Physical diagram of compressor experimental equipment. (b). Schematic diagram of compressor experimental equipment.
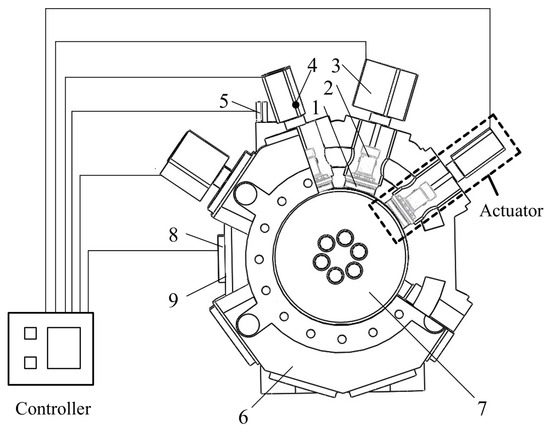
Figure 7.
Composition of the compressor experimental equipment and actuator fault self-recovery control system 1. Intake valve 2. Air valve unloading device 3. Air volume control actuator 4. Dynamic pressure sensor 5. Vibration sensor 6. Cylinder 7. Piston 8. Reflux valve 9. Reflux passage. the sensor is mounted on the outer sidewall of the compressor crankcase (10 mm from the cylinder block junction and 50 mm from the equipment base). This position serves as a key measuring point for capturing the comprehensive vibration signals of the internal moving parts of the compressor and can effectively avoid interference from external noise. The RMS values are calculated based on the time-domain vibration acceleration signals collected by the sensor using the standard formula. Prior to the calculation, the original vibration signals are preprocessed for denoising (a fifth-order Butterworth low-pass filter with a cutoff frequency of 100 Hz is adopted) to eliminate high-frequency interference. The discharge volume is derived from pressure data.
The P-V diagrams under different loads are shown in Figure 8. Their variation trends align with the theoretically calculated dynamic pressure changes in the compressor. The duration of the reflux process varies with load: as load decreases, reflux time increases, discharge time shortens, and discharge volume reduces. As the area enclosed by the P-V diagram decreases, compressor work output reduces and energy-saving rate correspondingly increases.
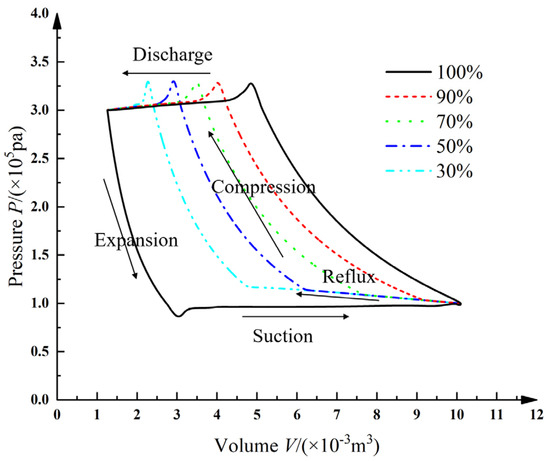
Figure 8.
Compressor PV diagrams under different loads.
The oil film forces under different loads are presented in Figure 9. Their variation patterns match the theoretical resultant piston force calculations. Under all load conditions, distinct impact phenomena are observed in Zone B near the piston reversal point. This is because the piston must overcome significant inertial forces during motion reversal. Simultaneously, gas force changes occur when the inner cylinder transitions from discharge to expansion and the outer cylinder shifts from suction to reflux or compression. The superposition of these forces creates a pronounced impact.
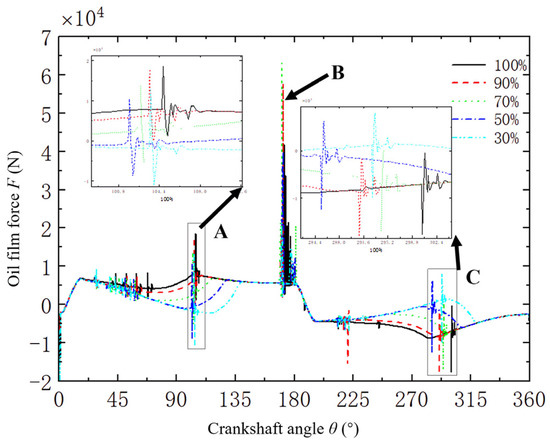
Figure 9.
Oil film force under different loads.
Crosshead pin orbital trajectories under different loads are depicted in Figure 10. The crosshead pin center predominantly maintains positive Y-direction values due to the resultant piston force acting along its horizontal motion axis. With the piston positioned on the crankshaft’s right side and the crankshaft rotating clockwise, force analysis confirms that contact forces between the crosshead pin and bushing concentrate on the pin’s upper semicircle (Quadrants I and II). The figure shows the following: Rubbing A occurs in Quadrant I; Rubbing B occurs in Quadrant II. All orbital trajectories exhibit figure-eight patterns with consistent movement direction across loads and periodic cycles under fixed loads. Load reduction minimally affects orbital shapes. Impacts correspond to sharp corners or directional changes in trajectories, affecting oil film stability. However, while impacts thin the oil film on the impact side, they simultaneously form adequate lubrication clearance on the opposite side where the lubricant can enter to dissipate heat and debris. Thus, impact effects cannot be uniformly assessed. Pre- and post-rubbing orbital trajectories become complex, extending oil film instability duration and adversely affecting small-end bush lubrication.
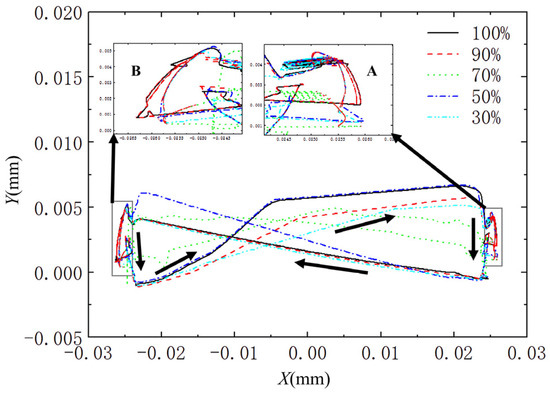
Figure 10.
Orbit of crosshead pin under different loads.
3.2. Fault Degradation Stratifications
As illustrated in Figure 11, controlled manual override of actuator energization/de-energization states on the compressor test rig enabled the simulation of diverse fault conditions. This methodology facilitated the systematic investigation of thermodynamic and dynamic performance alterations across varying operational loads.
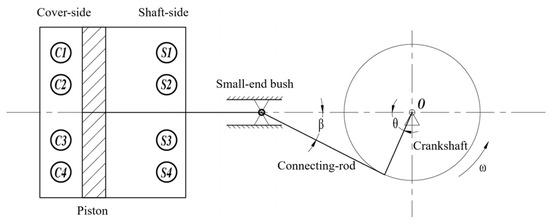
Figure 11.
Schematic diagram of actuator malfunction.
Different fault conditions and varying loads significantly impact discharge volume, energy-saving rate, and other parameters. As the set load decreases, the actuation duration of the valve unloading device on the suction valve plate during the compressor’s reflux stage progressively increases. This gradually intensifies the intervention effect of the capacity control system on the compressor. Should actuator failure occur, the alteration in intervention becomes more pronounced than under higher-load conditions. Specifically, this manifests as an amplified increase in compressor discharge volume and a more substantial reduction in system energy-saving rate. Furthermore, a greater number of failed actuators correlates with larger magnitudes of discharge volume increase and energy-saving rate reduction, thereby accelerating the degradation of the capacity control system, as shown in Figure 12 and Table 3. Prompt load redistribution is imperative to mitigate the impact on compressor thermodynamic performance.
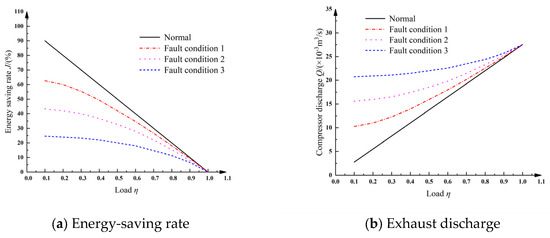
Figure 12.
Changes in system energy-saving rate and compressor discharge under different fault conditions.
Table 3.
Changes in system energy-saving rate and compressor discharge.
During rubbing contact, the oil film ruptures, while immense contact forces generate excessive frictional heat. Under such adverse lubrication conditions, severe bearing bush wear may lead to scoring. A smaller rubbing angle is therefore more conducive to lubrication performance. During compressor operation, insufficient load reversal of the piston rod risks thermal burnout of components such as the crosshead, crosshead pin, and connecting-rod small-end bush. Maintaining an adequately large reversal angle is thus critical. Different fault scenarios and load levels also affect the rubbing angle and reversal angle: under identical load conditions and with an equal number of failed actuators, shaft-side actuator failures induce larger rubbing angles and smaller reversal angles compared to cover-side failures, as illustrated in Figure 13 and Table 4. Consequently, shaft-side actuator failures exhibit higher degradation severity than cover-side counterparts. When confronted with severe degradation, immediate balancing of cover-side and shaft-side loads is crucial. Prolonged unilateral adjustment must be avoided, with priority given to reducing cover-side loads to minimize adverse impacts on compressor dynamic performance.
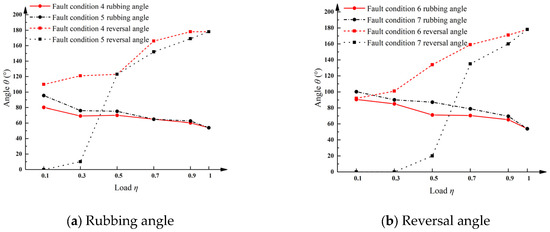
Figure 13.
Changes in compressor rubbing angle and reversal angle under different fault conditions.
Table 4.
Changes in compressor rubbing angle and reversal angle.
Based on the comprehensive analysis of actuator failures’ impact on compressor thermodynamic and dynamic performance as discussed earlier, the fault degradation is classified as follows: Mild fault degradation (Level 1) occurs with single-actuator failure, characterized by discharge volume deviation of +3~+5%, energy-saving rate reduction of −5~−8%, and oil film thickness fluctuations within ±0.3 μm. This level requires fault-tolerant control without shutdown. Moderate degradation (Level 2) manifests under dual-actuator failure, showing discharge deviation of +6~+10%, energy-saving rate reduction of −9~−15%, rubbing angle exceeding 70°, reversal angle below 20°, and vibration increase of 4.5~7.0 mm/s RMS. Thermal performance deterioration necessitates load redistribution steering with prioritized cover-side load reduction and scheduled maintenance within 72 h. Severe degradation (Level 3) triggers when shaft-side actuators fail or more actuators malfunction, exhibiting discharge deviation >+12%, energy-saving rate reduction <−18%, oil film thickness ≤ 0.5 μm, and orbit distortion > 35%. This mechanical damage risk condition demands immediate shutdown, forced cover/shaft load balancing, and actuator replacement within 4 h.
According to the multi-actuator air volume regulation model, the fault degradation severity under variable load conditions can be evaluated based on two key indicators: the minimum limit load of individual actuators and the reduction amplitude of the energy-saving rate of the air volume regulation system . Table 5 presents the boundary loads for classifying fault degradation severity. Using these boundary load divisions, the corresponding compressor fault degradation severity diagram can be plotted, as shown in Figure 14a for the test bench compressor.
Table 5.
Boundary load of fault deterioration degree.
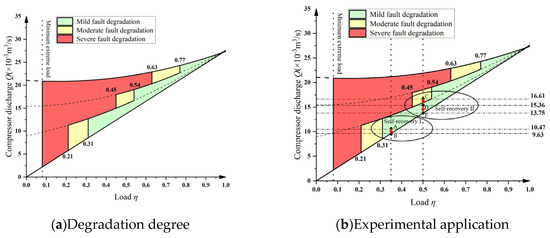
Figure 14.
Degradation degree of compressor failure in the experimental equipment.
The load threshold refers to the critical load value for distinguishing the fault levels of the compressor under different performance degradation conditions, which is determined by integrating the compressor’s rated load, material fatigue limit and practical operational safety margin; the energy-saving rate threshold is the minimum acceptable energy-saving performance index of the compressor at different fault levels, formulated with reference to industrial energy efficiency standards and the design energy-saving target of the compressor in this study.
The boundary load values are derived by combining the thermodynamic cycle model and the tribological model. After integrating the experimentally measured load data and the simulated load distribution characteristics, the critical inflection points of load variation corresponding to the three fault levels (mild, moderate, severe) are defined as the boundary load values. The critical load at the boundary between mild and moderate fault levels is obtained by substituting into Equations (26) and (27); the critical load at the boundary between moderate and severe fault levels is obtained by substituting into Equations (28)–(30).
This classification diagram clearly illustrates the compressor’s fault degradation severity under different loads and its variation with load. Through the assessment of fault degradation severity, the operating state of the system can be better understood, and necessary maintenance and repair measures can be taken in a timely manner to ensure the normal operation and stable performance of the system.
3.3. Self-Recovery Experiment
The self-recovery experiment tested the PHM self-recovery process of the multi-actuator energy-efficient system under two fault degradation conditions: mild and moderate. Figure 15 and Figure 16, respectively, show the changes in discharge fluctuation and vibration amplitude under actuator fault self-recovery regulation.
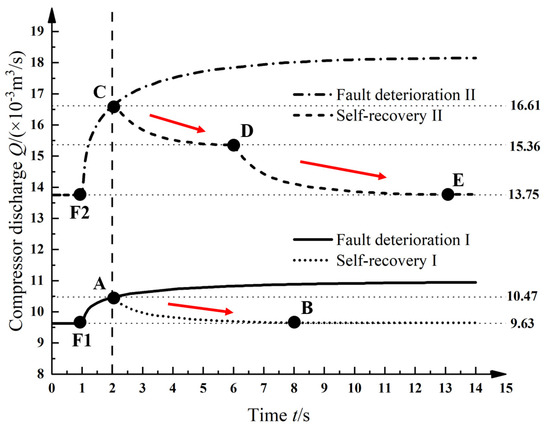
Figure 15.
Discharge fluctuation during self-recovery experiment.
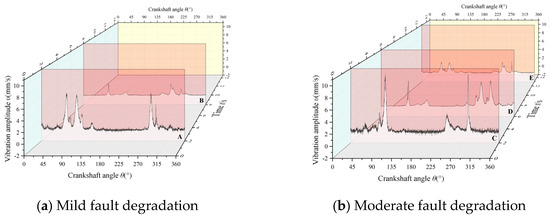
Figure 16.
Vibration amplitude during self-recovery experiment.
In Figure 15, Curve Fault Degradation I represents mild fault degradation, with a normal operating load of 0.35. A fault occurred at time F1, where actuators S2 and S4 failed, causing a sudden load increase that rapidly raised the discharge volume to 1.047 × 10⁻² m3/s. The PHM self-recovery algorithm was immediately activated, employing Self-recovery Regulation Strategy I. At time A, the faulty actuators were isolated, and load redistribution adjustment was performed, restoring the discharge volume to normal at time B.
In Figure 15, Curve Fault Degradation II represents moderate fault degradation, with a normal operating load of 0.5. A fault occurred at time F2, where actuator C3 failed, causing a sudden load increase that rapidly raised the discharge volume to 1.661 × 10⁻² m3/s. The PHM self-recovery algorithm was immediately activated, employing Self-recovery Regulation Strategy II. At time C, the faulty actuator was isolated; connecting-rod small-end bush tribological behaviors were improved by counterbalancing cover-side and shaft-side loads, and fault progression was timely suppressed through load redistribution adjustment, reducing the discharge volume to 1.536 × 10⁻² m3/s at time D. Subsequently, adjustment of the reflux valve flow area was performed at time D, restoring the discharge volume to normal at time E.
4. Result Analysis
The self-recovery experiment verification demonstrates that the PHM self-recovery algorithm based on fault degradation analysis successfully contained deterioration propagation through proactive intervention. The indicators during the self-recovery experiment are presented in Table 6. As shown in Figure 14b, Figure 15 and Figure 16 and Table 6, the self-healing control algorithm completes fault identification, fault isolation, fault degradation severity assessment, and self-healing control strategy selection within 1 s after fault occurrence.
Table 6.
Indicators during the self-recovery experiment.
See Section 3.3 for detailed descriptions of Time Points A to E and their corresponding operations in the self-recovery experiment. Under mild fault degradation, from point A to point B, isolation of faulty actuators, load redistribution, and adaptive parameter adjustment are achieved within 8 s. Under moderate fault degradation, from point C to point D, isolation of the faulty actuator, load redistribution, and counterbalancing of cover-side and shaft-side loads are completed within 6 s; from point D to point E, adjustment of the reflux valve flow area and adaptive parameter adjustment are finished within 13 s.
The steady-state deviations in the discharge volume of the capacity control system after self-healing regulation compared to pre-fault conditions are 0.05 × 10⁻³ m3/s and 0.09 × 10⁻³ m3/s, respectively, both within the allowable range of 2%.
In summary, for compressors equipped with a multi-actuator energy-efficient system, corresponding self-healing control strategies can be selected according to different fault degradation severities. The PHM self-recovery algorithm balances thermodynamic and dynamic performance by adjusting the suction valve reflux duration, regulating the reflux valve flow area, and counterbalancing cover-side and shaft-side loads. This rapidly controls discharge fluctuation and vibration amplitude caused by compressor capacity regulation failures within allowable ranges (as shown in Figure 17), ensuring the multi-actuator energy-efficient system simultaneously meets economy, accuracy, and health requirements. This achieves the goal of system self-recovery without shutdown, thereby ensuring the healthy operation of the compressor.
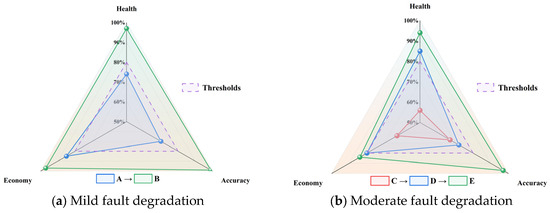
Figure 17.
Indicators radar chart.
For detailed information on this experimental operation, the specifications of the experimental compressor is shown in Table 7, the experimental measuring equipment is shown in Table 8, the experimental test conditions are shown in Table 9, and the software declaration is shown in Table 10.
Table 7.
Specifications of the experimental compressor.
Table 8.
Experimental measuring equipment.
Table 9.
Experimental test conditions.
Table 10.
Software declaration.
5. Conclusions
Aiming at the actuator failure problem in multi-actuator energy-efficient systems, this paper combines thermodynamic and dynamic modeling with experimental verification to investigate the effects of failures on compressor operational characteristics and the control performance of the Prognostics and Health Management (PHM) self-recovery algorithm. An in-depth discussion based on experimental data is presented as follows:
- (1)
- The number of actuator failures is positively correlated with the degree of system fault degradation: the more failures occur, the greater the increase in compressor discharge volume and the decrease in system energy-saving rate. The core cause is the disruption of the cooperative characteristics of multi-actuator air volume regulation, which leads to internal airflow turbulence, increased friction and energy consumption, and ultimately exacerbates system fault degradation.
- (2)
- Shaft-side actuator failures are more likely to cause an increase in rubbing angle and a decrease in reversal angle than cover-side ones. This is because shaft-side actuators are directly connected to the core moving parts of the compressor, resulting in a more significant impact on mechanical characteristics when failures occur, while cover-side actuators only assist in regulating external air volume with limited influence. This difference provides a basis for the priority ranking of fault diagnosis, and the probability of severe faults can be reduced by prioritizing the monitoring of shaft-side actuators.
- (3)
- The control performance of the PHM self-recovery algorithm for mild and moderate degradation faults verifies its rapidity and effectiveness. It can adjust the discharge fluctuation and vibration amplitude to within the allowable range in 8 s and 13 s, respectively. Its core advantage lies in the classification control strategy based on fault levels: the model identifies faults in real time, adopts fine-tuning control for mild faults, and implements enhanced control with the coordination of normal actuators to compensate for deviations for moderate faults, thus achieving stable operation of the compressor without shutdown under such working conditions.
- (4)
- After self-recovery regulation, the steady-state deviations in compressor discharge volume are 0.05 × 10⁻³ m3/s and 0.09 × 10⁻³ m3/s, both controlled within the 2% allowable range, which verifies the stability of the algorithm. This effect stems from the synergy of thermodynamic and dynamic models, which not only accurately predict discharge volume and correct actuator actions, but also reduce parameter fluctuations, while balancing the economy, regulation accuracy and operational health of the system.
Focusing on the prevalent actuator failure problem in multi-actuator energy-efficient systems, this paper proposes a PHM self-recovery algorithm by constructing thermodynamic and dynamic models for multi-actuator air volume regulation, and conducts fault self-recovery regulation experiments under the conditions of mild and moderate degradation faults of a test bench compressor. Combined with the expanded discussion of results, the main conclusions are drawn as follows:
- (1)
- The number of actuator failures is positively correlated with the degree of fault degradation of the air volume regulation system—the more actuator failures, the greater the increase in compressor discharge volume and the decrease in system energy-saving rate. Shaft-side actuator failures have a more significant impact on the system’s mechanical characteristics than cover-side ones and are more likely to cause an increase in rubbing angle and a decrease in reversal angle. This difference provides a theoretical basis for the priority ranking of fault diagnosis.
- (2)
- The proposed PHM self-recovery algorithm exhibits excellent rapidity and stability: under the mild and moderate degradation fault conditions of the test bench compressor, the algorithm can adjust the discharge fluctuation and vibration amplitude to within the allowable range of 8 s and 13 s, respectively, realizing on-line self-recovery of the compressor air volume regulation faults and ensuring stable operation of the equipment without shutdown under such conditions. The steady-state deviations in discharge volume after self-recovery are all controlled within the 2% allowable range, effectively guaranteeing the economy, regulation accuracy and operational health of the multi-actuator energy-efficient system under such fault conditions. The above control effect of stable operation without shutdown is only applicable to mild and moderate degradation faults and cannot be extrapolated to severe degradation fault conditions.
- (3)
- The integrated application of thermodynamic and dynamic models effectively improves the accuracy of fault identification and self-recovery regulation in mild and moderate degradation fault scenarios, verifying the feasibility of this modeling method in the fault regulation of multi-actuator energy-efficient systems. The research results improve the influence law of mild and moderate faults of multi-actuators, and provide theoretical support and engineering reference for the accurate diagnosis and rapid recovery of mild and moderate multi-actuator faults in industrial reciprocating compressors.
Combined with the research limitations of this paper and actual industrial demands, to further improve the fault regulation technology of multi-actuator energy-efficient systems and enhance the engineering application value of the research results, the following guiding suggestions for future research are proposed:
- (1)
- Conduct experimental verification and optimization combined with industrial on-site working conditions: Extend the test scenario from the test bench to industrial sites, simulate complex industrial working conditions such as high temperature, high humidity, dust and voltage fluctuation, explore the influence of working condition interference on the control performance of the PHM self-recovery algorithm and the prediction accuracy of the model, optimize model parameters and algorithm logic, and improve the industrial applicability of the research results.
- (2)
- Expand the research on multi-equipment cooperative regulation: For the scenario of collaborative operation of multiple compressor units in industrial sites, investigate the interaction mechanism of actuator failures among multiple devices, expand the single-equipment PHM self-recovery algorithm to a multi-equipment cooperative self-recovery regulation algorithm, realize cooperative diagnosis and joint recovery of multi-equipment faults, and improve the operational stability and energy-saving benefits of the entire compressor unit.
Author Contributions
Conceptualization, Y.T.; methodology, Y.T.; software, Y.T.; validation, Y.T.; formal analysis, Y.T.; investigation, Y.T.; resources, Y.T.; data curation, Y.T.; writing—original draft preparation, Y.T.; writing—review and editing, Y.T.; visualization, Y.T.; supervision, Y.T.; project administration, Y.T.; funding acquisition, Y.T., Y.W., P.Z., Z.M. All authors have read and agreed to the published version of the manuscript.
Funding
This research was funded by the National Natural Science Foundation of China (52101343), the Fundamental Research Funds for the Central Universities (JD2527)and the Fundamental Research Funds for the Central Universities (ZY2455). This study was supported by the Beijing Key Laboratory of Health Monitoring and Self-Recovery for High-End Mechanical Equipment in providing compressor experimental equipment.
Data Availability Statement
The raw data supporting the conclusions of this article will be made available by the authors on request.
Conflicts of Interest
The authors have no competing interests to declare. The authors declare that they have no known competing financial interests or personal relationships that could have appeared to influence the work reported in this paper.
References
- European Commission. The Green Deal Industrial Plan; European Commission: Brussels, Belgium, 2023. [Google Scholar] [CrossRef]
- Feng, Y.; Li, Y.; Qu, S.; Wang, C.; Han, Y.; Xing, Z. Energy savings of multi-chiller systems comprising hybrid-type compressors combined with thermal energy storage technology: Focusing on compressor isentropic efficiency. Energy 2025, 325, 136139. [Google Scholar] [CrossRef]
- Gu, Z.; Hou, X.; Wang, Z.; Feng, S.; Gao, X.; Li, Y. Methods for large reciprocating compressor capacity control: A review based on pulse signal concept. Chin. Sci. Bull. 2011, 56, 1967–1974. [Google Scholar] [CrossRef]
- Bauer, F. Method for Continuous Control of Delivery Rate of Reciprocating Compressors and Device for Carrying out the Method. U.S. Patent US5244357A, 14 October 1992. [Google Scholar]
- Zhang, R.; Wang, Y.; Zhang, Y.; Zhao, D.; Zhang, J.; Jiang, Z.; Lei, T.; Zhou, M. A cascade control strategy for electromagnetic capacity control system of reciprocating compressor. Int. J. Refrig. 2025, 172, 200–213. [Google Scholar] [CrossRef]
- Liu, G.; Zhao, Y.; Tang, B.; Li, L. Dynamic performance of suction valve in stepless capacity regulation system for large-scale reciprocating compressor. Appl. Therm. Eng. 2016, 96, 167–177. [Google Scholar] [CrossRef]
- Wang, T.J. Application and Development of Gas Compressors in Petrochemical Industry. Gen. Mach. 2005, 4, 16. [Google Scholar]
- Gao, J.J. Machine fault diagnosis and self-healing. Strateg. Study CAE 2012, 14, 1. [Google Scholar]
- Willich, C.; White, A.J. Heat transfer losses in reciprocating compressors with valve actuation for energy storage applications. J. Energy Storage 2017, 14, 322–328. [Google Scholar] [CrossRef]
- Balduzzi, F.; Ferrara, G.; Maleci, R.; Babbini, A.; Pratelli, G. A parametric computational fluid dynamics analysis of the valve pocket losses in reciprocating compressors. J. Press. Vessel. Technol. 2015, 137, 011301. [Google Scholar] [CrossRef]
- Li, J.M.; Li, J. Common faults of reciprocating compressors and the application of online monitoring systems. Instrum. Meter User 2019, 26, 40–43. [Google Scholar]
- Zhang, J.; Yuan, Y.; Wang, Y.; Zhang, C.; Chen, Y.; Zhao, D. Thermodynamic performance analysis of reciprocating compressor based on suction valve independent operation model under capacity control conditions. Appl. Therm. Eng. 2025, 261, 125201. [Google Scholar] [CrossRef]
- Cui, W.; Fu, X.; Hong, X.; Wang, D.; Liu, D.; Cao, X. Review of suction valve capacity regulation technology in reciprocating compressor. Renew. Sustain. Energy Rev. 2025, 213, 115435. [Google Scholar] [CrossRef]
- Aldrini, J.; Chihi, I.; Sidhom, L. Fault diagnosis and self-healing for smart manufacturing: A review. J. Intell. Manuf. 2024, 35, 2441–2473. [Google Scholar] [CrossRef]
- Milojević, S.; Savić, S.; Mitrović, S.; Marić, D.; Krstić, B.; Stojanović, B.; Popović, V. Solving the Problem of Friction and Wear in Auxiliary Devices of Internal Combustion Engines on the Example of Reciprocating Air Compressor for Vehicles. Teh. Vjesn. 2023, 30, 122–130. [Google Scholar] [CrossRef]
- Hong, H.; Duanmu, J.; Ji, J.; Li, B.; Wang, Y. A self-healing control strategy based on an adaptive sliding mode under actuator fault conditions in a flow regulation system. J. Beijing Univ. Chem. Technol. Nat. Sci. Ed. 2022, 49, 77–84. [Google Scholar]
- Zhang, W.G.; Li, H.H.; Lin, Y.; Wang, W.; Wu, K.; Ma, Y. Fault diagnosis method of control system actuator based on EWT-DKELM. J. Mech. Electr. Eng. 2022, 39, 444–451. [Google Scholar]
- Wang, Y.; Zhang, J.J.; Zhou, C.; Jiang, Z.; Liu, W.; Sun, X. Research on self-healing control method for gas regulation failure in reciprocating compressor under valve fault condition. J. Mech. Eng. 2021, 57, 267–274. [Google Scholar]
- Liu, W.; Jiang, Z.; Wang, Y.; Zhou, C.; Sun, X.; Zhang, J. Performance Degradation Analysis and Optimization of the Stepless Capacity Regulation System for Reciprocating Compressors. Appl. Sci. 2020, 10, 704. [Google Scholar] [CrossRef]
- Taranović, D.; Ninković, D.; Davinić, A.; Pešić, R.; Glišović, J.; Milojević, S. Dinamika ventila stapnih kompresora za motorna vozila. Teh. Vjesn. 2017, 24, 313–319. [Google Scholar] [CrossRef]
- Alwi, H.; Edwards, C. Fault tolerant longitudinal aircraft control using non-linear integral sliding mode. IET Control. Theory Appl. 2014, 8, 1803–1814. [Google Scholar] [CrossRef]
- Sukhikh, N.N.; Kovalev, A.G.; Rukavishnikov, V.L. Prevention of mistakes, caused by human factor while using flight control systems tolerant to failures. Naučnyj Vestn. MGTU GA 2014, 206, 76–79. [Google Scholar]
- Marinković, A.; Stojanović, B.; Gachot, C.; Lazović, T. Analysis of Lubrication Regimes for Porous Sliding Bearing. Lubricants 2024, 12, 184. [Google Scholar] [CrossRef]


Disclaimer/Publisher’s Note: The statements, opinions and data contained in all publications are solely those of the individual author(s) and contributor(s) and not of MDPI and/or the editor(s). MDPI and/or the editor(s) disclaim responsibility for any injury to people or property resulting from any ideas, methods, instructions or products referred to in the content. |
© 2026 by the authors. Licensee MDPI, Basel, Switzerland. This article is an open access article distributed under the terms and conditions of the Creative Commons Attribution (CC BY) license.