Abstract
Zinc oxide (ZnO) nanostructures were synthesized via a hydrothermal method by systematically varying the reaction time (6–24 h) while maintaining all other parameters constant. The morphological evolution progressed from nanoparticles to nanoneedles, nanoflakes, and nanoplates with increasing reaction duration. X-ray diffraction and Raman spectroscopy confirmed the formation of hexagonal wurtzite ZnO for all samples, accompanied by a gradual shift in the preferred growth orientation from the c-axis to the a-axis. The optical characterization revealed a pronounced dependence of the band gap and the defect density on the synthesis time, with the nanoflakes obtained at 12 h exhibiting a narrowed band gap of 2.9 eV and an enhanced visible light absorption. The photocatalytic degradation of methylene blue followed zero-order kinetics, where the ZnO nanoflakes achieved the highest rate constant (k0 = 0.01893 min−1). The enhanced activity is attributed to the combined effects of a reduced band gap, an increased surface area, the coexistence of ZnO/Zn(OH)2 phases, and a defect-assisted charge separation.
1. Introduction
Zinc oxide (ZnO) is an n-type semiconductor with promising characteristics such as low cost, nontoxicity, thermal and chemical stability, a wide gap of 3.37 eV and a large exciton energy of 60 meV at room temperature, and biocompatibility [1]. Therefore, zinc oxide nanostructures are considered promising materials for multifunctional applications, including gas sensors, solar cells, energy storage, UV blocking, photocatalysis and biomedical applications [2,3,4,5,6,7]. A distinctive feature of ZnO nanostructures is their wide range of morphologies, allowing the adjustment of their physicochemical properties and, consequently, their potential applications [7,8]. As a result, researchers have synthesized ZnO nanostructures in diverse dimensions and morphologies, such as 0D nanoparticles and quantum dots [9], 1D nanowires and nanoneedles [10,11], 2D nanoflakes [12,13], and 3D nanoflowers [14].
A wide range of synthesis approaches have been developed to fabricate ZnO nanostructures with controlled shapes and dimensions. Environmentally benign synthesis routes for ZnO nanostructures often involve complex procedures and offer limited control over particle size and uniformity, affecting morphology and photocatalytic performance [15]. Physical techniques such as laser ablation, vapor deposition, and ultrasonic spray pyrolysis [16,17,18] can produce high-purity ZnO with well-defined crystallinity but are generally energy-intensive and equipment-demanding, making large-scale production less practical. In contrast, chemical methods, including precipitation, sol–gel, solvothermal, and particularly hydrothermal methods [19,20,21,22], offer greater flexibility, simplicity, and cost-effectiveness. Among these, the hydrothermal route has gained prominence owing to its low-temperature operation, scalability, high yield, and ability to tailor morphology through controlled growth kinetics [22]. Nevertheless, achieving reproducible and uniform morphologies remains challenging, as even minor variations in the precursor concentration, reaction temperature, time, or solution pH can markedly influence the nucleation and crystal-growth dynamics, thereby altering the final ZnO architecture. Thus, optimizing the hydrothermal conditions to achieve uniform and defect-engineered ZnO nanostructures remains a major challenge in tailoring their optical and photo-catalytic properties.
Several studies have examined the influence of specific synthesis variables on ZnO morphology. Li et al. [23] systematically investigated the effect of zinc precursors and different precipitants as hydroxide ion sources during hydrothermal synthesis, demonstrating that changes in the precipitant can transform the ZnO morphology from uniform particles to granular, sunflower-like, polyhedrons. In contrast, the absence of any precipitant led to the formation of lotus-like ZnO nanoflowers [14]. Alam et al. [24] emphasized the role of organic solvents, such as ethylene glycol and citric acid, in directing ZnO growth toward nanoparticles, nanoflowers, and nanospheres. Ejsmont et al. [25] reported that hydrothermal temperature (100–200 °C) and pH (7.5–13.5) strongly influence hydroxide diffusion and complexation, which must be precisely tuned to obtain the desired structures. Tong et al. [26] further showed that substrate seed layers and reaction time critically affect ZnO nanostructure growth behavior. Additionally, the influence of hydrothermal duration on ZnO/graphene oxide nanocomposites has been explored, revealing a time-dependent evolution of nanorod dimensions and aspect ratios [27].
Although the ZnO-based photocatalytic degradation of pollutants has been widely studied, investigations addressing the influence of particle shape on its performance remain limited [14,19,28]. However, a systematic correlation between the hydrothermal reaction time-induced morphology evolution and the photocatalytic performance of ZnO nanostructures remains insufficiently explored. Most existing studies either emphasize morphological control without directly linking it to photocatalytic mechanisms or assess photocatalytic activity without isolating the role of particle shape and defect evolution. Consequently, the mechanistic relationship between morphology-dependent charge separation, defect states, and photocatalytic efficiency is still not fully understood [14,19,28].
In this work, we systematically investigate the effect of the hydrothermal reaction time on the morphological evolution of ZnO nanostructures while keeping the synthesis temperature, zinc precursor, and precipitating agent constant. A comprehensive set of characterization techniques, including SEM, XRD, BET surface area analysis, Raman spectroscopy, XPS, UV–vis spectroscopy, and photoluminescence, was employed to elucidate the interrelationships between ZnO morphology, structural evolution, defect chemistry, optical properties, and photocatalytic performance. Methylene blue (MB, C16H18ClN3S) was used as a model hazardous organic contaminant to evaluate the photocatalytic degradation efficiency of the ZnO nanostructures with different morphologies in an aqueous solution.
2. Materials and Methods
2.1. Materials and Synthesis Processes
All chemicals employed in this study were of analytical grade and used without further purification. The hydrothermal synthesis approach was adopted, as it provides an efficient route to produce ZnO nanostructures from aqueous solutions under moderate temperature and pressure. To prepare ZnO nanostructures with different morphologies, a 0.05 M solution of zinc chloride (ZnCl2, Sigma-Aldrich, St. Louis, MO, USA) was first prepared by dissolving the required amount in 100 mL of deionized water under continuous stirring. Subsequently, 0.0028 M cetyltrimethylammonium bromide (CTAB, Sigma-Aldrich) was added as a surfactant and capping agent. Finally, a 0.075 M sodium hydroxide (NaOH, Sigma-Aldrich) solution was added dropwise to adjust the pH to approximately 11. The resulting mixture was transferred into a Teflon-lined stainless-steel autoclave (50 mL capacity) and heated at 120 °C for varying reaction times (5, 9, 12, and 24 h). By controlling the reaction time, ZnO nanostructures with different morphologies were obtained.
2.2. Characterization Techniques
The synthesized ZnO nanostructures were characterized using a range of analytical techniques. Morphological features were examined by scanning electron microscopy (SEM, Thermo Fisher Quanta FEG250, San Diego, CA, USA). The crystallographic structure was determined using X-ray diffraction (XRD, Rigaku, Tokyo, Japan, Cu Kα radiation, λ = 1.543 Å) over the 2θ range of 10–80° at a rate of 2θ min−1 and step size of 0.2°. Vibrational properties were investigated by micro-Raman spectroscopy (SENTERRA II, Bruker, Billerica, MA, USA) with a 532 nm excitation laser, spot size of 2 μm, spectral resolution of 5 cm−1, and laser power of 6.25 mW. The chemical composition and surface states were analyzed by X-ray photoelectron spectroscopy (XPS, Thermo Scientific, Waltham, MA, USA, Al Kα source). Thermo Avantage software (version 5.932) has been used to analyze and fit the high-resolution spectra. Optical properties were investigated using UV–vis absorption spectroscopy (UV-5200 spectrophotometer, Hitachi High-Tech, Mumbai, India) over the wavelength range of 280–1000 nm. The spectra were recorded in absorbance mode at room temperature using aqueous dispersions of the samples prepared in deionized (DI) water. Deionized water was employed as the background/reference for baseline correction prior to spectral acquisition. Photoluminescence (PL) spectra were recorded with a fluorescence spectrophotometer (PerkinElmer LS-55, Thane, India) under 350 nm excitation. The photocatalytic activity of the ZnO nanostructures was evaluated by monitoring the degradation of methylene blue dye under UV–vis light source (248–579 nm) with an 80 W high-pressure mercury lamp (HPML) from LD DIDACTIC (Huerth, Germany).
2.3. Photocatalysis Activity Set Up
A mercury lamp was positioned perpendicular to the reaction beaker. ZnO nanostructures were used at a concentration of 0.2 g/L. Accordingly, 12 mg of the catalyst was dispersed in 60 mL of a methylene blue (MB) dye solution (10 mg/L). The suspension was stirred in the dark for 30 min to establish adsorption–desorption equilibrium. Subsequently, the mixture was exposed to the mercury lamp under continuous stirring. A 5 mL sample was withdrawn using a 3 µm syringe needle every 20 min, beginning with the dark equilibrium sample (0 min). The absorbance of the MB solutions was then measured using a UV–visible spectrophotometer (UV5200, Metash Instruments, Shanghai, China).
3. Results and Discussion
3.1. Morphological Analysis
Figure 1 shows the evolution of ZnO nanostructures with hydrothermal reaction time (5 to 24 h), while other parameters, such as a reaction temperature 120 °C, were kept fixed. The morphology of the synthesized ZnO nanostructures exhibited a clear dependence on reaction time. At 5 h, the ZnO nanostructures resemble nanoparticles with sizes of 40–60 nm, that are highly agglomerated into irregular nanograins with dense porous clusters, characteristic of the early nucleation stage. After 9 h, the ZnO nanograins undergo partial aggregation and/or oriented attachment [29], leading to the emergence of short nano-needles with an average length ~100 nm. These structures exhibit rough surfaces, suggesting a high surface area and porosity (see Figure S1 and Table S1). Extending the reaction time to 12 h promotes preferential growth along the c-axis of the hexagonal crystal structure to reduce the surface energy [30]. As a result, the morphology evolves into two-dimensional (2D) nanoflakes with lateral dimensions of ~400–600 nm, indicating an improved crystallinity and the onset of directional growth. With a prolonged reaction time of 24 h, the nanostructures transformed into well-developed 3D nanoplates with typical lengths of ~200–400 nm. These nanoplates exhibit elongated, faceted shapes with relatively smooth surfaces, reflecting sustained anisotropic growth along specific crystallographic orientations.
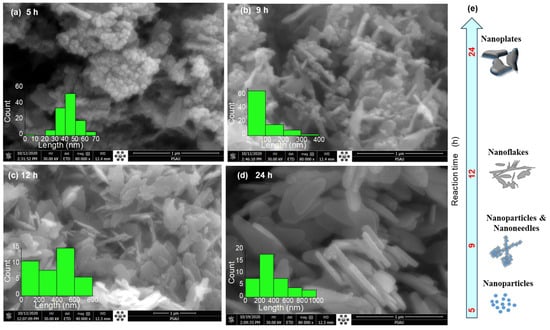
Figure 1.
FE-SEM images illustrate the morphological evolution of ZnO nanostructures with increasing reaction time: (a) 5 h, (b) 9 h, (c) 12 h, and (d) 24 h. Panel (e) schematically summarizes the corresponding growth mechanism and morphology transition.
This systematic morphological evolution can be explained by the balance between nucleation and growth processes. At the shorter reaction time of 5 h, rapid nucleation yields small crystallites with a high surface energy that readily agglomerate. As the reaction progresses, the oriented attachment [29] drives the dissolution of smaller crystallites into a nanoneedle shape. With the further extension of the reaction time, both the oriented attachment and Ostwald ripening promoted anisotropic crystal growth, preferentially favoring lateral growth, thereby giving rise to nanoflake and nanoplate morphologies with enhanced crystallinity and reduced porosity.
3.2. XRD Analysis
The phase and crystallinity of the synthesized ZnO nanostructures at various reaction times were investigated by X-ray diffraction and the results are plotted in Figure 2. The XRD patterns of the ZnO nanostructures exhibit peaks over the 2θ range from 25° to 75°. The peak intensity improved with the increase in reaction time and was assigned to the (100), (002), (101), (102), (110), (103), and (112) diffraction planes (card number 96-152-8231). These peaks indicate the dominance of the ZnO wurtzite hexagonal structure (P63mc) of the various synthesized morphologies [17]. Other tiny peaks assigned to Zn(OH)2 can be seen in the graph (card number 96-451-7838). The samples examined were identified as zincite ZnO according to the software Match (version 4). As inferred from Table 1, increasing the reaction time causes a small shift in the (101) position, particularly at 9 h (the nanorod morphology, implying possible changes in the ZnO lattice). The relative intensities of the (100) and (002) diffracted peaks reveal the preferential growth orientation of the ZnO crystallinities and provide insight into their morphology [31,32]. The (100) peak corresponds to crystallites oriented along the a-axis, whereas the (002) peak is associated with growth along the c-axis. The calculated intensity ratio I002/I100 inferred from Figure 2 was 1, 1, 0.92 and 0.73 for the reaction times of 5 h, 9 h, 12 h, and 24 h, respectively. The gradual decrease in this ratio with increasing reaction time indicates a shift in the preferential orientation toward the a-axis. This is consistent with the SEM images in Figure 1, which show ZnO nanoneedles, nanoflakes and nanoplates exhibiting lateral growth and extension along the a-axis. The sharp and intense (101) peak was used to estimate the crystallite size G using Scherrer’s formula: G = 0.9λ/β Cos θ, where λ is the X-ray wavelength, θ is diffraction angle and β is the full width at half-maximum (FWHM). The lattice constants a and c and the unit cell volume V were also calculated for a hexagonal system using , , and , respectively [17]. The results are listed in Table 1.
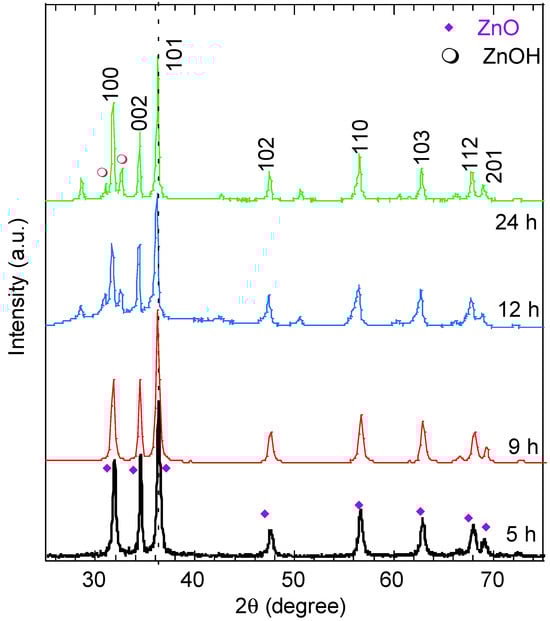
Figure 2.
XRD patterns of ZnO nanostructures with different morphologies synthesized at various reaction times.

Table 1.
XRD parameters of ZnO nanostructures with different morphologies.
As shown in Table 1, the crystallite size (G) of the ZnO nanostructures generally increases with hydrothermal time, rising from 44.06 nm at 5 h to 55.3 nm at 24 h, indicating progressive crystal growth with prolonged synthesis. A slight decrease in G at 9 h (41.85 nm) is observed for the nanoneedle morphology, which can be attributed to anisotropic growth rather than reduced crystallinity. The lattice parameters a and c remain nearly constant at shorter reaction times (5 and 9 h), reflecting the structural stability of the wurtzite ZnO phase. At 12 h, a small increase in the lattice parameters (a = 3.255 Å, c = 5.224 Å) and the unit cell volume (47.93 Å3) is observed, suggesting the development of transient lattice strain associated with the formation of nanoflake structures. With a further extension of the hydrothermal time to 24 h, a slight reduction in the c parameter and unit cell volume (47.85 Å3) occurs, indicating strain relaxation and improved crystallinity, consistent with the formation of well-defined ZnO nanoplates.
3.3. Vibrational Analysis
Figure 3 displays the representative Raman spectra of the ZnO nanostructures synthesized at various reaction times, measured with a 532 nm excitation at room temperature. All the spectra exhibit the characteristic E2 (high) mode at 437.5 ± 0.3 cm−1, confirming the hexagonal wurtzite structure across morphologies [33]. The E2 (high) mode is assigned to the oxygen atom vibration, and its symmetric/asymmetric shape is a fingerprint of the degree of crystallinity of the wurtzite ZnO nanostructures [33]. A broad or asymmetric peak indicates reduced crystallinity. Accordingly, the ZnO nanoparticle shows a broader E2 (high) compared with other examined ZnO morphologies, implying poorer crystallinity and increased grain-boundary disorder. The observed slight blueshift of the E2 (high) peak with increasing reaction time (inset of Figure 3) indicates relaxation toward tensile strain in the lattice. The A1 (TO) and A1 (LO) modes at ~384 cm−1 and 540 cm−1 become less pronounced for the nanoflakes and nanoplate-like samples, consistent with a preferential growth orientation along the a-axis in these morphologies [34]. The E1 (LO) mode at ~580.1 cm−1, commonly associated with structural disorder in ZnO [33], decreases in intensity as the reaction time increases, and it is strongest for the nanoparticle morphologies. The intensity of the E2 (high)–E2 (low) mode (at ~338 cm−1) decreased with the reaction time, which indicated a transition from preferential c-axis to a-axis growth orientation, which is consistent with [34].
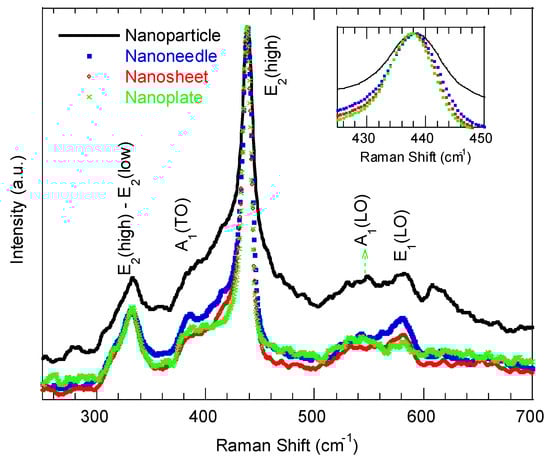
Figure 3.
Raman spectra of ZnO nanostructures with different morphologies synthesized at various reaction times.
3.4. XPS Analysis
Figure 4a presents the survey spectra of the ZnO nanostructures synthesized at different reaction times. The spectra exhibit prominent Zn and O peaks, confirming the chemical purity of the synthesized ZnO nanostructures. The XPS peaks corresponding to zinc are assigned to the Zn 3d, Zn 3p, Zn 3 s, Zn LMM (Auger), and Zn 2p peaks. The oxygen peak binding energy of 530 eV corresponds to O 1s in the wurtzite ZnO structure. A minor carbon C 1s peak at 285 eV indicates trace residuals of the surfactant CTAB [(C16H33)N(CH3)3] Br in the synthesized ZnO nanostructures. The elemental composition of the samples investigated is shown in the inset of Figure 4a.
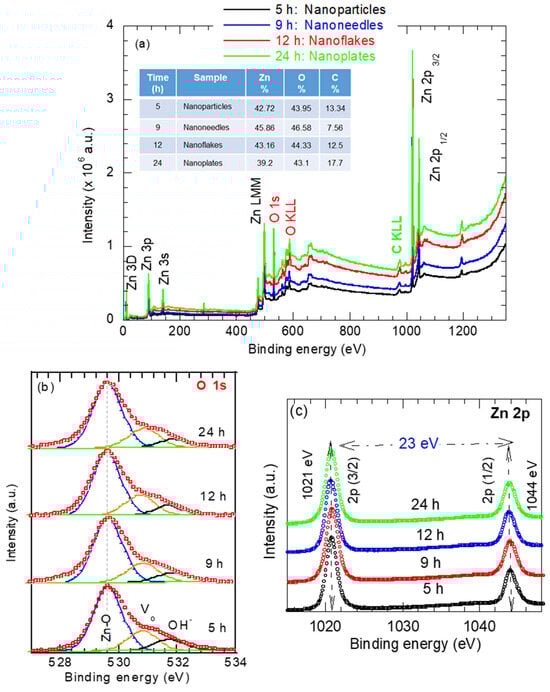
Figure 4.
(a) Survey spectra and high-resolution spectra for (b) Oxygen O 1s and (c) Zn 2p of various shapes of ZnO nanostructures synthesized at various reaction times.
High-resolution spectra of O 1s and Zn 2p were measured and deconvolved to determine the oxidation state, as shown in Figure 4b,c. In Figure 4b, regardless of the reaction time or the ZnO morphology, the O 1s spectrum can be resolved into three subpeaks. The peak at 530.1 eV corresponds to O2− ions bonded to Zn2+ in the wurtzite Zn–O lattice. The peak at 531.1eV is attributed to oxygen-deficient region or defects within the ZnO matrix [14]. The peak at 531.9 eV is assigned to interstitial oxygen (Oi), representing weakly bound surface oxygen species such as adsorbed OH− [14,35]. The relative area of the Zn–O subpeak reflects the proportion of fully oxidized oxygen atoms in Zn–O bonds, while the area assigned to Vo is related to the concentration of the oxygen vacancies (Vo). As is evident from Figure 4b, the Zn–O peak area increases with the reaction time, whereas the Vo component somehow remains unchanged and OH− component slightly decreases with the hydrothermal time. These results are consistent with the Raman data in Figure 3. This trend indicates improved crystallinity with increasing hydrothermal reaction time.
The high-resolution Zn 2p spectra of the ZnO samples with different morphologies (obtained at various synthesis times) shown in Figure 4c exhibit clear spin-orbit splitting, with the Zn 2p3/2 and Zn 2p1/2 peaks corresponding to Zn atoms occupying regular lattice sites in ZnO. The Zn 2p3/2 and Zn 2p1/2 peaks positioned at 1021 eV and 1044.0 eV, respectively, with a binding energy separation (ΔE) of 23 eV, is characteristic of ZnO [35]. The Zn 2p peak positions appear largely insensitive to changes in ZnO morphology, as seen as in Figure 4c, confirming that the Zn oxidation state in all samples remains Zn2+.
3.5. Optical and Photoluminescent Properties
Figure 5 presents the absorption spectra of the as-synthesized ZnO nanostructures with different morphologies. The ZnO nanoparticles exhibit narrow–strong absorption in the UV region (<400 nm) compared to other ZnO nanotruss morphologies. The absorption in the UV range is attributed to the intrinsic band-gap absorption of ZnO [36]. The narrow UV absorption reflects the narrow size distribution of the ZnO nanoparticles, as inferred from Figure 1a. As the synthesis time increased >5 h, the UV absorption decreased; however, the visible component of the absorption spectrum increased with the order 12 h >> 9 h >> 24 h. The improved visible absorption is probably associated with the complex ZnO morphology at higher synthesis times. The absorption peak for the ZnO nanoparticles was observed at 362 nm and red-shifted to 370 nm, 373 nm, 374 nm and 367 nm as the hydrothermal synthesis time increased.
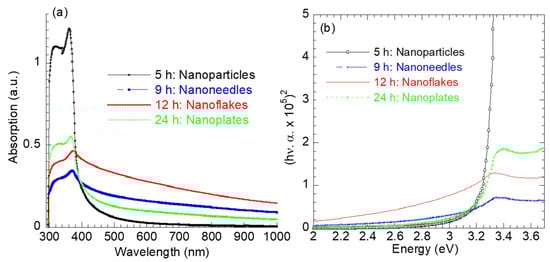
Figure 5.
(a) UV–visible optical absorption spectra and (b) plots of (hν.α)2 versus hν for ZnO nanostructures.
Tauc’s relation [36], , has been used to evaluate the optical band gap energy (Eg) of ZnO nanostructures with various morphologies, where n = 2 for a direct transition and the Eg values are determined by extrapolating the linear portion of (hν.α)2 to the energy axis hν = 0. The calculated Eg values were 3.28 eV, 3.10 eV, 2.90 eV, and 3.14 eV for the ZnO nanoparticles (5 h), nanoneedles (9 h), nanoflakes (12 h), and nanoplates (24 h), respectively. The decrease in the optical band gap (Eg) with increasing hydrothermal reaction time up to 12 h reflects the evolution of more complex ZnO morphologies, accompanied by an increase in crystallite size (Table 1) and defect density. The presence of these defects introduces localized electronic states within the band gap, promoting sub-bandgap optical transitions and resulting in a reduced apparent Eg. Upon further extending the reaction time to 24 h, a slight increase in Eg is observed for the nanoplate morphology, which can be attributed to enhanced crystallinity and partial defect annihilation as the system approaches a more thermodynamically stable state. Moreover, the XRD analysis confirms the coexistence of ZnO and Zn(OH)2 phases in the 12 and 24 h samples. The Zn(OH)2 phase and associated surface hydroxyl groups (Figure 4b) contribute additional defect-related states and surface band bending effects, further influencing the optical band gap behavior. The enhanced light absorption in the visible region for the nanoflakes (Eg = 2.9 eV) suggests their superior potential for solar-driven photocatalysis and optoelectronic applications.
Figure 6 presents the room temperature photoluminescence (PL) spectra of the ZnO nanostructures synthesized at different hydrothermal reaction times, measured using a 350 nm excitation wavelength. All of the samples exhibit two main bands: a strong near-band-edge (NBE) emission in the UV region at ~378 nm, corresponding to excitonic recombination in the wurtzite ZnO lattice, and a broad visible emission band ranging from 500–650 nm (green–yellow region). The latter is commonly attributed to deep-level defect-related emissions, including oxygen vacancies (Vo), interstitial oxygen (Oi), and interstitial zinc (Zni) [37]. The presence of structure disorder and oxygen vacancies is further corroborated by the Raman E1 (LO) mode and the XPS analysis (Figure 4b). It should be noted, however, that the precise origin of the visible luminescence in ZnO remains a subject of ongoing debate [38]. The intensity ratio of visible to UV emission (IVis/IUV) provides a qualitative indication of defect concentration and microstructure disorder [39]. This ratio was calculated as 0.395 for the ZnO nanoparticles morphology (5 h) and decreased to 0.298 and 0.296 for the nano-needles (9 h) and nanoflake (12 h) morphology, respectively, before increasing to 0.457 for the nanoplate structure (24 h). The relatively high IVis/IUV ratio for the nanoflakes (12 h) reflects the highest density of surface states and micro-structural strain, consistent with their large surface-to-volume ratio and defect-mediated band gap narrowing (2.9 eV) microstructural disorder at intermediate growth durations. In contrast, prolonged reaction time (24 h) leads to improved crystallinity and defect passivation, as evidenced by the enhancement of the NBE emission and the suppression of visible luminescence. These observations demonstrate that the hydrothermal growth duration strongly influences the interplay between crystallization and defect generation: shorter reaction times yield defect-rich nanoparticles, intermediate durations favor defect-dense nanoflakes, and extended durations produce well-crystalized nanoplates with reduced related defects and lower macrostrain.
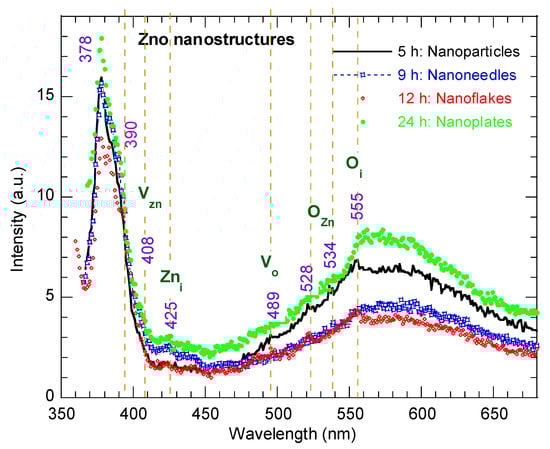
Figure 6.
PL spectra of ZnO nanostructures with different morphologies synthesized at various reaction times.
3.6. Photocatalysis Activity
Figure 7a–e shows the UV–visible absorption of methylene blue (MB) under the illumination of light (λ = 380–560 nm) without (Figure 7a) and with ZnO nanostructures of different morphologies (Figure 7b–e). Figure 7f shows the rate of photodegradation for the various ZnO morphologies, where and are the MB absorption after 0 min and time t exposures, respectively. In general, MB has a characteristic absorption band at 664–668 nm that arises from its monomeric form in aqueous solution and is responsible for its deep blue color. Hence, the reduction of this band intensity is considered the mark of MB degradation in the photocatalyst literature. As seen in Figure 7a, the MB solution exhibits negligible degradation under UV–vis light alone, confirming that photolysis is minimal within the studied duration. In contrast, the presence of ZnO nanostructures markedly enhances the degradation rate, with efficiency strongly dependent on morphology.
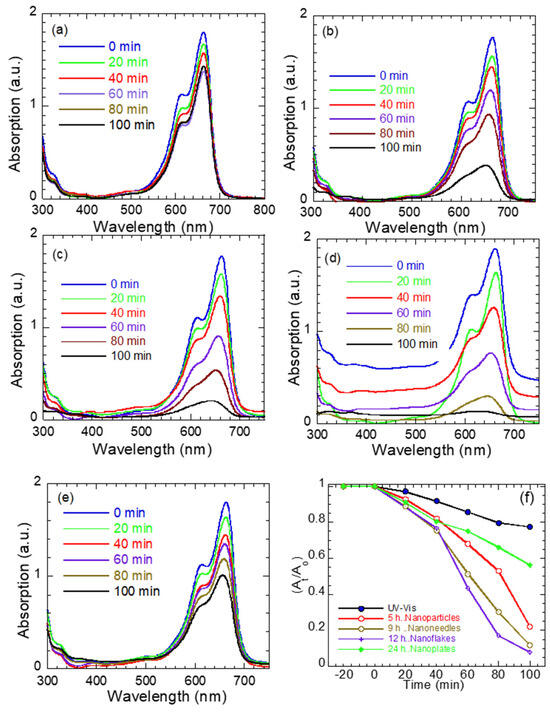
Figure 7.
UV–vis absorption spectra of MB dye: photolysis of MB alone (a) and in the presence of ZnO (b) nanoparticles, (c) nanoneedles, (d) nanoflakes, and (e) nanoplates as function of exposure time, and (f) rate of photodegradation (At/Ao) for ZnO nanostructures in MB solution as a function of exposure time.
ZnO nanoparticles (Figure 7b) display limited activity owing to their wide band gap (3.28 eV), which restricts photoexcitation under the lamp’s spectral range. The ZnO nanoneedles (Figure 7c) show improved degradation, attributed to their narrower band gap (3.10 eV), anisotropic geometry, high aspect ratio, and porous surface (see Figure 1b), which facilitate charge separation. A pronounced enhancement is observed for the ZnO nanoflakes (Figure 7d), which exhibit almost complete MB degradation within 100 min. Their high photocatalytic performance arises from the synergistic effect of a reduced band gap (2.90 eV), an extensive surface area/aspect ratio [40], and a high density of surface defects and strain, as indicated by the elevated ratio. These features promote visible light absorption and defect-mediated charge trapping, leading to prolonged carrier lifetimes and enhanced redox activity. The ZnO nanoplates (Figure 7e) accelerate MB degradation to a lesser extent compared to the other ZnO morphologies, probably due to their smooth surface, improved crystallinity/less defects and slightly higher band gap (3.14 eV).
The degradation mechanism of methylene blue (MB) in the presence ZnO nanostructures under UV–vis illumination has been described previously [14] and is illustrated in Figure 8a. When ZnO is irradiated with photons of energy hν ≥ Eg, the photoexcitation generates electron (e−)–hole (h+) pairs that are simultaneously moved to the ZnO surfaces. The electrons reduce adsorbed O2 molecules to form super-oxide anions (). Simultaneously, the hole oxidizes surface hydroxide ions () to produce hydroxyl radicals () [41]. The resulting species can further react with protons to generate additional radicals. These highly reactive hydroxyl radicals subsequently attack and decompose MB molecules, leading to their decolorization.
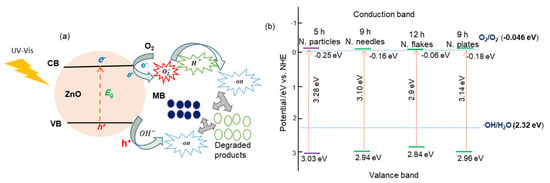
Figure 8.
(a) Photocatalytic degradation mechanism of MB on ZnO nanostructures and (b) corresponding band-structure schematics for different morphologies.
The positions of the valence band (VB) and the conduction band (CB) were determined using the relations and [42]. Here, Ec = 4.5 eV and χ = 5.89 eV for ZnO. Figure 8b shows the position diagrams of CB and VB for various ZnO nanostructure morphologies on the NHE scale. Irrespective of the ZnO morphology, holes in the VB with a potential greater than 2.32 can generate hydroxyl radicals (). Similarly, the CB position is more negative than the O2/O2− redox potential, i.e., electrons easily interact with O2 [43].
Photodegradation Kinetics
The degradation kinetics of MB dye using ZnO nanostructures with different morphologies (nanoparticles, nanoneedles, nanoflakes, and nanoplates) were analyzed using zero-order, pseudo-first, and pseudo-second-order models [44]: At = Ao − kot, , , where ko, k1 and k2 are the corresponding rate constants and Ao and At denote MB absorbance at time 0 and time t. The linear fits of At, Ln (Ao/At) and 1/At versus time (Figure S2) revealed that all the samples followed zero-order kinetics, with the correlation coefficients (R2 = 0.92 to 0.99) confirming that the degradation rate depends mainly on photocatalyst surface reactions rather than on the dye concentration [45]. The rate constant ko was 0.01297, 0.01629, 0.01893, and 0.00767 min−1 for the ZnO nanoparticles, nanoneedles, nanoflakes, and nanoplates, respectively. Despite the nanoplates showing the highest linearity (R2~0.9945), their smaller ko and moderate degradation rate (56%) reveal a lower intrinsic photocatalytic activity compared to the other morphologies. In contrast, the ZnO nanoflakes exhibited the largest rate constant (0.01893 min−1) and the highest degradation (~83%) within the same reaction period, followed by nanoneedles, nanoparticles, and nanoplates.
The superior activity of the nanoflakes arises from their thinness, the presence of impurities such as Zn(OH)2, and their layered geometry, providing abundant edge defects and a larger surface area, thereby enhancing photon absorption and charge separation [46]. Conversely, the smoother, highly crystalline nanoplates promote faster charge recombination and reduced dye adsorption. Hence, while all the morphologies fit the zero-order model, the magnitude of k0 rather than the linearity reflects their actual photocatalytic performance.
4. Conclusions
A series of ZnO nanostructures were synthesized via a hydrothermal method by varying the reaction time while keeping all other conditions constant. Their morphological, structural, vibrational, and oxidation states, as well as their photoluminescence and optical properties were investigated. An SEM analysis revealed a morphological evolution from nanoparticles to nanoneedles, nanoflakes, and eventually nanoplates as the reaction time increased to 24 h. Prolonged hydrothermal treatment promoted crystal growth and improved structural ordering, while intermediate morphologies exhibited transient lattice strain and defect formation associated with anisotropic growth. The Raman spectra confirmed the relaxation of lattice strain and enhanced crystallinity with longer reaction times, indicating a transition from c-axis- to a-axis-oriented growth. The XPS analysis verified the presence of Zn2+ in a stable wurtzite structure, while the longer hydrothermal treatments enhanced the oxidation completeness and minimized the surface defects. The morphological evolution strongly influenced the optical band structure and defect-related emissions, with nanoflakes (12 h) exhibiting optimal visible light absorption, moderate defect density, and superior photocatalytic activity under UV–vis irradiation. These results demonstrate that the interplay between surface geometry and defect chemistry governs charge transport and dye degradation efficiency in ZnO nanostructures.
Supplementary Materials
The following supporting information can be downloaded at: https://www.mdpi.com/article/10.3390/app16031408/s1, Figure S1: Nitrogen adsorption–desorption isotherms of ZnO nanostructures showing morphology evolution with hydrothermal reaction time; Table S1: Textural properties of ZnO nanostructures are synthesized at different hydrothermal reaction times; Figure S2: The plots of (a) At, (b) ln (Ao/At), and (c) (1/At) versus time along with their linear fits for MB dye in presence of ZnO nanostructures with various morphologies as photocatalysts.
Author Contributions
Conceptualization, E.M.A.-F.; methodology, S.M.A. and E.M.A.-F.; formal analysis, E.M.A.-F. and S.M.A.; investigation, E.M.A.-F.; resources, writing—original draft preparation, writing—review and editing, E.M.A.-F.; supervision, E.M.A.-F. All authors have read and agreed to the published version of the manuscript.
Funding
This research was funded by Prince Sattam bin Abdulaziz University, project number (PSAU/2025/01/35129).
Institutional Review Board Statement
Not applicable.
Informed Consent Statement
Not applicable.
Data Availability Statement
The authors confirm that the data supporting the findings of this study are available within the article.
Acknowledgments
The authors extend their appreciation to Prince Sattam bin Abdulaziz University for funding this research work through project number (PSAU/2025/01/35129).
Conflicts of Interest
The authors declare no conflicts of interest.
References
- Raha, S.; Ahmaruzzaman, M. ZnO nanostructured materials and their potential applications: Progress, challenges and perspectives. Nanoscale Adv. 2022, 4, 1868–1925. [Google Scholar] [CrossRef]
- Kang, Y.; Yu, F.; Zhang, L.; Wang, W.; Chen, L.; Li, Y. Review of ZnO-based nanomaterials in gas sensors. Solid State Ion. 2021, 360, 115544. [Google Scholar] [CrossRef]
- Wibowo, A.; Marsudi, M.A.; Amal, M.I.; Ananda, M.B.; Stephanie, R.; Ardy, H.; Diguna, L.J. ZnO nanostructured materials for emerging solar cell applications. RSC Adv. 2020, 10, 42838–42859. [Google Scholar] [CrossRef]
- Kumar, R.D.; Nagarani, S.; Balachandran, S.; Brundha, C.; Kumar, S.H.; Manigandan, R.; Kumar, M.; Sethuraman, V.; Kim, S.H. High performing hexagonal-shaped ZnO nanopowder for Pseudo-supercapacitors applications. Surf. Interfaces 2022, 33, 102203. [Google Scholar] [CrossRef]
- Mao, Z.; Shi, Q.; Zhang, L.; Cao, H. The formation and UV-blocking property of needle-shaped ZnO nanorod on cotton fabric. Thin Solid Film. 2009, 517, 2681–2686. [Google Scholar] [CrossRef]
- Abdel-Fattah, E. Plasmonic ZnO-Au Nanocomposites: A Synergistic Approach to Enhanced Photocatalytic Activity through Nonthermal Plasma-Assisted Synthesis. Crystals 2024, 14, 890. [Google Scholar] [CrossRef]
- Serrano-Lázaro, A.; Portillo-Cortez, K.; de la Mora Mojica, M.B.; Durán-Álvarez, J.C. A Review on ZnO Nanostructures for Optical Biosensors: Morphology, Immobilization Strategies, and Biomedical Applications. Nanomaterials 2025, 15, 1627. [Google Scholar] [CrossRef]
- Sulciute, A.; Nishimura, K.; Gilshtein, E.; Cesano, F.; Viscardi, G.; Nasibulin, A.G.; Ohno, Y.; Rackauska, S. ZnO Nanostructures Application in Electrochemistry: Influence of Morphology. J. Phys. Chem. C 2021, 125, 1472–1482. [Google Scholar] [CrossRef]
- Chen, X.; Wang, Q.; Wang, X.-J.; Li, J.; Xu, G.-B. Synthesis and performance of ZnO quantum dots water-based fluorescent ink for anti-counterfeiting applications. Sci. Rep. 2021, 11, 5841. [Google Scholar] [CrossRef]
- Katwal, G.; Maggie Paulose, M.; Rusakova, I.A.; Martinez, J.E.; Varghese, O.K. Rapid Growth of Zinc Oxide Nanotube–Nanowire Hybrid Architectures and Their Use in Breast Cancer-Related Volatile Organics Detection. Nano Lett. 2016, 16, 3014–3021. [Google Scholar] [CrossRef]
- Dalvand, R.; Mahmud, S.; Alimanesh, M.; Vakili, A.H. Optical and structural properties of well-aligned ZnO nanoneedle arrays grown on porous silicon substrates by electric field-assisted aqueous solution method. Ceram. Int. 2017, 43, 1488–1494. [Google Scholar] [CrossRef]
- Sahu, K.; Choudhary, S.; Singh, J.; Kuriakose, S.; Singhal, R.; Mohapatra, S. Facile wet chemical synthesis of ZnO nanosheets: Effects of counter ions on the morphological, structural, optical and photocatalytic properties. Ceram. Int. 2018, 44, 23094–23101. [Google Scholar] [CrossRef]
- Kumar, M.P.; Kumaresan, N.; Mangalaraja, R.V.; Zaporotskova, I.; Arulraj, A.; Murugadoss, G.; Pugazhendhi, A. Zinc oxide nanoflakes supported copper oxide nanosheets as a bifunctional electrocatalyst for OER and HER in an alkaline medium. Environ. Res. 2024, 252, 119030. [Google Scholar] [CrossRef] [PubMed]
- Abdel-Fattah, E.M.; Alshehri, S.M.; Alotibi, S.; Alyami, M.; Abdelhameed, D. Hydrothermal Synthesis of ZnO Nanoflowers: Exploring the Relationship between Morphology, Defects, and Photocatalytic Activity. Crystals 2024, 14, 892. [Google Scholar] [CrossRef]
- Jingzhuo Tian, J.; Guan, C.; Hu, H.; Liu, E.; Yang, D. Waste plastics promoted photocatalytic H2 evolution over S-scheme NiCr2O4/twinned-Cd0.5Zn0.5S homo-heterojunction. Acta Phys.-Chim. Sin. 2025, 41, 100068. [Google Scholar] [CrossRef]
- Sico, G.; Guarino, V.; Borriello, C.; Montanino, M. Studies on Morphological Evolution of Gravure-Printed ZnO Thin Films Induced by Low-Temperature Vapor Post-Treatment. Nanomaterials 2024, 14, 2006. [Google Scholar] [CrossRef]
- Abdel-Fattah, E.; Elsayed, I.A.; Fahmy, T. Substrate temperature and laser fluence effects on properties of ZnO thin films deposited by pulsed laser deposition. J. Mater. Sci. Mater. Electron. 2018, 29, 19942–19950. [Google Scholar] [CrossRef]
- Emil, E.; Alkan, G.; Gurmen, S.; Rudolf, R.; Darja Jenko, D.; Friedrich, B. Turning the Morphology of ZnO Nanostructures with the Ultrasonic Spray Pyrolysis Process. Metals 2018, 8, 569. [Google Scholar] [CrossRef]
- Chibac-Scutaru, A.-L.; Podasca, V.-E.; Dascalu, I.-O.; Rusu, D.; Melinte, V. ZnO nanostructures with controlled morphological and optical properties for applications as efficient photocatalyst for malachite green degradation. Ceram. Int. 2024, 50, 34291–34303. [Google Scholar] [CrossRef]
- Xu, L.; Hu, Y.-L.; Pelligra, C.; Chen, C.-H.; Jin, L.; Huang, H.; Sithambaram, S.; Aindow, M.; Joesten, R.; Suib, S.L. ZnO with Different Morphologies Synthesized by Solvothermal Methods for Enhanced Photocatalytic Activity. Chem. Mater. 2009, 21, 2875–2885. [Google Scholar] [CrossRef]
- Farhadi-Khouzani, M.; Fereshteh, Z.; Loghman-Estarki, M.R.; Razavi, R.S. Different morphologies of ZnO nanostructures via polymeric complex sol–gel method: Synthesis and characterization. J. Sol-Gel Sci. Technol. 2012, 64, 193–199. [Google Scholar] [CrossRef]
- Do Nascimento, J.L.A.; Chantelle, L.; dos Santos, I.M.G.; Menezes de Oliveira, A.L.; Alves, M.C.F. The Influence of Synthesis Methods and Experimental Conditions on the Photocatalytic Properties of SnO2: A Review. Catalysts 2022, 12, 428. [Google Scholar] [CrossRef]
- Li, X.; Zhang, F.; Ma, C.; Deng, Y.; Wang, Z.; Elingarami, S.; He, N. Controllable synthesis of ZnO with various morphologies by hydrothermal method. J. Nanosci. Nanotechnol. 2012, 12, 2028–2036. [Google Scholar] [CrossRef] [PubMed]
- Alam, M.K.; Hossain, M.S.; Akash, M.H.; Al Miad, A.; Bashar, M.S.; Bahadur, N.M.; Ahmed, S. Morphological change of ZnO using hydrothermal technique and organic modifiers. Nano-Struct. Nano-Objects 2025, 41, 101436. [Google Scholar] [CrossRef]
- Ejsmont, A.; Goscianska, J. Hydrothermal Synthesis of ZnO Superstructures with Controlled Morphology via Temperature and pH Optimization. Materials 2023, 16, 1641. [Google Scholar] [CrossRef]
- Tong, Y.; Yichun Liu, Y.; Dong, L.; Zhao, D.; Zhang, J.; Lu, Y.; Shen, D.; Fan, X. Growth of ZnO Nanostructures with Different Morphologies by Using Hydrothermal Technique. J. Phys. Chem. B 2006, 110, 20263–20267. [Google Scholar] [CrossRef]
- Khai, T.V.; Long, L.N.; Khoi, N.H.T.; Hoc Thang, N. Effects of Hydrothermal Reaction Time on the Structure and Optical Properties of ZnO/Graphene Oxide Nanocomposites. Crystals 2022, 12, 1825. [Google Scholar] [CrossRef]
- Thakur, S.; Neogi, S.; Ray, A.K. Morphology-Controlled Synthesis of ZnO Nanostructures for Caffeine Degradation and Escherichia coli Inactivation in Water. Catalysts 2021, 11, 63. [Google Scholar] [CrossRef]
- Penn, R.L.; Banfield, J.F. Imperfect oriented attachment: Dislocation generation in defect-free nanocrystals. Science 1998, 281, 969–971. [Google Scholar] [CrossRef]
- Sun, Y.; Wang, L.; Yua, X.; Chen, K. Facile synthesis of flower-like 3D ZnO superstructures via solution route. CrystEngComm 2012, 14, 3199–3204. [Google Scholar] [CrossRef]
- Pung, S.Y.; Choy, K.L.; Hou, X.; Shan, C. Preferential Growth of ZnO Thin Films by the Atomic Layer Deposition Technique. Nanotechnology 2008, 19, 435609. [Google Scholar] [CrossRef]
- Mishra, S.; Przezdziecka, E.; Wozniak, W.; Adhikari, A.; Jakiela, R.; Paszkowicz, W.; Sulich, A.; Ozga, M.; Kopalko, K.; Guziewicz, E. Structural Properties of Thin Zno Films Deposited by Ald under ORich and Zn-Rich Growth Conditions and Their Relationship with Electrical Parameters. Materials 2021, 14, 4048. [Google Scholar] [CrossRef] [PubMed]
- Zehira, B.; Mermoul, M.; Hamana, D. Role of Mn Doping in Improving the Hydrophobic Property of ZnO Coating on Aluminum Substrate. Acta Phys. Pol. Ser. A 2024, 145, 301–309. [Google Scholar] [CrossRef]
- Xin Zhong, X.; Anselm Loges, A.; Roddatis, V.; John, T. Measurement of crystallographic orientation of quartz crystal using Raman spectroscopy: Application to entrapped inclusions. Contrib. Mineral. Petrol. 2021, 176, 89. [Google Scholar] [CrossRef]
- Sahai, A.; Goswamin, N. Probing the dominance of interstitial oxygen defects in ZnO nanoparticles through structural and optical characterizations. Ceram. Int. 2014, 40, 14569–14578. [Google Scholar] [CrossRef]
- Abdel-Fattah, E.; Alotibi, S. Synergistic effect of nonthermal plasma and ZnO nanoparticles on organic dye degradation. Appl. Sci. 2023, 13, 10045. [Google Scholar] [CrossRef]
- Goswami, N.; Sharma, D.K. Structural and optical properties of unannealed and annealed ZnO nanoparticles prepared by a chemical precipitation technique. Phys. E 2010, 42, 1675–1682. [Google Scholar] [CrossRef]
- Li, D.; Leung, Y.H.; Djurisic, A.B.; Liu, Z.T.; Xie, M.H.; Shi, S.L.; Xu, S.J.; Chan, W.K. Different origins of visible luminescence in ZnO nanostructures fabricated by the chemical and evaporation methods. Appl. Phys. Lett. 2004, 85, 1601–1603. [Google Scholar] [CrossRef]
- Shakti, N.; Prakash, A.; Mandal, T.; Katiyar, M. Processing temperature dependent morphological and optical properties of ZnO nanorods. Mater. Sci. Semicond. Process. 2014, 20, 55–60. [Google Scholar] [CrossRef]
- Zhang, X.; Qin, J.; Xue, Y.; Yu, P.; Zhang, B.; Wang, L.; Liu, R. Effect of aspect ratio and surface defects on the photocatalytic activity of ZnO nanorods. Sci. Rep. 2014, 4, 4596. [Google Scholar] [CrossRef]
- Legrini, O.; Oliveros, E.; Braun, A.M. Photochemical processes for water treatment. Chem. Rev. 1993, 93, 671–698. [Google Scholar] [CrossRef]
- Xu, Y.; Schoonen, M.A.A. The Absolute Energy Positions of Conduction and Valence Bands of Selected Semiconducting Minerals. Am. Mineral. 2000, 85, 543–556. [Google Scholar] [CrossRef]
- Alves do Nascimento, J.L.; Rostas, A.M.; Silva, A.; Kennedy, B.J.; Barbu-Tudoran, L.; Bocirnea, A.E.; Garcia dos Santos, I.M.; Alves, M.C.F.; Menezes de Oliveira, A.L. Tailoring Structural Distortions and Ionic Defects as Alternative Strategy to Modulate Reactive Oxygen Species and Photocatalytic Activity in SnO2 Nanoparticles. Chem. Mater. 2025, 37, 4963–4981. [Google Scholar] [CrossRef]
- Ozer, L.Y.; Garlisi, C.; Oladipo, H.; Pagliaro, M.; Sharief, S.A.; Yusuf, A.; Almheiri, S.; Palmisano, G. Inorganic semiconductors graphene composites in photo(electro)catalysis: Synthetic strategies, interaction mechanisms and applications. J. Photochem. Photobiol. C Photochem. Rev. 2017, 33, 132–164. [Google Scholar] [CrossRef]
- Hoffmann, M.R.; Martin, S.T.; Choi, W.; Bahnemann, D.W. Environmental Applications of Semiconductor Photocatalysis. Chem. Rev. 1995, 95, 69–96. [Google Scholar] [CrossRef]
- Zhang, N.; Ciriminna, R.; Pagliaro, M.; Xu, Y.J. Nano chemistry-derived Bi2WO6 nanostructures: Towards production of sustainable chemicals and fuels induced by visible light. Chem. Soc. Rev. 2014, 43, 5276–5287. [Google Scholar] [CrossRef]


Disclaimer/Publisher’s Note: The statements, opinions and data contained in all publications are solely those of the individual author(s) and contributor(s) and not of MDPI and/or the editor(s). MDPI and/or the editor(s) disclaim responsibility for any injury to people or property resulting from any ideas, methods, instructions or products referred to in the content. |
© 2026 by the authors. Licensee MDPI, Basel, Switzerland. This article is an open access article distributed under the terms and conditions of the Creative Commons Attribution (CC BY) license.