Abstract
The growing dominance of low-cost carriers (LCCs) in global air transport has intensified the need for airport terminal facilities that reflect their simplified, efficiency-driven operating principles. Traditional Level of Service (LOS) standards, based on International Air Transport Association’s Airport Development Reference Manual (IATA ADRM), were primarily designed for traditional air carriers or full-service network carriers (FSNCs) and may lead to over-dimensioned or misaligned airport terminal facilities when applied to airports with dominance of LCCs. This study presents the first newly developed computational tool called Airport Terminal Facilities Software (ATFS) as a methodological and conceptual advance in airport terminal planning, that integrates LOS guidelines differentiated by airline business models. The methodology integrates spatial–temporal LOS parameters, specific facility capacity formulas, and peak-hour demand calculations of airport terminal facilities. Results from the case study conducted at Pula Airport show substantial differences between IATA and LCC LOS outcomes, i.e., applying LCC LOS guidelines can significantly reduce required areas for the several airport terminal facilities. Findings confirm that new LCC LOS guidelines and the ATFS tool can optimize airport terminal facilities, reduce or reconfigure excessive or empty space, and improve passenger flow efficiency at LCC-dominant airports.
1. Introduction
Over the past several decades, the rapid evolution of Low-Cost Carriers (LCCs) has reshaped the global air transport system, prompting airports to reconsider how terminal infrastructure can effectively support this increasingly dominant airline business model. Unlike traditional air carriers, i.e., Full-Service Network Carriers (FSNCs) or Full-Service Carriers (FSCs), whose operations rely on hub-and-spoke networks, fast aircraft turnarounds, and diversified service portfolios, LCCs strive for simplified, high-efficiency processes and cost reductions. These strategic differences have significantly influenced airport terminal design priorities, especially in Europe, where the expansion of LCCs accelerated the development of secondary airports and Low-Cost Terminal (LCT) concepts. As LCCs now represent approximately one-third of global air travel, understanding how airport terminals can be optimized for their operational needs has become even more essential.
Existing research offers an extensive knowledge of passenger terminal planning, Level of Service (LOS) standards, and the performance of airport terminal facilities. Early airport terminal design models emphasized throughput, comfort, and processing capacity as central dimensions of airport competitiveness. Over time, frameworks such as the International Air Transport Association’s Airport Development Reference Manual (IATA ADRM) formalized LOS metrics that evaluate space per passenger, maximum waiting times, and levels of service. However, these standards largely reflect the operational requirements of FSC passengers. This has prompted the discussion regarding their suitability for LCC-dominated airport terminals, where passengers often prioritize lower prices over premium comfort and where airlines require fast aircraft turnaround processes. It becomes questionable whether current LOS standards, particularly those related to space utilization, queuing tolerance, and processing time, are applicable to LCC environments. Consequently, it has been concluded that specific LOS frameworks should be implemented according to specific airline business models.
Numerous research has examined various airport terminal facilities individually, including traditional check-in, self-service kiosks, security control, boarding-pass control, gate holdrooms, and baggage reclaim. Studies highlight numerous factors influencing airport terminal facilities’ performance such as passenger arrival distributions, walking speeds and distances, staffing levels, technological adoption, baggage processing patterns, and spatial layout. Simulation-based analyses and optimization models developed in the 1990s and 2000s further emphasized the complex interdependencies among airport terminal facilities. Yet despite these advances, a persistent gap remains, i.e., standardized LOS recommendations do not differentiate between LCC and FSC or other passenger profiles, even though expectations, behavior, and processing needs are significantly different. This gap is particularly important for airports dominated by LCC passengers, where applying FSC-oriented LOS guidelines may lead to unnecessary or misaligned operational or infrastructural investments.
In response to these challenges, recent research has introduced newly developed LOS guidelines specifically designed for LCC operations, incorporating revised spatial–temporal parameters. Building on these foundations, the present study develops the Airport Terminal Facilities Software (ATFS), a comprehensive computational tool designed to evaluate existing airport terminal facilities’ performance and support the planning and optimization of future facility requirements. Using both IATA LOS and newly established LCC LOS guidelines, the ATFS assesses each airport terminal facility and determines its LOS.
This methodology constitutes a functional innovation, as it combines regulatory guidelines (provided by IATA ADRM), newly developed LCC LOS guidelines, and their implementation on a unified computational platform, i.e., ATFS. This integration allows, for the first time, the simultaneous evaluation of spatial over-provisioning and under-provisioning by considering LCC passenger behavior, which has direct implications for airport capital expenditures and operating expenses. The case study conducted at Pula Airport demonstrates how ATFS can guide data-driven decision-making, enabling airports to align capacity of airport terminal facilities with specific LCC requirements.
2. Literature Overview
The evolution of LCCs and their airport terminal requirements has closely followed major transformations in the global and European air transport sector. Early research on airline business models highlights that LCCs emerged through a fundamentally different operational philosophy from traditional air carriers (FSCs), emphasizing minimized costs and simplified services [1].
Various research throughout the 1990s and early 2000s analyzed the operational principles of LCCs, noting their reliance on homogeneous fleets, high aircraft utilization, dense seating, limited service options, and strong preference for operating at secondary airports with low aeronautical charges [2,3]. These airport choices inherently shaped required terminal infrastructure, i.e., facilities needed to support fast turnarounds, minimal processing time, and basic passenger amenities. To qualify as an LCC, an airline typically adhered to several criteria, including point-to-point networks, single-type fleets, one-way fares, and limited service [4]. Their operational adaptability, streamlined staffing, and avoidance of complex partnerships further reinforced the demand for simple and efficient airport terminal facilities [5].
As LCCs increased their market share, i.e., today representing roughly one-third of global air travel. The technological, economic, and demographic growth of the LCC market continues to shape airport terminal design, with forecasts predicting substantial expansion driven by changing consumer preferences, secondary airport development, and digitalization [6,7]. This shift directly motivated research of LCT concepts, defined by their cost-reduction strategies, operational efficiency, and provision of essential, rather than premium, services [8,9].
Airport passenger terminals have long been recognized as complex environments shaped by interactions between infrastructure, passenger needs, and airline business models. Early conceptualizations of airport terminal planning emphasized performance, comfort, and processing capacity as key characteristics of airport competitiveness. Improving terminal services could raise non-aeronautical revenues, attract carriers, and improve passenger satisfaction [10,11].
Efforts to establish standardized practices began to accelerate with the IATA ADRM, which defined the LOS concept as a systematic measure of airport terminal efficiency, focusing on indicators such as comfort, processing times, and waiting times [12]. Through the 1990s, quality of provided service, i.e., level of service (LOS), increasingly became a topic of attention. LOS was emphasized as a core determinant of airport competitiveness [13], but it was also pointed out that only customers themselves should define quality of provided service [14]. The recognition of expectation–perception gaps led to the application of various tools, which provided structured mechanisms to evaluate discrepancies between desired and perceived levels of service [15].
By the early 2000s, airports began to implement Customer Experience Management (CEM) practices to align provided service with passenger expectations. Literature identifies numerous contributors to passenger satisfaction such as cleanliness, staff friendliness, ease of movement, waiting times, and terminal ambience [16]. Commercial offerings and passenger guidance in terminals were also found significant for the travel experience [17]. As liberalization and globalization intensified, airports had greater responsibility to uphold adequate Airport Service Quality (ASQ), prompting regular measurement and strategic management of service performance [18].
As airports adapted to rapid industry evolution, research emphasized the importance of designing terminals flexible enough to accommodate changing airline business strategies, technological updates, and fluctuations in demand [19]. Airport terminal environments were described as inherently complex and potentially stressful, emphasizing the need for synchronized, user-oriented processes [20]. Airport terminal design historically did not account for all infrastructural efficiency factors, resulting in deterioration of quality of provided service and the necessity for quantifiable LOS measures [21].
For LCC-dominant airports, this flexibility is particularly relevant, i.e., their business model requires high productivity, minimal amenities, and rapid flows, necessitating simplified infrastructure. IATA’s LOS recommendations offer benchmarks for space per passenger and maximum waiting times, shaping airport terminal design strategies [12]. A disadvantage of IATA’s LOS recommendations is that it is designed according to the requirements of FSCs, and not according to requirements of other airline business models, such as LCCs.
Many studies analyzed airport terminal facilities, which form the core processing points of any airport terminal, and are particularly important for LCC-dominant airports aiming to support fast passenger turnover.
Check-in of passengers and baggage represent one of the earliest and most extensively researched airport terminal facilities. Waiting and processing times at this facility strongly influence passengers’ perception of the airline and airport. Research emphasizes the transition from traditional check-in desks to self-service technologies such as internet check-in, self-service kiosks, and self-bag-drop, which reduces the queues and supports LCC operating principles [22,23].
Boarding-pass control facility, usually located before security control facility, has increasingly moved toward automated barcode/QR scanning systems that accelerate throughput and align well with LCC preferences for automated processes [12].
Security control of passengers and baggage constitutes one of the most capacity-sensitive terminal components and is frequently congested. Processing rates vary widely, between 100 and over 200 passengers per hour per security lane, depending on airport size and equipment. Many airports adopted the 2:1 configuration (two X-ray machines per one walk-through metal detector) to enhance efficiency [24].
Emigration or outbound passport control facility follows security control facility in international departures and must be designed with capacity at least equal to upstream facilities to avoid new queues [22]. Factors influencing performance include number of staffed desks, average processing time, international passenger volumes, and available queueing area. In the Schengen context, certain passengers bypass passport control altogether, affecting terminal design strategies [25,26].
Gate holdrooms accommodate passengers after processing is complete and are influenced by commercial facilities, seating availability, and gate configuration. The purpose is to consolidate passengers before boarding, with typical design assumptions suggesting approximately 75% of passengers may be present simultaneously [12,25,27].
Baggage claim is recognized as one of the most critical airport terminal facilities for arrivals. Literature highlights challenges related to synchronization between passenger arrival and baggage delivery. Carousel design, length, and number depend on aircraft type and expected baggage volumes, where larger airports often use 360-degree access systems for higher throughput [25].
Customs control varies widely by nation. In non-Schengen contexts, customs control applies to international arrivals with designated green, red, and blue corridors depending on declaration requirements [28,29]. For many EU terminals, elimination of customs for Schengen arrivals reduces spatial and operational needs, which is an advantage leveraged by many LCC-dominated airports.
Capacity assessment of airport terminal facilities has been a significant topic in previous research. Modern airport terminals must balance efficiency, flexibility, and quality of provided service, especially under peak-hour demands [30,31]. Variations in technological requirements, regulatory constraints, and airline strategies necessitate continuous adaptation [22].
Early research on airport terminal modeling approaches dates back to the 1980s and 1990s [9,32,33], while later works expands to microsimulation and advanced optimization models [34,35,36,37,38,39,40,41,42,43].
Numerous literature identified various dynamic factors shaping LOS performance of airport terminal facilities. Some include passenger arrival distribution, influenced by airline type and walking speeds [36]; check-in methods, where LCCs are more reliant on self-service technologies [44]; staff availability, which affects throughput among facilities [34]; spatial layout, reflecting the interdependency of sequential processing points [22]; passenger discretionary time, affecting congestion in commercial and boarding areas [17]; check-in option utilization rates, altering queue formation [45]; processing speeds, which determine operational feasibility [22], and many others.
These factors collectively demonstrate that airport terminal planning must be sensitive to both passenger behavior and airline business models. For LCCs, whose passengers generally prioritize low fares over comfort, certain LOS parameters should be adjusted to achieve higher operational efficiency without compromising passenger satisfaction.
As already mentioned, the primary reference for LOS evaluation in airport terminals is IATA ADRM [12], which defines LOS through spatial–temporal metrics such as space per passenger, queueing delay, and acceptable maximum waiting times. Although widely adopted in planning practice, these LOS definitions are applied uniformly to all passengers, regardless of airline business model, thereby reflecting a one-size-fits-all approach. Studies such as [46] extend the LOS framework by linking LOS categories to subsystem capacities in an integrated landside-capacity perspective but LOS continues to be treated as generic rather than airline specific.
In contrast, ATFS incorporates two parallel LOS regimes within a unified analytical engine: the standard IATA LOS thresholds and newly derived LCC-specific LOS parameters obtained through an AHP-based passenger survey. These new LOS thresholds quantify crowding tolerance and acceptable waiting times specifically for LCC passengers, thus enabling ATFS to compute and compare “IATA-optimum” and “LCC-optimum” LOS values for each facility and time interval of the design day. This dual LOS structure represents a methodological advance over existing LOS frameworks that do not differentiate between airline business models.
Classical analytical capacity-demand models [47,48,49] typically express relationships between arrival patterns, processing rates, queue lengths, and waiting times, but they are applied mainly to isolated subsystems and assume a generic passenger profile. Di Mascio et al. [46] integrate LOS and capacity concepts for terminal subsystems, yet do not implement a full multi-facility analytical tool for design-day evaluation.
Commercial simulation tools, including CAST and Airtop software [50,51] provide detailed passenger-flow simulations using the 2D/3D layouts and agent-based movement models. However, such platforms require extensive model development and calibration, typically operate as “black-box” systems, and do not offer a transparent analytical structure nor explicit LOS differentiation between LCC and FSC passengers.
By comparison, ATFS develops a fully analytical, transparent, and modular capacity–demand engine for 11 major terminal facilities—including check-in (desks and kiosks), public halls, boarding-pass control, security control, emigration/immigration, baggage reclaim, customs, and gate holdrooms. The software uses closed-form formulas to compute maximum queuing time (MQT), maximum queue length (QMAX), space per passenger (SP), required surface area, and number of processing units, evaluated across multiple temporal intervals (15–240 min) for the entire design day. This enables very rapid scenario evaluation without simulation, while maintaining methodological consistency across all subsystems. Such an approach distinguishes ATFS from both analytical single-facility models and simulation-based commercial tools.
Empirical studies demonstrate that LCC passengers differ behaviorally from passengers using FSCs. Barrett [52] identifies that LCC passengers generally accept lower levels of comfort, rely more heavily on self-service processing, and exhibit different tolerance thresholds for crowding and waiting. Sabar et al. [53] examine preferences of LCC passengers, LCC airlines, and airport management in the context of low-cost terminal (LCT) development, again highlighting distinct expectations across business models.
Although these studies describe behavioral differences, they typically remain at a qualitative level and do not translate these patterns into quantitative LOS parameters or facility-sizing requirements. ATFS advances this literature by quantifying behavioral differences and embedding them directly into LOS thresholds and analytical capacity formulas. The AHP-derived LCC LOS parameters reflecting different crowding tolerance, shorter dwell times, and higher acceptance of simplified service environments are systematically integrated into the computation of SP, MQT, QMAX, and required area across all facilities. This provides a behaviorally grounded, business-model-specific LOS framework that existing literature lacks to address.
Research on LCT design, including Hanaoka & Saraswati [54], emphasizes spatially simplified, operationally efficient, and cost-reduced terminal layouts designed for LCC operations. Sabar et al. [53] further demonstrate that LCC passengers, airlines, and airport authorities tend to prioritize straightforward processing, minimal non-essential infrastructure, and compact spatial arrangements. Nevertheless, most LCT-related studies remain conceptual and do not quantify capacity implications nor assess LOS outcomes under varying operational and passenger-mix scenarios.
ATFS bridges this gap by enabling explicit testing of LCC-oriented design assumptions within a unified analytical framework. By adjusting shares of self-service processing, varying LCC passenger proportions, or segmenting facilities according to airline business model, ATFS quantifies the resulting changes in required areas and LOS for each subsystem. The case study application at Pula Airport demonstrates where LCC LOS standards allow meaningful spatial reductions compared with IATA LOS, as well as which facilities remain capacity-critical or potentially over-designed under LCC-dominant conditions.
The literature overview presents a clear chronological development from early conceptualizations of low-cost carrier models to contemporary analyses of airport terminal capacity, quality of provided service, and airport infrastructure design. With LCCs fundamentally reshaping global air travel through simplified operations and reliance on secondary airports, research increasingly focuses on how passenger terminals can accommodate their efficiency-driven requirements. Over time, LOS frameworks, processing facility analyses, and capacity modeling methodologies have matured, leading to precise guidelines for space allocation, waiting times, and operational standards.
A key gap identified in reviewed literature is the lack of specific LOS standards for different airline business models. Current LOS definitions are uniformly applied, despite LCC and FSC passengers exhibiting varied expectations, processing patterns, and financial capabilities. Questions therefore arise about whether identical LOS targets are appropriate for all airline types, or whether LCC-dominant terminals could operate more efficiently with specific LCC LOS recommendations.
With this in mind, LOS guidelines were developed to accommodate the requirements of LCCs [55]. Using standard IATA LOS guidelines, newly developed LCC LOS guidelines, and LOS calculations of each airport terminal facility, Airport Terminal Facilities Software (ATFS) was designed and developed to optimize existing facilities and plan future airport terminal facilities requirements. The evaluation of the software is conducted on the case-study airport, i.e., Pula Airport, as shown in the following chapters.
It is necessary to emphasize that ATFS is, according to current knowledge, the first integrated planning tool that operationalizes newly developed LCC-specific LOS guidelines across all key departure and arrival facilities (11 facilities in total), while simultaneously allowing comparison with standard IATA LOS guidelines within a single computational framework. In contrast, existing LOS-related research either focus on deriving LOS parameters (e.g., the AHP-based derivation of LCC LOS guidelines) without offering an operational software environment, or on generic IATA-based thresholds that do not differentiate between airline business models.
Most existing LOS-based approaches apply uniform IATA guidelines for space per passenger and maximum waiting time, regardless of the airline business model or passenger profile. As noted in the introduction, these guidelines were originally developed for the needs of FSC passengers, which, in the case of airports dominated by LCC traffic, may result in oversized or misaligned capacities, such as excessive floor areas or longer acceptable waiting times. The literature further shows that existing models rarely differentiate key temporal parameters such as acceptable waiting time, dwell time, or check-in method, in accordance with the actual behavior patterns of LCC passengers. This overlooks the fact that LCC passengers are more cost-sensitive, more inclined to use self-service technologies, and more tolerant of simplified conditions, which implies that optimal LOS values should be defined differently. Moreover, existing research typically examines individual airport terminal facilities such as check-in, security control, or immigration, while lacking an integrated model that simultaneously links all subsystems and enables a consistent evaluation of their combined effects on overall terminal sizing. The article highlights that such a comprehensive, LCC-specific framework is currently absent from the available literature.
3. Methodology and Data
This chapter describes methodology and data used in this paper. This includes determining level of service of airport terminal facilities by using defined set of guidelines regarding space and time for processing passenger and baggage at each airport terminal facility, calculations of level of service for each airport terminal facility (seven in departure, and four in arrival), development of software designed for calculating capacity and level of service for each airport terminal facility called “Airport Terminal Facilities Software” or “ATFS”, and description of collected data necessary for this case study.
All calculations related to temporal and spatial requirements are based on empirical data collected at Pula Airport during July 2019. Passenger processing times were obtained using time-and-motion measurements, i.e., through direct observation of the actual duration of key processes such as check-in, boarding-pass control, security screening, and emigration and immigration procedures. These measurements enabled the determination of realistic average processing times, representing an important step in distinguishing actual passenger behavior from the standardized values presented in international guidelines. In parallel, data on the areas of all relevant terminal functions were taken from the airport’s official documentation and incorporated in detail into the analysis. The actual floor areas of the check-in zone, passenger control points, security screening areas, emigration and immigration facilities, and gate holdrooms were included, ensuring an authentic spatial basis for modelling. These empirical datasets were integrated into the ATFS model, where they serve as input values for capacity estimation and LOS assessment. This confirms that ATFS is not based on theoretical assumptions but on real operational data, substantially strengthening the model’s credibility and applicability.
The study clearly defines the fundamental boundary conditions and assumptions applied in all capacity and LOS calculations. Dimensioning is conducted using design peak-hour intervals, employing time windows ranging from 15 to 240 min depending on the terminal function. The model follows a deterministic approach, assuming a stable relationship between inflows and outflows during the design interval and not applying stochastic methods or queueing simulations. Under peak conditions, 100% availability and utilization of all operational units such as check-in desks, security lanes, and control points is assumed. Variability in passenger behavior and process performance is not explicitly modelled but is instead accounted for through conservative parameter choices, particularly in processing times derived from empirical measurements. This set of assumptions enables consistent and transparent application of the ATFS model when assessing required capacities and LOS outcomes.
The LCC LOS guidelines, i.e., the spatial and temporal values used in the calculations, are taken from previous research in which they were derived using the Analytic Hierarchy Process (AHP). This structured procedure involves passengers who use LCC services and serves to define design values that best reflect the specific operational requirements of LCCs. As a result, the LOS guidelines used in the model are aligned with the LCC business model and appropriate as target parameters for the dimensioning of primary processing facilities. These guidelines form the foundation for distinguishing LCC-specific planning from generic IATA values and enable the ATFS model to consistently reflect the actual operational needs of LCC-oriented airports.
The application of the proposed ATFS model can be replicated in larger hub or non-seasonal airports through recalibration of key input parameters, including design-day demand, the structure of airline business models, passenger dwell times, processing times, visitor-to-passenger ratios, and, where necessary, by adjusting the range of levels of service (LOS) to reflect local expectations and passenger behavior. The purpose of this paper is not to establish universal quantitative values applicable to all airports, but rather to demonstrate the development and application of the ATFS tool on a real dataset and to present its methodological functionality and analytical potential.
Pula Airport was selected as a case study because it exhibits a clear and long-term trend toward a dominant share of LCCs, has detailed historical traffic data and information on terminal spatial layout, and has already been analyzed in related works by the authors addressing traffic demand forecasting and terminal capacity planning. This ensures internal consistency between the input data used in the ATFS, the applied LOS parameters, and the scenarios based on traffic and business forecasts.
The numerical results obtained within this study (for example, specific percentages of reduction in the required area of the public departures hall) are specific to the traffic structure, seasonality, and terminal layout of Pula Airport and cannot be directly generalized to other airports without adjustment of the input assumptions. At the same time, the core methodological elements of the ATFS (an analytical LOS model for individual terminal facilities, the introduction of LCC specific LOS parameters, and integration with traffic demand forecasts and airline business models) are generic in nature and can be applied to airports of different sizes, levels of seasonality, and business profiles, subject to appropriate adaptation to local conditions.
The paper further links the 2019 design-day data used in the ATFS with more recent traffic demand and business model forecasts developed in the authors’ previous research on terminal capacity planning. These forecasts already incorporate post-pandemic traffic trends and indicate a continued increase in the share of LCCs. The ATFS is therefore conceived as a flexible tool that enables the testing of future scenarios, including changes in demand structure, the share of LCC passengers, processing times, and evolving passenger behavior, such as greater acceptance of self-service technologies or altered patterns of arrival at the terminal.
3.1. Determining Level of Service of Airport Terminal Facilities
As per IATA ADRM [12], the Level of Service (LOS) is a crucial element influencing success across aviation industry. Airlines and airport terminals offer various services to enhance passenger comfort and satisfaction. The LOS serves as a measure for evaluating how effectively airport terminal facilities function, using key parameters. Table 1 presents the IATA LOS recommendations for airport terminal facilities.

Table 1.
IATA LOS guidelines for airport terminal facilities [12].
As per previously conducted research, an analysis of the level of service (LOS) at the airport terminal facilities for LCCs was conducted, and an AHP decision-making model was developed to determine new spatial–temporal parameters for the optimal LOS for LCCs [55]. The proposal of new LOS guidelines with new spatial–temporal parameters for LCCs were developed.
Additionally, the LCC specific LOS parameters implemented in ATFS are derived from the authors’ recent study [55]. In that research, a purpose-designed survey was conducted among passengers who frequently use LCCs services, with the aim of collecting data on their preferences, needs, and perceptions related to service quality, waiting times, and spatial comfort across all main terminal facilities, covering the entire passenger journey from terminal arrival to boarding.
The collected survey data were analyzed using a hierarchical AHP decision-making model, in which the key criteria: price, time, and space were evaluated and pairwise compared using the Saaty scale. The results showed that ticket price has the highest relative importance, followed by time and space, where majority of respondents showed willingness to accept higher levels of crowding and longer waiting times in exchange for lower fares.
As per these findings, facility-specific spatial and temporal LOS parameters for LCC passengers were defined, including acceptable waiting times, space per passenger, and occupancy levels. Sensitivity analysis conducted within the AHP framework confirmed the robustness of the resulting rankings. The LOS values implemented in ATFS are directly derived from the results of this survey-based AHP analysis, thereby providing a transparent and empirically grounded basis for the proposed LCC LOS guidelines. Table 2 presents newly developed LCC LOS guidelines.
Table 2.
Newly developed LCC LOS guidelines [55].
Additionally, when space and maximum waiting times from Table 1 and Table 2 point to different levels of service (LOS), the total LOS is determined by using the IATA LOS matrix.
The IATA Level of Service (LOS) matrix is a key framework used in airport terminal planning to evaluate how well a terminal supports passenger flow, comfort, and operational efficiency. It assesses factors such as available space per passenger, queueing times, and seating capacity. In 2014, the traditional A–F grading scale has been replaced with a four-level system: “under-provided” (red color), “sub-optimum” (yellow color), “optimum” (green color), and “over-design” (orange color) [12]. LOS levels “under-provided” and “sub-optimum” indicate terminals that fail to meet recommended standards, typically resulting in crowding, longer waiting times, and reduced passenger comfort. Level “optimum” is the preferred design target, offering an effective balance between quality of service and investment, ensuring good passenger experience and acceptable processing times during typical busy periods without excessive cost. LOS level “over-design” represents a very high level of comfort with generous space and minimal waiting but often leads to facilities that are unnecessarily expensive to build and operate. By defining these categories, the LOS matrix helps airports plan infrastructure that meets performance expectations, supports future growth, and prevents both insufficient capacity and unnecessary expense. Table 3 shows the IATA LOS matrix.
Table 3.
IATA LOS matrix [12].
3.2. Calculations of Level of Service of Airport Terminal Facilities
This part shows all mathematical calculations necessary to determine level of service of airport terminal facilities including seven airport terminal facilities for departure and four airport terminal facilities for arrival.
It is important to emphasize that the mathematical calculations of each airport facility represent a systematized framework for integrated evaluation, i.e., the innovation lies in their sequential articulation within a differentiated level of service (LOS) logic, allowing for the diagnosis of bottlenecks, idle space, and oversized areas using criteria consistent with the LCC business profile.
3.2.1. Public Departure Hall
Public departure hall at an airport is a space used for accommodating passengers, that is, where passengers are located before they check in for their flight and their baggage. Their visitors or escorts (people who come to see off passengers but do not travel with them) can often be found there. Visitors can be in this public area because there are usually no restrictive security measures. This area allows passengers to say goodbye to their family, friends, or colleagues. After passengers have checked in for their flight and passed through boarding pass control, the visitors usually have to leave the area because they can no longer enter the secured area.
The public departure hall usually includes various facilities for passengers, such as shops, restaurants, cafes, rest areas, information kiosks and passenger services. This area has the function of a comfortable waiting area before passengers proceed to security control and then to the gates through which they board their flights.
LOS calculations apply the IATA LOS guidelines (Table 1) and the newly developed LCC LOS guidelines (Table 2) for this airport terminal facility, i.e., public departure hall.
- Calculation of the Level of Service for Public Departure Hall
According to the following equation, the SPST(public departure hall) is obtained, which is the key parameter used to calculate the LOS of the public departure hall:
The variables in Equations (1) and (2) have the following meaning:
- P(public departure hall)—persons present in departure hall,
- PHP—persons present in departure hall in peak hour,
- VR—number of visitors per passenger,
- TP—dwell time for passengers,
- TV—dwell time for visitors,
- SPST(public departure hall)—space per standing person,
- A(public departure hall)—area of public departure hall,
- SR—seat ratio,
- SPS(public departure hall)—space per seated person.
- Calculations for Planning and Optimizing Future Requirements
According to the following equations, the number of persons are calculated as per formula (1) and the required area of the public departure hall is calculated according to:
The variables in Equation (3) have the same meaning as previous ones.
3.2.2. Check-in Desk for Passengers and Baggage
The check-in process begins when a passenger lines up at the check-in desk to obtain a boarding pass and check in their baggage and ends when the passenger leaves the check-in area. At this airport terminal facility, passengers select their seat, check in their baggage, and are issued a boarding pass for their flight.
LOS calculations apply the IATA LOS guidelines (Table 1) and the newly developed LCC LOS guidelines (Table 2) for this airport terminal facility, i.e., check-in desk for passengers and baggage.
- Determining the Processing Time at the Check-in Desk for Passengers and Baggage
The time period in which the measurements of passenger processing time were conducted was July 2019. The measurement results showed that the check-in desk clerk needs 55 to 90 s to process one passenger, i.e., in average 72.5 s, at Pula Airport [56]. Hence, the final measurements, for 27 July 2019 at Pula Airport, include definition of minimum time of 55 s, average time of 73 s, and maximum time of 90 s.
At Pula Airport, the total area (A) for passenger and baggage check-in, including the discretionary zone area in front of the desks, is 545.5 m2, as shown in Figure 1.
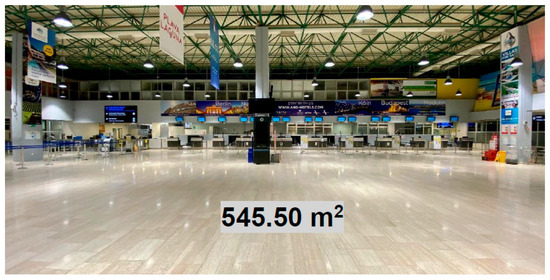
Figure 1.
Check-in desks for passengers and baggage (16 desks) at Pula Airport [56].
Calculation of the Level of Service for Check-in Desk for Passengers and Baggage
According to the following equations, the key LOS parameters, i.e., maximum queuing time (MQTCD), maximum number of passengers in the queue (QMAXCD) and space per passenger (SP), were obtained. The MQTCD, QMAXCD and SPCD are defined by the following formulas:
The variables in Equations (4)–(6) have the following meaning:
- MQTCD—maximum queuing time,
- Demand—number of passengers,
- PT—processing time (average processing time per passenger),
- #Units (CD)—number of check-in desks,
- Δt—time interval,
- QMAXCD—maximum number of passengers in the queue,
- SPCD—space per passenger,
- ACD—actual area of the facility.
- Calculations for Planning and Optimizing Future Requirements
It is necessary to define the demand, LOS parameters (MQTCD and SPCD) to obtain information on the required number of check-in desks and the area. With known MQTCD and PT, it is necessary to calculate the maximum number of passengers in the queue (QMAX) using the number of check-in desks as input.
Δt corresponds to the peak period used for the demand calculation, i.e., in July 2019 at Pula Airport. If different time intervals are taken into account for the demand calculation, several calculations need to be made for the total number of units (desks) in order to select the most restrictive one. In other words, for different Δt (15 min, 30 min, 1 h, 2 h and 4 h), different demand values are obtained, which results in different numbers of units (desks) required. Once the results are obtained, the highest outcome that corresponds to the most restrictive one should be selected.
The number of passengers in the queue (QMAXCD) is calculated according to (5), and the number of check-in desks (CD), and the area (ACD) are calculated according to the following equations:
The variables in Equations (7) and (8) have the same meaning as previous ones.
3.2.3. Check-in Self-Service Kiosk
At various modern airports, passengers are enabled to check-in for a flight and receive their boarding passes for their own journey via the Internet, Self-Service (SS) kiosks, or a mobile device. In this way, passengers can avoid long queues at the check-in desks. A passenger without checked baggage continues towards boarding pass control, security control and the exit, while a passenger with checked baggage can leave it at the Baggage Drop-Off counters or SelfBag-Drop kiosks, if they are installed.
The variables that affect the size of self-service facilities are similar to those used for traditional check-in. The differences are visible in the significantly smaller area occupied by the facility and the reduced maximum acceptable waiting time in the queue.
LOS calculations apply the IATA LOS guidelines (Table 1) and the newly developed LCC LOS guidelines (Table 2) for this airport terminal facility, i.e., check-in self-service kiosks.
- Calculations for Planning and Optimizing Future Requirements
It is necessary to define the demand, LOS parameters (MQTSS and SPSS) to obtain information on the required number of check-in self-service units and the area. With known MQTSS and PT, it is necessary to calculate the maximum number of passengers in the queue (QMAXSS) using the number of check-in self-service units as input.
As with traditional check-in, the Δt value corresponds to the peak periods used to calculate demand, i.e., in July 2019 at Pula Airport. Since different time intervals are considered for the demand calculation, several calculations need to be made for the total number of units in order to select the most restrictive one. In other words, for different Δt (15 min, 30 min, 1 h, 2 h and 4 h) different demand values are obtained, resulting in different required number of facility units. For each of these pairs of values (Δt and demand), a calculation of the number of units needs to be made. Once the results are obtained, the highest outcome, which corresponds to the most restrictive, should be selected.
According to the following equations, the number of check-in self-service (SS) units, the number of passengers in the queue (QMAXSS) and the area (ASS) are calculated:
The variables in Equations (9)–(11) have the following meaning:
- MQTSS—maximum queuing time,
- Demand—number of passengers,
- PT—processing time (average processing time per passenger),
- #Units (SS)—number of check-in self-service units,
- Δt—time interval,
- QMAXSS—maximum number of passengers in the queue,
- SPSS—space per passenger,
- ASS—actual area of the facility.
The formula for area (ASS) only gives the net area strictly required for queuing. In order to calculate the total area required for this facility, geometric considerations and the layout of self-service kiosks should be revised, and circulation space and service space can be added as well. It may also be useful to include additional queuing space in the event that the maximum queuing time (MQT) is inevitably exceeded.
3.2.4. Boarding-Pass Control
After checking in for a flight, passengers receive a boarding pass, which is checked before entering the airport secured area. Automated control via barcode or QR reader is increasingly used, which speeds up the passage to security control and increases operational efficiency. The process takes 30–60 s [12].
The LOS calculations use new LCC LOS guidelines (Table 2) for this airport terminal facility, i.e., boarding-pass control, because IATA LOS guidelines (Table 1) do not provide guidelines for this airport terminal facility.
- Determining the Processing Time at the Boarding-pass Control
The total area of boarding pass control at Pula Airport is 135.63 m2, and it takes an employee on average 15 s to check passengers [56].
As per IATA ADRM [12], this process should not disrupt passenger flow and become an additional waiting area for passengers. For this reason, the maximum queuing time (MQT) should be very short (less than one minute) to minimize disruption to subsequent facilities.
As the spatial–temporal parameters for boarding-pass control are not defined in the existing IATA LOS guidelines, a set of guidelines for determining the level of service of this facility is proposed in the new LCC LOS guidelines (Table 2). The proposed area per passenger, ranging from 0.8 to 1.0 m2, corresponds to the “optimum” level follows the same spatial requirements as security control of passengers and hand baggage, as well as the emigration/immigration control. The proposed range of time required for passenger processing is 15 to 30 s, in line with the standardized and continuous flow in this segment.
- Calculation of the Level of Service for Boarding-pass Control
In accordance with the IATA ADRM [12], a calculation is made for Δt intervals (15 min, 30 min, 1 h, 2 h and 4 h). The highest result in terms of MQTBP should always be selected and used as input for the following steps.
The key LOS parameters, i.e., maximum queuing time (MQTBP), maximum number of passengers in the queue (QMAXBP) and space per passenger (SPBP), were obtained according to the following equations:
The variables in Equations (12)–(14) have the following meaning:
- MQTBP—maximum queuing time,
- Demand—number of passengers,
- PT—processing time (average processing time per passenger),
- #Units (BP)—total number of boarding pass control units (access gates),
- Δt—time interval,
- QMAXBP—maximum number of passengers in the queue,
- SPBP—space per passenger,
- ABP—actual area of the facility.
- Calculations for Planning and Optimizing Future Requirements
As per defining the demand, LOS parameters (MQT and SP) are calculated to obtain information on the required number of boarding-pass control units and the area. The demand can be divided for each specific traffic segment to calculate a different number of units. For example, checking boarding passes for frequent flyers, economy class passengers, etc. Multiple unit calculations need to be made. Once the results are obtained, the highest result, which corresponds to the most restrictive, is the one to be selected. According to IATA ADRM [12], the calculation is done at intervals Δt (15 min, 30 min, 1 h, 2 h and 4 h). The highest result in terms of number of boarding-pass units (BP) should always be selected and used as input for the following steps.
The number of passengers in the queue (QMAXBP) is calculated as per (13). According to the following equations, the number of boarding-pass control units (BP) and the area (ABP), are calculated:
The variables in Equations (15) and (16) have the same meaning as previous ones.
3.2.5. Security Control
All departing passengers must undergo security control, and in some cases also transfer passengers. Queues are organized by counters or as a common queue, and are sized according to the output flow from the check-in area. Processing speeds at Security Screening Check Point (SSCP) range from 100 to over 200 passengers/hour/lane, with X-ray machine and Walk-Through Metal Detector (WTMD), where capacity is determined by X-ray [22]. The “2:1” configuration is considered more efficient, where two X-ray machines are connected to one WTMD. The overall processing depends on a series of steps. According to Table 1, the IATA recommended LOS “optimum” is 1.0–1.2 m2/passenger, and the maximum waiting time is 10 min. Capacity can be increased by adding equipment, lanes or personnel [49].
LOS calculations apply the IATA LOS guidelines (Table 1) and the newly developed LCC LOS guidelines (Table 2) for this airport terminal facility, i.e., security control area.
- Determining the Processing Time at the Security Control
The time period in which the measurements of passenger processing time were conducted was July 2019, at Pula Airport.
According to the data collected from Pula Airport, the throughput of one lane of security control is 3 passengers per minute, or 20 s per passenger. The fenced area intended for security control of passengers and hand baggage is 55.76 m2, as per Figure 2.
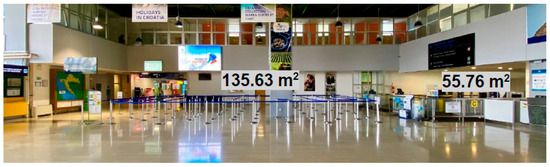
Figure 2.
Security control area for security inspection of passengers and hand baggage at Pula Airport [56].
The total area of security control of passengers and hand baggage is 191.39 m2, of which 135.63 m2 is the area for forming lines in front of the security control area and 55.76 m2 of the fenced area for security control of passengers and hand baggage, including the discretionary zone area in front of the metal detector. The passenger and hand baggage security control area consists of four lanes equipped with two metal detector doors and four X-ray devices, as per Figure 3.
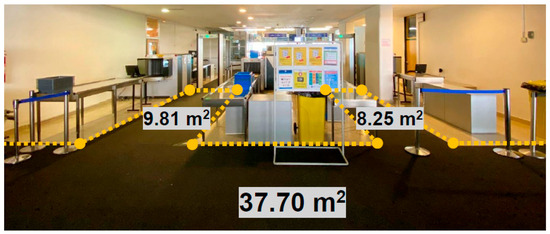
Figure 3.
Area in front of the security control of passengers and hand baggage at Pula Airport [56].
- Calculation of the Level of Service for Security Control
In accordance with the IATA ADRM [12], a calculation is made for Δt intervals (15 min, 30 min, 1 h, 2 h and 4 h). The highest result in terms of MQTSEC should always be selected and used as input for the following steps.
The key LOS parameters, i.e., maximum queuing time (MQTSEC), maximum number of passengers in the queue (QMAXSEC) and space per passenger (SPSEC), are calculated according to the following equations:
The variables in Equations (17)–(19) have the following meaning:
- MQTSEC—maximum queuing time,
- Demand—number of passengers,
- PT—processing time (average processing time per passenger),
- SEC—number of security lanes,
- Δt—time interval,
- QMAXSEC—maximum number of passengers in the queue,
- SPSEC—space per passenger,
- ASEC—actual area of the facility.
- Calculations for Planning and Optimizing Future Requirements
Δt corresponds to the peak period used for the demand calculation. If different time intervals are taken into account for the demand calculation, it is necessary to make several calculations for the total number of security lanes in order to select the most restrictive one. Additionally, demand can be split for each specific traffic segment to calculate a different number of units. For example, security lanes for staff, VIP passengers, etc.
According to IATA ADRM [12], the calculation is done at intervals Δt (15 min, 30 min, 1 h, 2 h and 4 h). The highest result in terms of number of security lanes (SEC) should always be selected and used as input for the following steps.
The number of passengers in the queue (QMAXSEC) is calculated as per (18). According to the following equations, the number of security control lanes (SEC) and the area (ASEC) are calculated:
The variables in Equations (20) and (21) have the same meaning as previous ones.
3.2.6. Emigration Control
In international departures, after passengers have completed security control, they proceed to emigration or outbound passport control. This facility should have a capacity at least equal to the previous facility (security control) in order to avoid additional waiting times [25].
The walking speed and distance from check-in to outbound passport control and from the passenger terminal entrance gate to emigration (outbound passport) control define the distribution of actual passenger arrivals at this airport terminal facility [49]. Hence, it is possible to determine the usual demand and operational factors that affect capacity and the level of service.
According to the IATA recommendation, in order to achieve the LOS “optimum”, 1.0–1.2 m2/passenger is recommended, and the maximum waiting time in the queue should be up to 10 min [12].
In the Schengen area and the European Union (EU), there are specific rules and procedures regarding emigration (outbound passport) control. For example, passengers arriving from non-Schengen countries or third countries must go through passport control, while passengers within the Schengen area usually do not go through this control.
LOS calculations apply the IATA LOS guidelines (Table 1) and the newly developed LCC LOS guidelines (Table 2) for this airport terminal facility, i.e., emigration control.
- Determining the Processing Time at the Emigration Control
The time period in which the measurements were carried out is July 2019. According to data gathered from Pula Airport, the average processing time for one passenger is 20 s per passenger [56].
The total area intended for emigration control of passengers in international departure, including the discretionary zone area in front of the counter, is 33.89 m2, shown in Figure 4. Emigration (or outbound passport) control consists of two desks with two workstations, which is a total of four workstations located in the immediate vicinity of the passenger and hand baggage security control lane.
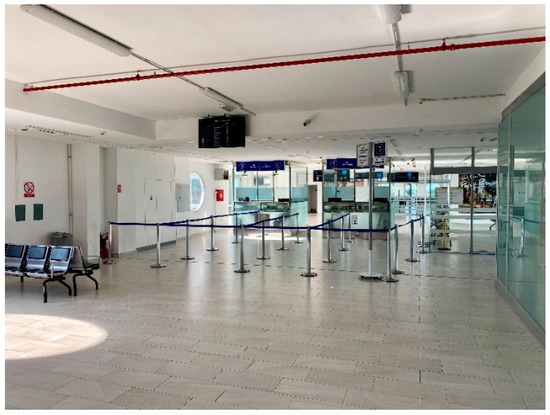
Figure 4.
Area in front of emigration control for international departures at Pula Airport [56].
- Calculation of the Level of Service for Emigration Control
In accordance with the IATA ADRM [12], a calculation is made for Δt intervals (15 min, 30 min, 1 h, 2 h and 4 h). The highest result in terms of MQT should always be selected and used as input for the following steps.
The key LOS parameters, i.e., maximum queuing time (MQTPD), maximum number of passengers in the queue (QMAXPD) and space per passenger (SPPD), are calculated according to the following equations:
The variables in Equations (22)–(24) have the following meaning:
- MQTPD—maximum queuing time,
- Demand—number of passengers,
- PT—processing time (average processing time per passenger),
- PD—total number of emigration (outbound passport) control desks,
- Δt—time interval,
- QMAXPD—maximum number of passengers in the queue,
- SPPD—space per passenger,
- APD—actual area of the facility.
- Calculations for Planning and Optimizing Future Requirements
Δt corresponds to the peak period used for the demand calculation. If different time intervals are taken into account for the demand calculation, it is necessary to make several calculations for the total number of emigration control desks in order to select the most restrictive one.
According to IATA ADRM [12], the calculation is done at intervals Δt (15 min, 30 min, 1 h, 2 h and 4 h). The highest result in terms of number of emigration (outbound passport) control desks (PD) should always be selected and used as input for the following steps.
The number of passengers in the queue (QMAXPD) is calculated as per (23). According to the following equations, the number of emigration (outbound passport control) desks (PD) and the area (APD) are calculated:
The variables in Equations (25) and (26) have the same meaning as previous ones.
3.2.7. Gate Holdrooms
After the departing passenger has passed all the mandatory airport terminal facilities, they enters the common departure area. In this area, various commercial activities can be found, such as restaurants, bars, shops, etc., which the passenger should use according to his/her own time possibilities. From this area, the passenger moves further towards the gate holdrooms, which can be intended each for only one flight or one for multiple flights. Typical gate holdrooms usually include seating and standing areas for passengers, staff desks, defined areas for forming queues for boardings, and spaces for passenger movements [22]. The main purpose of holdrooms is to gather passengers waiting to board flights [19]. Gate holdrooms are usually dimensioned for an LOS “optimum”, with some airports deciding to provide a higher level of service. An equation for calculating the optimal number of seats in gate holdrooms was developed in 1989 [57]. IATA also proposes the LOS “optimum” level for the available space segment at 1.8–2.2 m2/passenger. According to the IATA ADRM, the optimal seat occupancy ratio is 50–70% [12].
LOS calculations apply the IATA LOS guidelines (Table 1) and the newly developed LCC LOS guidelines (Table 2) for this airport terminal facility, i.e., gate holdrooms.
- Calculation of the Level of Service for Gate Holdrooms
The total area of the gate holdrooms is 902.06 m2 for international departures and 152.60 m2 for domestic departures. The area of the gate holdrooms for international departures at Pula Airport contains four gates, three of which are mainly used, while one gate is used at times of lower traffic density to avoid crossing passenger flows. The number of passengers and the planned seating and standing areas in gate holdrooms at Pula Airport are used as input parameters, i.e., seating areas in gate holdrooms amount to 388.8 m2 and standing areas are 513.26 m2 [56].
According to the following equation, the PS and PST are obtained, which are the key parameters used to calculate the LOS of the gate holdrooms:
The variables in Equations (27) and (28) have the following meaning:
- PA—number of passengers for seating area,
- AS—seating area,
- SPS—space per seated person,
- PST—number of passengers for standing area,
- AST—standing area,
- SPST—space per standing person.
- Calculations for Planning and Optimizing Future Requirements
According to the following equations, the maximum seating capacity and gate holdrooms area (A) are obtained:
The variables in Equations (29) and (30) have the following meaning:
- A—area of gate holdrooms,
- Demand—number of passengers,
- SR—seat ratio,
- SPS—space per seated person,
- SPST—space per standing person,
- #seats—maximum seating capacity (number of seated passengers).
3.2.8. Immigration Control
Passenger arrivals at the immigration or inbound passport control facility are largely dependent on the previous processes, i.e., disembarkation process and walking distances.
Recent developments show a global shift towards the use of automated technology for inbound passport control. Given the potential reduction in processing times, future analyses should consider the division of demand between passengers using automated self-service options and the traditional method using staff at desks.
For example, IATA ADRM [12] states that some airports have established a two-step process, where the first step is performed in front of an automated kiosk that performs the check and provides a preliminary response regarding admission to the country, followed by either an expedited process (if the machine has “approved” the passenger) or a traditional immigration control process (if the machine cannot “approve” the passenger).
LOS calculations apply the IATA LOS guidelines (Table 1) and the newly developed LCC LOS guidelines (Table 2) for this airport terminal facility, i.e., immigration control area.
- Determining the Processing Time at the Immigration Control
The time period in which the measurements were carried out is July 2019. According to the data gathered from Pula Airport, the average processing time of one passenger is 30 s per passenger. The total area of immigration control of passengers in international arrivals, including the discretionary zone area in front of the desk, is 411.15 m2 (411 passengers), which consists of two physically separate areas of 256.03 m2 (256 passengers) and 155.12 m2 (155 passengers) depending on Schengen/non-Schengen passenger flows (Figure 5).
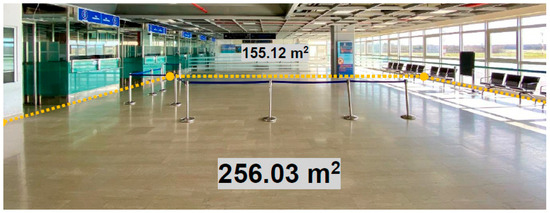
Figure 5.
Immigration control area for international arrivals at Pula Airport [56].
The immigration control consists of three booths with a total of five desks, where the average processing time for an incoming passenger is 30 s. The throughput capacity of one desk is 120 passengers per hour, or 600 passengers per hour when all five are open.
The strongest peak hour in the busiest month (27 July 2019), from 09:00–10:00, (524 passengers), including Schengen and non-Schengen passengers, was selected for the calculation and analysis [58].
- Calculation of the Level of Service for Immigration Control
In accordance with the IATA ADRM [12], a calculation is made for Δt intervals (15 min, 30 min, 1 h, 2 h and 4 h). The highest result in terms of MQTPC should always be selected and used as input for the following steps.
The key LOS parameters, i.e., maximum queuing time (MQTPC), maximum number of passengers in the queue (QMAXPC) and space per passenger (SPPC), are calculated according to the following equations:
The variables in Equations (31)–(33) have the following meaning:
- MQTPC—maximum queuing time,
- Demand—number of passengers,
- PT—processing time (average processing time per passenger),
- PC—total number of immigration (inbound passport) control desks,
- Δt—time interval,
- QMAXPC—maximum number of passengers in the queue,
- SPPC—space per passenger,
- APC—actual area of the facility.
- Calculations for Planning and Optimizing Future Requirements
According to IATA ADRM [12], the calculation is done at intervals Δt (15 min, 30 min, 1 h, 2 h and 4 h). The highest result in terms of number of immigration (inbound passport) control desks (PC) should always be selected and used as input for the following steps.
The number of passengers in the queue (QMAXPC) is calculated as per (32). According to the following equations, the number of immigration (inbound passport) control desks (PC) and the area (APC) are calculated:
The variables in Equations (34) and (35) have the same meaning as previous ones.
3.2.9. Baggage Reclaim
Baggage reclaim activity is the most critical activity in passenger arrival. The number of passengers waiting to collect their baggage depends on the rate of arrival of passengers from the aircraft and the efficiency of the baggage handling process. The capacity of the baggage reclaim area can be estimated by analyzing the average time a passenger spends waiting to collect their baggage and comparing the number of passengers in that area with the size of the space [49].
Medium and larger airports use so-called carousels, conveyors that are partially located inside the sorting hall. Baggage is placed on them and delivered in a circular motion to the arrival hall, where passengers finally collect their baggage [25].
The number of carousels varies depending on the number and size of aircraft, while its length depends on the size of the aircraft or the expected number of pieces of baggage. The distance from the baggage reclaim area to the passenger terminal exit is considered one of the key indicators of the LOS of this airport terminal facility [19].
According to the ADRM recommendations, waiting times below 15 min are recommended for narrow-body aircraft to achieve the “optimum” LOS. Waiting times for baggage longer than 20 min will provide a “sub-optimum” or “under-provided” level of service. The recommended space in the baggage reclaim area is 1.5–1.7 m2/passenger [12].
LOS calculations apply the IATA LOS guidelines (Table 1) and the newly developed LCC LOS guidelines (Table 2) for this airport terminal facility, i.e., baggage reclaim.
- Calculation of the Baggage Reclaim Area
The time period in which the analysis was conducted is July 2019. The total baggage reclaim area is 810.1 m2, with a total of two carousels. The proposed methodology focuses on defining the carousel occupancy time and space per passenger. Figure 6 shows the baggage reclaim area at Pula Airport.
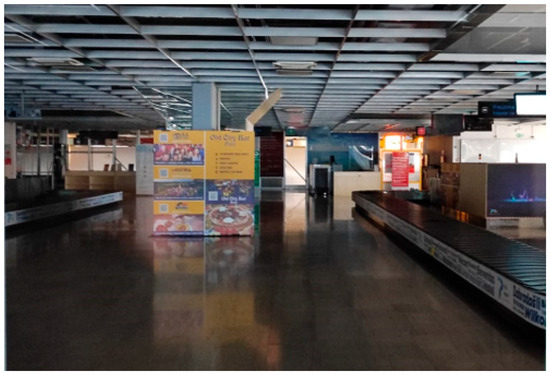
Figure 6.
Baggage reclaim area at Pula Airport [56].
- Calculation of the Level of Service for the Baggage Reclaim
The calculation gives how much space (in m2) each passenger occupies according to the total area for baggage reclaim and number of passengers.
The following assumptions are adopted for the calculation of carousel occupancy time and space per passenger: 50% of passengers have checked their baggage, i.e., 95 passengers are waiting to pick it up; the average baggage delivery rate is 20 bags; and the time required for the ground handling staff to start placing the baggage on the carousel is 10 min.
The following equations give the carousel occupancy time (passengers waiting to reclaim their baggage) and the space per passenger:
The variables in Equations (36) and (37) have the following meaning:
- Toccupancy—carousel occupancy time (time the carousel is occupied),
- Tstart—time it takes for ground handling staff to start placing baggage on the carousel,
- Total number of baggage—total number of bags for delivery to carousel,
- Baggage delivery rate—amount of baggage that ground handling staff places on the carousel,
- SP—space per passenger,
- A—total baggage reclaim area,
- P—number of passengers.
- Calculation of the Number of Carousels
When calculating the number of carousels, the distribution of aircraft arrivals during peak hours should be taken into account, as the closer the aircraft arrivals are to each other, the more carousels will be required.
The number of baggage claim units, i.e., carousels, is calculated according to the following equations:
The variables in Equations (38) and (39) have the following meaning:
- BC(NB)—number of narrow-body baggage claim units,
- BC(WB)—number of wide-body baggage claim units,
- ATM(NB/WB)—air traffic movements arriving during peak hour,
- OT(NB/WB)—average claim device occupancy time per narrow-body/wide-body aircraft.
- Calculation of the Required Length of the Carousel
When assessing the future requirements of this airport terminal facility, it is important to analyze the schedules for the designed day separately for narrow-body and wide-body aircraft. Also, the carousel may need to be dimensioned (determined with the required length) taking into account two potentially limiting factors, i.e., the number of passengers around the carousel (when passengers arrive in the baggage reclaim area before the baggage), or the number of bags on the carousel (when baggage arrive on the carousel before the passengers), but this research only considers the case of the number of passengers around the carousel as a limiting factor.
The area around the carousel can be dimensioned taking into account the space per passenger while waiting to collect their baggage and the waiting time to collect their baggage. Depending on the number of passengers (flights), they will wait longer/shorter as well as have less or more space per passenger, which ultimately depends on the number of carousels for receiving incoming baggage.
The required length of the carousel is expressed by the following formula:
The variables in Equation (46) have the following meaning:
- CLPAX—carousel length frontage for passenger line up,
- PAX—number of seats in the design aircraft,
- LF—load factor,
- PR—ratio of passengers with bags,
- POPAX—peak occupancy of passenger (defined as the ratio representing the maximum percentage of passengers who collect their baggage and who are likely to be present at the carousel at any given time),
- PLPAX—claim length frontage per passenger.
3.2.10. Customs Control
Customs control is carried out when passengers arrive in the country, whether they come from another Schengen area member state, the EU or a third country. Customs controls are aimed at security checks regarding the entry of goods and objects.
In most countries outside the Schengen area [28,29], customs controls are usually carried out on arrival of international flights. After immigration control or inbound passport control, passengers must choose the appropriate lane at customs control. Customs markings (red, green and blue lanes) are used to distinguish passengers according to the obligation to declare goods. The green lane is used by passengers who have nothing to declare (they do not have objects which fall under customs controls, such as prohibited substances, large quantities of alcohol, cigarettes, money, etc.). The red lane is used by passengers who have something to declare. At this lane, passengers may be subject to additional controls in order to declare goods. The blue lane is used for passengers arriving within the Schengen area or the EU and indicates that they are not subject to further customs control or declaration, except in cases where special rules apply.
According to the IATA ADRM recommendation, in order to achieve the LOS “optimum”, 1.3–1.8 m2/passenger is recommended, and the maximum waiting time should be up to 5 min [12].
LOS calculations apply the IATA LOS guidelines (Table 1) and the newly developed LCC LOS guidelines (Table 2) for this airport terminal facility, i.e., customs control area.
- Determining the Processing Time at the Customs Control
The time period in which the measurements were carried out is July 2019. According to the data of Pula Airport, the average processing time per passenger is 60 s per passenger (for random checks). A customs check that includes a detailed inspection usually takes up to 10 min at Pula Airport, while random checks carried out by customs officers are usually faster than detailed checks, as they are designed to quickly check passengers and goods in order to identify potential problems. The duration of a random check can vary, but usually takes about 1 min, at Pula Airport [56].
The total customs control area for international arrivals, including the discretionary zone area in front of the booth, is 84.30 m2, as shown in Figure 7.
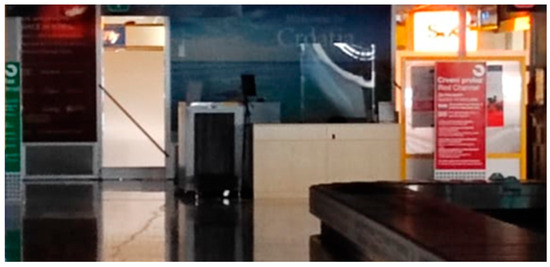
Figure 7.
Customs control area for international arrivals at Pula Airport [56].
- Calculation of the Level of Service for Customs Control
The key LOS parameters, i.e., maximum queuing time (MQTPI), maximum number of passengers in the queue (QMAXPI) and space per passenger (SPPI), are calculated according to the following equations:
The variables in Equations (41)–(43) have the following meaning:
- MQTPI—maximum queuing time,
- Demand—number of passengers,
- PT—processing time (average processing time per passenger),
- PI—number of primary inspection booths,
- Δt—time interval
- QMAXPI—maximum number of passengers in the queue,
- SPPI—space per passenger,
- API—actual area of the facility.
- Calculations for Planning and Optimizing Future Requirements
According to IATA ADRM [12], the calculation is done at intervals Δt (15 min, 30 min, 1 h, 2 h and 4 h). The highest result in terms of number of primary inspection booths (PI) should always be selected and used as input for the following steps.
The number of passengers in the queue (QMAXPI) is calculated as per (42). According to the following equations, the number of primary inspection booths (PI), and the area (API) are calculated:
The variables in Equations (44) and (45) have the same meaning as previous ones.
In order to calculate the total area required for this facility, it is necessary to add geometrical considerations and the layout of booths for customs inspection, offices and equipment, as well as circulation and service areas [12].
3.2.11. Public Arrival Hall
Public arrival hall is the area through which passengers pass after an aircraft lands and before they leave the airport. It is the part of a passenger terminal reserved for passengers arriving at their destination, and is usually located immediately after the immigration control and customs control areas. In the public arrival hall, passengers usually wait to meet friends or family, or they can head to the exit where taxis, buses, or rental cars are waiting. The public arrival hall may also provide services such as information desks, baggage reclaim areas, and other facilities for arriving passengers. These facilities/areas must enable the rapid and efficient processing of passengers, while minimizing waiting and congestion, with an emphasis on safety and comfort.
LOS calculations apply the IATA LOS guidelines (Table 1) and the newly developed LCC LOS guidelines (Table 2) for this airport terminal facility, i.e., public arrival hall.
- Calculation of the Level of Service for Public Arrival Hall
According to the following equation, the SPST is obtained, which is the key parameter used to calculate the LOS of the public arrival hall:
The variables in Equations (46) and (47) have the following meaning:
- P(public arrival hall)—persons present in arrival hall,
- PHP—persons present in arrival hall in peak hour,
- VR—number of visitors per passenger,
- TP—dwell time for passengers,
- TV—dwell time for visitors,
- SPST(public arrival hall)—space per standing person,
- A(public arrival hall)—area of public arrival hall,
- SR—seat ratio,
- SPS(public arrival hall)—space per seated person.
- Calculations for Planning and Optimizing Future Requirements
The number of persons are calculated as per (46) and the required area of the public arrival hall is calculated according to the following equation:
The variables in Equation (48) have the same meaning as previous ones.
3.3. Development of Airport Terminal Facilities Software (ATFS)
According to the mathematical formulas for calculation of level of service (LOS) outlined in Section 3.2 for each airport terminal facility at Pula Airport, the new software was developed, named Airport Terminal Facilities Software (ATFS).
In this context, the ATFS (Airport Terminal Facility Software) constitutes the main innovative contribution of the research, as it translates the theoretical–methodological framework into an operational tool usable by airport managers, i.e., it enables dynamic comparative evaluation (IATA vs. LCC), scenario generation, and direct support for strategic infrastructure decision-making.
ATFS (Figure 8 and Figure 9) is made in the programming language Java 11/Python 3.12, in combination with Microsoft Excel 365. ATFS includes a user interface (JavaScript, HsTML, CSS, Vue.js), a background application (Java/Spring Framework) for data processing and a database for storing results and saving data needed for calculations (processing). In the application, the data is displayed using the interface, but it is processed and modeled using Java programming language in the part of the background application.
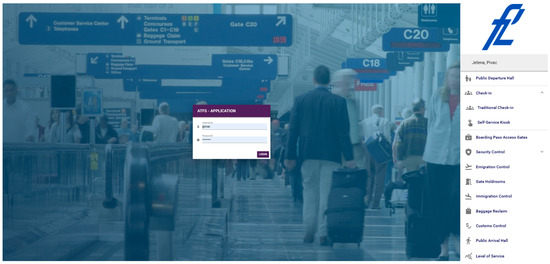
Figure 8.
ATFS login and main menu.
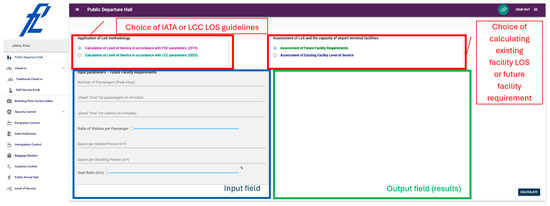
Figure 9.
Explanation of ATFS user interface.
The following text provides a detailed description of the ATFS architecture, specifically outlining its main functional components and their roles. ATFS follows a modular, three-layer architecture. At the data layer, Microsoft Excel 365 is used as a transparent and widely accessible repository for input and output tables (passenger numbers, processing times, facility parameters, and LOS parameters). Java and Python scripts are responsible for reading the Excel files, validating the data, and transforming them into structured data objects used by the analytical engine. Python 3.12 is primarily employed for pre-processing tasks that benefit from its scientific libraries (e.g., reading large tables and performing basic statistical checks), while Java is used for the core implementation of the analytical LOS and capacity models due to its robustness and performance.
At the application layer, the Spring Framework provides Java-based backend services that cover the main ATFS functionalities, including scenario definition, execution of analytical models for all facilities and time intervals, calculation of LOS indicators under IATA and LCC parameters, and storage of results. These services expose a RESTful API that is used by the user interface. This design allows ATFS to be easily extended (e.g., by adding new facilities or new LOS concepts) without requiring changes to the user interface.
At the presentation layer, the graphical user interface is implemented using JavaScript, HTML, CSS, and the Vue.js framework. Vue.js is used to build interactive components such as scenario input forms, tables for editing facility parameters, and dynamic charts that display passenger volumes and LOS over the design day. The front end communicates with the Spring backend via asynchronous HTTP requests, enabling users to trigger calculations, retrieve results, and explore alternative scenarios in near real time. The integration logic therefore consists of selecting or editing a scenario in the Vue.js interface, sending the corresponding request from the front end to the Spring backend; invoking the Java/Python-based analytical engine in the backend, which reads the required Excel data, performs LOS calculations, and stores the results; and updating the visualizations in the front end once the results are returned.
The innovative aspect of this architecture lies in the combination of a transparent, spreadsheet-based data layer, a formally implemented analytical LOS engine, and a modern web interface. This enables airport planners who are familiar with Excel to modify input data and immediately assess their impact on the level of service across all facilities through the ATFS interface, without the need to develop detailed simulation models or to use complex specialist software.
Figure 8 shows the initial (login) screen of the ATFS application within the context of its user interface. In the central part of the screen, a login window is displayed with fields for entering a username and password, highlighting the controlled access to the application. On the right side of the screen, a sidebar navigation menu is shown, providing an overview of the main functional modules of ATFS. The menu includes key airport terminal facilities and processes, such as the public departure hall, passenger check-in (traditional check-in and self-service kiosks), boarding pass control, security control, emigration and immigration control, gate holding areas, baggage reclaim, customs control, and the public arrival hall, as well as an LOS module for displaying the LOS of each airport terminal facility. The figure illustrates the initial interaction between the user and the software and clearly demonstrates how ATFS is structured as an integrated application that provides access to level-of-service analysis for different terminal facilities within a unified user interface.
Figure 9 shows the ATFS user interface for LOS analysis. In the upper part of the interface, the user can select the LOS calculation methodology, i.e., apply either IATA or LCC LOS guidelines. In addition, the type of analysis can be chosen, allowing the user to assess the existing facility conditions or to dimension future facility capacities.
The central part of the interface is divided into an input and an output area. On the left, the input field allows the user to define key parameters such as the number of passengers in the peak hour, passenger and visitor dwell times, the visitor-to-passenger ratio, and spatial parameters (e.g., space per seated or standing passenger and the share of seating). On the right, the output field displays the results of the analysis after the calculation is executed, including the assessed level of service and the required spatial capacities. The figure clearly illustrates the operational logic of ATFS, in which the user enters input data through a structured interface, selects the appropriate LOS guidelines and analysis type, and receives the analytical results in a separate output area.
Figure 10 presents a conceptual flowchart describing the core processing logic of the ATFS model for analyzing the LOS of airport terminal facilities. The process starts with the selection of the facility and the analysis scenario, which includes defining the design day or peak hour and applying the corresponding IATA and LCC LOS parameters. In the next step, demand is disaggregated by time intervals (Δt), passenger shares by processing options (e.g., mobile check-in, self-service kiosks, Schengen and non-Schengen passengers), and processing time per passenger. According to these structured inputs, analytical calculations are performed, including the computation of arrival and service rates, the number of passengers present in the facility, queue lengths, and waiting times. The resulting outputs are then evaluated through a level-of-service assessment according to IATA and LCC criteria. The final step involves storing and visualizing the results in the form of level-of-service indicators for the analyzed facility.
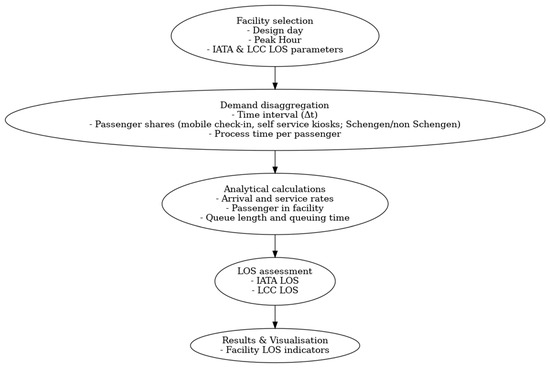
Figure 10.
ATFS workflow.
Figure 11 presents the detailed processing logic for the passenger check-in facility within the ATFS model. The process begins with the definition of input parameters for the check-in facility, including the design day, number of passengers, facility capacities, and IATA and LCC level-of-service parameters. In the next step, passenger arrivals at the check-in facility are modelled by defining arrival profiles, the analysis time interval (Δt), and the processing time per passenger. Based on these modelled arrivals, resource allocation is performed, including the determination of the number of check-in desks, the queuing area, and the distribution of passengers by check-in method (mobile check-in, self-service kiosks, and traditional check-in). Subsequently, queue lengths and space requirements are calculated, including the maximum waiting time, the number of passengers in the queue, and the required space per passenger. In the final step, the LOS is calculated as per spatial indicators and maximum waiting time, in accordance with IATA and LCC criteria.
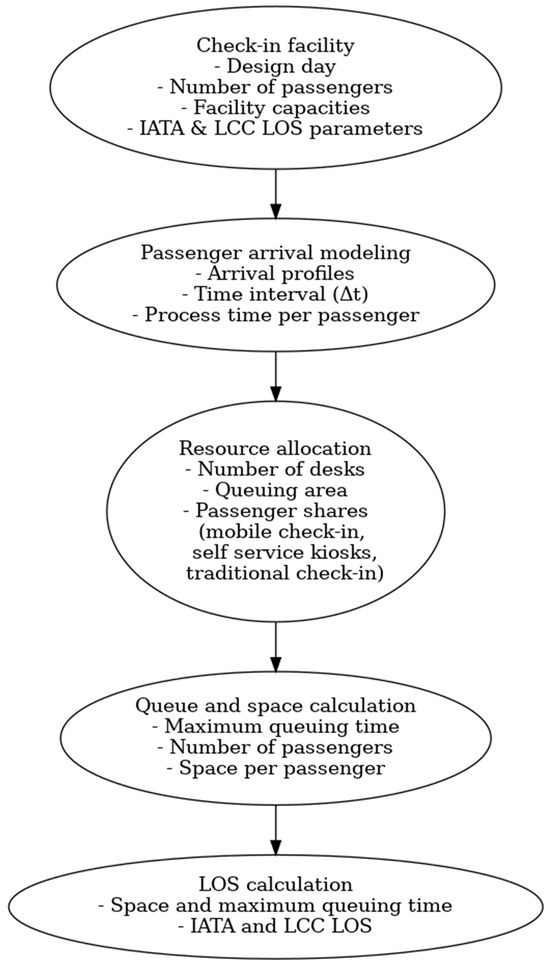
Figure 11.
ATFS workflow for check-in facility.
AFTS can calculate and provide various scenario cases for each airport terminal facility regarding its capacity and level of service, and it was used to generate scenarios for each of eleven airport terminal facilities, at the case-study airport, i.e., Pula Airport. Scenarios can calculate and present state of existing airport terminal facilities at Pula Airport by using the IATA LOS guidelines or LCC LOS guidelines and also calculate future requirements of each airport terminal facility at Pula Airport by using IATA LOS guidelines or LCC LOS guidelines.
By calculating and providing different scenarios of airport terminal facilities at an airport passenger terminal, ATFS provides the possibility of capacity and level of service modeling, and possibility of achieving greater efficiency of the passenger terminal altogether. Specifically, ATFS provides possibility for airports with a high ratio of low-cost carriers, to modify and adjust airport terminal facilities according to the requirements of LCCs.
Also, ATFS implements a four-scenario structure for every facility (existing-IATA, existing-LCC, future-IATA, future-LCC), which directly quantifies the implications of adopting LCC-specific LOS optimum for both current operations and future traffic growth. This scenario-based design is not commonly present in existing airport-terminal models, which typically analyze single scenarios or require manual re-parameterization to compare alternatives.
As for the operating method itself, ATFS embeds a set of deterministic capacity and LOS formulas that combine spatial and temporal parameters (space per passenger, maximum waiting time, seat ratios, passenger/visitor dwell times, check-in channel shares, Schengen/non-Schengen and LCC/FSC splits). This allows planners to represent LCC-specific processing patterns systematically, rather than implicitly adjust generic LOS ranges.
To enhance the practical relevance of the ATFS, an explanation is provided regarding its integration into standard airport-planning workflows. ATFS is structured as a modular system comprising a web-based user interface, a back-end computation engine, and a dedicated database, which enables transparent processing of spatial–temporal LOS parameters and capacity formulas for all terminal facilities. As all inputs and outputs are exchanged in tabular formats, the software can be seamlessly linked with demand-forecasting spreadsheets commonly used in early planning stages, as well as with BIM platforms that require area, queueing, and capacity specifications for geometric modelling. In conceptual and preliminary design phases, ATFS supports rapid sizing by determining required areas and numbers of processing units under both IATA and LCC LOS guidelines. The resulting scenarios can be transferred to BIM environments as boundary conditions for more detailed spatial layout development. Furthermore, ATFS outputs serve as consistent initial capacity parameters for dynamic simulations, including microsimulation or agent-based modelling of passenger flows. Future development may include API-based data exchange that would enable automatic synchronization with BIM and simulation tools, thereby further strengthening the applicability of ATFS within contemporary airport-planning practice.
3.4. Data Collection
Pula Airport is one of Croatia’s nine international airports, situated in the southwest of Istria, within the municipality of Ližnjan, approximately 8.6 km from Pula’s city center. The airport has a long history linked to both military and civil aviation in the region. Major development occurred in the 1970s, marked by the expansion of facilities and a rise in passenger traffic, particularly during the summer tourist season, which brought more flights and larger aircraft and prompted further modernization. In the late 1990s, traffic grew significantly and the passenger profile shifted. Since 2000, investments in infrastructure, terminal upgrades, and security improvements have increased, along with a broader network of European destinations [47,51].
Today, Pula Airport aims to expand and modernize to support growing international traffic. It is also becoming a popular hub for low-cost airlines [59], which is one of the reasons why it was selected as the case-study airport.
All necessary data regarding special-temporal parameters of airport terminal facilities were collected at Pula Airport, for the purpose of conducting the case study for this research [47,50,51].
4. Results of the Case Study—ATFS Scenarios for Pula Airport
This chapter presents ATFS scenarios of calculating the level of service (LOS) and planning the future requirements for airport terminal facilities at the case-study airport, i.e., Pula Airport.
Airport terminal facilities for departure include public departure hall, check-in desk for passengers and baggage, check-in self-service kiosk, boarding-pass control, security control, emigration control and gate holdrooms. Airport terminal facilities for arrival include immigration control, baggage reclaim, customs control, and public arrival hall. Each airport terminal facility was calculated by using ATFS which can show four different scenarios.
First scenario shows the ATFS LOS calculation in the existing facility at Pula Airport by applying IATA LOS guidelines. Second scenario shows the ATFS LOS calculation in the existing facility at Pula Airport by applying new LCC LOS guidelines. Third scenario shows the ATFS LOS calculation for future facility requirements at Pula Airport by applying IATA LOS guidelines. Fourth scenario shows the ATFS LOS calculation for future facility requirements at Pula Airport by applying new LCC LOS guidelines. All obtained results are presented and explained for each scenario case.
In this chapter, four scenario cases are presented for one airport terminal facility—check-in desk for passengers and baggage at Pula Airport, including level of service for existing state of the facility calculated according to IATA LOS and LCC LOS guidelines, and for future facility requirements according to IATA LOS and LCC LOS guidelines. IATA and LCC LOS guidelines are presented in Table 1 and Table 2. Calculations for this facility are conducted in ATFS according to Section 3.2.2. Obtained results are explained for each scenario case.
In each scenario the area colored with grey represents the input area, and green one represents the output area. The calculated level of service (LOS) is marked with four symbols, namely, for “over-design” level ( ), “optimum” level (
 ), sub-optimum level (
 ), and “under-provided” or “unacceptable” level (
 ).
).
), “optimum” level (), sub-optimum level (), and “under-provided” or “unacceptable” level ().All other scenario results for all airport terminal facilities, i.e., public departure hall, check-in self-service kiosk, boarding-pass control, security control, emigration control, gate holdrooms, immigration control, baggage reclaim, customs control, and public arrival hall, are presented in the Appendix A.
- Scenario 1—Existing Facility at Pula Airport—IATA LOS guidelines
The following section describes the functionality and output of the core ATFS tool, using the check-in facility as an illustrative example. A detailed explanation of the content displayed in this example is provided.
Figure 12 shows the ATFS user interface for analyzing the LOS of the traditional passenger check-in facility. In the upper part of the interface, reference LOS guidelines for FSC and LCCs are displayed, based on spatial criteria and maximum waiting time. This section also allows the user to select the LOS calculation methodology (IATA or LCC) and the type of analysis, distinguishing between the assessment of existing facility conditions and the dimensioning of future capacities. The lower part of the interface is divided into input and output areas. On the left, the input parameters are shown, including passenger shares by check-in type, processing times, passenger volumes for different time intervals, and the number of check-in desks. On the right, the analysis results are presented, such as maximum waiting times, queue sizes, spatial requirements, and the overall level of service. The figure illustrates the integrated approach of ATFS in linking input data, LOS guidelines, and analytical results within a unified user interface. Finally, Figure 12 shows the ATFS calculation of LOS for check-in desk for passengers and baggage, according to the IATA LOS guidelines, using the input data of Pula Airport, i.e., the defined area of the facility (525.5 m2) and the number of check-in desks (16), and with the assumption 100% desk utilization. To calculate QMAX, the largest MQT needs to be selected, in this case 13 min. This scenario does not consider the share of Common Use Self-Service (CUSS) and mobile phone usage.
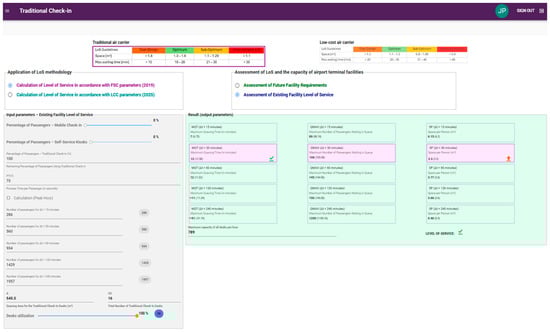
Figure 12.
ATFS—LOS of the existing facility of check-in desk for passengers and baggage as per IATA LOS guidelines.
If it is assumed that the processing time is 73 s per passenger, maximum number of passengers in the queue (QMAX) is 166 passengers which represents an “optimum” LOS, and the space per passenger (SP) is 3.3 m2, which according to IATA LOS guidelines represents an “over-design” LOS level. Total LOS level is “optimum”, as shown by ATFS in the lower right corner.
With the results of the space per person and the maximum waiting time in the queue, this facility can be assessed also by using the LOS matrix (Table 3).
- Scenario 2—Existing Facility at Pula Airport—LCC LOS guidelines
Case 1
Figure 13 shows the ATFS calculation of LOS for check-in desks for passengers and baggage, according to the LCC LOS guidelines, using the same input data of Pula Airport.
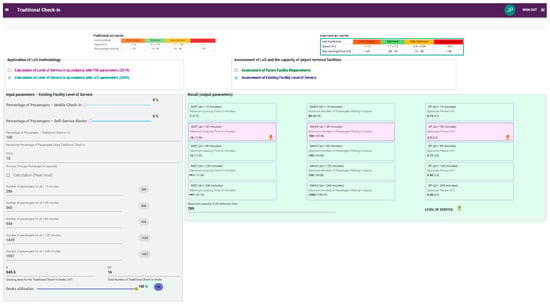
Figure 13.
ATFS—LOS of the existing facility of check-in desk for passengers and baggage as per LCC LOS guidelines (case 1).
Results show that maximum number of passengers in the queue (QMAX) is 166 passengers which represents an “over-design” LOS, and the space per passenger (SP) is 3.3 m2, which according to LCC LOS guidelines represents an “over-design” LOS level. Total LOS level is “over-design”, as shown by ATFS in the lower right corner.
Case 2
Figure 14 shows the case where the processing time per passenger is also 73 s, but now the new assumption is included where 30% of passengers check in via mobile phone and 30% via CUSS or Internet kiosk. In this case total LOS level is also “over-design”, as shown by ATFS in the lower right corner.
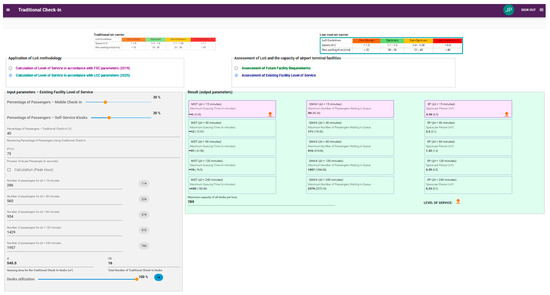
Figure 14.
ATFS—LOS of the existing facility of check-in desk for passengers and baggage as per LCC LOS guidelines (case 2).
From both cases it is clear that Pula Airport has is no need for such a large area to accommodate 16 check-in desks, primarily if it is taken into account that passengers are increasingly using other methods of check-in (online, CUSS), and LCC LOS guidelines are applied. At the same time, this extra space can be used to accommodate a larger number of passengers in the future.
- ATFS display of passenger movements during the designed day
Figure 15 shows ATFS function to display the movement of passengers during the design day (specifically 27 July 2019) with a display of the LOS levels, i.e., “over-design”, “optimum”, “sub-optimum”, “under-provided”, shown on the left side of the Figure. From this display, it is evident that the available capacity is at its maximum from 9:00 a.m. to 10:00 a.m. and from 5:00 p.m. to 7:00 p.m.
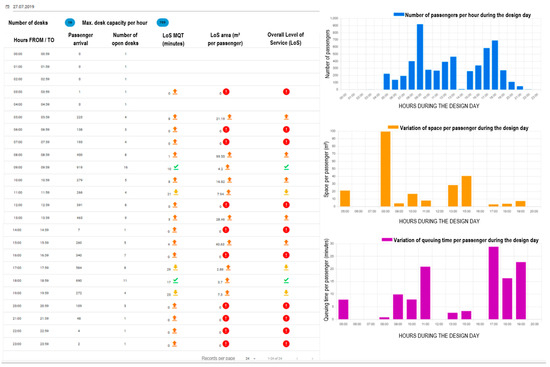
Figure 15.
ATFS—Display of passenger movements during the design day with display of the level of service in the facility of check-in for passengers and baggage.
On the right side of Figure 15, the graphs show the number of passengers per hour during the design day (top graph), the variation in space per passenger during the design day (middle graph), and the variation in queuing time per passenger during the design day (bottom graph).
- Scenario 3—Future Facility Requirements at Pula Airport—IATA LOS guidelines
Figure 16 shows the ATFS calculation of the number of check-in desks (CD), maximum number of passengers in queue (QMAX), and total area of the facility for waiting in queue (A), according to IATA LOS guidelines. According to IATA LOS guideline, LOS “optimum” values of MQT is 15 min, and SP is 1.5 m2. To calculate QMAX and A, it is necessary to choose the largest calculated number of units (check-in desks). This scenario implies that all passengers check in for the flight through the check-in desk (100% of passengers), and the processing time per passenger takes 73 s. Results show that the total number of check-in desks (CD) is 16, maximum number of passengers in queue (QMAX) is 187 passengers, and total area of the facility for waiting in queue (A) is 281 m2.
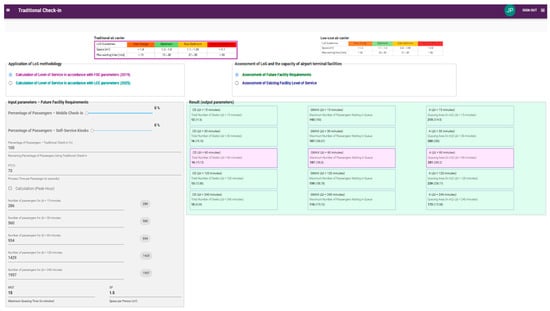
Figure 16.
ATFS—Future facility requirements of check-in desk for passengers and baggage as per IATA LOS guidelines in terms of number of check-in desks, maximum number of passengers in queue, and total area for waiting in the queue.
- Scenario 4—Future Facility Requirements at Pula Airport—LCC LOS guidelines
Case 1
Figure 17 shows the ATFS calculation of the number of check-in desks (CD), maximum number of passengers in queue (QMAX), and total area of the facility for waiting in queue (A), according to LCC LOS guidelines. According to LCC LOS guideline, LOS “optimum” values of MQT is 25 min, and SP is 1.2 m2. To calculate QMAX and A, it is necessary to choose the largest calculated number of units (check-in desks). This case implies that all passengers check in for the flight through the check-in desk (100% of passengers), and the processing time per passenger takes 73 s. Results show that the total number of check-in desks (CD) is 14, maximum number of passengers in queue (QMAX) is 275 passengers, and total area of the facility for waiting in queue (A) is 330 m2.
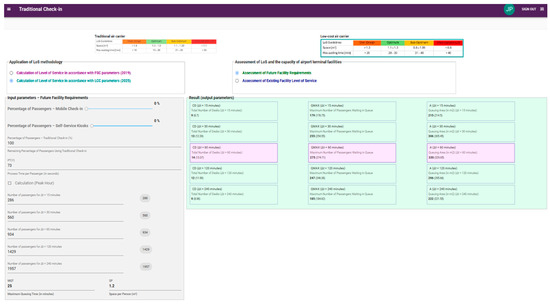
Figure 17.
ATFS—Future facility requirements of check-in desk for passengers and baggage as per LCC LOS guidelines in terms of number of check-in desks, maximum number of passengers in queue, and total area for waiting in the queue (case 1).
From this case shown in Figure 17, with the aim of achieving optimal LOS according to the LCC LOS guidelines, there is a possibility of increased passenger demand in the future, given the required area of 330 m2. The existing total check-in area with traditional check-in desk (545.50 m2) can also be reconfigured for other purposes, such as adding commercial facilities, implementing a certain number of CUSSs or expanding other facilities such as security control for passengers and hand baggage.
Case 2
Figure 18 shows the ATFS calculation of the number of check-in desks (CD), maximum number of passengers in queue (QMAX), and total area of the facility for waiting in queue (A), according to LCC LOS guidelines. According to LCC LOS guideline, LOS “optimum” values of MQT is 25 min, and SP is 1.2 m2. To calculate QMAX and A, it is necessary to choose the largest calculated number of units (check-in desks). This case implies that 40% of passengers check in for the flight through the check-in desk, and the processing time per passenger takes 73 s. This case also implies a certain percentage of passengers checking in for their flight via mobile phones and self-service kiosks (30%), which is in line with the LCC policy. Results show that the total number of check-in desks (CD) is 6, maximum number of passengers in queue (QMAX) is 110 passengers, and total area of the facility for waiting in queue (A) is 132 m2. Hence, savings can be made in the number of check-in desks and total area of the facility. Compared to the first case, 8 fewer check-in desks are required, and it is possible to reduce the total area by 40% or 198 m2.
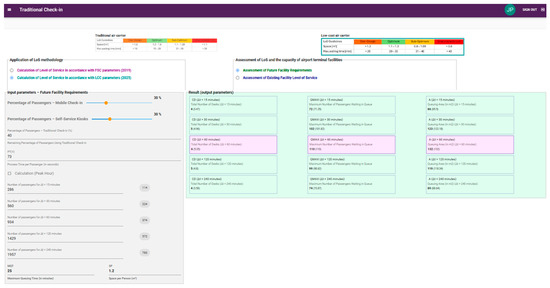
Figure 18.
ATFS—Future facility requirements of check-in desk for passengers and baggage as per LCC LOS guidelines in terms of number of check-in desks, maximum number of passengers in queue, and total area for waiting in the queue (case 2).
Case 3
Figure 19 shows a case that relates to the fundamental characteristic of LCCs, which states that LCCs require shorter aircraft turnaround times and therefore a shorter MQT of 15 min is proposed. Other input data are the same as in the previous case. The results of the case show that the number of required desks is 7 to process 75 passengers, in an area of 90 m2.
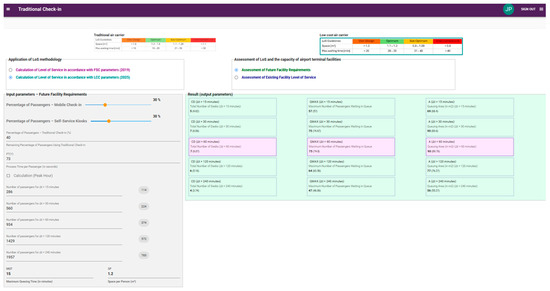
Figure 19.
ATFS—Future facility requirements of check-in desk for passengers and baggage as per LCC LOS guidelines in terms of number of check-in desks, maximum number of passengers in queue, and total area for waiting in the queue (case 3).
To ensure the consistency of the model, it was verified through several complementary procedures. First, all equations used in the model were checked against reference calculation examples from the IATA ADRM, confirming that the mathematical structure correctly implements standard procedures for terminal facility dimensioning. Furthermore, ATFS was tested on a series of selected scenarios in which hand-calculated capacity estimates were compared with software outputs, showing complete alignment of results. It was also verified that changes in key input parameters, such as processing times or seat ratios, lead to expected adjustments in required capacities and levels of service, thereby confirming the logical stability of the model.
Validation was conducted by comparing the modelled results with observed conditions at Pula Airport during peak operational days. Terminal functions identified by ATFS as potential bottlenecks or as over-dimensioned corresponded closely with staff observations, including instances of congestion and areas of reduced utilization. As detailed time-stamped records are not available, formal statistical validation is not currently feasible; however, the available empirical observations support the consistency and reliability of the model within a real operational environment.
5. Modification Proposal of the Airport Terminal Facilities of the Case-Study Airport Based on ATFS Scenarios
By using the newly developed ATFS (Airport Terminal Facilities Software) for calculating capacity and level of service quality, calculations were performed for the airport terminal facilities for both departure and arrival, at the case-study airport, i.e., Pula Airport. These calculations covered the existing facilities and future facilities’ requirements of the Pula Airport passenger terminal.
According to the scenarios developed for assessing the terminal’s capacity and level of service, multiple conclusions were reached. In the public departure area, dimensioning based on LCC guidelines shows a need for an additional 200 m2 of space. For passenger and baggage traditional check-in, the application of new LCC guidelines and the introduction of an optimal share of CUSS and online check-in options enable significant savings in both required space and staffing, i.e., more than 50%, depending on the scenario. The space currently intended for traditional check-in can therefore be reassigned to other uses, such as commercial facilities, CUSS installation, or expanding other facilities such as security control. Since ATFS allows number of passengers and area to be entered as input parameters, special calculations can be carried out for LCC and FSC passengers in accordance with predicted shares of airline business models, which in case of Pula Airport predicts that LCCs will account for 70% of passengers in the near future. Using these shares as input into the software, more refined results can be obtained for the required number of desks or security lanes for each passenger category, with the same logic applicable to all other airport terminal facilities.
For boarding pass control, the required area can be significantly reduced to only 10 m2, compared to the current 135.63 m2. In the security control area, a lack of capacity has been identified, requiring an increase in the number of lanes and X-ray machines. Pula Airport will need to enlarge the passenger accommodation area at this facility. One proposal is to repurpose or reduce the area dedicated to traditional check-in and boarding pass control, since calculations show that these functions require much less space than currently allocated. This would provide additional space to expand the area for passengers waiting during security control.
In the emigration control area, space can also be reduced, depending on the share of Schengen and non-Schengen passengers. The ATFS allows these parameters to be entered, enabling more accurate planning of the required space and staffing.
For gate holdrooms, scenarios using new LCC guidelines indicate savings of nearly 20% in the required space, which can be repurposed for commercial facilities such as self-service kiosks, which are increasingly common in low-cost terminals. Applying new LCC guidelines to standing areas yields approximately 20% increase in the number of standing passengers that can be accommodated, and 17% savings in required area. For seated areas, the required space per seat remains unchanged, since seat dimensions are uniform across all airline business models. Additionally, gate holdrooms can also be segmented between LCC and FSC passengers, which is especially relevant given the expected 70% LCC share in the coming years.
Table 4 shows an example of the sensitivity analysis of key variables influencing number of accommodated passengers in gate holdrooms at Pula Airport. Input variables “seating area” and “standing area” are expressed in m2 and are determined by the airport operator’s decision. “Space per seated passenger” is also expressed in m2 and cannot be less than 1.8 m2 for optimal LOS level. “Space per standing person” is expressed in m2 and can be modified to satisfy needs of specific airline business model, i.e., in this case LCC. Hence, this is the variable that can be adjusted, and according to new LCC LOS guidelines it varies from 1.0 to 1.2 m2 for optimal LOS level. As depicted in Table 4, variable “Space per standing person” impacts the “Number of standing passengers”, and by applying lower limit of optimal LOS level (according to LCC guidelines), i.e., 1.0 m2, it can increase the number of standing passengers up to 85 more passengers, or up to maximum of 20% compared to results when IATA LOS guidelines are being applied.
Table 4.
Sensitivity analysis of key variables influencing number of accommodated passengers at gate holdrooms at Pula Airport.
Table 5 shows an example of the sensitivity analysis of key variables influencing required area of gate holdrooms at Pula Airport. Input variables “demand” which represents number of passengers. “Space per seated passenger” is expressed in m2 and cannot be less than 1.8 m2 for optimal LOS level. “Space per standing person” is also expressed in m2 and can be modified to accommodate needs of specific airline business model, i.e., in this case LCC. Hence, this is the variable that can be adjusted, and according to new LCC LOS guidelines it varies from 1.0 to 1.2 m2 for optimal LOS level. Variable “seat ratio” is the ratio between seated and standing passengers, expressed in percentage, and according to new LCC LOS guidelines it varies from 30 to 50% for optimal LOS level. As depicted in Table 5, variable “seat ratio” impacts the “number of seated passengers” and “required area”, and by applying lower limit of optimal LOS level (according to LCC guidelines), i.e., 1.0 m2, and various values of “seat ratio” it can produce a significant savings in required gate holdrooms’ area, up to maximum of 17%, compared to results when IATA LOS guidelines are being applied.
Table 5.
Sensitivity analysis of key variables influencing required area of gate holdrooms at Pula Airport.
For immigration control, required space can be reduced based on the Schengen and non-Schengen passenger ratio. The application also allows these parameters to be included. In baggage reclaim, applying the new LCC LOS guidelines reduces the required space per passenger by 0.2 m2 and saves 8 m of required carousel length. If segmentation of passengers is implemented within the terminal and considering that two carousels are available, one could be assigned to FSC and the other to LCC passengers, with areas adjusted according to IATA and LCC standards. Customs control requires significantly less space than currently allocated, allowing this area to be repurposed. In the public arrival hall, applying the new LCC guidelines brings a 13% reduction in required space.
Table 6 shows an example of the sensitivity analysis of key variables influencing required area of public arrival hall at Pula Airport. “Space per standing person” can be modified to accommodate needs of specific airline business model, i.e., in this case LCC. Hence, this is the variable that can be adjusted, and according to new LCC LOS guidelines it varies from 1.7 to 2.0 m2 for optimal LOS level. Variable “seat ratio”, expressed in percentage, can also be modified, and according to new LCC LOS guidelines it varies from 10 to 15% for optimal LOS level. As depicted in Table 6, variable “seat ratio” impacts the “number of persons in the public arrival hall” and “required area”, and by applying lower limit of optimal LOS level (according to LCC guidelines), i.e., 1.7 m2, and various values of “seat ratio” it can produce a significant savings in required area of public arrival hall, up to maximum of 13%, compared to results when IATA LOS guidelines are being applied.
Table 6.
Sensitivity analysis of key variables influencing required area of public arrival hall at Pula Airport.
The key advantages of the ATFS are reflected in the ability to model airport terminal capacity specifically for low-cost carriers, thereby increasing airport terminal efficiency according to LCC requirements. By applying normative diversification to determine level of service, airport terminal facilities can be optimally utilized according to the specific needs of different airline business models operating within the airport terminal.
A proposal for modifications to each airport terminal facility of the Pula Airport passenger terminal is provided in Table 7.
Table 7.
Modification proposals of the airport terminal facilities at Pula Airport.
6. Discussion and Conclusions
The findings of this study demonstrate how applying newly developed LOS guidelines for LCC operations can significantly reshape the assessment and planning of airport terminal facilities. Previous research has emphasized that passenger terminal performance is determined by complex interactions between infrastructure, technology, passenger behavior, and airline business models. Processing times, walking speeds, passenger discretionary time, check-in methods, spatial configuration, and queue formation dynamics have been repeatedly recognized as main contributors to LOS outcomes. Yet, traditional standards defined by the IATA ADRM were created for a generic passenger profile and often align more closely with the requirements of traditional air carriers (FSCs). The results of this research confirm that a uniform application of these standards may lead to unnecessary or misaligned capacity assessments in airport terminals dominated by LCCs.
The application of newly developed LCC LOS guidelines within the Airport Terminal Facilities Software (ATFS) reveals substantial differences in space and equipment requirements when compared to existing IATA-based LOS standards. LCC operations prioritize efficiency, quick processing, and lean infrastructure; passengers typically expect fewer amenities and demonstrate greater tolerance for simplified services. The evaluation of Pula Airport provides evidence of these distinctions. For example, the public departure hall under both existing and future scenarios remains classified as “under-provided” when assessed according to IATA LOS metrics, yet adopting LCC LOS guidelines reduces the required future expansion from 614 m2 to 533 m2, creating a 13% spatial saving without compromising service performance. This indicates that the IATA standards may overestimate comfort and space needs for LCC environments, whereas LCC LOS guidelines allow terminals to determine necessary capacity more realistically according to airline business model they serve (in this case LCCs).
The check-in airport terminal facility further shows the operational implications of adopting LCC LOS guidelines. In scenarios where a significant proportion of passengers use self-service or online check-in methods, which is typical for LCC passengers, the number of required traditional check-in desks decreases by more than 50%, and the area required for queuing drops by up to 40% in some cases. These reductions have substantial planning implications, i.e., space previously allocated to traditional check-in can be reassigned for commercial facilities, or security processing, or the installation of additional self-service kiosks. Such reallocations align with global best practices, which highlight that LCC passengers often value quick processing over large waiting areas, and airports benefit financially from repurposing unused spaces toward revenue-generating facilities.
Results regarding security control facility also highlight the importance of adjusting LOS standards to passenger characteristics. The analysis shows that the current configuration at Pula Airport requires an increase in the number of security lanes and X-ray machines to meet even the LCC LOS optimum, with findings indicating that LCC passengers may require more time due to higher volumes of hand baggage. Importantly, the study proposes segmenting security lanes according to FSC or LCC passengers, i.e., three lanes for LCC passengers and one to FSC passengers, reflecting their differing baggage profiles and processing times. This recommendation confirms earlier research that calls for differentiated resource allocation in processing facilities and supports the argument that uniform LOS standards fail to capture different behavioral features among airline business models.
Other airport terminal facilities analyzed by ATFS show that applying LCC-based LOS guidelines often generates substantial savings in required space and equipment. For example, gate holdrooms designed under LCC LOS guidelines require 20% less area compared with IATA LOS, due to a reduced seat ratio of 30% appropriate for LCC passengers rather than the 50% assumed by IATA. Similarly, immigration, customs, and public arrival hall facilities display patterns in which LCC LOS either confirms that current areas are sufficient or allows significant reductions without degrading service quality. In some cases, such as customs control, ATFS identifies “over-design” that allow space to be reconfigured to other operational or commercial functions. The public arrival hall analysis also suggests that the existing facility at Pula Airport already meets optimum LOS conditions under LCC LOS guidelines, with future requirements showing a 13% reduction in space compared with IATA LOS.
These findings point to an important shift in airport terminal planning philosophy. As LCC traffic continues to grow, i.e., 70% of LCC passengers are expected at Pula Airport in the near future, the adoption of LCC LOS guidelines becomes crucial for efficient airport terminal operations. This research validates the hypothesis that applying FSC-oriented LOS guidelines to LCC operations leads to systematic inefficiencies. The results further confirm that airport terminal facilities can be optimized while maintaining acceptable level of service, supporting earlier arguments that LOS should be defined according to specific airline business model.
The development and application of ATFS introduces a tool that not only quantifies the differences between low-cost and traditional air carriers but also operationalizes them through scenario-based planning.
To further highlight the academic contribution of the study, a comparison of the methodological and conceptual innovations of the ATFS relative to existing tools and studies is provided. For example, commercial simulation platforms such as CAST Terminal/CAST Express or AnyLogic-based airport models provide powerful dynamic simulations of passenger flows but require specialized expertise and typically rely on user-defined or IATA-based LOS targets rather than built-in LCC-specific LOS guidelines. Recent agent-based and AI-based decision-support tools for airport terminals likewise focus on dynamic crowd management and stochastic flows, but do not offer a compact, LOS-matrix-based facility dimensioning environment specifically designed for LCC-dominant airports. It is important to emphasize that ATFS is intended as a complementary, computationally light planning tool that bridges the gap between high-level LOS guidelines and complex microsimulation by providing an easy-to-use, scenario-based framework for sizing and reconfiguring terminal facilities under different airline business-model assumptions.
In this context, ATFS complements existing simulation-based approaches by enabling rapid, transparent evaluation of terminal layouts and operational scenarios using an explicit analytical LOS framework designed for LCC operations. While future extensions will incorporate statistical analysis and sensitivity testing, the current design already provides a robust and computationally efficient decision-support tool that bridges the gap between LOS guidelines and complex microsimulation in academic and practical airport planning.
Pula Airport is representative for the analysis because it exhibits characteristics typical of a broad group of small to medium-sized European secondary airports. It is marked by a strongly seasonal demand profile, with summer months generating high operational loads, a pattern common to many tourism-oriented airports. In addition, the share of LCCs in Pula is steadily increasing, and the terminal simultaneously handles Schengen and non-Schengen flows, reflecting the operational complexity found in numerous European regional airports. This combination of traffic and infrastructural features makes it a suitable and relevant context for testing ATFS and for analyzing the effects of LCC LOS guidelines on terminal capacity sizing.
Although the numerical results are specific to Pula, the methodological framework of ATFS, the LOS equations and the LCC LOS guidelines are designed to be transferable to other contexts, provided that local operational parameters are appropriately adjusted. In this way, the case study offers a valid demonstration of the model, while the methodology itself maintains broad applicability and adaptability.
With respect to the temporal relevance of the input data, the design-day traffic profile from 2019 was selected as a reference pre-pandemic year due to the full availability, consistency, and reliability of operational data, without significant disruptions in traffic flows. Subsequent years exhibit significant deviations caused by the COVID-19 pandemic, temporary regulatory measures, and changes in passenger behavior, making 2019 a stable baseline for model calibration. Importantly, the ATFS methodology is not limited to 2019 conditions. It is designed as a flexible, parametric analytical tool that can be directly applied to post-pandemic and future demand profiles by updating input data, including scenarios reflecting altered arrival patterns, increased adoption of self-service technologies, and potentially modified security control procedures. To ensure temporal relevance, the 2019 design-day data are linked with more recent traffic demand and airline business model forecasts developed in the authors’ previous research, which already incorporate post-pandemic trends and indicate a further increase in the share of LCC passengers.
Applying ATFS to additional airports is foreseen as an important direction for future research. The planned next steps include calibrating and testing ATFS in airports with diverse traffic and operational profiles, including larger international hubs, non-European LCC bases and airports operating under different regulatory environments. Such applications will make it possible to examine whether similar patterns of space savings and capacity adjustments emerge as those observed in Pula, thereby strengthening the generalizability and robustness of the model.
An important advantage of the software is that ATFS is built as a modular system, enabling straightforward integration of new airports by inputting their specific demand data, processing times and operational assumptions. This architecture greatly facilitates future validation studies across different airports, as the model can be adapted to varied traffic and infrastructural contexts without requiring changes to the underlying methodology.
From an innovative perspective, the results demonstrate that the application of universal IATA standards leads to structural inefficiencies in LCC-dominant airports. The approach presented in this paper enables adaptive planning based on user (passenger) profiles, which represents a paradigm shift in airport design. The study introduces a new logic for airport planning based on operational segmentation, demonstrating that universal standards are not optimal in all contexts. This approach enables new research directions in flexible planning, airport economics, and airline-business-model-oriented modeling, representing the core innovation of the study.
Nevertheless, some limitations should be acknowledged. While ATFS incorporates extensive operational variables such as processing times, seat ratios, arrival patterns, and queuing capacities, it inherently simplifies complex passenger behaviors and may not fully capture stochastic variability present in real-world operations. Future versions or upgrades could integrate microsimulation or agent-based modeling to allow richer representation of dynamic passenger flows. Also, the case study covers one airport, i.e., Pula Airport, that shows ATSF applicability, which is comprehensive, but may require additional calibration for larger or more complex airports. Finally, the LCC LOS guidelines themselves, although grounded in expert assessment and empirical evidence, may benefit from further development through multi-airport benchmarking or large-scale passenger surveys incorporating behavioral, cultural, and demographic factors.
Future research should also explore how evolving technologies such as biometric processing, automated border control, remote bag-drop facilities, and AI-based security screening, interact with LCC-specific requirements. As digital transformation continues to shape passenger processing, updated LOS parameters may be needed to reflect new processing times, reduced queueing, or changing passenger preferences. Furthermore, integration of the ATFS tool with airport operations databases or demand forecasting systems could enhance its predictive capabilities and strengthen its utility for long-term airport terminal planning.
In conclusion, this study demonstrates that LCC LOS guidelines, when embedded within an adaptable computational framework such as ATFS, provide a more accurate and efficient method for assessing and planning airport terminal facilities in LCC-dominant environments. By comparing traditional IATA LOS guidelines with newly developed LCC LOS guidelines among different airport terminal facilities, the research highlights opportunities for substantial space savings, improved efficiency, and more effective resource allocation. For airports like Pula Airport, where LCC share continues to increase, adopting these guidelines enables more realistic facility dimensioning, supports future growth, and reduces costs. The approach, methodology, developed software and case-study results shown in this study provide useful guidance for LCC-dominant airports around the world aiming to align their airport terminal facilities with LCC operating requirements.
Author Contributions
Conceptualization, J.P.; methodology, J.P.; software, J.P.; validation, J.P. and D.B., formal analysis, J.P.; investigation, J.P.; resources, J.P.; data curation, J.P.; writing—original draft preparation, J.P. and D.B.; writing—review and editing, J.P. and D.B.; visualization, J.P.; supervision, J.P. All authors have read and agreed to the published version of the manuscript.
Funding
This research received no external funding.
Institutional Review Board Statement
Not applicable.
Informed Consent Statement
Not applicable.
Data Availability Statement
Data supporting reported results can be found in this paper. Data were gathered and analyzed via means and methods described in this paper.
Acknowledgments
Special gratitude goes to the Pula Airport staff who provided necessary data to conduct this research.
Conflicts of Interest
The authors declare no conflicts of interest.
Abbreviations
The following abbreviations are used in this manuscript:
| ADRM | Airport Development Reference Manual |
| AHP | Analytic Hierarchy Process |
| ASQ | Airport Service Quality |
| ATFS | Airport Terminal Facilities Software |
| CEM | Customer Experience Management |
| CUSS | Common Use Self-Service |
| EU | European Union |
| FSCs | Full-Service Carriers |
| FSNCs | Full-Service Network Carriers |
| IATA | International Air Transport Association |
| LCCs | Low-Cost Carriers |
| LCT | Low-Cost Terminal |
| LOS | Level of Service |
| SSCP | Security Screening Check Point |
| WTMD | Walk-Through Metal Detector |
Appendix A
This appendix presents ATFS scenarios of calculating the level of service (LOS) and planning the future requirements for all airport terminal facilities at the case-study airport, i.e., Pula Airport.
Appendix A.1. Airport Terminal Facilities—Departure
Airport terminal facilities for departure include public departure hall, check-in desk for passengers and baggage, check-in self-service kiosk, boarding-pass control, security control, emigration control and gate holdrooms. Each airport terminal facility was calculated by using ATFS which can show four different scenarios. First scenario shows the ATFS LOS calculation in the existing facility at Pula Airport by applying IATA LOS guidelines. Second scenario shows the ATFS LOS calculation in the existing facility at Pula Airport by applying new LCC LOS guidelines. Third scenario shows the ATFS LOS calculation for future facility requirements at Pula Airport by applying IATA LOS guidelines. Fourth scenario shows the ATFS LOS calculation for future facility requirements at Pula Airport by applying new LCC LOS guidelines. All obtained results are presented and explained for each scenario case.
Appendix A.1.1. Public Departure Hall
Four scenario cases are presented for airport terminal facility—public departure hall at Pula Airport, including level of service for existing state of the facility calculated according to IATA LOS and LCC LOS guidelines, and for future facility requirements according to IATA LOS and LCC LOS guidelines. IATA and LCC LOS guidelines are presented in Table 1 and Table 2. Calculations for this facility are conducted in ATFS according to 3.2.1. Obtained results are explained for each scenario case.
- Scenario 1—Existing Facility at Pula Airport—IATA LOS guidelines
Figure A1 shows the LOS calculation of public departure hall according to IATA LOS guidelines, in terms of space per seated person in m2. According to the calculation in ATFS, the total LOS level is “under-provided” or “unacceptable”.

Figure A1.
ATFS—LOS of the existing facility of public departure hall as per IATA LOS guidelines.
Figure A1.
ATFS—LOS of the existing facility of public departure hall as per IATA LOS guidelines.

- Scenario 2—Existing Facility at Pula Airport—LCC LOS guidelines
Figure A2 shows the LOS calculation of public departure hall according to LCC LOS guidelines, in terms of space per seated person in m2. According to the calculation in ATFS, an increase in space per seated person is visible but the total LOS level is still “under-provided” or “unacceptable”.

Figure A2.
ATFS—LOS of the existing facility of public departure hall as per LCC LOS guidelines.
Figure A2.
ATFS—LOS of the existing facility of public departure hall as per LCC LOS guidelines.

- Scenario 3—Future Facility Requirement at Pula Airport—IATA LOS guidelines
Figure A3 shows the ATFS calculation of the total number of persons in public departure hall and the size of the public departure hall, according to IATA LOS guidelines. As per calculation, total public departure hall area is 614 m2 and number of persons in public departure hall amounts to 312 persons.

Figure A3.
ATFS—Future facility requirements of public departure hall as per IATA LOS guidelines in terms of total public departure hall area and number of persons in public departure hall.
Figure A3.
ATFS—Future facility requirements of public departure hall as per IATA LOS guidelines in terms of total public departure hall area and number of persons in public departure hall.

- Scenario 4—Future Facility Requirement at Pula Airport—LCC LOS guidelines
Figure A4 shows the ATFS calculation of the total number of persons in public departure hall and the size of the public departure hall, according to LCC LOS guidelines. As per this calculation, total number of persons in public departure hall is also 312 persons and the total public departure hall area is 533 m2, which shows a significant saving of 13% compared to the dimensioning of this space according to the IATA LOS guidelines.

Figure A4.
ATFS—Future facility requirements of public departure hall as per LCC LOS guidelines in terms of total public departure hall area and number of persons in public departure hall.
Figure A4.
ATFS—Future facility requirements of public departure hall as per LCC LOS guidelines in terms of total public departure hall area and number of persons in public departure hall.

Hence, according to the results of Scenario 3 and 4, the public departure hall at Pula Airport needs to be expanded, as the currently used area (i.e., 330 m2) for this facility is insufficient. Based on the dimensioning in accordance with new LCC LOS guidelines, this area needs to be increased by an additional 200 m2, up to 533 m2.
Appendix A.1.2. Check-in Desk for Passengers and Baggage
For this airport terminal facility—check-in desk for passengers and baggage at Pula Airport, four scenario cases are presented in the Section 4.
Appendix A.1.3. Check-in Self-Service Kiosk
Two scenario cases are presented for airport terminal facility—check-in self-service kiosk at Pula Airport, including level of service for future facility requirements according to IATA LOS and LCC LOS guidelines. IATA and LCC LOS guidelines are presented in Table 1 and Table 2. Calculations for this facility are conducted in ATFS according to Section 3.2.3. Obtained results are explained for each scenario case.
- Scenario 1—Future Facility Requirements at Pula Airport—IATA LOS guidelines
Figure A5 shows the ATFS calculation of the number of check-in self-service kiosks (SS), maximum number of passengers in queue (QMAX), and total area for waiting in the queue (A), according to IATA LOS guidelines. As per calculation, and according to LOS “optimum” values, total number of check-in self-service kiosks (SS) is 7, maximum number of passengers in queue (QMAX) is 8 passengers, and total area for waiting in the queue (A) is 12 m2.

Figure A5.
ATFS—Future facility requirements of check-in self-service kiosk as per IATA LOS guidelines in terms of number of self-service kiosks, maximum number of passengers in queue, and total area for waiting in the queue.
Figure A5.
ATFS—Future facility requirements of check-in self-service kiosk as per IATA LOS guidelines in terms of number of self-service kiosks, maximum number of passengers in queue, and total area for waiting in the queue.

- Scenario 2—Future Facility Requirements at Pula Airport—LCC LOS guidelines
Figure A6 shows the ATFS calculation of the number of check-in self-service kiosks (SS), maximum number of passengers in queue (QMAX), and total area for waiting in the queue (A), according to LCC LOS guidelines. As per calculation, and according to LOS “optimum” values, total number of check-in self-service kiosks (SS) is 7, maximum number of passengers in queue (QMAX) is 18 passengers, and total area for waiting in the queue (A) is 22 m2. This calculation shows the same number of self-service kiosks, but due to the larger number of passengers in line, a slightly larger area will be required, i.e., additional 10 m2.

Figure A6.
Future facility requirements of check-in self-service kiosk as per LCC LOS guidelines in terms of number of self-service kiosks, maximum number of passengers in queue, and total area for waiting in the queue.
Figure A6.
Future facility requirements of check-in self-service kiosk as per LCC LOS guidelines in terms of number of self-service kiosks, maximum number of passengers in queue, and total area for waiting in the queue.

Appendix A.1.4. Boarding-Pass Control
Two scenario cases are presented for airport terminal facility—boarding-pass control at Pula Airport, including level of service for existing state of the facility calculated according to LCC LOS guidelines, and for future facility requirements according to LCC LOS guidelines. LCC LOS guidelines are presented in Table 2. Calculations for this facility are conducted in ATFS according to Section 3.2.4. Obtained results are explained for each scenario case.
- Scenario 1—Existing Facility at Pula Airport—LCC LOS guidelines
Considering that IATA ADRM did not propose guidelines for calculating LOS of this facility, the calculation was made within ATFS at intervals Δt (15, 30, 60, 120 and 240 min), according to LCC LOS guidelines. To calculate QMAX, it is necessary to choose the largest MQT, which in this case is 34 min.
Figure A7 shows the calculation of LOS, using the input data of Pula Airport, i.e., the defined area (135.63 m2) and the number of boarding-pass control units (2), with the assumption that 80% of passengers proceed directly to boarding-pass control after checking in for the flight, while the rest stay with their visitors or use commercial facilities.
If it is assumed that the processing time is 15 s per passenger, maximum number of passengers in the queue (QMAX) is 267 passengers, and the space per passenger (SP) is 0.51 m2, which according to LCC guidelines represents an “under-provided” or “unacceptable” LOS level, which is also shown by ATFS in the lower right corner.
With the results of the space per person and the maximum waiting time in the queue, the facility can be assessed also by using the LOS matrix (Table 3).

Figure A7.
ATFS—LOS of the existing facility of boarding-pass control as per LCC LOS guidelines.
Figure A7.
ATFS—LOS of the existing facility of boarding-pass control as per LCC LOS guidelines.

Given the “under-provided” or “unacceptable” level of service of this facility, it is necessary to consider the possibility of reconfiguration or additional improvements. In order to obtain an “optimum” LOS, it is necessary to simulate various parameters, such as the area of the facility (A) or the number of boarding-pass control units (BP). For example, by reducing the area by almost 100 m2 and increasing the number of boarding-pass control units by one, an “optimum” LOS can be achieved.
- Scenario 2—Future Facility Requirements at Pula Airport—LCC LOS guidelines
Figure A8 shows the ATFS calculation of the number of boarding-pass control units (BP), maximum number of passengers in queue (QMAX), and total area of the facility for waiting in queue (A), according to LCC LOS guidelines. Within the ATFS application, there is also an input regarding passenger percentage that defines how many passengers, on average, go to the boarding-pass control immediately after checking in for a flight, and how many remain in the departure hall area and use commercial facilities for a certain period of time. A percentage of 70 refers to passengers that proceed to the boarding-pass control immediately after check-in. As per calculation, and according to LOS “optimum” values, total number of boarding-pass control units (BP) is 3, maximum number of passengers in queue (QMAX) is 10 passengers, and total area of the facility for waiting in the queue (A) is 9 m2.

Figure A8.
Future facility requirements of boarding-pass control as per LCC LOS guidelines in terms of number of boarding-pass control units, maximum number of passengers in queue, and total area for waiting in the queue.
Figure A8.
Future facility requirements of boarding-pass control as per LCC LOS guidelines in terms of number of boarding-pass control units, maximum number of passengers in queue, and total area for waiting in the queue.

At Pula Airport, the proposal is to reduce the area of the facility and increase the number of boarding-pass control units. The defined area at Pula Airport (135.63 m2) can certainly be reduced or reconfigured for other purposes. One of the proposals is to increase the area for security control of passengers and hand baggage.
Appendix A.1.5. Security Control
Four scenario cases are presented for airport terminal facility—security control at Pula Airport, including level of service for existing state of the facility calculated according to IATA LOS and LCC LOS guidelines, and for future facility requirements according to IATA LOS and LCC LOS guidelines. IATA and LCC LOS guidelines are presented in Table 1 and Table 2. Calculations for this facility are conducted in ATFS according to Section 3.2.5. Obtained results are explained for each scenario case.
- Scenario 1—Existing Facility at Pula Airport—IATA LOS guidelines
Figure A9 shows the ATFS calculation of LOS for security control facility, according to the IATA LOS guidelines, using the input data of Pula Airport, i.e., the defined area (55.76 m2), the number of security control lanes (4), the processing time is 20 s per passenger, and assuming 100% utilization of security lanes. To calculate QMAX, the largest MQT needs to be selected, i.e., 18 min.
Results show that maximum number of passengers in the queue (QMAX) is 214 passengers and the space per passenger (SP) is 0.27 m2, which according to IATA LOS guidelines represents an “under-provided” or “unacceptable” LOS level (also shown by ATFS in the lower right corner).
With the results of the space per person and the maximum waiting time in the queue, the facility can be assessed also by using the LOS matrix (Table 3).

Figure A9.
ATFS—LOS of the existing facility of security control as per IATA LOS guidelines.
Figure A9.
ATFS—LOS of the existing facility of security control as per IATA LOS guidelines.

- Scenario 2—Existing Facility at Pula Airport—LCC LOS guidelines
Figure A10 shows the ATFS calculation of LOS for security control facility, according to the LCC LOS guidelines, using the same input data of Pula Airport. According to LCC LOS guidelines, it also represents an “under-provided” or “unacceptable” LOS level, shown in the lower right corner, which means that reconfiguration of this facility is essential.

Figure A10.
ATFS—LOS of the existing facility of security control as per LCC LOS guidelines.
Figure A10.
ATFS—LOS of the existing facility of security control as per LCC LOS guidelines.

- Scenario 3—Future Facility Requirements at Pula Airport—IATA LOS guidelines
Figure A11 shows the ATFS calculation of the number of security lanes (SEC), maximum number of passengers in queue (QMAX), and total area of the facility for waiting in queue (A), according to IATA LOS guidelines, i.e., according to LOS “optimum” values of MQT and SP, i.e., 8 min and 1.1 m2. To calculate QMAX it is necessary to choose the largest number of security lanes. Results show that the total number of security lanes (SEC) is 5, maximum number of passengers in queue (QMAX) is 118 passengers, and total area of the facility for waiting in queue (A) is 130 m2.

Figure A11.
Future facility requirements of security control as per IATA LOS guidelines in terms of number of security lanes, maximum number of passengers in queue, and total area for waiting in the queue.
Figure A11.
Future facility requirements of security control as per IATA LOS guidelines in terms of number of security lanes, maximum number of passengers in queue, and total area for waiting in the queue.

- Scenario 4—Future Facility Requirements at Pula Airport—LCC LOS guidelines
Figure A12 shows the ATFS calculation of the number of security lanes (SEC), maximum number of passengers in queue (QMAX), and total area of the facility for waiting in queue (A), according to LCC LOS guidelines, i.e., according to LOS “optimum” values of MQT and SP, i.e., 12.5 min and 0.9 m2. To calculate QMAX it is necessary to choose the largest number of security lanes. Results show that the total number of security lanes (SEC) is 5, maximum number of passengers in queue (QMAX) is 165 passengers, and total area of the facility for waiting in queue (A) is 149 m2.

Figure A12.
Future facility requirements of security control as per LCC LOS guidelines in terms of number of security lanes, maximum number of passengers in queue, and total area for waiting in the queue.
Figure A12.
Future facility requirements of security control as per LCC LOS guidelines in terms of number of security lanes, maximum number of passengers in queue, and total area for waiting in the queue.

- Calculation of the total number of X-ray machines and metal detectors gates
Additionally, ATFS provides the ability to calculate the number of X-ray machines and the number of metal detector gates, as per Figure A13. Namely, the required number of X-ray machines and metal detector gates is useful information in capacity planning.
The input parameters used are the number of passengers in the peak hour (934 passengers), the hand baggage processing time at the X-ray machine (15 s), the passenger processing time at the metal detector gate (5 s), and the number of pieces of hand baggage (1) [58].
The results show that the capacity of the X-ray machine is 240 pieces of hand baggage, and the required number of X-ray machines is 4, while the capacity of the metal detector gate is 720 passengers, and the required number of metal detector gates is 2.

Figure A13.
ATFS—Calculation of the total number of X-ray machines and metal detectors gates.
Figure A13.
ATFS—Calculation of the total number of X-ray machines and metal detectors gates.

From the above, it can be concluded that by increasing the number of baggage per passenger or increasing the processing time, the number of required X-ray machines and metal detector gates will increase. Pula Airport meets the current demand by ensuring a sufficient number of devices. It is important to note that future analysis, in order to obtain even more precise results, should include separate processing times for FSC passengers and for LCC passengers due to the differences in their characteristics. Namely, LCC passengers have more hand baggage, which assumes that the control takes longer than for FSC passengers, therefore it is proposed to separate X-ray machines by type of passenger (LCC and FSC). In addition, this segment can be adapted to LCC passengers in the future by spatially separating FSC and LCC passengers and enabling the use of this content in accordance with the prediction of passenger traffic. Assuming that 70% of passengers uses LCC services [59], it is recommended to segment the space so that 3 X-ray machines and 1 metal detector gate are intended for LCC passengers, and 1 X-ray machine and one metal detector gate for FSC passengers. Also, one of the proposals could be the introduction of a priority lane for screening FSC passengers.
Appendix A.1.6. Emigration Control
Four scenario cases are presented for airport terminal facility—emigration control at Pula Airport, including level of service for existing state of the facility calculated according to IATA LOS and LCC LOS guidelines, and for future facility requirements according to IATA LOS and LCC LOS guidelines. IATA and LCC LOS guidelines are presented in Table 1 and Table 2. Calculations for this facility are conducted in ATFS according to Section 3.2.6. Obtained results are explained for each scenario case.
- Scenario 1—Existing Facility at Pula Airport—IATA LOS guidelines
Figure A14 shows the ATFS calculation of LOS for emigration control facility, according to the IATA LOS guidelines, using the input data of Pula Airport, i.e., the defined area (33.89 m2), the number of emigration (outbound passport) control desks (4), the processing time is 20 s per passenger, and assuming 100% utilization of emigration control desks. ATFS also provides the ability to calculate LOS by taking the actual percentage of Schengen/non-Schengen passengers. To calculate QMAX, the largest MQT needs to be selected, i.e., 18 min.
Results show that maximum number of passengers in the queue (QMAX) is 214 passengers and the space per passenger (SP) is 0.2 m2, which according to IATA LOS guidelines represents an “under-provided” or “unacceptable” LOS level (also shown by ATFS in the lower right corner).
With the results of the space per person and the maximum waiting time in the queue, the facility can be assessed also by using the LOS matrix (Table 3).

Figure A14.
ATFS—LOS of the existing facility of emigration control as per IATA LOS guidelines.
Figure A14.
ATFS—LOS of the existing facility of emigration control as per IATA LOS guidelines.

- Scenario 2—Existing Facility at Pula Airport—LCC LOS guidelines
Case 1
Figure A15 shows the ATFS calculation of LOS for emigration control facility, according to the LCC LOS guidelines, using the same input data of Pula Airport. According to LCC LOS guidelines, it also represents an “under-provided” or “unacceptable” LOS level, shown in the lower right corner, which means that reconfiguration of this facility is essential.

Figure A15.
ATFS—LOS of the existing facility of emigration control as per LCC LOS guidelines (case 1).
Figure A15.
ATFS—LOS of the existing facility of emigration control as per LCC LOS guidelines (case 1).

Case 2
Figure A16 shows another case of the ATFS calculation of LOS for emigration control facility, according to the LCC LOS guidelines, using the same input data of Pula Airport, assuming that certain percentage of Schengen/non-Schengen passengers is applied (75:25). According to LCC LOS guidelines, it also represents an “under-provided” or “unacceptable” LOS level, shown in the lower right corner, which means that reconfiguration of this facility is essential.
As evident from Figure A16, the required size of this facility largely depends on the percentage of Schengen/non-Schengen passengers, but in any case, a solution needs to be found to increase the existing space so that passengers can move within the traffic flow without unnecessary delays in the event of the dominance of non-Schengen passengers.

Figure A16.
ATFS—LOS of the existing facility of emigration control as per LCC LOS guidelines (case 2).
Figure A16.
ATFS—LOS of the existing facility of emigration control as per LCC LOS guidelines (case 2).

- Scenario 3—Future Facility Requirements at Pula Airport—IATA LOS guidelines
Case 1
Figure A17 shows the ATFS calculation of the number of emigration (outbound passport) control desks (PD), maximum number of passengers in queue (QMAX), and total area of the facility for waiting in queue (A), according to IATA LOS guidelines, i.e., according to LOS “optimum” values of MQT and SP, i.e., 7.5 min and 1.1 m2. To calculate QMAX it is necessary to choose the largest number of security lanes. Results show that the total number of emigration (outbound passport) control desks (PD) is 5, maximum number of passengers in queue (QMAX) is 113 passengers, and total area of the facility for waiting in queue (A) is 124 m2.
From this calculation, it is clear that a much larger area is needed to accommodate this airport terminal facility at Pula Airport (even additional 90 m2), if current IATA LOS guidelines are applied, and if all passengers are screened, which is not the case in operational practice.

Figure A17.
Future facility requirements of emigration control as per IATA LOS guidelines in terms of number of emigration control desks, maximum number of passengers in queue, and total area for waiting in the queue (case 1).
Figure A17.
Future facility requirements of emigration control as per IATA LOS guidelines in terms of number of emigration control desks, maximum number of passengers in queue, and total area for waiting in the queue (case 1).

Case 2
The AFTS application provides the ability to define the percentage of Schengen/non-Schengen passengers and simulate different scenarios. For example, it can be assumed that 60% of passengers are Schengen and 40% are non-Schengen passengers. Therefore, Figure A18 shows another case when a certain percentage of passengers (e.g., 40%) are non-Schengen passengers. From Figure A18 it is clear that 2 emigration control desks are required with an area of 50 m2 to accommodate 45 passengers.

Figure A18.
Future facility requirements of emigration control as per IATA LOS guidelines in terms of number of emigration control desks, maximum number of passengers in queue, and total area for waiting in the queue (case 2).
Figure A18.
Future facility requirements of emigration control as per IATA LOS guidelines in terms of number of emigration control desks, maximum number of passengers in queue, and total area for waiting in the queue (case 2).

- Scenario 4—Future Facility Requirements at Pula Airport—LCC LOS guidelines
Figure A19 shows the ATFS calculation of the number of emigration (outbound passport) control desks (PD), maximum number of passengers in queue (QMAX), and total area of the facility for waiting in queue (A), according to LCC LOS guidelines, assuming 60% Schengen passengers and 40% non-Schengen passengers. This scenario shows that 2 emigration control desks and an area of 60 m2 are required.

Figure A19.
Future facility requirements of emigration control as per LCC LOS guidelines in terms of number of emigration control desks, maximum number of passengers in queue, and total area for waiting in the queue.
Figure A19.
Future facility requirements of emigration control as per LCC LOS guidelines in terms of number of emigration control desks, maximum number of passengers in queue, and total area for waiting in the queue.

Even under the newly proposed LCC LOS guidelines, taking into account the lower percentage of passengers, a larger area than the existing one is needed to accommodate this airport terminal facility. Although LCC passengers are prepared for longer waits and smaller space, it is necessary to plan a larger area for this facility at Pula Airport.
Appendix A.1.7. Gate Holdrooms
Four scenario cases are presented for airport terminal facility—gate holdrooms at Pula Airport, including level of service for existing state of the facility calculated according to IATA LOS and LCC LOS guidelines, and for future facility requirements according to IATA LOS and LCC LOS guidelines. IATA and LCC LOS guidelines are presented in Table 1 and Table 2. Calculations for this facility are conducted in ATFS according to Section 3.2.7. Obtained results are explained for each scenario case.
- Scenario 1—Existing Facility at Pula Airport—IATA LOS guidelines
Figure A20 shows ATFS LOS calculation using the IATA LOS guidelines for gate holdrooms of Pula Airport, i.e., using the SPS—space per seated person (lower value of optimum level, i.e., 1.8 m2) and the SPST—space per standing person (lower value of optimum level, i.e., 1.2 m2). The number of passengers and the defined seating and standing areas at Pula Airport gate holdrooms are used as input parameters.
Using the input parameters and formulas outlined in Section 3.2.7, the calculation process is as follows:
where variables have the following meaning:
- PA—number of passengers for seating area,
- AS—seating area,
- SPS—space per seated person,
- PST—number of passengers for standing area,
- AST—standing area,
- SPST—space per standing person.
Results show that gate holdrooms at Pula Airport allow 216 seated passengers on the defined seating area of 388.80 m2, while the remaining area represents the defined area of 513 m2 intended for 428 standing passengers, which according to IATA LOS guidelines represents an “optimum” LOS level.

Figure A20.
ATFS—LOS of the existing facility of gate holdrooms as per IATA LOS guidelines in terms of number of seated and standing passengers.
Figure A20.
ATFS—LOS of the existing facility of gate holdrooms as per IATA LOS guidelines in terms of number of seated and standing passengers.

- Scenario 2—Existing Facility at Pula Airport—LCC LOS guidelines
Figure A21 shows ATFS LOS calculation using the LCC LOS guidelines (using the SPS—space per seated person (lower value of optimum level, i.e., 1.8 m2) and the SPST—space per standing person (lower value of optimum level, i.e., 1.0 m2), and the same input data as previous scenario for gate holdrooms of Pula Airport.
Using the input parameters and formulas outlined in Section 3.2.7, the calculation process is as follows:
where variables have the following meaning:
- PA—number of passengers for seating area,
- AS—seating area,
- SPS—space per seated person,
- PST—number of passengers for standing area,
- AST—standing area,
- SPST—space per standing person.
Comparing the Scenarios 1 and 2, it is evident that by applying the LCC LOS guidelines, 85 more passengers (513 − 428 = 85) can use the standing area of this facility.

Figure A21.
ATFS—LOS of the existing facility of gate holdrooms as per LCC LOS guidelines in terms of number of seated and standing passengers.
Figure A21.
ATFS—LOS of the existing facility of gate holdrooms as per LCC LOS guidelines in terms of number of seated and standing passengers.

The entire gate holdrooms area can handle four aircraft at a time, which equals to 644 passengers, which represents “optimum” LOS level. If there are five or more aircraft on the apron, passenger demand reaches up to 1297 passengers per hour, rendering the LOS level down to “under-provided” or “unacceptable”.
- Scenario 3—Future Facility Requirements at Pula Airport—IATA LOS guidelines
Figure A22 shows ATFS calculation of the total gate holdrooms area and the number of seated passengers, according to IATA LOS guidelines. The values of the “optimum” LOS are taken as inputs, i.e., the space per seated passenger (2 m2) and the seat ratio (50%). Results show the total gate holdrooms area is 966 m2, and the number of seated passengers is 322.

Figure A22.
ATFS—Calculation of total gate holdrooms area and number of seated passengers as per IATA LOS guidelines.
Figure A22.
ATFS—Calculation of total gate holdrooms area and number of seated passengers as per IATA LOS guidelines.

- Scenario 4—Future Facility Requirements at Pula Airport—LCC LOS guidelines
Figure A23 shows ATFS calculation of the total gate holdrooms area and the number of seated passengers, according to LCC LOS guidelines. The values of the “optimum” LOS are taken as inputs, but the seat ratio is now 30%. Results show the total gate holdrooms area is 798.56 m2, and the number of seated passengers is 193.

Figure A23.
ATFS—Calculation of total gate holdrooms area and number of seated passengers as per LCC LOS guidelines.
Figure A23.
ATFS—Calculation of total gate holdrooms area and number of seated passengers as per LCC LOS guidelines.

Comparing the results from Scenario 3 and 4, it is evident that a significant saving of approximately 20% in total gate holdrooms area can be made by applying LCC LOS guidelines.
If the LCC LOS guidelines are implemented, one of the proposals is to introduce some new commercial facilities. Additionally, this area could be segmented by separating the area for low-cost carrier (LCC) and full-service carrier (FSC) passengers. Considering the predicted share of 70% of LCC passengers in the coming years [59], the area could be adjusted in such a way that there are fewer seats in the LCC segment, which opens up the possibility of adding new commercial facilities.
Appendix A.2. Airport Terminal Facilities—Arrival
Airport terminal facilities for arrival include immigration control, baggage reclaim, customs control, and public arrival hall. Each airport terminal facility was calculated by using ATFS which can show four different scenarios. First scenario shows the ATFS LOS calculation in the existing facility at Pula Airport by applying IATA LOS guidelines. Second scenario shows the ATFS LOS calculation in the existing facility at Pula Airport by applying new LCC LOS guidelines. Third scenario shows the ATFS LOS calculation for future facility requirements at Pula Airport by applying IATA LOS guidelines. Fourth scenario shows the ATFS LOS calculation for future facility requirements at Pula Airport by applying new LCC LOS guidelines. All obtained results are presented and explained for each scenario case.
Appendix A.2.1. Immigration Control
Four scenario cases are presented for airport terminal facility—immigration control at Pula Airport, including level of service for existing state of the facility calculated according to IATA LOS and LCC LOS guidelines, and for future facility requirements according to IATA LOS and LCC LOS guidelines. IATA and LCC LOS guidelines are presented in Table 1 and Table 2. Calculations for this facility are conducted in ATFS according to 3.2.8. Obtained results are explained for each scenario case.
- Scenario 1—Existing Facility at Pula Airport—IATA LOS guidelines
Figure A24 shows the ATFS calculation of LOS for immigration control facility, according to the IATA LOS guidelines, using the input data of Pula Airport, i.e., the defined area (411.15 m2), the number of immigration (inbound passport) control desks (5), the processing time is 30 s per passenger, and assuming 100% utilization of immigration control desks. ATFS also provides the ability to calculate LOS by taking the actual percentage of Schengen/non-Schengen passengers. To calculate QMAX, the peak-hour number of passengers is used, i.e., 524 passengers, including Schengen and Non-Schengen passengers.
Results show that maximum number of passengers in the queue (QMAX) is 77 passengers and the space per passenger (SP) is 5.41 m2, which according to IATA LOS guidelines represents an “over-design” LOS level (also shown by ATFS in the lower right corner).
With the results of the space per person and the maximum waiting time in the queue, the facility can be assessed also by using the LOS matrix (Table 3).

Figure A24.
ATFS—LOS of the existing facility of immigration control as per IATA LOS guidelines.
Figure A24.
ATFS—LOS of the existing facility of immigration control as per IATA LOS guidelines.

- Scenario 2—Existing Facility at Pula Airport—LCC LOS guidelines
Figure A25 shows the ATFS calculation of LOS for immigration control facility, according to the LCC LOS guidelines, using the same input data of Pula Airport. Results also show an “over-design” LOS level (also shown by ATFS in the lower right corner). Consequently, it is necessary to consider reducing the area and number of immigration control desks or, alternatively, to leave this space for additional demand in the future. Even in a scenario with a dominant share of non-Schengen passengers, the available area exceeds the actual needs.

Figure A25.
ATFS—LOS of the existing facility of immigration control as per LCC LOS guidelines.
Figure A25.
ATFS—LOS of the existing facility of immigration control as per LCC LOS guidelines.

- Scenario 3—Future Facility Requirements at Pula Airport—IATA LOS guidelines
Figure A26 shows the ATFS calculation of the number of immigration (inbound passport) control desks (PC), maximum number of passengers in queue (QMAX), and total area of the facility for waiting in queue (A), according to IATA LOS guidelines, i.e., according to LOS “optimum” values of MQT and SP, i.e., 7.5 min and 1.1 m2. ATFS also provides the ability to use percentages of Schengen/non-Schengen passengers in order to more accurately plan the capacities of this facility. Results show that the total number of immigration (inbound passport) control desks (PC) is 4, maximum number of passengers in queue (QMAX) is 59 passengers, and total area of the facility for waiting in queue (A) is 65 m2. From this calculation, it is clear that a significantly smaller area is needed to accommodate this facility at Pula Airport if the IATA LOS guidelines are applied.

Figure A26.
ATFS—Future facility requirements of immigration control as per IATA LOS guidelines in terms of number of immigration control desks, maximum number of passengers in queue, and total area for waiting in the queue.
Figure A26.
ATFS—Future facility requirements of immigration control as per IATA LOS guidelines in terms of number of immigration control desks, maximum number of passengers in queue, and total area for waiting in the queue.

- Scenario 4—Future Facility Requirements at Pula Airport—LCC LOS guidelines
Figure A27 shows the ATFS calculation of the number of immigration (inbound passport) control desks (PC), maximum number of passengers in queue (QMAX), and total area of the facility for waiting in queue (A), according to LCC LOS guidelines, i.e., according to LOS “optimum” values of MQT and SP, i.e., 12.5 min and 0.9 m2. ATFS also provides the ability to use percentages of Schengen/non-Schengen passengers, but this scenario used 100% on non-Schengen passengers. Results show that the total number of immigration (inbound passport) control desks (PC) is 4, maximum number of passengers in queue (QMAX) is 91 passengers, and total area of the facility for waiting in queue (A) is 82 m2. According to this scenario, a significantly smaller area than the existing 411.15 m2 is required.

Figure A27.
ATFS—Future facility requirements of immigration control as per LCC LOS guidelines in terms of number of immigration control desks, maximum number of passengers in queue, and total area for waiting in the queue.
Figure A27.
ATFS—Future facility requirements of immigration control as per LCC LOS guidelines in terms of number of immigration control desks, maximum number of passengers in queue, and total area for waiting in the queue.

In conclusion, there is a possibility of repurposing a significant portion of space, which will enable the airport to be ready to accommodate a larger number of passengers in the future.
Appendix A.2.2. Baggage Reclaim
Four scenario cases are presented for airport terminal facility—baggage reclaim at Pula Airport, including level of service for existing state of the facility calculated according to IATA LOS and LCC LOS guidelines, and for future facility requirements according to IATA LOS and LCC LOS guidelines. IATA and LCC LOS guidelines are presented in Table 1 and Table 2. Calculations for this facility are conducted in ATFS according to Section 3.2.9. Obtained results are explained for each scenario case.
- Scenario 1—Existing Facility at Pula Airport—IATA LOS guidelines
Figure A28 shows the ATFS LOS calculation of baggage reclaim facility in terms of space per passenger and carousel occupancy time (passengers waiting to collect their baggage) according to IATA LOS guidelines. For Pula Airport, applicable results are related to narrow-body aircraft. For both narrow-body and wide-body aircraft, the resulting LOS level is “over-design” for space per passenger (8.53 m2), and the resulting LOS level is “optimum” for carousel occupancy time (15 min). Total LOS level is “optimum”.
With the results of the space per passenger and carousel occupancy time, the facility can be assessed also by using the LOS matrix (Table 3), for narrow-body and wide-body aircraft.

Figure A28.
ATFS—LOS of the existing facility of baggage reclaim as per IATA LOS guidelines.
Figure A28.
ATFS—LOS of the existing facility of baggage reclaim as per IATA LOS guidelines.

- Scenario 2—Existing Facility at Pula Airport—LCC LOS guidelines
Figure A29 shows the ATFS LOS calculation of baggage reclaim facility in terms of space per passenger and carousel occupancy time according to LCC LOS guidelines. For Pula Airport, applicable results are related to narrow-body aircraft. For both narrow-body and wide-body aircraft, the resulting LOS level is also “over-design” for space per passenger, and “optimum” for carousel occupancy time. Total LOS level is also “optimum”.

Figure A29.
ATFS—LOS of the existing facility of baggage reclaim as per LCC LOS guidelines.
Figure A29.
ATFS—LOS of the existing facility of baggage reclaim as per LCC LOS guidelines.

- Scenario 3—Future Facility Requirements at Pula Airport—IATA LOS guidelines
Figure A30 shows the ATFS calculation of the number of baggage claim units (BC) and the required carousel length (CL) according to IATA LOS guidelines. The optimal value of 1.5 m2 was used for the available space per passenger for baggage claim. Average claim occupancy time per narrow-body/wide-body aircraft is 20 min, ratio of passengers with bags is 50%, and peak occupancy of passengers is 50%. The number of seats in the aircraft is defined to be 189 seats, given that the analysis determined that the most common aircraft type is the Boeing 737 and A320, which have a 189-seat configuration. According to available data, there were four landings during the peak hour, and the analysis of passenger cabin occupancy showed that the load factor was 88% [58]. The results show the number of baggage claim units (BC) is 2 carousels and the required carousel length (CL) is 63 m long.

Figure A30.
ATFS—Future facility requirements of baggage reclaim as per IATA LOS guidelines in terms of the total number of narrow-body/wide-body baggage claim units and the required carousel length for passenger line up.
Figure A30.
ATFS—Future facility requirements of baggage reclaim as per IATA LOS guidelines in terms of the total number of narrow-body/wide-body baggage claim units and the required carousel length for passenger line up.

- Scenario 4—Future Facility Requirements at Pula Airport—LCC LOS guidelines
Figure A31 shows the ATFS calculation of the number of baggage claim units (BC) and the required carousel length (CL) according to LCC LOS guidelines. By calculating according to the LCC LOS guidelines and reducing the space per passenger for baggage claim, i.e., using input of 1.3 m2, a saving in the required carousel length (CL) is obtained by 8 m, i.e., CL is now 55 m.
Policy of low-cost carriers is to limit the amount of checked baggage or encourage passengers to carry hand baggage into the cabin, which aims to either reduce the number of baggage claim carousels or their length within the terminal. It can be concluded that the results are in line with the LCC policy.
However, different scenarios can be analyzed as well taking into account factors such as the share of passengers who claim their baggage, load factor and other factors. For example, for the ratio of passengers with bags (PR) it is recommended to set a lower ratio as the majority of passengers using LCC services carry hand baggage. Likewise, if the percentage of load factor (LF) is taken into account, it is suggested to set a higher percentage since the LF is higher for LCCs compared to FSCs.

Figure A31.
ATFS—Future facility requirements of baggage reclaim as per LCC LOS guidelines in terms of the total number of narrow-body/wide-body baggage claim units and the required carousel length for passenger line up.
Figure A31.
ATFS—Future facility requirements of baggage reclaim as per LCC LOS guidelines in terms of the total number of narrow-body/wide-body baggage claim units and the required carousel length for passenger line up.

In conclusion, by reducing the number of passengers carrying checked baggage and reducing the space per passenger at Pula Airport, significantly less baggage reclaim area is required than existing one. Accordingly, the existing baggage claim area in the low-cost terminal configuration will be sufficient to ensure the “optimum” LOS in the short-term-medium term period. Additionally, as Pula Airport has two carousels, one can be designated for FSC passengers and one for LCC, adjusting the required area in accordance with IATA and LCC LOS guidelines.
Appendix A.2.3. Customs Control
Four scenario cases are presented for airport terminal facility—customs control at Pula Airport, including level of service for existing state of the facility calculated according to IATA LOS and LCC LOS guidelines, and for future facility requirements according to IATA LOS and LCC LOS guidelines. IATA and LCC LOS guidelines are presented in Table 1 and Table 2. Calculations for this facility are conducted in ATFS according to Section 3.2.10. Obtained results are explained for each scenario case.
- Scenario 1—Existing Facility at Pula Airport—IATA LOS guidelines
Figure A32 shows the ATFS calculation of LOS for customs control facility, according to the IATA LOS guidelines, using the input data of Pula Airport, i.e., the defined area (84.30 m2) and the number of customs control primary inspection booths (1), and with the assumption that 5% of passengers proceed to this facility.
If it is assumed that the processing time is 1 min per passenger, maximum number of passengers in the queue (QMAX) is 34 passengers, and the space per passenger (SP) is 2.48 m2, which according to IATA LOS guidelines represents an “over-design” LOS level, which is also shown by ATFS in the lower right corner.
With the results of the space per person and the maximum waiting time in the queue, the facility can be assessed also by using the LOS matrix (Table 3).

Figure A32.
ATFS—LOS of the existing facility of customs control as per IATA LOS guidelines.
Figure A32.
ATFS—LOS of the existing facility of customs control as per IATA LOS guidelines.

- Scenario 2—Existing Facility at Pula Airport—LCC LOS guidelines
Figure A33 shows the ATFS calculation of LOS for customs control facility, according to the LCC LOS guidelines, using the same input data of Pula Airport. According to LCC LOS guidelines, it also represents an “over-design” LOS level, shown in the lower right corner. By comparing Scenarios 1 and 2, it can be concluded that the area of this facility at Pula Airport is significantly larger than necessary. The area intended for this facility can be reduced or reconfigured for other purposes.

Figure A33.
ATFS—LOS of the existing facility of customs control as per LCC LOS guidelines.
Figure A33.
ATFS—LOS of the existing facility of customs control as per LCC LOS guidelines.

- Scenario 3—Future Facility Requirements at Pula Airport—IATA LOS guidelines
Figure A34 shows the ATFS calculation of the number of customs control primary inspection booths (PI), maximum number of passengers in queue (QMAX), and total area of the facility for waiting in queue (A), according to IATA LOS guidelines. Within the ATFS application, there is an input regarding passenger percentage that proceed to this facility, i.e., 5%. As per calculation, and according to LOS “optimum” values of MQT and SP, total number of customs control primary inspection booths (PI) is 1, maximum number of passengers in queue (QMAX) is 2 passengers, and total area of the facility for waiting in the queue (A) is 2 m2.
From this calculation, as per IATA LOS guidelines, it is clear that a significantly smaller area is required for customs control facility at Pula Airport.

Figure A34.
ATFS—Future facility requirements of customs control as per IATA LOS guidelines in terms of number of customs control primary inspection booths, maximum number of passengers in queue, and total area for waiting in the queue.
Figure A34.
ATFS—Future facility requirements of customs control as per IATA LOS guidelines in terms of number of customs control primary inspection booths, maximum number of passengers in queue, and total area for waiting in the queue.

- Scenario 4—Future Facility Requirements at Pula Airport—LCC LOS guidelines
Figure A35 shows the ATFS calculation of the number of customs control primary inspection booths (PI), maximum number of passengers in queue (QMAX), and total area for waiting in the queue (A), according to LCC LOS guidelines. As per calculation, and according to LOS “optimum” values, total number of customs control primary inspection booths (PI) is 1, maximum number of passengers in queue (QMAX) is 3 passengers, and total area for waiting in the queue (A) is 4 m2.

Figure A35.
ATFS—Future facility requirements of customs control as per LCC LOS guidelines in terms of number of customs control primary inspection booths, maximum number of passengers in queue, and total area for waiting in the queue.
Figure A35.
ATFS—Future facility requirements of customs control as per LCC LOS guidelines in terms of number of customs control primary inspection booths, maximum number of passengers in queue, and total area for waiting in the queue.

As per LCC LOS guidelines, the required number of customs control primary inspection booths remains the same, i.e., 1. Considering the existing available area of 84.30 m2, it is proposed to reduce the area and convert it into a space for commercial facilities at the arrivals.
Appendix A.2.4. Public Arrival Hall
Four scenario cases are presented for airport terminal facility—public arrival hall at Pula Airport, including level of service for existing state of the facility calculated according to IATA LOS and LCC LOS guidelines, and for future facility requirements according to IATA LOS and LCC LOS guidelines. IATA and LCC LOS guidelines are presented in Table 1 and Table 2. Calculations for this facility are conducted in ATFS according to Section 3.2.11. Obtained results are explained for each scenario case.
- Scenario 1—Existing Facility at Pula Airport—IATA LOS guidelines
Figure A36 shows the LOS calculation of public arrival hall according to IATA LOS guidelines, in terms of space per standing person in m2. According to the calculation in ATFS, the total LOS level is “sub-optimum”.

Figure A36.
ATFS—LOS of the existing facility of public arrival hall as per IATA LOS guidelines.
Figure A36.
ATFS—LOS of the existing facility of public arrival hall as per IATA LOS guidelines.

- Scenario 2—Existing Facility at Pula Airport—LCC LOS guidelines
Figure A37 shows the LOS calculation of public arrival hall according to LCC LOS guidelines, in terms of space per standing person in m2. According to the calculation in ATFS, space per standing person is the same but the total LOS level is increased up to “optimum”.

Figure A37.
ATFS—LOS of the existing facility of public arrival hall as per LCC LOS guidelines.
Figure A37.
ATFS—LOS of the existing facility of public arrival hall as per LCC LOS guidelines.

- Scenario 3—Future Facility Requirements at Pula Airport—IATA LOS guidelines
Figure A38 shows the ATFS calculation of the total number of persons in public arrival hall and the size of the public arrival hall, according to IATA LOS guidelines. As per calculation, total public arrival hall area is 345 m2 and number of persons in public arrival hall amounts to 175 persons.

Figure A38.
ATFS—Future facility requirements of public arrival hall as per IATA LOS guidelines in terms of area and number of persons in public arrival hall.
Figure A38.
ATFS—Future facility requirements of public arrival hall as per IATA LOS guidelines in terms of area and number of persons in public arrival hall.

- Scenario 4—Future Facility Requirements at Pula Airport—LCC LOS guidelines
Figure A39 shows the ATFS calculation of the total number of persons in public arrival hall and the size of the public arrival hall, according to LCC LOS guidelines. As per this calculation, total number of persons in public arrival hall is also 175 persons and the total public arrival hall area is 299 m2, which shows a significant saving of 13% compared to the dimensioning of this space according to the IATA LOS guidelines.

Figure A39.
ATFS—Future facility requirements of public arrival hall as per LCC LOS guidelines in terms of area and number of persons in public arrival hall.
Figure A39.
ATFS—Future facility requirements of public arrival hall as per LCC LOS guidelines in terms of area and number of persons in public arrival hall.

Hence, according to the results of Scenario 3 and 4, the public arrival hall at Pula Airport does not need expansion, as the currently planned area (i.e., 300 m2) for this facility is sufficient. Based on the dimensioning in accordance with new LCC LOS guidelines, this area is at its optimum size, i.e., 299 m2.
References
- Dobruszkes, F.; Givoni, M.; Vowles, T. Hello major airports, goodbye regional airports? Recent changes in European and US low-cost airline airport choice. J. Air Transp. Manag. 2017, 59, 50–62. [Google Scholar] [CrossRef]
- Ahmad, N.; Naveed, A.; Kersig, T. Strategic behavior of European low-cost airlines: A review and economic analysis. Forman J. Econ. Stud. 2018, 14, 1–30. [Google Scholar] [CrossRef]
- Sabar, R.; Anuar, N.K.; Abdullah, R. Preferences of low-cost passengers, low cost airlines and airport management on low cost terminal (LCT) facilities development model. Int. J. Supply Chain Manag. 2018, 7, 150–157. [Google Scholar]
- Vidović, A.; Štimac, I.; Vince, D. Development of business models of low-cost airlines. Int. J. Traffic Transp. Eng. 2013, 3, 69–81. [Google Scholar] [CrossRef]
- Doganis, R. Flying off Course: Airline Economics and Marketing; Routledge: Oxford, UK, 2019. [Google Scholar]
- Centre for Aviation (CAPA). Available online: https://centreforaviation.com/analysis/reports/ (accessed on 13 September 2025).
- Statista. Available online: https://www.statista.com/topics/6024/low-cost-carrier-market-worldwide/#topicOverview (accessed on 10 August 2025).
- Kazda, A.; Caves, R.E. Airport Design and Operation; Emerald Group Publishing: Leeds, UK, 2000. [Google Scholar]
- De Neufville, R.; Odoni, A.R. Airport System Planning, Design and Management; McGraw-Hill: New York, NY, USA, 2003. [Google Scholar]
- Orsini, F.; Gastaldi, M.; Mantecchini, L.; Rossi, R. Neural Networks Trained with WiFi Traces to Predict Airport Passenger Behavior. In Proceedings of the 6th International Conference on Models and Technologies for Intelligent Transportation Systems (MT-ITS), Cracow, Poland, 5–7 June 2019. [Google Scholar] [CrossRef]
- International Air Transport Association (IATA) Publications. Available online: https://www.iata.org/en/publications/ (accessed on 19 August 2025).
- International Air Transport Association (IATA). Airport Development Reference Manual (ADRM), 11th ed.; International Air Transport Association: Montreal, QC, Canada, 2019. [Google Scholar]
- Baker, D.M.A. Service quality and customer satisfaction in the airline industry: A comparison between legacy airlines and low-cost airlines. Am. J. Tour. Res. 2013, 2, 67–77. [Google Scholar] [CrossRef]
- Ostrowski, P.L.; O’Brien, T.V.; Gordon, G.L. Service quality and customer loyalty in the commercial airline industry. J. Travel Res. 1993, 32, 16–24. [Google Scholar] [CrossRef]
- Transportation Research Board, National Academies of Sciences, Engineering and Medicine (NASEM). Improving the Airport Customer Experience; The National Academies Press: Washington, DC, USA, 2016. [Google Scholar]
- Pivac, J.; Vince, D.; Štimac, I.; Boc, K. Service Quality Analysis at the Airport Passenger Terminal from the Passengers Aspect. In Proceedings of the 22nd International Symposium on Quality—Yesterday, Today, Tomorrow, Poreč, Croatia, 9–11 June 2021. (In Croatian) [Google Scholar]
- Livingstone, A.; Popović, V.; Kraal, B.; Kirk, P.J. Understanding the Airport Passenger Landside Retail Experience. In Proceedings of the Uncertainty Contradiction Value—Design Research Society (DRS) International Conference, Bangkok, Thailand, 1–4 July 2012. [Google Scholar]
- Airport Customer Experience, Between Management and Execution. Available online: https://blog.aci.aero/airport-customer-experience-between-management-and-execution/ (accessed on 13 October 2025).
- Zografos, K.G.; Andreatta, G.; Odoni, A.R. Modelling and Managing Airport Performance, 1st ed.; John Wiley and Sons: Chichester, UK, 2013. [Google Scholar]
- Deconstructing the Airport. Available online: https://www.newyorker.com/video/watch/deconstructing-the-airport (accessed on 15 October 2025).
- Pivac, J.; Štimac, I.; Bračić, M.; Steiner, S. The Impact of the Level of Service on Dimensioning Airport Passenger Terminal. In Proceedings of the 21st International Symposium on Quality—Yesterday, Today, Tomorrow, Crikvenica, Croatia, 18–20 March 2020. (In Croatian) [Google Scholar]
- Transportation Research Board (TRB). ACRP Report 25—Airport Passenger Terminal Planning and Design Volume 1: Guidebook, Airport Cooperative Research Program; Transportation Research Board: Washington, DC, USA, 2010. [Google Scholar]
- Wongyai, P.H.; Ngo, T.; Wu, H.; Tsui, K.W.H.; Nguyen, T.H. Self-service technology in aviation: A systematic literature review. J. Air Transp. Res. Soc. 2024, 2, 100016. [Google Scholar] [CrossRef]
- Wang, Y.; Meng, F.; Wang, X.; Xie, C. Optimizing the passenger flow for airport security check. Adv. Oper. Res. Prod. Manag. 2023, 1, 45–53. [Google Scholar] [CrossRef]
- Pavlin, S. Aerodromes II; University of Zagreb, Faculty of Transport and Traffic Sciences: Zagreb, Croatia, 2014. [Google Scholar]
- Brause, L.M.; Popa, A.; Koch, T.; Deutschmann, A.; Hellmann, M. Optimization of resource demand for passenger services at airports during system failures such as blackouts. Eur. Transp. Res. Rev. 2020, 12, 54. [Google Scholar] [CrossRef]
- Waltert, M.; Wicki, J.; Jimenez Perez, E.; Pagliari, R. Ratio-based design hour determination for airport passenger terminal facilities. J. Air Transp. Manag. 2021, 96, 102125. [Google Scholar] [CrossRef]
- Regulation (EU) 2016/399 of the European Parliament and of the Council of 9 March 2016 on a Union Code on the Rules Governing the Movement of Persons Across Borders (Schengen Borders Code) (Codification). Available online: https://eur-lex.europa.eu/legal-content/EN/TXT/?uri=CELEX%3A32016R0399 (accessed on 16 September 2025).
- Schengen Area. Available online: https://home-affairs.ec.europa.eu/policies/schengen/schengen-area_en (accessed on 16 September 2025).
- Seneviratne, P.N.; Martel, N. Variables influencing performance of air terminal buildings. Transp. Plan. Technol. 1991, 16, 3–28. [Google Scholar] [CrossRef]
- Ashford, J.; Stanton, H.P.; Moore, C.A.; Coutu, P.; Beasley, J.R. Airport Operations, 3rd ed.; McGraw-Hill: New York, NY, USA, 2013. [Google Scholar]
- Mumayiz, S.A. A Methodology for Planning and Operations Management of Airport Passenger Terminals: A Capacity/Level of Service Approach. Doctoral Dissertation, Loughborough University of Technology, Loughborough, UK, 1985. Available online: https://repository.lboro.ac.uk/articles/thesis/A_methodology_for_planning_and_operations_management_of_airport_passenger_terminals_a_capacity_level_of_service_approach/9214295?file=16787780 (accessed on 7 September 2025).
- Tošić, V. A review of airport passenger terminal operations analysis and modeling. Transp. Res. A Policy Pract. 1992, 26, 3–26. [Google Scholar] [CrossRef]
- Kim, D.U.; Jie, M.S.; Choi, W.H. Airport simulation based on queuing model using ARENA. Int. J. Adv. Sci. Technol. 2018, 115, 125–134. [Google Scholar] [CrossRef]
- Guizzi, G.; Murino, T.; Romano, E. A Discrete Event Simulation to Model Passenger Flow in the Airport Terminal. In Proceedings of the 11th WSEAS International Conference on Mathematical Methods and Computational Techniques in Electrical Engineering, Athens, Greece, 28–30 September 2009. [Google Scholar]
- Chiou, Y.C.; Chen, Y.H. Factors influencing the intentions of passengers regarding full service and low cost carriers: A note. J. Air Transp. Manag. 2010, 16, 226–228. [Google Scholar] [CrossRef]
- International Civil Aviation Organization (ICAO). Doc 9184-AN/902 Airport Planning Manual—Part 1—Masterplanning, 2nd ed.; International Civil Aviation Organization: Montréal, QC, Canada, 1987. [Google Scholar]
- Adeke, P.T. Modelling of queuing process at airport check-in system: A case study of Manchester and Leeds-Bradford Airports. Niger. J. Technol. 2018, 37, 35–43. [Google Scholar] [CrossRef][Green Version]
- Nõmmik, A.; Antov, D. Modelling regional airport terminal capacity. Procedia Eng. 2017, 178, 427–434. [Google Scholar] [CrossRef]
- Adacher, L.; Flamini, M.; Guaita, M.; Romano, E. A model to optimize the airport terminal departure operations. Transp. Res. Proc. 2016, 27, 53–60. [Google Scholar] [CrossRef]
- Alodhaibi, S.; Burdett, R.L.; Yarlagadda, P.K.D.V. An analytical optimisation framework for airport terminal capacity expansion. Complexity 2020, 2020, 1–10. [Google Scholar] [CrossRef]
- Oprea, C.; Rosca, M.; Rosca, E.; Costea, I.; Ilie, A.; Dinu, O.; Ruscă, A. Analyzing passenger flows in an airport terminal: A discrete simulation model. Computation 2024, 12, 223. [Google Scholar] [CrossRef]
- AlKheder, S.; Alhadeyah, S.; Albaghli, Z. Simulation modeling of passengers flow at airport terminals to reduce delay and enhance level of service. Case Stud. Transp. Policy 2024, 18, 101312. [Google Scholar] [CrossRef]
- One Size Does Not Fit All: A Study of How Airline Business Models Have Evolved to Meet Demand in Europe. Available online: https://www.iata.org/en/iata-repository/publications/economic-reports/one-size-does-not-fit-all---airline-business-models/ (accessed on 16 October 2025).
- 10 Tech Trends Airports and Airlines Should Watch Out for in 2022. Available online: https://www.futuretravelexperience.com/2022/01/10-tech-trends-airports-and-airlines-should-watch-out-for-in-2022/ (accessed on 17 October 2025).
- Di Mascio, P.; Moretti, L.; Piacitelli, M. Airport landside sustainable capacity and level of service of terminal functional subsystems. Sustainability 2020, 12, 8784. [Google Scholar] [CrossRef]
- Odoni, A.R.; De Neufville, R. Passenger terminal design. Transp. Res. A Policy Pract. 1992, 26, 27–35. [Google Scholar] [CrossRef]
- Andreatta, G.; Brunetta, L.; Righi, L.; Jacur, G.R. Simulation VS analytical models for the evaluation of an airport landside. In Proceedings of the 4th International EUROSIM Congress: Shaping Future with Simulation, Delft, Netherlands, 26–29 June 2001; pp. 1–6. Available online: https://www.eurosim.info/fileadmin/user_upload_eurosim/EUROSIM_OA/Congress/2001/pdf/159.pdf (accessed on 13 December 2025).
- Brunetta, L.; Righi, L.; Andreatta, G. An operations research model for the evaluation of an airport terminal: SLAM (Simple Landside Aggregate Model). J. Air Transp. Manag. 1999, 5, 161–175. [Google Scholar] [CrossRef]
- CAST Software. Available online: https://www.castsoftware.com/ (accessed on 13 December 2025).
- AirTOP Software. Available online: https://www.transoftsolutions.com/aviation/software/airport-airspace-fast-time-simulation/airtop-terminal/ (accessed on 13 December 2025).
- Barrett, S.D. How do the demands for airport services differ between full-service carriers and low-cost carriers? J. Air Transp. Manag. 2004, 10, 33–39. [Google Scholar] [CrossRef]
- Sabar, R.; Fewings, R. How passenger preferences influence low-cost terminal development. J. Airport Manag. 2009, 3, 288–298. [Google Scholar] [CrossRef]
- Hanaoka, S.; Saraswati, B. Low cost airport terminal locations and configurations. J. Air Transp. Manag. 2011, 17, 314–319. [Google Scholar] [CrossRef]
- Pivac, J.; Štimac, I.; Bartulović, D.; Vidović, A. Determining the optimal level of service of the airport passenger terminal for low-cost carriers using the analytical hierarchy process. Appl. Sci. 2025, 15, 1734. [Google Scholar] [CrossRef]
- Pula Airport. Study of the Passenger Terminal Capacity, 1st ed.; Pula Airport: Ližnjan, Croatia, 2022. (In Croatian) [Google Scholar]
- Wirasinghe, S.C.; Shehata, M. Departure lounge sizing and optimal seating capacity for a given aircraft/flight mix—(i) single gate, (ii) several gates. Transp. Plan. Technol. 1989, 13, 57–71. [Google Scholar] [CrossRef]
- Pula Airport. Internal Reports & Data 2009–2019; Pula Airport: Ližnjan, Croatia, 2025. (In Croatian) [Google Scholar]
- Pivac, J.; Štimac, I.; Bartulović, D.; Lonjak, I. Planning the airport terminal facilities based on traffic demand forecast and dominant share of airline business model: Case study of Pula Airport. Appl. Sci. 2025, 15, 2547. [Google Scholar] [CrossRef]


Disclaimer/Publisher’s Note: The statements, opinions and data contained in all publications are solely those of the individual author(s) and contributor(s) and not of MDPI and/or the editor(s). MDPI and/or the editor(s) disclaim responsibility for any injury to people or property resulting from any ideas, methods, instructions or products referred to in the content. |
© 2026 by the authors. Licensee MDPI, Basel, Switzerland. This article is an open access article distributed under the terms and conditions of the Creative Commons Attribution (CC BY) license.