Abstract
Ground fissures are widespread around the world and are particularly severe in the North China Plain. In order to investigate the crack propagation path and propagation mode of buried ground fissures from deep strata to the surface, physical simulation experiments and numerical simulation experiments were conducted based on the sand–clay interlayer strata in the Longyao area. The results show that during the settlement of the hanging wall strata, the propagation path of the cracks changes due to differences in soil properties. The crack propagation is interrupted in the sand layer and slowed down in the clay layer. The surface displacement is characterized by an alternating sequence of gradual and rapid growth phases. The process of crack propagation from depth to surface is divided into five stages, forming tensile cracks and causing the differential settlement of the surface. The strata are mainly under tensile stress, with the stress range of the hanging wall being 2.1 to 3.0 times that of the footwall. Under identical experimental conditions, buried ground fissures in the strata of sand–clay interlayers exhibit anti-dip crack propagation angles and surface deformation zone widths that are between those of homogeneous silty clay and sand. Based on the experimental results, an analytical formula for the hanging wall deformation zone was further proposed. The research results can provide an important reference and theoretical basis for the investigation and disaster prevention of buried ground fissures in the Longyao area of Hebei Province.
1. Introduction
Ground fissures result from the cracking or displacement of shallow geological materials due to natural or anthropogenic factors, leading to the formation of fissures or deformation zones of considerable length and width at the surface. The genesis of ground fissures is inherently complex and highly variable, with formation mechanisms and controlling factors differing markedly across geomorphic settings and geological conditions. Broadly classified according to internal geodynamic processes, external forces, and anthropogenic activities, ground fissures can be categorized into two principal types: tectonic and non-tectonic fissures [1,2,3,4]. These fissure disasters are widely distributed globally, with particularly severe occurrences in regions such as the North China Plain, the Fenwei Basin, and the Suzhou–Wuxi–Changzhou area in China [5]. The North China Plain is characterized by numerous buried active faults, which have resulted in a series of ground fissures in the Hebei Plain area, among which the Longyao fissure is the longest and most active [6,7] (Figure 1). These ground fissures can significantly impact urban construction, hinder urban development, and severely affect the lives of residents [8,9].
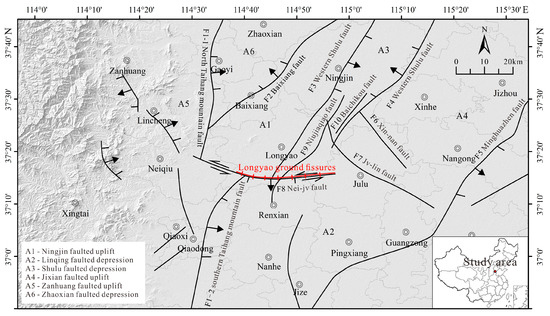
Figure 1.
Geological map of the Longyao area.
In recent years, many scholars have conducted extensive research on buried ground fissures in the North China Plain. Nearly 1100 fissures have formed in the North China Plain. These fissures are caused by deep fractures, regional tensile stress fields driving the activation of basal faults, and excessive groundwater extraction leading to aquifer compression [10]. Heavy rainfall and irrigation generate large amounts of surface water, which can crack, expose, and expand existing buried ground fissures [2,11]. Based on the length of the fissures, a ‘length-grade conversion equation’ was derived to divide the ground cracks into 10 grades [12]. It was concluded that ground fissures are periodic because the destructive force is proportional to the lifting force and inversely proportional to the depth of the strata [13]. The formation of ground fissures originates from the hanging wall of a fault and undergoes three stages: the main fault activity stage, the secondary fault activity stage, and the fissure formation stage [14].
There are also many ways to study the causes of ground fissures. Some scholars have studied the changes in stress and displacement fields in the overlying soil during the crack propagation of buried normal faults through large-scale simulations. They identified the crack patterns and structural features of the fault plane [15,16]. Numerous studies have employed particle-based numerical approaches to investigate the mechanisms governing ground fissures, such as crack initiation, crack propagation, and particle-scale kinematics, which are difficult to capture using traditional continuum approaches. In this context, particle flow code (PFC) simulations have elucidated a five-stage propagation pattern for fissures within loess strata [17]; discrete element method–computational fluid dynamics (DEM–CFD)-coupled simulations have further reproduced a four-stage process whereby buried fissures transition from subsurface erosion to surface expression under intense rainfall, clarifying the controlling roles of soil type and leakage-point geometry [18]. In addition, numerical analyses of the static and dynamic responses of underground utility tunnels within fissure-prone zones have delineated the extent of influence and local cavity development, leading to the formulation of corresponding theoretical models [19,20].
The above research has concentrated on the propagation of buried fissures within a single soil type, whereas their evolution in sand–clay interlayers remains poorly understood. This study aims to address this critical knowledge gap. Through a combination of physical simulation experiments and PFC2D numerical simulation, it studies (1) the crack paths, crack networks, and crack propagation patterns of buried ground fissures in sand–clay interlayers and (2) the relationships between displacement and stress–strain responses. (3) The safe distance for surface structures was determined, providing a theoretical basis for the prevention and control of ground fissure disasters. The findings provide direct guidance for construction planning in the Longyao area and offer a robust theoretical basis for the prevention and mitigation of ground fissure hazards.
2. Distribution and Development Characteristics of Ground Fissures in Longyao
The study area is located in Longyao County, Hebei Province, China. The ground fissure is exposed for more than 30 km, with a width of about 0.2 to 0.6 m and a depth of up to several tens of meters [21]. It is a typical giant ground fissure (Figure 2a). The fissures display the characteristics of a normal fault, a tensile fault, and left rotation. The normal fault type manifested as a relative downward movement of the southern block and a relative upward movement of the northern block [22], causing a displacement of 0.18 m in the cement ground and y-shaped cracks in many walls. The tensile fault type manifested as ground subsidence, road cracks, and cracks in houses. The tensile fault morphology was controlled by the deep structure. Left rotation is manifested by cracks in the walls that run along the ground and shift to the left, with a displacement of up to 0.06 m. To reveal the shallow profile characteristics of the ground fissures, two large trenches were excavated in the severely damaged areas in the middle and western sections of the ground fissures. The locations of the trenches are shown in Figure 2a.
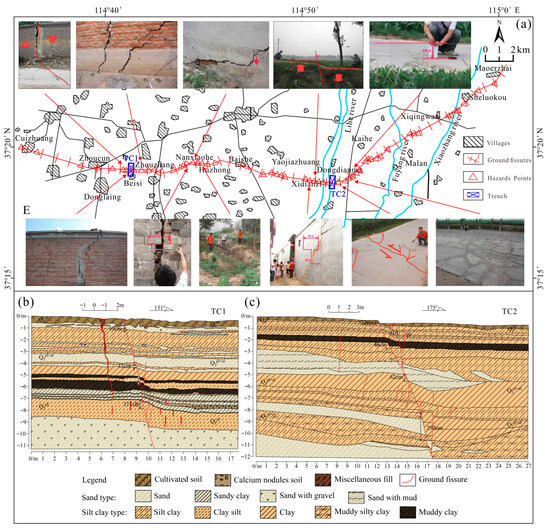
Figure 2.
Distribution of the Longyao ground fissure. (a) Ground fissure distribution map; (b) TC1 profile; (c) TC2 profile.
The characteristics of shallow subsurface development are analyzed by comparing the trench profiles in Figure 2b,c. The primary orientation of the ground fissures is approximately 190°, with an inclination of around 75°, extending vertically into the subsurface, consistent with the strike of the F8 Neiqiu-Julu fault. The analysis focuses on the TC1 (Figure 2b), which displays distinct sand–clay interlayers. The ground crack consisted of a significant main dip crack and multiple branch anti-dip cracks. The main dip crack ran through all exposed strata with a relatively steep dip angle of about 75°, while the branch cracks were distributed near the main crack. These main and secondary cracks formed a y-shaped structure with a positive normal fault and pull-out nature. Furthermore, when the hidden cracks extend to the interface between the sand and soil layers, stress transfer is interrupted or weakened. The hanging wall is more gently inclined and has longer and more gentle cracks than the footwall. When these gentle cracks extended to the surface, the range of the fracture deformation zone of the hanging wall was larger than that of the footwall.
3. Physical Simulation Experiment Design and Results Analysis
3.1. Simulation Model Box Design
The front and back of the model box are made of transparent tempered glass and a steel frame. The internal dimensions of the model box are 5.0 m × 1.5 m × 3.0 m, of which the hanging wall is 2 m long and the footwall is 3 m long, with a preset crack at the boundary between the hanging and footwall (Figure 3a,b). The bottom of the hanging wall is equipped with a mechanical screw jack with an accuracy of 0.01 mm. A roller row is installed on the top surface of the jack to keep the bottom plate of the model box level. The limit plate of the hanging wall and its parallel adjustable support prevent lateral displacement of the soil when the hanging wall slides (Figure 3c–e). The angle of the preset crack can be adjusted between 60° and 90°, allowing the hanging wall to descend at any angle (Figure 3f). The bottom plate and side plates of the hanging wall can be controlled by the jack to move at a predetermined speed along the preset crack angle, simulating the settlement process of the hanging wall on a normal fault.
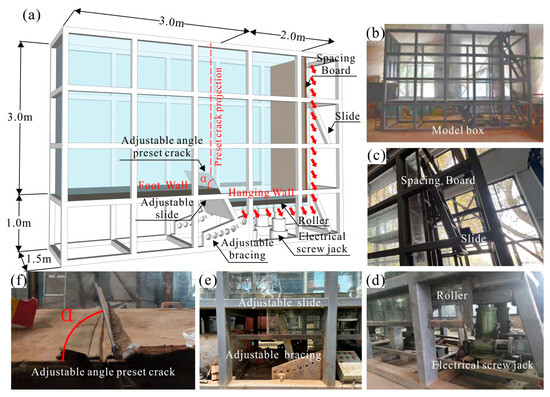
Figure 3.
Structural diagram of the model box. (a) Structure; (b) physical model; (c) limiting plate; (d) adjustable angle preset fissure; (e) adjustable bracing; (f) electric screw jack.
3.2. Monitoring System Arrangement
The model experiment used multiple sensors buried in the ground surface and strata. The sensor distribution was based on the buried ground fissure model experiments conducted by other scholars [17,23,24,25]. The instrument layout in this paper is shown in Figure 4a. One 0.01 mm high-precision displacement meter was placed on the soil surface along the center line of the model box. A total of 14 displacement meters were placed at intervals of 0.3 m. The vertical deformation of the ground surface was measured by fixing the displacement meters with magnetic supports (Figure 4b). BOTDA fiberoptic sensors were arranged at five different depths along the long axis. Fiberoptic sensors are highly sensitive and can monitor extremely small tensile stress values, reflecting the strain field and crack width at different depths (Figure 4c). Two pressure boxes were laid at intervals of 0.5 m inside the soil to measure horizontal and vertical stresses. Since the range of influence inside the soil gradually increases from the deep layer to the ground surface, the number of pressure boxes was also increased from a small number to a large number (Figure 4d). Specific sensor parameters are shown in Table 1.
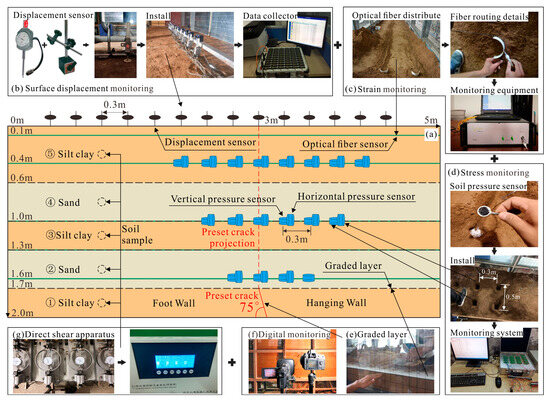
Figure 4.
Layout of the monitoring system. (a) Deployment of Monitoring Instruments; (b) surface displacement monitoring; (c) strain monitoring; (d) stress monitoring; (e) graded layer; (f) digital monitoring; (g) direct shear apparatus.

Table 1.
Experiment sensor parameters.
3.3. Experiment Material Preparation
The geometric, physical, and mechanical properties of the model soil must conform to the principles of similarity theory. However, these parameters are governed by multiple interacting factors and cannot be determined with exact precision. Consequently, similarity can be achieved only by rigorously controlling the unit weight of the model soil [17]. Therefore, based on the experimental conditions, this experiment used a geometric similarity ratio of Cl = 5 and a gravity similarity ratio of Cγ = 1 as the basis for the similarity ratio. The similarity theory was used to list the π terms and obtain the similarity constants of other physical quantities: internal friction angle Cφ = 1, cohesion Cc = Cl Cγ = 5, strain Cε = 1, and stress Cσ = Cl Cγ = 5. The soil samples were selected from silt clay and sand distributed in the crack site at Longyao. Prior to the model experiment, compaction pretests were conducted in strict accordance with the Standard for Geotechnical Testing Methods. A light Proctor compactor (2.5 kg hammer, 30 cm drop height) was employed, with the number of blows per layer optimized to 27 based on preliminary trials. When 25–30 blows were applied, the silt clay’s dry density stabilized at 1.61~1.65 g/cm3 and sand stabilized at 1.77~1.82 g/cm3, consistent with in situ measurements. To minimize interlayer heterogeneity, standardized equipment, controlled operations, real-time monitoring, and post-test verification were implemented. Subsequent section sampling confirmed excellent uniformity, with coefficients of variation ≤1.2% across all layers. The physical and mechanical indicators are shown in Table 2.
Table 2.
Physical and mechanical parameters of soil layers.
3.4. Experiment Process
Step 1: Set the preset crack inclination angle. Set the preset crack angle to be consistent with the angle of the crack in the trench profile, which is 75°. Step 2: Set the settlement speed. In order to meet the characteristics of slow ground crack activity in the Longyao area [21], and considering the controllability and accuracy of the experiment, set the movement speed of the electric screw jack to 3 mm/h. Step 3: Fill the model material in layers and arrange the monitoring instruments. The total filling thickness of the experiment was 200 cm, consisting of five layers from deep to shallow: soil–sand–soil–sand–soil (Figure 4a). A thin layer of gypsum powder was sprinkled on the edge of each 10 cm soil layer as a graded layer for easy observation (Figure 4e).
Step 4: Data monitoring and sampling. After arranging the overburden and monitoring system, turn on the jack switch. Use a video recorder and camera to record the entire process of soil cracking (Figure 4f). Use sketches to draw the location and sequence of the cracks. When no new cracks appear, the settlement is complete. Take soil samples at different depths and perform conventional direct shear tests (Figure 4g) to provide parameters for subsequent numerical simulations.
4. Experimental Results
4.1. Surface Crack Propagation Characteristics
Three cracks formed on the surface, with two horizontal cracks on the hanging wall, one of which almost penetrated the top surface, while the other was slightly shorter; a long crack penetrated the top surface and protruded towards the footwall, with the width of the hanging wall and footwall crack zones being 0.4 m and 0.12 m, respectively (Figure 5a). There is no significant change in the vertical displacement of the ground surface outside the footwall range of −0.9 m. There were different degrees of vertical displacement in the range of −0.9 to the hanging wall, forming steep displacement steps. In the range of −0.9 to −0.6 m of the footwall, the vertical displacement was very small, not exceeding 5 mm, which belonged to the micro-deformation zone. In the range of −0.6 m to 0 m, the vertical displacement gradually increased, and cracks and dislocations occurred at 0 m, reaching a maximum displacement of approximately 49.58 mm. The entire hanging wall soil body was significantly deformed, with vertical displacement ranging from 38.04 mm to 47.78 mm, which belongs to the main deformation zone (Figure 5b). Due to the limited size of the model box, the range of the hanging wall micro-deformation zone could not be reflected.
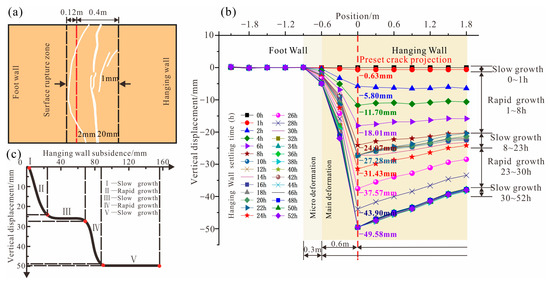
Figure 5.
Surface crack propagation characteristics. (a) Surface crack sketch map; (b) surface displacement curve; (c) displacement (three stable stages).
Analysis of the vertical displacement curves indicates that the entire settlement process can be divided into five stages (I–V), characterized by an alternating sequence of gradual and rapid growth phases (Table 3, Figure 5c). The cumulative displacement during the slow settlement stage is markedly lower than the total settlement of the hanging wall. The growth trend of the top surface displacement can be analyzed in combination with the crack expansion trend of the profile (Figure 6). The initial stage of subsidence activity, lasting for 1 h, was a slow growth stage, stage I. Due to the absorption of crack displacement by the overlying soil layer, the surface displacement lagged behind, and the surface displacement was minimal and almost unchanged. The first rapid growth stage, stage II, lasted from 1 to 8 h. At this time, the latent cracks penetrated upward through the first layer of clay, and the topsoil is pulled downward by the pull of the soil on the lower side of the anti-dip crack. From 8 to 23 h is the slow growth stage, stage III, during which the hidden crack expands in the second sand layer. Due to the ‘buffering’ effect of the sand layer, this stage lasts for a long time. From 23 to 30 h is the second rapid growth stage, stage IV, where the hidden crack expanded upward to the second layer of sand and the third layer of soil, causing a sudden change in the surface displacement. Finally, from 30 to 52 h, the slow growth phase, stage V, occurred, and the hidden crack expanded to the middle of the fourth layer of sand and did not extend upward any further, and no obvious settlement displacement appeared on the surface.
Table 3.
Details of settlement stage and maximum dislocation values.
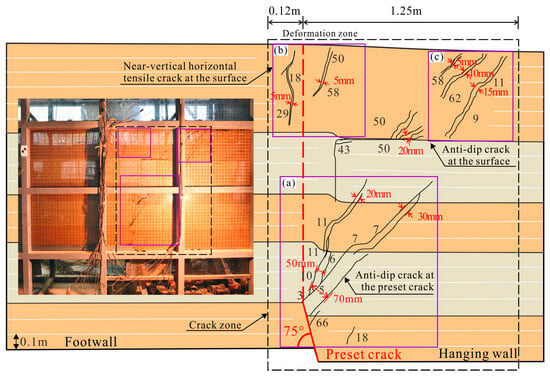
Figure 6.
Physical simulation experiment section crack diagram. (a) Anti-dip crack at the preset fissure; (b) near-vertical horizontal tensile crack at the surface; (c) anti-dip crack at the surface.
4.2. Profile Crack Propagation Characteristics
The crack propagation diagram of the sand–clay interlayer profile, exhibiting a ‘y’-shaped distribution, is shown in Figure 6. The numbers indicate the sequence of crack occurrence. When settlement began, two cracks developed near the tip of the preset crack. The first crack extended in the anti-dip direction at an angle of about 60° and reached a maximum width of 70 mm. This crack was called the main anti-dip crack. It extended upward to the ground surface, and the width of the crack zone gradually decreased. When it extended to the ④ sand layer, there was a clear fault. The other crack is approximately parallel to the main anti-dip crack, with a shorter extension length and a width of only 50 mm, called the secondary anti-dip crack. Due to the weakened propagation ability of the crack in the sand layer, the dip crack at the tip of the preset crack no longer continues to develop upward along the angle of the preset crack, instead forming a smaller secondary anti-dip crack under the pulling action of the hanging wall soil, and its extension trend is also interrupted in the ④ sand layer (Figure 6a). When the hanging wall subsided by 18 mm, two near-vertical horizontal tensile cracks developed near the surface of the footwall, with a width of only 5 mm. The deepest crack stopped at the sand–soil interface (Figure 6b). With continued subsidence, the anti-dip crack extended to the surface, and three nearly parallel tensile cracks developed near the surface of the hanging wall, with the opening widening further away from the preset crack (Figure 6c). Subsequently, the hanging wall showed an overall downward trend, and no new cracks developed.
The widths of the deformation zones of the hanging wall and footwalls were 1.25 m and 0.12 m, respectively, with the hanging wall being significantly wider than the footwall. This is because the hanging wall mainly developed reverse-dip cracks, while the footwall developed near-vertical cracks, which corresponds to the crack characteristics observed in the field (Figure 2b,c). The cracks in the hanging wall all tended to dip toward the footwall but were discontinuous, and the cracks in the sand layer were relatively straight. When the cracks spread to the interface between the sand and soil layers, the expansion angle and path changed significantly, and a large amount of displacement appeared, with nearly vertical through cracks appearing in the sand layer. The crack zone at the surface of the footwall was relatively steep, extending nearly vertically into the soil, gradually decreasing in width, and disappearing in the sand layer.
4.3. Stress Variation Characteristics
The stress difference curves at different depths are shown in Figure 7. The soil is subjected to positive pressure and negative tension. When the hanging wall settlement reaches a certain level, the energy accumulated in the soil exceeds its own strength, causing new cracks to appear and the stress value to decrease. The stress generally decreases significantly near the projection of the tip of the preset crack (X = 0) and decreases with distance from the projection line. The development of cracks causes the soil to loosen horizontally, and the horizontal stress fluctuates locally, increasing with the increase in the crack offset. The minimum horizontal stress occurs near the anti-dip crack. With increasing depth, the tensile area gradually decreases. The soil at the top of the preset crack gradually becomes hollow due to the increase in settlement, causing the upper soil to be pulled. The stress difference in the footwall area varies little, and these variation patterns also correspond to the profile crack diagram, with more cracks occurring in the hanging wall and fewer in the footwall. When the hanging wall stops subsiding, the vertical and horizontal stresses gradually return to the self-weight stress state.
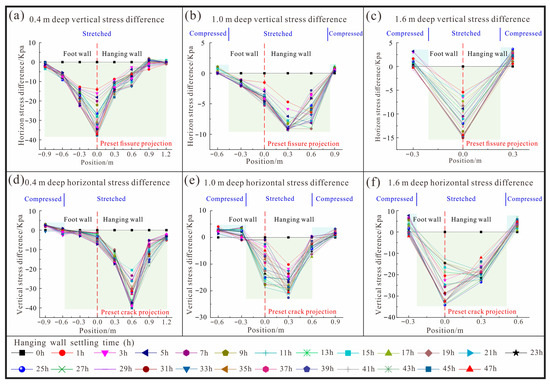
Figure 7.
Stress variation characteristics curve. (a) 0.4 m deep vertical stress difference; (b) 1.0 m deep vertical stress difference; (c) 1.6 m deep vertical stress difference; (d) 0.4 m deep horizontal stress difference; (e) 1.0 m deep horizontal stress difference; (f) 1.6 m deep horizontal stress difference.
4.4. Strain Variation Characteristics
When subjected to tension, the strain of the optical fiber is positive; when subjected to compression or decoupled from the soil, the strain is negative. The greater the strain value in the soil, the more pronounced the uneven settlement (Figure 8). The curve shows that there are at least two locations within each burial depth plane where significant strain occurs, corresponding to the crack locations. As the burial depth increases, the strain becomes more concentrated, and the compression of the soil becomes more obvious. The tensile range of the hanging wall is significantly greater than footwall, with the hanging wall influence zone being 2.1 to 3.0 times that of the footwall. The influence zone corresponds to the ‘y’ shape of the profile crack.
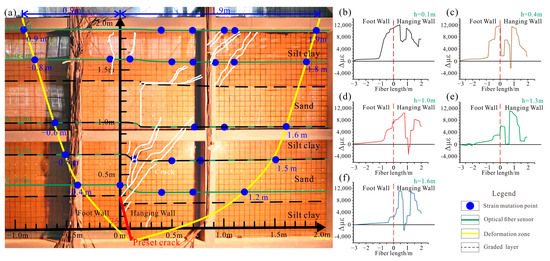
Figure 8.
Strain variation characteristics curve. (a) Comparison of optical fiber strain and crack profile; (b) 0.1 m strain variation curve; (c) 0.4 m strain variation curve; (d) 1.0 m strain variation curve; (e) 1.3 m strain variation curve; (f) 1.6 m strain variation curve.
Combining the profile crack diagram (Figure 6) and the stress variation curve diagram (Figure 7), we can effectively explain the stress–strain change law: as the settlement increases, the preset crack tip accumulates the energy required for cracking. After the tip soil cracks, the stress on the hanging wall decreases, but during the hanging wall descent, there is a relative diving speed on the footwall, which changes the stress state in the soil. The deep footwall soil generates compressive stress, forming a stress-enhanced zone, which gradually transforms into tensile stress in the shallow layer, forming a stress-reduced zone (Figure 9). Therefore, the surface soil of the footwall is prone to tensile cracking, but the extension length is limited.
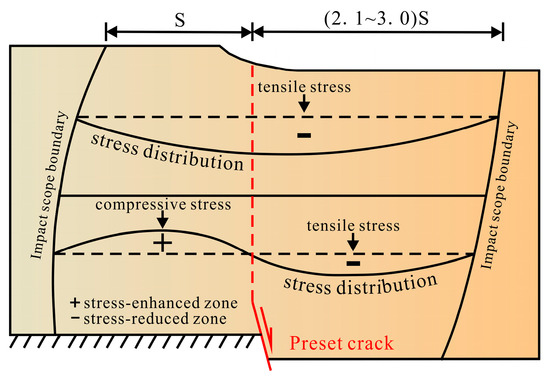
Figure 9.
Stress distribution diagram.
5. Numerical Simulation and Results Analysis
The PFC2D 5.0 software employs the discrete element method to simulate the movement and interaction of granular media in a planar context. It models local behavior to derive a constitutive model for solving boundary value problems throughout the medium. This method has been widely used to simulate particle interactions, large object deformations, and crack propagation [17,26,27]. In this study, this software is employed to reproduce the results of the physical simulation experiments and to extend phenomena that are difficult to capture through physical modeling alone.
5.1. Model Construction
In PFC2D simulations, ground fissure propagation arises from the progressive failure of inter-particle bonds rather than predefined cracks. The soil mass is modeled as a bonded particle assembly, where parallel bonds fail under tensile and shear stresses following stress-based criteria equivalent to the Mohr–Coulomb envelope at the particle scale. Accumulated bond breakage coalesces into macroscopic fracture zones, providing a discrete representation of fracture evolution consistent with continuum fracture mechanics [28,29].
To overcome the limitations of physical simulation data and accurately depict crack propagation in buried geological fissures, a PFC2D numerical model was created with dimensions and boundary conditions matching those of the physical experiments (Figure 10a). A linear contact model was used, incorporating five generated walls to form a two-dimensional model box. Walls ① and ② represent rigid, immobile boundaries corresponding to the footwall strata, whereas walls ③ and ④ are rigid but movable boundaries assigned to the hanging wall. Wall ⑤ is configured as a preset crack with a vertical height of 0.3 m and an inclination angle of 75°. The numerical model comprises particles with a total height of 2.0 m and a length of 5 m, matching the stratigraphic dimensions of the physical model, while a discrete fracture network (DFN) represented the preset crack and was mechanically implemented using the smooth-joint contact model in PFC. The fissure behavior is governed by linear elastic normal and shear stiffnesses, while shear resistance is constrained by a Coulomb friction law with an initial friction coefficient of 0.70. No cohesion or tensile strength is assigned, such that the fissure cannot sustain tensile stress and opens once separation occurs. Under the large-strain formulation, contacts are automatically removed upon separation, ensuring a physically realistic representation of fissure opening, sliding, and loss of load-bearing capacity consistent with natural ground fissures [30]. After constructing the model box, 30,358 particles were generated to form soil and sand layers of varying thicknesses. These particles were allowed to reach equilibrium under their own weight, after which walls ③ and ④ were moved at a velocity of 75° along the preset crack to observe the crack propagation. These modeling choices localize deformation, control fissure branching angles, and enhance hanging wall–footwall asymmetry, thereby suppressing artificial load transfer and improving the robustness and geological realism of fissure propagation simulations.
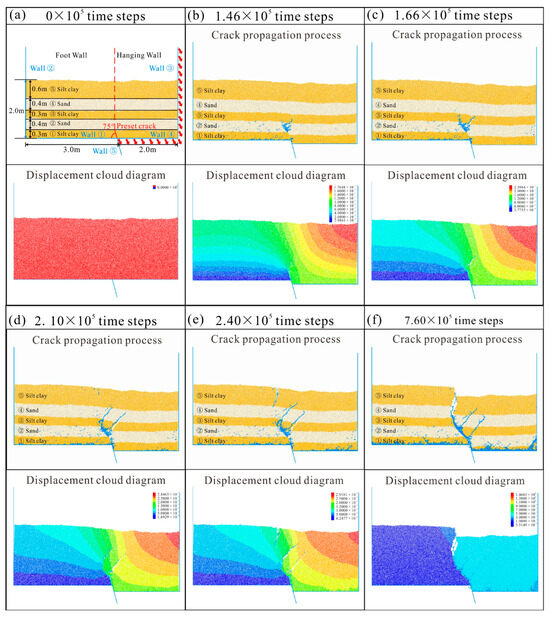
Figure 10.
Crack propagation process and displacement cloud diagram. (a) 0 × 105 time steps; (b) 1.46 × 10⁵ time steps; (c) 1.66 × 10⁵ time steps; (d) 2.10 × 10⁵ time steps; (e) 2.40 × 10⁵ time steps; (f) 7.60 × 10⁵ time steps.
5.2. Calibration of Microscopic Parameters
Prior to PFC2D simulations, microscopic particle parameters must be calibrated against macroscopic mechanical properties obtained from geotechnical tests. Numerical models of conventional triaxial and direct shear tests were established, and the simulated stress–strain responses were systematically compared with laboratory results. The microscopic parameters were iteratively adjusted until the numerical curves reproduced the measured macroscopic behavior of the geomaterials. The resulting calibrated microparameters were then adopted for subsequent numerical simulations, ensuring mechanical consistency between the discrete-element model and the physical soil response. Following direct shear tests on the sampled soils (Figure 4g), the shear stress–shear displacement curves obtained from PFC2D simulations were systematically compared with those measured in laboratory direct shear tests. The microscopic parameters were iteratively optimized until close agreement was achieved between the numerical and experimental curves (Figure 11). The final specific values for the simulation particle properties are listed in Table 4.
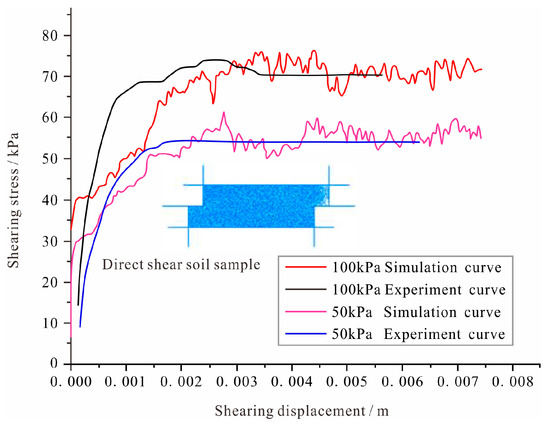
Figure 11.
Calibration curve of direct shear test and numerical simulation.
Table 4.
Mesoscopic parameter calibration table.
5.3. Numerical Simulation Results
At 1.46 × 10⁵ time steps, when subsidence began, the tips of the preset cracks began to crack and deform (Figure 10b). At 1.66 × 10⁵, the first main anti-dip crack appeared at the tips of the preset cracks, and the surface displacement did not increase significantly. During this stage, the displacement concentration remains largely confined to the vicinity of the preset cracks, with displacement contours progressively densifying toward the hanging wall, while the overall extent of deformation remains limited (Figure 10c). The first main anti-dip crack continued to develop and expand. At 2.10 × 10⁵, the dip cracks at the tips of the preset cracks developed until they were blocked at the bottom of the sand layer, and then secondary anti-dip cracks formed under the pull of the hanging wall soil. The surface displacement of the footwall increases significantly (Figure 10d). The two anti-dip cracks tend to be parallel and have similar lengths. At 2.40 × 10⁵, the surface tensile crack continues to extend downward, and the surface displacement is relatively stable. The high-displacement zone in the displacement cloud diagram expands markedly and propagates toward the hanging wall along the direction of crack growth. The displacement contours become progressively continuous and inclined, indicating the pronounced disturbance of the surrounding soil induced by crack propagation (Figure 10e).
At 7.60 × 10⁵, the numerical simulation completely supplemented the physical simulation, reflecting the stage of communication between the tip of the preset crack in the physical simulation and the near-vertical crack on the ground surface. In the numerical simulation, the hanging wall subsided more, and the second sand layer was almost completely faulted. The near-vertical crack on the ground surface was completely connected to the dip crack at the preset crack. The ground crack activity was transformed into uneven ground subsidence. The two anti-dip cracks moved downward with the entire hanging wall and were gradually compacted. The deformation displacement of the surface was concentrated at the steep slope of the surface (Figure 10f). The displacement cloud diagrams reveal a clear transition from uniform deformation to localized displacement concentration, followed by progressive expansion and eventual dominance of a crack-controlled deformation zone, with pronounced hanging wall–footwall asymmetry as crack propagation proceeds.
5.4. Crack Propagation Process
Based on the phenomena observed in physical and numerical simulation experiments, the propagation process of buried cracks in sand–clay interlayers can be categorized into five distinct stages (Figure 12). The first stage is the initiation of preset activity. Under the mutual pull of its own gravity and cohesive force, the soil above the preset crack continuously accumulates the energy required for deformation, forming a tensile force F in the anti-dip direction. Before failure, the soil remains intact (Figure 12a). The second stage is the generation of anti-dip cracks at preset crack tips. Under F, the soil near the preset crack deforms and breaks. Small cracks form inside the soil, which gradually develop into anti-dip cracks. The soil on both sides of the anti-dip crack moves backward, forming a ‘suspended surface’. Under the action of its own gravity G, the soil at the top of the ‘suspended surface’ forms a bending moment M, creating a cantilever-beam-like structure. The ground surface becomes bent and deformed (Figure 12b).
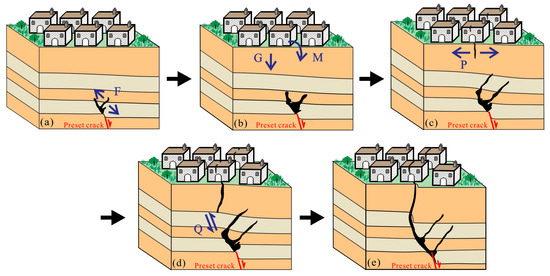
Figure 12.
The preset crack propagation process and stress analysis diagram. (a) Initiation of preset crack activity; (b) generation of anti-tip crack at preset crack tips; (c) development and propagation of near-vertical and anti-tip cracks; (d) downward progression and widening of near-vertical and anti-dip cracks; (e) convergence of near-vertical and normal-dip cracks.
The third stage is the development and propagation of near-vertical cracks and anti-dip cracks. As the ‘overhanging surface’ extends, M gradually increases, and an open crack measuring nearly 90° appears on the ground surface. The soil on both sides of the crack undergoes a backward displacement perpendicular to the crack direction, and the crack width gradually increases and extends downward. The top surface is subjected to the maximum circumferential tensile stress P (Figure 12c). The fourth stage is the downward progression and widening of near-vertical and anti-dip cracks. The soil at the bottom of the vertical tensile crack and the top of the preset crack undergoes shear failure, and the shear direction is almost consistent with the preset crack tendency, indicating that the soil is subjected to a shear force Q in the same direction as the preset crack (Figure 12d). The fifth stage is the convergence of near-vertical and normal-dip cracks. The footwall surface crack extends downward and tends to stabilize, forming a wedge-shaped void with the hanging wall anti-dip crack. Under its own weight, it collapsed and closed the anti-dip crack, causing sudden vertical displacement of the ground surface and cracks in houses. The preset crack, shear crack, and vertical tensile crack eventually connected, forming a through crack with an inclination slightly greater than the preset crack, finally completing the upward expansion of the preset crack (Figure 12e).
6. Discussion
6.1. Influence of Soil Properties on Crack Propagation
Different soil types affect the propagation trend of cracks. The crack propagation patterns of buried cracks with the same preset crack angle and settlement velocity in sand-clay interlayers, silty clay, and sand are compared (Figure 13). The width and angle of deformation zones in different soil types are shown in Table 5. In condition 2, the angle of the hanging wall crack zone was relatively small at about 42° (Figure 13b), while in condition 3, it was relatively large at about 66° (Figure 13c). Condition 1 was between the two at about 52° (Figure 13a). The angle of the footwall crack is large and inclined towards the footwall, extending to a limited depth inside the soil. No cracking occurred in the footwall under condition 3. Vertical tensile cracking occurred at a settlement of 5 mm under condition 2, with the fastest speed. It occurred at a settlement of about 22 mm under condition 3, with a slower speed, and at a settlement of about 18 mm under condition 1, with a moderate speed. Regardless of the soil type, the expansion of the crack will cause anti-dip cracking in the hanging wall. In condition 2, the anti-dip crack angle was small, the deformation zone was wide, and the degree of fragmentation was high. In condition 3, the anti-dip crack angle was large, the deformation zone was narrow, and the degree of fragmentation was low. The cracking in condition 1 was between that in conditions 2 and 3, and when the crack expanded upward, it turned at the sand–soil interface with a significant change in angle. In general, the anti-dip crack angle, influence zone width, and soil fragmentation degree of sand–clay interlayers are between those of silt clay and sand.
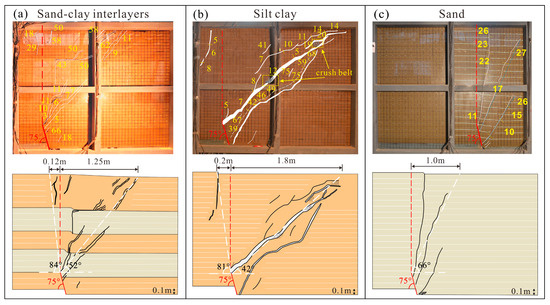
Figure 13.
Crack propagation profiles for different particle properties. (a) Sand-clay interlayers; (b) silt-clay; (c) sand.
Table 5.
Variations in deformation zone width and angle across particle properties.
The differences in crack propagation angle and deformation zone width among soil types have important implications for engineering design in areas affected by buried ground fissures. In silty clay, smaller crack propagation angles and wider deformation zones indicate that fissure-induced deformation tends to spread laterally, leading to a broad surface influence range. Therefore, conservative safety distances are recommended for buildings and underground utilities [31], and dense or sensitive infrastructures should be avoided within the potential deformation zone [32]. In contrast, sand layers are characterized by larger crack propagation angles, narrower deformation zones, and lower degrees of soil fragmentation, suggesting that deformation is more localized near the fissure trace. Under such conditions, localized mitigation measures, such as ground improvement or foundation reinforcement, may be more effective than large-scale avoidance [33]. The deformation behavior of sand–clay interlayers lies between that of silty clay and sand, implying that engineering control measures should consider the thickness and spatial distribution of individual layers. Moreover, the consistent development of anti-dip cracking in the hanging wall across all soil types identifies the hanging wall as the primary risk zone, where stricter foundation design requirements and enhanced monitoring are necessary [25]. Overall, soil-type-dependent crack propagation characteristics provide a useful basis for determining safety distances, foundation layouts, and mitigation strategies in urban areas affected by buried ground fissures.
6.2. Analysis of the Hanging Wall’s Surface Deformation Zone
Regardless of soil type, progressive increases in displacement between the two sides of the fault generate a downward tensile force at the preset crack tip, induced by the self-weight of the underlying soil beneath the preset crack. This gravitational tensile effect causes the crack to deviate from its original propagation trajectory and to propagate in an anti-dip direction, leading to the formation of anti-dip cracks (Figure 13). We term this failure mechanism the anti-dip tensile failure mode and define the corresponding theoretical deformation zone width of the hanging wall.
Under this failure mechanism, cracks in the soil can be regarded as defects distributed within the soil matrix. Their development process and failure mechanisms can be analyzed using the damage mechanics of continuously distributed defects [34,35]. This theory posits that fine cracks exist within the soil matrix. When subjected to external forces, these cracks propagate radially outward from their tips [36]. Among the mechanical parameters on a circle centered at the crack tip, the direction along which the mechanical parameter first reaches a critical state determines the direction of crack propagation. Strain energy density is defined as the strain energy stored per unit volume at each point on the circle—the strain energy density serves as the mechanical parameter. When this parameter reaches a critical state at a particular point, the crack propagates along that direction [37] (Figure 14a).
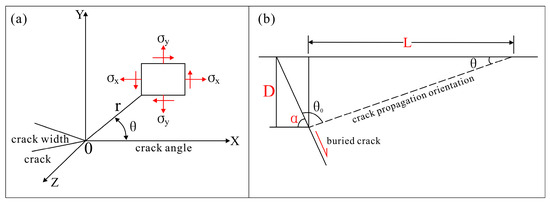
Figure 14.
Crack propagation angle and anti-dip inclination tensile failure mode. (a) Crack propagation angle; (b) anti-dip inclination tensile failure mode.
Based on the relative displacement across the crack surfaces, a crack is classically categorized into three fundamental modes: mode I (opening), mode II (sliding), and mode III (tearing) [38,39]. Under plane strain conditions, the strain energy density of composite modes I, II, and III near the crack tip can be obtained by applying the superposition principle:
In the formula:
where is the strain energy density factor, which measures the strength of the strain energy density in the region near the crack tip. are the stress intensity factors for cracks belonging to modes I, II, and III. is Poisson’s ratio. is the shear modulus of the material. is the local polar coordinate, with the crack tip as the origin.
Cracks propagate along the direction of the smallest value. When reaches the critical value , cracks begin to propagate:
where is the angle between the crack propagation direction and the crack axis. is the critical value of the minimum strain energy density factor, i.e., the fracture toughness of the material, , determined by Equation (1).
In the case of pure type I, i.e., open cracks, , from Equations (2)–(7):
For silt clay, = 0.25~0.35, crack propagation angle ; for sand, = 0.15~0.20, .
Given the complexity of the overlying soils above buried ground fissures, this study considers only linear oblique crack propagation along the prescribed propagation angle , focusing exclusively on the deformation zone width governed by tensile stress.
Based on the crack propagation angle , buried ground fissure dip angle , and burial depth determined by the minimum strain energy density intensity, the deformation width can be calculated (Figure 14b):
Under the same conditions of buried ground fissure depth and buried ground fissure dip angle , the hanging wall deformation width: silt clay > sand–clay interlayer () > sand , this result closely aligns with the conclusions regarding the extent of the hanging wall deformation zone for different soil types presented in Section 6.1.
7. Conclusions
This study examines the crack propagation, deformation characteristics, and stress displacement variations of buried fissures in sand–clay interlayers using field surveys, physical simulations, and numerical simulations. The main conclusions are as follows:
- The hanging wall mainly developed anti-dip cracks, causing an asymmetrical stress field (affecting an area 2.1 to 3.0 times larger than the footwall), which attenuated outward from the center of the crack; stress transmission weakened at the sand–clay interface. The footwall mainly developed near-vertical cracks, which extended shallowly and connected with the preset cracks, causing local collapse and differential settlement of the ground surface.
- Based on surface displacement analysis, it underwent five stages of slow–fast–slow–fast–slow growth, with slow and fast growth alternating.
- The width of the deformation zone of buried ground fissures is controlled by the depth of the buried fissures and the crack angle of different soil types. For the same conditions, buried ground fissures in sand–clay interlayer strata exhibit anti-dip crack propagation angles and surface deformation zone widths that are intermediate between those in homogeneous silty clay and sand.
- The cracking and propagation of buried cracks in sand–clay interlayers underwent five stages: initiation of preset crack activity; generation of an anti-tip crack at preset crack tips; development and propagation of near-vertical and anti-tip cracks; downward progression and widening of near-vertical and anti-dip cracks; and convergence of near-vertical and normal-dip cracks.
Author Contributions
Methodology, Q.L. and X.M.; software, X.M., F.C. and C.L.; validation, Q.L., X.M., F.C. and C.L.; formal analysis, X.M. and C.L.; investigation, F.C., W.Y., X.C. and Y.W.; resources, J.P.; data curation, X.M.; writing—original draft preparation, Q.L.; writing—review and editing, Q.L.; visualization, X.M.; supervision, Q.L.; project administration, Q.L.; funding acquisition, Q.L. All authors have read and agreed to the published version of the manuscript.
Funding
This research was financially supported by the National Natural Science Foundation of China (Grant Nos. 41877250, 41272284), the Key Laboratory of Earth Fissures Geological Disaster, Ministry of Natural Resources (Grant No. EFGD20240601), the Observation and Research Station of Ground Fissure and Land Subsidence, Ministry of Natural Resources, Xi’an, Shaanxi, 710054 (Project code: 202307).
Institutional Review Board Statement
Not applicable.
Informed Consent Statement
Not applicable.
Data Availability Statement
The original contributions presented in this study are included in the article. Further inquiries can be directed to the corresponding author.
Acknowledgments
We sincerely thank the review experts and editors for their valuable suggestions, which have significantly improved the logic and completeness of this paper.
Conflicts of Interest
Author Xiao Chen was employed by the company Changqing Engineering Design Co., Ltd. The remaining authors declare that the research was conducted in the absence of any commercial or financial relationships that could be construed as a potential conflict of interest.
References
- Ayalew, L.; Yamagishi, H.; Reik, G. Ground cracks in Ethiopian Rift Valley: Facts and uncertainties. Eng. Geol. 2004, 75, 309–324. [Google Scholar] [CrossRef]
- Howard, K.W.F.; Zhou, W.F. Overview of ground fissure research in China. Environ. Earth Sci. 2019, 78, 97. [Google Scholar] [CrossRef]
- Pacheco-Martínez, J.; Hernandez-Marín, M.; Burbey, T.J.; González-Cervantes, N.; Ortíz-Lozano, J.A.; Zermeño-De-Leon, M.E.; Solís-Pinto, A. Land subsidence and ground failure associated to groundwater exploitation in the Aguascalientes Valley, Mexico. Eng. Geol. 2013, 164, 172–186. [Google Scholar] [CrossRef]
- Rashidi, A.; Khatib, M.M.; Derakhshani, R. Structural Characteristics and Formation Mechanism of the Earth Fissures as a Geohazard in Birjand, Iran. Appl. Sci. 2022, 12, 4144. [Google Scholar] [CrossRef]
- Ye, S.; Wang, Y.; Wu, J.; Teatini, P.; Yu, J.; Gong, X.; Wang, G. Characterization of earth fissures in South Jiangsu, China. Proc. Int. Assoc. Hydrol. Sci. 2015, 372, 249–253. [Google Scholar] [CrossRef]
- Chang, J.; Ma, R.Y.; Pan, A.F.; Wang, L.Q.; Wan, Y.; Wang, Z.H.; Sun, C.M.; Shang, H.X. Quantitative analysis of activity characteristics of Longyao ground fissure. J. Eng. Geol. 2020, 28, 1213–1220. [Google Scholar] [CrossRef]
- Wu, Y.T.; Yang, W.M.; Zhou, J.J.; Yu, H.K.; Li, X.L.; Zhang, T.T.; Wan, F.P. A study of the genesis mechanism and model of Longyao ground fissures in Hebei plain. Hydrogeol. Eng. Geol. 2020, 47, 169–178. [Google Scholar] [CrossRef]
- Cheng, Y.; Wang, P.; Xu, Q. Numerical Simulation Analysis of the Impact of Active Ground Fissures on Damage to Urban Overpasses. Appl. Sci. 2023, 13, 6925. [Google Scholar] [CrossRef]
- Alsaiari, M.; Nwafor, B.O.; Hermana, M.; Hassan HM, A.M.; Irfan, M. Understanding the Mechanisms of Earth Fissuring for Hazard Mitigation in Najran, Saudi Arabia. Sustainability 2023, 15, 6006. [Google Scholar] [CrossRef]
- Song, S.; Bai, L.; Yang, C.S. Characterization of the Land Deformation Induced by Groundwater Withdrawal and Aquifer Parameters Using InSAR Observations in the Xingtai Plain, China. Remote Sen. 2022, 14, 4488. [Google Scholar] [CrossRef]
- Li, G.; Wang, F.; Gong, X.; Zhang, Y.; Wang, F. Characteristics and Formation Mechanism of Water-Eroded Ground Fissures in the Weihe Basin of China. Water 2023, 15, 2198. [Google Scholar] [CrossRef]
- Xu, J.S.; Peng, J.B.; Deng, Y.H.; He, H.Q.; Meng, L.C.; Wang, F.Y. Classification, grading criteria and quantitative expression of earth fissures: A case study in Daming Area, North China Plain. Geomat. Nat. Hazards Risk 2018, 9, 862–880. [Google Scholar] [CrossRef]
- Xu, J.S.; Meng, L.C.; An, H.B.; Wang, L.Y. The bending mechanism of Anping ground fissure in the Hebei Plain, North China. Environ. Earth Sci. 2015, 74, 6859–6870. [Google Scholar] [CrossRef]
- Jia, Z.J.; Peng, J.B.; Lu, Q.Z.; Qiao, J.W.; Wang, F.Y.; Zang, M.D.; Liu, Y.; Zhao, J.Y.; Zhu, F.J. Formation Mechanism of Ground Fissures Originated from the Hanging Wall of Normal Fault: A Case in Fen-Wei Basin, China. J. Earth Sci. 2022, 33, 482–492. [Google Scholar] [CrossRef]
- Chu, S.S.; Lin, M.L.; Huang, W.C.; Liu, H.F.; Chan, P.C. Laboratory simulation of shear band development in a growth normal fault. J. GeoEng. 2013, 8, 19–23. [Google Scholar] [CrossRef]
- Chu, S.S.; Lin, M.L.; Huang, W.C.; Nien, W.T.; Liu, H.C.; Chan, P.C. Simulation of growth normal fault sandbox tests using the 2D discrete element method. Comput. Geosci. 2015, 74, 1–12. [Google Scholar] [CrossRef]
- Li, C.; Lu, Q.Z.; Wang, F.Y.; Luo, W.C.; Xu, Q. Crack mechanism of ground fissures in loess layer of Fenwei Basin, China. J. Mt. Sci. 2024, 21, 1683–1696. [Google Scholar] [CrossRef]
- Wang, F.J.; Wang, F.Y.; Gong, X.L.; Zhang, Y.; Li, G.Q. Water Erosion and Extension of Ground Fissures in Weihe Basin Based on DEM-CFD Coupled Modeling. Water 2023, 15, 2321. [Google Scholar] [CrossRef]
- Bo, D.T.; Li, P.; Li, X.; Tian, J.T.; Zhi, B. Mechanical behavior of underground pipe gallery structure considering ground fissure. J. Mt. Sci. 2022, 19, 547–562. [Google Scholar] [CrossRef]
- Yan, Y.; Huang, Q.; Xie, Y.; Qiu, J.; Han, Y.; Teng, H.; Liu, T. Failure analysis and deformation mechanism of segmented utility tunnels crossing ground fissure zones with different intersection angles. Eng. Fail. Anal. 2022, 139, 106456. [Google Scholar] [CrossRef]
- Peng, J.B.; Xu, J.S.; Ma, R.Y.; Wang, F.Y.; Wang, F. Characteristics and mechanism of the Longyao ground fissure on North China Plain, China. Eng. Geol. 2016, 214, 136–146. [Google Scholar] [CrossRef]
- Yang, C.S.; Lu, Z.; Zhang, Q.; Zhao, C.Y.; Peng, J.B.; Ji, L.Y. Deformation at longyao ground fissure and its surroundings, north China plain, revealed by ALOS PALSAR PS-InSAR. Int. J. Appl. Earth Obs. Geoinf. 2018, 67, 1–9. [Google Scholar] [CrossRef]
- Chai, J.; Du, W.G.; Zhang, D.D.; Lei, W.L. Study on roof activity law in steeply inclined seams based on BOTDA sensing technology. Chin. J. Rock. Mech. Eng. 2019, 38, 1809–1818. [Google Scholar] [CrossRef]
- Lu, Y.; Shi, B.; Yu, J.; Gong, X.L.; Wei, G.Q.; Liu, J. Model Test on Distributed Optical Fiber Monitoring of Land Subsidence and Ground Fissures. J. Eng. Geol. 2015, 23, 896–901. [Google Scholar] [CrossRef]
- Lu, Q.Z.; Li, C.; Liu, R.D.; Sun, Y.M.; Mao, X.Y.; Chen, F.L. Study on the fracture propagation of ground fissures with syn-depositional structure in Fenwei Basin, China. Sci. Rep. 2024, 14, 10850. [Google Scholar] [CrossRef]
- Xu, H.; Putsikai, B.; Yu, S.; Yu, J.; Li, Y.; Gu, P. Numerical Simulation of Freezing-Induced Crack Propagation in Fractured Rock Masses Under Water–Ice Phase Change Using Discrete Element Method. Buildings 2025, 15, 2055. [Google Scholar] [CrossRef]
- Zhu, Z.; Xu, H.; Yu, S.; Yu, J.; Zhang, B. Particle flow simulation of crack propagation and penetration in Brazilian disc under uniaxial compression. Rock. Mech. Lett. 2025, 2, 47–55. [Google Scholar] [CrossRef]
- Cundall, P.A.; Strack, O.D.L. A discrete numerical model for granular assemblies. Géotechnique 1979, 29, 47–65. [Google Scholar] [CrossRef]
- Potyondy, D.O.; Cundall, P.A. A bonded-particle model for rock. Int. J. Rock. Mech. Min. Sci. 2004, 41, 1329–1364. [Google Scholar] [CrossRef]
- Zhou, J.; Zhang, L.; Braun, A.; Han, Z. Investigation of Processes of Interaction between Hydraulic and Natural Fractures by PFC Modeling Comparing against Laboratory Experiments and Analytical Models. Energies 2017, 10, 1001. [Google Scholar] [CrossRef]
- Zhang, C.; Zhong, W.; Chen, J.; Li, X.; Pu, Y.; Yi, J.; Xu, Y. Response spectra and design spectrum of ground fissures site under seismic action. Sci. Rep. 2025, 15, 16120. [Google Scholar] [CrossRef]
- Peng, J.; Qiao, J.; Leng, Y.; Wang, F.; Xue, S. Distribution and mechanism of the ground fissures in Wei River Basin, the origin of the Silk Road. Environ. Earth Sci. 2016, 75, 718. [Google Scholar] [CrossRef]
- Fu, Y.; Wu, Y.; Yin, X.; Zhang, Y. Mapping mining-induced ground fissures and their evolution using UAV photogrammetry. Front. Earth Sci. 2023, 11, 1260913. [Google Scholar] [CrossRef]
- Chen, Y.; Lin, H.; Xie, S.; Cao, R.; Sun, S.; Zha, W.; Wang, Y.; Zhao, Y.; Hu, H. Fracture Closure Empirical Model and Theoretical Damage Model of Rock under Compression. Materials 2023, 16, 589. [Google Scholar] [CrossRef]
- Oucif, C.; Mauludin, L.M. Continuum Damage-Healing and Super Healing Mechanics in Brittle Materials: A State-of-the-Art Review. Appl. Sci. 2018, 8, 2350. [Google Scholar] [CrossRef]
- Tang, C.-S.; Zhu, C.; Cheng, Q.; Zeng, H.; Xu, J.-J.; Tian, B.-G.; Shi, B. Desiccation cracking of soils: A review of investigation approaches, underlying mechanisms, and influencing factors. Earth-Sci. Rev. 2021, 216, 103586. [Google Scholar] [CrossRef]
- Ramulu, M.; Kobayashi, A.S. Strain energy density fracture criterion in elastodynamic mixed mode crack propagation. Eng. Fract. Mech. 1983, 18, 1087–1098. [Google Scholar] [CrossRef]
- Irwin, G.R. Analysis of Stresses and Strains Near End of a Crack Traversing a Plate. J. Appl. Mech. 1956, 24, 361–364. [Google Scholar] [CrossRef]
- Griffith, A.A. The Phenomena of Rupture and Flow in Solids. Philos. Trans. R. Soc. A Math. Phys. Eng. Sci. 1920, 221, 163–198. [Google Scholar] [CrossRef]


Disclaimer/Publisher’s Note: The statements, opinions and data contained in all publications are solely those of the individual author(s) and contributor(s) and not of MDPI and/or the editor(s). MDPI and/or the editor(s) disclaim responsibility for any injury to people or property resulting from any ideas, methods, instructions or products referred to in the content. |
© 2026 by the authors. Licensee MDPI, Basel, Switzerland. This article is an open access article distributed under the terms and conditions of the Creative Commons Attribution (CC BY) license.