Abstract
In recent years, Advanced Persistent Threat (APT) malware, with its high stealth, has made it difficult for unimodal detection methods to accurately identify its disguised malicious behaviors. To address this challenge, this paper proposes an APT Malware Detection Model based on Heterogeneous Multimodal Semantic Fusion (HMSF-ADM). By integrating the API call sequence features of APT malware in the operating system and the RGB image features of PE files, the model constructs multimodal representations with stronger discriminability, thus achieving efficient and accurate identification of APT malicious behaviors. First, the model employs two encoders, namely a Transformer encoder equipped with the DPCFTE module and a CAS-ViT encoder, to encode sequence features and image features, respectively, completing local–global collaborative context modeling. Then, the sequence encoding results and image encoding results are interactively fused via two cross-attention mechanisms to generate fused representations. Finally, a TextCNN-based classifier is utilized to perform classification prediction on the fused representations. Experimental results on two APT malware datasets demonstrate that the proposed HMSF-ADM model outperforms various mainstream multimodal comparison models in core metrics such as accuracy, precision, and F1-score. Notably, the F1-score of the model exceeds 0.95 for the vast majority of APT malware families, and its accuracy and F1-score both remain above 0.986 in the task of distinguishing between ordinary malware and APT malware.
1. Introduction
In the field of cybersecurity, APTs [1] have emerged as a critical hazard to national security and enterprise information security, owing to their high stealth, long-term persistence, and precise targeting [2]. Modern APT malware generally employs a multi-layered evasion technology system, encompassing advanced countermeasures such as dynamic code obfuscation, polymorphic mutation engines, and anti-sandbox detection. This renders traditional detection methods based on unimodal features confront severe technical challenges [3].
To address the high concealment of APT attacks, the mainstream approach in current research adopts multimodal fusion methods to improve detection accuracy [4]. Aiming at the difficulty of insufficient extraction of deep temporal features in APT malicious traffic, Zhou et al. [5] fused temporal features extracted by LSTM variants with rule-based features generated via correlation analysis, constructing a multimodal fusion traffic detection model. For the pain point of detecting semantically ambiguous PowerShell scripts, Peng et al. [6] built more discriminative semantic features through multi-dimensional feature fusion of characters, vocabulary, abstract syntax trees, and knowledge graphs. In the research on APT family classification, Zhang et al. [7] designed a bimodal fusion framework, combining behavioral graph features processed by GGNN with opcode frequency features extracted by ImageCNTM, to achieve more accurate malware family identification. From the perspective of multi-source information fusion, Xiao et al. [8] deeply integrated three modalities (attributes, text, and topology) into a heterogeneous knowledge graph, and combined it with BERT, Node2vec, and GAT models to realize efficient detection of APT attacks. To further strengthen the semantic correlation of APT events, Li et al. [9] proposed a pre-trained cross-modal learning method, which constructed a more accurate semantic correlation detection model for APT events by jointly embedding log and security event data and leveraging cross-modal alignment technology.
Notably, existing APT analysis reports commonly suffer from fragmented information, irregular structure, and vague semantic expression, making discriminative feature extraction difficult and further complicating attack attribution and situational interpretation [10]. In addition, publicly available APT samples are scarce and their class distributions are extremely imbalanced, causing traditional machine learning methods to be vulnerable to sample imbalance during training and prediction, and leading to significant degradation in detection performance [11].
To address the challenges of APT malware detection, this paper proposes a heterogeneous multi-modal detection method. By fusing complementary features from different modalities, the proposed method enhances the ability to identify highly stealthy APT samples from multiple perspectives. To achieve more efficient feature fusion, this paper designs and adopts two types of Transformer encoders with enhanced local representation, as well as the CAS-ViT encoder.
Feature extraction from APT attack analysis reports is fraught with difficulties. To compensate for this limitation, this paper extracts key Application Programming Interface (API) call sequences from the reports and combines them with the Portable Executable (PE) files of APT samples, converting them into RGB images according to predefined rules. This approach supplements and reinforces the feature information that is difficult to extract from the reports.
To tackle the problems of APT sample scarcity and class imbalance, this paper adopts sample generation techniques to balance and augment APT samples of all categories. It further explores the effectiveness of the multi-modal mechanism in alleviating class imbalance and improving detection robustness.
The main contributions of this paper are summarized as follows:
- Proposing an APT malware detection model named HMSF-ADM.
- Proposing a Dual-Path Convolutional Feature Fusion Text Enhancer (DPCFTE), which realizes adaptive extraction of local data representations by combining the advantages of dynamic convolution and static convolution.
- Introducing the DPCFTE module into the Transformer encoder model and the CAS-ViT model, thus proposing the DPCFTE-T model and the DPCFTE-CAS-ViT model.
2. Related Works
2.1. Research on Multimodal Malware Detection
Multimodal learning is increasingly becoming a significant development direction in the field of malware detection [12]. This approach enables the automatic learning and fusion of advanced semantic features from multiple data sources without relying on manually defined rules, thereby effectively enhancing the ability to identify novel and complex malware. Beyond targeting specific types of malware such as APT, multimodal learning has also been widely applied to the detection of other malware categories.
In the field of general malware detection, Li et al. [13] generated classification features by fusing multiple modalities, including byte sequences, file formats, statistical attributes, and semantic information of malware, and employed weight self-learning to achieve dynamic feature weighting. Guo et al. [14] integrated image visualization features and textual description features of malware, using a CNN-based image encoder and a Transformer-based text encoder to enhance the diversity and representational capacity of the feature space from two complementary dimensions. Xuan et al. [15] integrated RGB image features with sequential features, and leveraged bidirectional temporal convolution and atrous spatial pyramid pooling for malware detection. This approach effectively addressed the issues of data loss, single-feature limitations, and confounding interference in conventional methods.
In the domain of Android malware detection, Chen et al. [16] leveraged Graph Attention Networks (GAT) and max-pooling operations to extract structural and semantic representations from function call graphs of malware, combining them with permission features to construct a deep multimodal feature fusion network. Li et al. [17] employed pre-trained language models and vision models to extract semantic features from malware code snippets and grayscale image features from binary files, respectively, and introduced a cross-modal attention mechanism to achieve deep fusion of heterogeneous features. Zhang et al. [18] comprehensively utilized dynamic API call graphs and static function call graphs of malware, adopting a GCN-based multimodal fusion network to model the intrinsic relationships between dynamic and static behaviors of malware.
As can be seen from existing research, remarkable progress has been made in multimodal malware detection regarding feature construction and model architecture. On this basis, this paper improves and optimizes model design and data extraction, thereby providing a novel optimization scheme for multimodal malware detection.
2.2. Research on Integrating Transformer and Convolutional Modules
Introducing special convolutional modules into the Transformer architecture enables the model to simultaneously acquire local feature extraction and global context modeling capabilities. This design concept has been widely adopted in the field of computer vision.
In image translation tasks, to address the issue where pure Transformers may overlook the temporal semantic structure of gestures, Xie et al. [19] incorporated a content-aware neighborhood aggregation method and a position-aware temporal convolutional layer into their model, thereby improving the performance of sign language recognition and translation. For medical image analysis tasks, to expand the perceptual scope of electroencephalogram (EEG) signals, Song et al. [20] combined CNN modules with self-attention mechanisms to better capture both local and global features in EEG data. In facial recognition, to tackle the challenge of expression recognition under occlusion, Liu et al. [21] introduced a Patch-Attention module into Vision Transformer (ViT). By adaptively computing patch-level attention weights for local features, they significantly enhanced expression recognition accuracy in occluded scenarios.
In the field of natural language processing (NLP), the integration of convolutional modules with Transformers varies across approaches. Bao et al. [22] first trained word embeddings using BERT and then combined a CNN module with an attention-enhanced BiGRU module to improve the semantic representation of short texts. Abas et al. [23] utilized BERT to generate context-aware semantic vectors, which were subsequently fed into convolutional layers for feature extraction to achieve text classification. Rafiepour et al. [24] integrated a BERT encoder, convolutional layers, a window-based feature sequence rearrangement method, and a stacked Transformer encoder for text intent detection and slot-filling tasks.
The above studies indicate that the computer vision community tends to directly integrate convolutional modules to strengthen local modeling capabilities, whereas in natural language processing convolutional layers are more often used as parallel feature extractors or as downstream classifiers rather than as direct replacements for the core Transformer architecture. This discrepancy mainly stems from differences in data characteristics: convolution operations naturally align with the local correlations in images, but when applied directly to text they can disrupt semantic structure and produce features that lack representation of global dependencies, thereby degrading model performance.
To address this issue, this study proposes the DPCFTE module, which adaptively extracts the required local features by combining the advantages of dynamic convolution and static convolution, thereby minimizing the negative impact on the overall performance of the model.
3. Materials and Methods
The overall architecture of HMSF-ADM proposed in this paper is illustrated in Figure 1, which mainly consists of four components: the multimodal data extraction module, semantic enhancement module, semantic fusion module, and classification module.
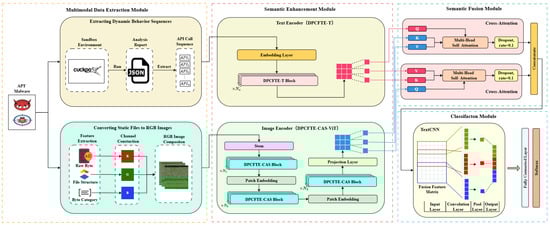
Figure 1.
The overall structure of HMSF-ADM.
3.1. Architecture Overview
Multimodal Data Extraction Module: For the input APT samples (PE files), on the one hand, they are run in a sandbox to obtain API call sequences that reflect their behaviors in the operating system; on the other hand, the byte streams, file structures, and byte categories of APTs are mapped to RGB images according to preset conversion rules, which serve as the input of the image modality.
Semantic Enhancement Module: A text encoder (DPCFTE-T) is adopted to perform contextual modeling on the API call sequences for enhancing the semantic representation of the original sequences; an image encoder (DPCFTE-CAS-ViT) is utilized for progressive sampling and encoding of the RGB images, and the encoded images are finally converted into tensor representations with the same shape as the API sequences.
Semantic Fusion Module: The module uses two cross-attention mechanisms to enable interaction and fusion of data between the sequence modality and the image modality, and concatenates and aggregates the bidirectionally fused representations.
Classification Module: The model adopts a TextCNN-based classifier to extract discriminative features from the fused representations, followed by a fully connected layer and a Softmax layer to output the final classification results.
3.2. Multimodal Data Extraction Module
This section introduces the data extraction processes for API call sequences and RGB images of APT malware.
3.2.1. Extraction of Dynamic Behavior Sequences
API serves as the core channel for software to interact with system resources, and its call sequences exhibit distinct continuity and semantic correlation. By recording operations on key components such as system resources, registries, processes, memory, and networks, API sequences can fully characterize the dynamic behavioral features of software within the system.
This paper mainly leverages the Cuckoo Sandbox, a tool dedicated to malware analysis, to conduct analysis on the PE file dataset for acquiring API call sequence data. This sandbox can record the behavioral features and detailed API calls of malware, and store the analysis results as JSON-format reports.
Since the lengths of API call sequences extracted from JSON dynamic analysis reports vary drastically, ranging from dozens to millions of calls, it is infeasible to directly adopt full-scale APIs for subsequent analysis. Thus, screening the most representative API subset becomes an essential prerequisite.
A total of 16 types of APIs are defined, specifically including notification, certificate, crypto, exception, file, misc, netapi, network, ole, process, registry, resource, services, synchronisation, system, and ui. As illustrated in Figure 2, the invocation frequencies of these API categories across three APT malware families (i.e., APT 1, Equation Group, and Winnti) and a dataset of generic malware samples are presented. The results clearly indicate that five API categories—file, network, process, registry, and system—consistently rank among the top five in terms of invocation frequency. Covering core operational events such as file manipulation, network interaction, process management, registry operations, and system-level calls, these five API categories enable accurate and precise characterization of the behavioral logic of software programs.
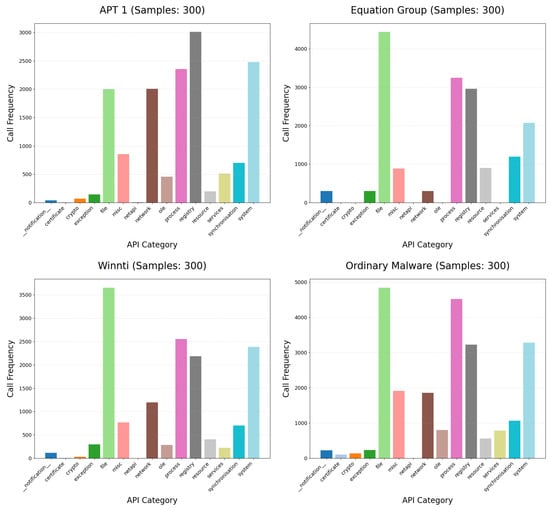
Figure 2.
Comparison of API category call frequencies.
Cuckoo Sandbox supports the integration of the YARA rulebase, enabling pattern matching via preconfigured rules to precisely flag sensitive behaviors such as malware’s malicious intentions, induced anomalies, and high-privilege operations, while identifying the specific APIs through which these behaviors are executed. Taking DarkHotel, an APT attack sample, as an example: the sandbox can explicitly mark its memory injection behavior executed via the WriteProcessMemory API and its process injection behavior implemented via the Process32NextW API. Meanwhile, it can capture multiple anomaly triggers and repeated allocations of Read-Write-Execute (RWX) memory. Such signature-tagged APIs can directly reflect the sensitive intentions of software and hold significant reference value for malware analysis.
Based on the aforementioned analysis, this paper integrates sandbox signature rules with API category invocation frequency features to filter key APIs from JSON-formatted analysis reports, ultimately constructing API invocation sequences for subsequent analysis.
The construction process of API invocation sequences is detailed in Algorithm 1, which is divided into four sequential steps: raw API sequence extraction, duplicate API removal, key API selection, and final sequence construction. The algorithm requires three input parameters: a JSON-formatted analysis report, a predefined maximum length of API invocation sequences , and an API index dictionary D.
Step-1 extracts raw API invocation records, each of which contains the following parameters: importance score m, return value r, invocation frequency f, execution status s, duplication ratio p, high-frequency category tag k, signature tag q, selection tag o, and API name a.
Step-2 performs duplicate elimination on redundant APIs according to their duplication ratio p, retaining a subset of representative entries to avoid excessive redundancy.
Step-3 selects key APIs through a three-phase hierarchical strategy: extraction of signature-tagged APIs, extraction of high-frequency category APIs, and extraction of low-frequency category APIs. This selection process terminates once the number of selected APIs reaches the predefined maximum sequence length .
Step-4 collects the names a of all APIs marked as selected in their original invocation order, maps these API names to corresponding indices using the index dictionary D, and finally pads the sequence with the index value 0 to generate a standardized API index sequence with a fixed length of .
3.2.2. Converting Static Files to RGB Images
Referring to and adopting the malware RGB visualization method proposed by Li et al. [25] in 2023, this paper combines the inherent structure of PE files with the statistical properties of ASCII character distribution to break through the limitations of traditional single-channel grayscale images. A novel three-channel color image representation system is established, which significantly enhances the richness of semantic information contained in the images. The construction process of such RGB images is detailed as follows:
Construction of the R channel: The malicious code source file is read byte by byte, and each byte is directly converted to its corresponding ASCII value as the intensity value of the red channel.
Construction of the G channel: Different fixed values are assigned to distinct internal structures of the PE file (e.g., DOS header, PE header, section table, and predefined sections), thereby explicitly encoding file structural information into the green channel.
Construction of the B channel: Based on the different value ranges of the ASCII code corresponding to each byte (e.g., control characters, digits, letters, and extended characters), specific values are set according to their categorical semantics and filled into the blue channel.
RGB image synthesis: First, the R, G, and B channels are aligned in length, with the minimum length adopted to ensure data consistency; second, the three-channel data are combined in row-major order to construct the initial RGB image matrix, with insufficient parts padded with black pixels (0, 0, 0); finally, the image is resized to the standard 224 × 224 resolution using the LANCZOS interpolation algorithm from Python’s PIL library, completing the construction of the final RGB image.
| Algorithm 1: API call sequence construction |
Input: JSON report R, max length , API dictionary D Output: Index sequence of length // Step-1: API Call Sequence Extraction extract tuples from R where:
 // Step-4: Sequence Construction Pad with 0 to length return |
Figure 3 displays RGB visualization samples converted from 12 types of APT malware (including APT1, APT10, APT19, and APT21), while Figure 4 presents image examples of 12 ordinary malware samples processed via the same method. Comparative analysis reveals that images generated by different APT families exhibit distinct texture feature differences, and notable distinguishability also exists in image features between APT malware and ordinary malware.
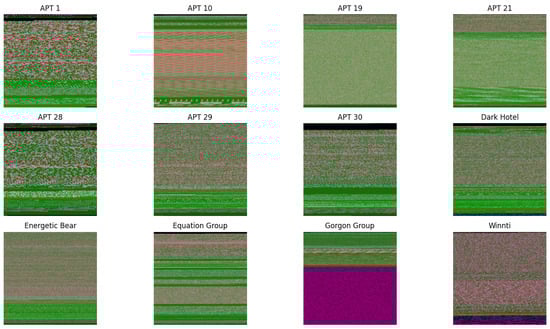
Figure 3.
APT malware RGB image sample.
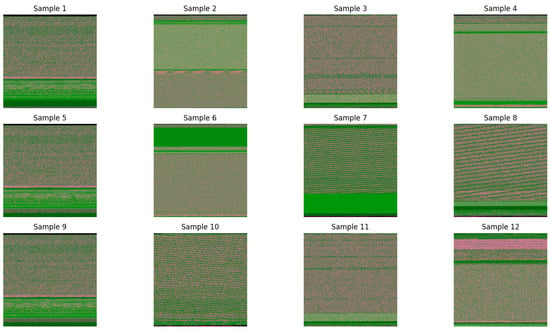
Figure 4.
Ordinary malware RGB image sample.
Notably, the conversion of PE files to RGB images may exert multifaceted technical impacts and give rise to the following issues:
Tail data loss: When the original file exceeds the standard image capacity, truncation is performed and tail data is discarded directly. Such truncation not only causes partial code loss but may also remove critical instruction sequences or encrypted data segments, thereby impairing the accuracy of subsequent analysis.
Structural information loss: The elaborately designed section layout and memory mapping relationships in the original PE file are compressed into simple pixel arrangements after visualization. For instance, the inter-section spacing and arrangement order that originally carry specific security implications lose their inherent semantic information in the image.
Semantic feature blurring: Code segments with different functions may be mapped to similar pixel values, making features that are clearly distinguishable at the binary level difficult to identify. In particular, the unique invocation patterns of API call sequences, which are crucial for security analysis, may be weakened during the conversion.
Interpolation and padding noise interference: Interpolation artifacts generated by resizing may obscure the true features of instruction sequences, while black areas filled at the edges may be misjudged as deliberately zeroed memory blocks. These artificial traces are intertwined with real features, increasing the difficulty of analysis.
Cross-channel feature confusion: Independent encoding of different bytes across respective channels may generate spurious feature combinations, which can be highly similar to real malicious features and lead to misjudgment.
These technical challenges require special attention during the PE file visualization process to ensure that the converted images retain the feature information of the original binary files to the maximum extent possible.
3.3. Semantic Enhancement Module
The semantic enhancement module primarily consists of two components: the sequence modality component DPCFTE-T model and the image modality component DPCFTE-CAS-ViT model. This section focuses on the design principles of these two component models and the DPCFTE module.
3.3.1. DPCFTE
The Dual-Path Convolutional Fusion Token Enhancer (DPCFTE) module performs weighted fusion on local features from different perspectives extracted by dynamic convolution and static convolution via a projection layer to obtain adaptive local representations, which are then assigned to tokens to enhance the semantic representation of each token within its neighborhood. This design dynamically adjusts the semantic representation of each token according to context, boosting the model’s capability to capture the deep semantic information of tokens.
The architecture of the DPCFTE module is illustrated in Figure 5, which is mainly divided into two sub-modules: local feature extraction and local feature fusion. The input data, denoted as (where N is the total number of tokens and C is the number of feature channels), is a two-dimensional tensor.
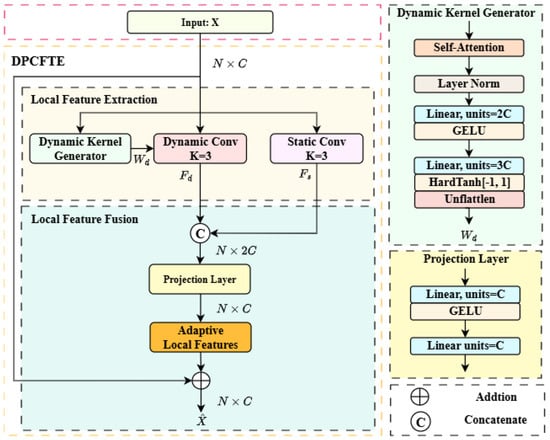
Figure 5.
The structure of DPCFTE.
The local feature extraction module consists of static convolution and dynamic convolution. Both are one-dimensional convolutions with the convolution kernel length K set to 3, performing convolution operations along the first dimension of the input tensor X. The number of feature channels for both input and output is C.
Static convolution adopts fixed shared kernels with identical weights applied across all positions of X, and there is no cross-channel interference. It is designed to extract general local features with translation invariance, denoted as . The calculation formula is as follows:
where ∗ denotes the convolution operation and represents the learnable static kernel.
The calculation process of dynamic convolution is similar to static convolution, which computes the element-wise product of input vectors and kernel weights at each position followed by summation. The key difference lies in that the kernel weights of dynamic convolution are adaptively adjusted based on input, with distinct kernels assigned to different positions. A dynamic kernel generator leverages self-attention to analyze the contextual information of X and generate position-dependent dynamic kernels, thereby capturing input-specific distinctive features . The calculation formula is given by:
where denotes the dynamic kernel. Each position n() of X is allocated an exclusive convolution kernel , and the generation process of dynamic kernels is defined as:
where is a tensor reshaping operation that reshapes the last dimension into the specified format of dynamic kernels; LN denotes layer normalization; G represents the dynamic kernel generator composed of two linear layers with different activation functions; SA is the self-attention computation function, a mechanism that dynamically generates context-aware representations for each position by computing correlation weights between all positions in the input sequence. The calculation processes of the dynamic kernel generator and self-attention are shown in Equations (4) and (5):
where GELU refers to the Gaussian Error Linear Units activation function; Hardtanh denotes the hard hyperbolic tangent function that clips values to the range of [−1, 1], serving to constrain the generated convolution kernel weight parameters; and are the weight matrices of the two linear layers, with and neurons, respectively; and are the bias terms of the two layers; the query, key and value matrices , K, V) are computed as , and , respectively; represents the scaling factor; and Softmax is a row-wise normalized exponential mapping function.
After convolution processing, the local feature fusion module fuses the local features extracted by the dynamic and static convolution branches, and injects the fused local information back into X via residual connection to obtain the enhanced sequence with rich token-adjacent semantics. Specifically, the features of the two branches are first concatenated channel-wise, then fused with adaptive weights via the projection layer and projected back to the feature dimension of X. The calculation process is as follows:
where Concat denotes the concatenation operation; represents the projection layer consisting of two linear transformations: the first layer takes input neurons with GELU activation, mapping the concatenated -dimensional features back to the original C-dimensional space; the second layer has C neurons for final feature weighting.
3.3.2. DPCFTE-T
Based on the Transformer encoder [26], this paper proposes a Transformer model integrated with the DPCFTE module, namely DPCFTE-T. This model strengthens the semantic connections between adjacent tokens in the sequence through the DPCFTE module, and combines the Transformer to model long-range dependencies of the sequence, thereby conducting joint analysis of adjacent tokens and long-distance tokens to achieve richer semantic context representation.
The overall architecture of DPCFTE-T is illustrated in Figure 6, which is formed by stacking DPCFTE-T Blocks. The input is an API index sequence with length L, which is first mapped to a learnable high-dimensional representation through an embedding layer with dimension D, and positional information is explicitly injected via a learnable positional encoding matrix.
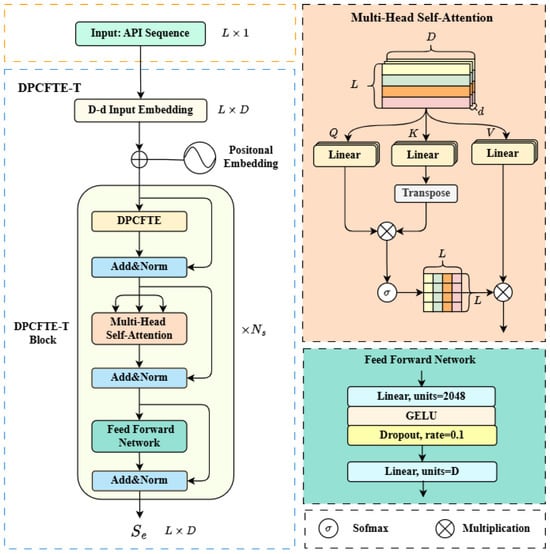
Figure 6.
The structure of DPCFTE-T.
A DPCFTE-T Block consists of a DPCFTE module, a Multi-Head Self-Attention (MHA) module, and a Feed-Forward Network (FFN) module. All modules are connected via residual connections and layer normalization.
The sequence S is processed by the DPCFTE module to extract adaptive local feature representations and apply them to itself, which enriches the semantic information between adjacent tokens in the sequence. Since S meets the requirement of the DPCFTE module for the two dimensional tensor format and its dimensional shape remains stable during model operation, the self-attention mechanism within the module is implemented using MHA, which offers superior contextual analysis capabilities. MHA computes multiple self-attention heads in parallel and fuses their outputs, enabling the model to capture diverse feature dependencies of the input sequence across different representation subspaces simultaneously, thereby obtaining more comprehensive and fine-grained contextual representations.
After local semantic enhancement, the sequence S is fed into the MHA module to enable semantic interaction between tokens within the sequence. This module computes the attention scores of the sequence across different dimensions in parallel through multiple attention heads, concatenates the calculation results of all attention heads, and performs weighted fusion to ultimately capture the global dependencies within the sequence, outputting sequence features with global semantic enhancement. Its specific calculation process is as follows:
where , , and denote the projection matrices for the query, key, and value of the i-th attention head, respectively; represents the i-th attention head; is the scaling factor; denotes the linear transformation matrix; and represents the feature representation of the sequence context.
After dual enhancement of local and global semantics of the sequence, the FFN module performs deeper nonlinear transformation and information fusion, ultimately generating an enhanced semantic sequence with stronger representational capability. The FFN is implemented using linear layer operations of "feature expansion-feature compression", and its specific calculation is as follows:
where and are the weight matrix and bias term of the feature expansion layer, respectively, with 2048 neurons in this layer; and are the weight matrix and bias term of the feature compression layer, respectively, with the number of neurons in this layer being D (consistent with the feature dimension of the input sequence).
3.3.3. DPCFTE-CAS-ViT
CAS-ViT [27] is an efficient vision Transformer variant proposed in 2024. Unlike traditional ViT, which converts images into two-dimensional tensors, CAS-ViT retains the original three-dimensional structure of images. It reduces image resolution and completes image encoding through progressive downsampling operations, compressing image features into smaller-scale feature maps. This design endows the model with lightweight properties and favorable scalability.
However, CAS-ViT continuously alters the dimensional shape of image data during processing. This characteristic tends to compress and dilute the correlation between adjacent positions in the image, which may consequently lead to the loss of critical local detail information. Although the integrated sub-network module of CAS-ViT is capable of extracting local image features, it is implemented via static two-dimensional convolution, which lacks sufficient focus on neighboring regions. The extracted feature representations are relatively static, making it difficult to accurately capture semantic information. To address these issues, this paper improves upon CAS-ViT and proposes the DPCFTE-CAS-ViT model, which replaces the original integrated sub-network with the DPCFTE module. This modification enhances the feature correlation of adjacent image regions while alleviating the loss of local feature information.
The architecture of the DPCFTE-CAS-ViT model is illustrated in Figure 7, consisting of a Stem module, a three-stage encoder module, and a projection module. The RGB image data of the input PE file is a three-dimensional tensor denoted as , where H, W, and C represent the height, width, and number of feature channels of the image, respectively.
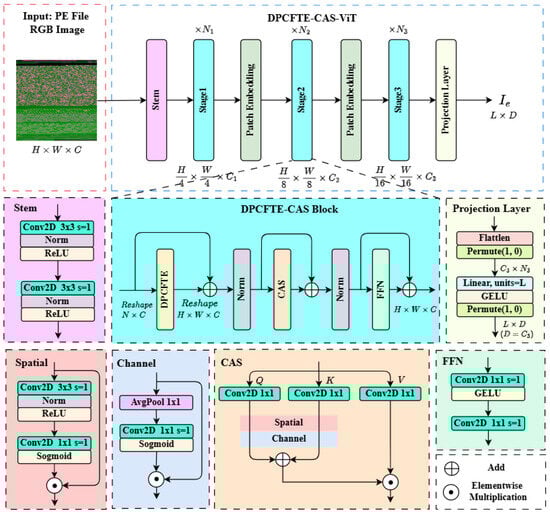
Figure 7.
The structure of DPCFTE-CAS-ViT.
The input image size is . Directly feeding such data into subsequent modules would incur excessive computational costs. Therefore, the image must first undergo initial downsampling via the Stem module to reduce its resolution. This module is composed of two consecutive convolutional layers with a stride of 2, which downsample the image resolution from to .
After the input image I is processed by the Stem module to obtain an initially compressed feature map, it is fed into the three-stage encoder module for further downsampling and compression encoding. The encoder module is constructed by serially connecting three stages of DPCFTE-CAS Blocks, with two Patch Embedding modules inserted between stages. The three stages contain , , and DPCFTE-CAS Blocks, respectively. The Patch Embedding modules, placed between each stage, adopt convolutional layers with a stride of 2 to achieve 2× downsampling. As a result, the sizes of the feature maps output by the second and third stages are and , respectively.
The DPCFTE-CAS Block serves as the core unit of the model, comprising a DPCFTE module, a convolutional additive self-attention (CAS) module, and a feed-forward neural network (FFN) module. All modules are connected via residual connections and two-dimensional batch normalization.
Since the image I is in the form of a three-dimensional tensor, it must be converted into a two-dimensional tensor of shape via the Reshape operation before being fed into the DPCFTE module (where N denotes the total number of pixels in the image, calculated by . The DPCFTE module not only extracts the correlation features between adjacent pixels of the image, but also integrates both dynamic and static convolution mechanisms, endowing the extracted local features with stronger adaptability.
The local features extracted by the DPCFTE module are two-dimensional tensors that cannot be directly fused with the original three-dimensional feature maps. These features need to be reshaped back into the three-dimensional tensor form of shape via the Reshape operation, and then added to the original feature maps through residual connections.
CAS is an attention mechanism tailored to the image data format. Its core principle lies in realizing the equivalent function simulation of the self-attention mechanism through information interaction and integration in the spatial and channel domains.
Specifically, in the spatial domain branch, the image I is successively processed by a convolution and a convolution in the spatial domain to reduce the number of channels to 1. An activation function is then applied to generate a spatial attention map, which is ultimately multiplied element-wise with the original input features to complete the weighting process. The calculation procedure is expressed as follows:
where D denotes depthwise convolution, BN represents batch normalization, ReLU and Sigmoid are two types of activation functions, and ⊙ denotes the element-wise multiplication operation.
In the channel domain branch, the model employs a convolution to integrate correlation information across different channels, compressing the feature map size to while maintaining the number of channels unchanged. An activation function is subsequently used to generate a channel attention map, which is also multiplied element-wise with the original input features. The calculation process is given by:
where P represents the adaptive pooling layer.
CAS stacks the spatial attention and channel attention operations to obtain a fused feature map after spatial-channel domain information interaction. Meanwhile, it replaces the multiplication operation in traditional self-attention with an addition operation to calculate the correlation between queries and keys. Its output process can be expressed as:
where Q, K, and V are obtained via convolution; denotes the spatial and channel domain interaction operation; is a linear transformation used for integrating contextual information, which is implemented via separable convolution in this paper.
After being processed by the DPCFTE module and the CAS module, the image features integrate both local and global information. Finally, the features are fed into the FFN module, which performs nonlinear transformation on the image feature channels to achieve deep integration of effective information. The calculation process of the FFN is consistent with Equation (9), following the “feature expansion-feature compression” operation mode. The key difference is that two convolutional layers are used instead of fully connected layers, and the number of output channels in the expansion layer is set to four times the number of input channels.
The image I is processed by the three-stage encoder to yield a feature map with a resolution of . To align its shape with the sequence for cross-attention interaction, a projection module is required to complete dimension conversion.
The specific conversion process is as follows: first, a Flatten operation is applied to reshape the feature map into , and then a permute operation is used to adjust the dimension order to ; second, a linear layer with L neurons and the GELU activation function are employed to map the tensor to ; finally, another permute operation is performed to adjust the dimension order, resulting in the feature sequence (where is set to be consistent with D).
3.4. Semantic Fusion Module
Cross-Attention (CA) serves as the core component of the semantic fusion module. It enables cross-modal interaction and fusion of data from heterogeneous sources, helping the model fully explore cross-domain correlation information. The calculation process of cross-attention is similar to that of multi-head self-attention, with the core difference lying in that the queries and key–value pairs are derived from different data sources.
In the semantic fusion module, two cross-attention modules with the Dropout mechanism are adopted to perform bidirectional interactive modeling on the sequence and the sequence . By taking one sequence as the query and the other as the key–value pairs, the fused sequences and are obtained, respectively. Finally, the global semantic fusion representation is generated by concatenation along the first dimension, and the specific process is as follows:
where denotes the final output semantic fusion matrix.
3.5. Classification Module
The fused semantic matrix contains a large number of redundant features. If directly used in its entirety, the valid information within it is susceptible to noise interference, ultimately leading to a decline in the robustness of the classifier. Given that the numerical structure of is highly similar to that of textual data, the classification module in this study adopts a TextCNN-based classifier architecture (as illustrated in Figure 8), which is constructed by serially connecting two components: TextCNN and a Multi-Layer Perceptron (MLP).
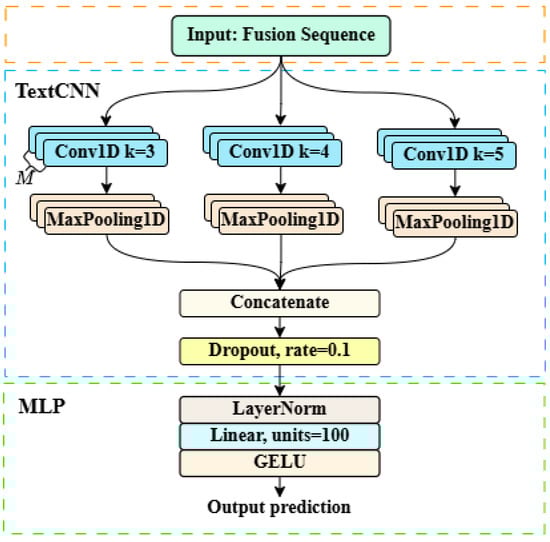
Figure 8.
The TextCNN-based classifier.
TextCNN [28] is a convolutional neural network architecture specifically designed for text processing. Its core structure includes convolutional layers, pooling layers, and an output layer. The specific computations of each layer are as follows:
where denotes the weight matrix of the convolutional kernel, is the corresponding bias term, and the convolutional kernels are designed with three scales: 3, 4, and 5. represents the feature map generated by convolution, where is the number of features produced by convolution and M is the number of filters used for each convolution kernel. is the feature vector after pooling, and is the output feature vector. The Dropout operation is employed to randomly deactivate some neurons, thereby avoiding overfitting.
The features extracted by TextCNN are fed into the MLP to complete the final classification prediction. The MLP adopts a two-layer linear structure: the first layer is configured with 100 neurons, and a layer normalization operation is added before the first layer to stabilize the training process, followed by a GELU activation function. The second layer outputs the classification prediction results. The model training takes the cross-entropy loss function as the supervision signal, and optimizes the network parameters by minimizing the difference between the probability distributions of the predicted labels and the ground-truth labels. The loss function is defined as follows:
where and denote the ground-truth class probability and the predicted class probability, respectively.
4. Experiment
4.1. Dataset Construction and Partitioning
To evaluate the performance of HMSF-ADM in APT malware detection tasks, this paper constructs two APT malware datasets:
- APT Malware Family Classification Dataset: It includes 12 APT malware families with a total of 2739 samples.
- APT Malware Binary Classification Dataset: It consists of APT malware and ordinary malware, with a total of 5478 samples, including 2739 samples for each type of malware.
The APT malware samples utilized in this study were sourced from APTMalware, a public repository hosted on GitHub (https://github.com/cyber-research/APTMalware, accessed on 17 July 2025). This dataset encompasses representative malware samples from 12 APT groups, namely APT1, APT10, APT19, APT21, APT28, APT29, APT30, Dark Hotel, Energetic Bear, Equation Group, Gorgon Group, and Winnti. The annotation and attribution information of the samples were synthesized from open-source threat intelligence reports published by multiple renowned cybersecurity vendors, thereby ensuring the credibility of the data sources. Notably, given that the dataset contains a substantial number of samples employing anti-sandbox detection techniques as well as non-PE format files, rigorous filtering and preprocessing were performed on the raw data prior to conducting the experiments.
For the purpose of comparison, the ordinary malware samples were selected from DikeDataset, another public GitHub (https://github.com/iosifache/DikeDataset, accessed on 30 July 2025) repository with a total of approximately 8000 samples. To ensure the fairness of the experiments, a subset of ordinary malware samples was randomly extracted in a quantity matching that of the APT samples for subsequent analyses.
All datasets are randomly partitioned into training and test sets at an 8:2 ratio by category, to ensure consistent class distribution between the training and test subsets. Since the samples only include two formats (EXE and DLL), stratified sampling is also performed on these two types of samples during partitioning to maintain a consistent proportion. Due to the imbalanced sample size across different categories in the APT malware family dataset, resampling techniques are applied to the training set for data augmentation, expanding the size of minority classes to match that of majority classes while keeping the test set unchanged. The augmented training set contains 3792 samples in total. Detailed dataset partitioning information is presented in Table 1.

Table 1.
APT family dataset partition before and after augmentation.
4.2. Experimental Setup
All experiments in this study were implemented using Python 3.8 based on the PyTorch 2.4.0 framework. The experimental environment was configured with a Linux operating system, and the hardware specifications included an Intel(R) Xeon(R) Gold 6150 CPU @ 2.70 GHz, 32 GB of memory, and an NVIDIA GeForce RTX 4080 SUPER graphics card. The parameters of each module in the HMSF-ADM model and the training hyperparameters are presented in Table 2.
Table 2.
Experimental parameter settings.
All API call sequences input to the text encoder DPCFTE-T were uniformly standardized to a fixed length of 512. The feature channel dimension of the embedding layer was set to 300, the number of encoder layers was 4, and the number of heads for multi-head attention was 6.
The image size input to the image encoder DPCFTE-CAS-ViT was . The number of DPCFTE-CAS blocks and the number of sampled feature channels for each stage of the encoder were [2, 2, 2] and [96, 192, 300], respectively.
The number of heads for cross-attention was set to 6. TextCNN was equipped with filters of kernel sizes [3, 4, 5], with 100 filters for each size.
The HMSF-ADM model was optimized using the Stochastic Gradient Descent (SGD) algorithm. The base learning rate was set to 0.01, the batch size was 32, and the maximum number of training epochs was 100. To prevent overfitting, a dynamic early stopping mechanism was adopted: training was terminated when the improvement in the validation set loss function between consecutive epochs was less than for 10 consecutive times.
4.3. Experimental Evaluation Metrics
To comprehensively evaluate the performance of the model in APT malware detection tasks, this study adopts Accuracy, Precision, Recall, and F1-Score as the primary evaluation metrics. The calculation formulas for each metric are presented in Table 3.
Table 3.
Evaluation metrics.
Among these metrics, Accuracy is defined as the proportion of correctly predicted samples relative to the total number of samples, which is used to measure the overall performance of the model on the entire task. Precision refers to the proportion of true positive samples among those predicted as positive by the model; Recall refers to the proportion of positive samples correctly identified by the model among all actual positive samples. The F1-Score is the harmonic mean of Precision and Recall, which is often used for the comprehensive evaluation of model performance in the case of class imbalance. TP (True Positive) denotes the number of samples correctly classified as positive; FP (False Positive) denotes the number of negative samples incorrectly classified as positive; TN (True Negative) denotes the number of samples correctly classified as negative; FN (False Negative) denotes the number of positive samples incorrectly classified as negative.
In addition, to obtain stable and reliable evaluation results, macro-averaged values and weighted-averaged values are calculated on the test set to reflect the classification performance of the model on both minority and majority classes. For multi-classification and binary classification tasks, corresponding confusion matrices are used for statistical analysis. The discriminative ability of the model is further evaluated by plotting Receiver Operating Characteristic (ROC) with Area Under the Curve (AUC) curves and Precision–Recall (PR) curves with Average Precision (AP).
4.4. Baselines
To comprehensively verify the effectiveness of the proposed method, this study constructs multiple baseline models for comparative experiments.
Given that the dataset contains two modalities, namely API sequences and images, this study selects commonly used text models (TextCNN, BiLSTM [29], Transformer) and vision models (ResNet [30], EfficientNet [31], ViT [32]) as baselines. These models have been widely adopted in early-stage malware detection research and can serve as references for measuring the improvement effects of deep learning methods. TextCNN excels at capturing local patterns; BiLSTM is adept at modeling sequential dependencies; Transformer is suitable for capturing long-range dependencies; ResNet features stable residual connections and favorable transferability; EfficientNet achieves high efficiency and resource savings via compound scaling. For multimodal malware detection, this study also employs hybrid models (BiLSTM-CNN and TextCNN–ResNet50) as additional comparative baselines.
In the design of the data augmentation strategy, considering the characteristics of multimodal data, direct sample generation may disrupt the semantic correlation between different modalities. Therefore, this study adopts resampling techniques to process the training set. By balancing the sample size of each class, the generalization ability of the model is enhanced while preserving the inherent correlation of the original multimodal data.
These methods are compared with the proposed HMSF-ADM detection framework to verify its advantages in detection accuracy and generalization ability.
4.5. Experimental Results and Analysis
4.5.1. Evaluation of HMSF-ADM on APT Malware Family Classification
This study evaluates the ability of HMSF-ADM to identify different families of APT malware using the APT malware family dataset, with the experimental results presented in Table 4.
Table 4.
Multiclass classification results on APT family classification dataset.
An analysis of the detection results for 12 categories of APT malware reveals significant variations in classification performance across different families. The Equation Group achieves the most favorable detection performance, with an F1-Score as high as 0.9872. Malware samples from this APT group are primarily distributed in DLL file format, exhibiting highly concealed characteristics. Notably, although these samples demonstrate highly consistent behavioral patterns in sandbox environments (the API call sequences of all samples are almost identical), it is precisely this distinct behavioral difference from the other 11 APT families (which display diverse behavioral characteristics in sandboxes) that renders them the most easily identifiable category.
The detection performance of APT 10 and APT 28 is relatively inferior, with F1-Scores failing to reach 0.9. This outcome is closely associated with the attack characteristics of these two APT groups: first, they employ highly sophisticated and diverse attack vectors, such as zero-day exploit, lateral movement, and memory resident techniques; second, their attack targets cover a wide range, including supply chains, email systems, gateways, and log servers; most importantly, their attack features exhibit high similarity to those of other APT families. These factors collectively contribute to relatively high false positive rates and false negative rates.
Dark Hotel achieves a precision and recall of 0.9231. This result indicates that while the overall detection performance is satisfactory, a small number of samples from this group adopt attack methods highly similar to those of other APT families, which is prone to causing classification confusion.
The reliability of classification results for APT 19 is constrained due to the extremely small sample size in the test set (only 6 samples), making it difficult to ensure that all samples are correctly classified.
The remaining APT families all yield favorable detection performance, with F1-Scores exceeding 0.95. This fully demonstrates that the HMSF-ADM detection method achieves remarkable effectiveness in identifying these APT categories.
Figure 9 presents the confusion matrix results of the 12 APT malware families in the test set. It can be observed from the matrix distribution that the vast majority of samples are accurately classified into their corresponding APT families, while a small number of samples suffer from misclassification. Specifically, four families (APT 1, APT 10, APT 28, and Dark Hotel) exhibit a relatively large number of mispredicted samples, with the quantity of misclassified samples significantly higher than that of other APT families.
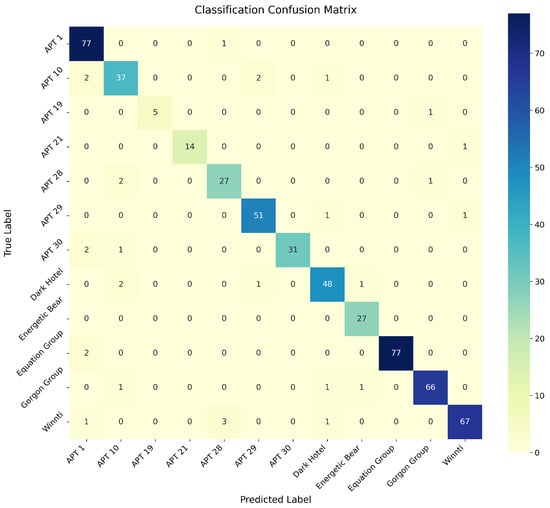
Figure 9.
Confusion matrix for APT malware family classification.
This phenomenon indicates that these four APT groups share certain similarities in their attack methods, posing great challenges for the classification model to distinguish between them. In particular, the attack features of some samples show a high degree of overlap, making it difficult for the model to achieve accurate differentiation. In contrast, samples from other APT families exhibit better discriminability, resulting in higher classification accuracy.
To comprehensively evaluate the discriminative performance of the classification model, we analyze two key metrics: the ROC curve with its AUC and the PR curve with its AP, as shown in Figure 10 and Figure 11.
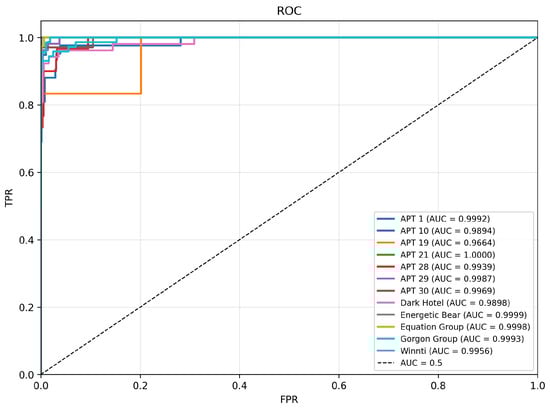
Figure 10.
ROC and AUC curves for APT malware family classification experiments.
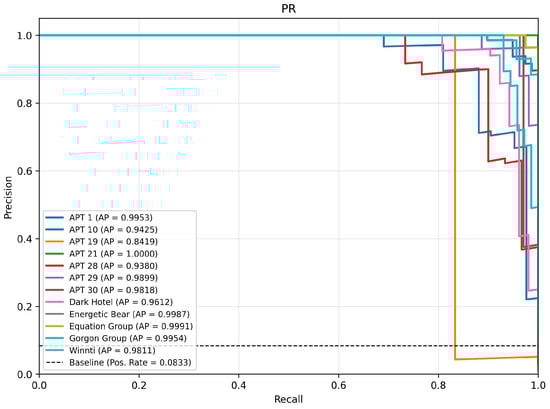
Figure 11.
PR and AP curves for APT malware family classification experiments.
In the ROC-AUC analysis, the model demonstrates excellent classification performance. The results show that the AUC values of most APT families are close to the theoretically optimal value of 1.0. Among them, three families—APT 21 (AUC = 1.000), Energetic Bear (AUC = 0.9999), and Equation Group (AUC = 0.9998)—exhibit particularly outstanding performance, achieving nearly perfect class separability. Notably, even for APT 6, the family with the most severe sample imbalance, the model still achieves an excellent AUC value of 0.9664, which fully verifies the model’s robust classification capability in the face of data imbalance.
In the PR-AP analysis, the AP score of APT 19 was only 0.8419, with its PR curve lying below the baseline. This phenomenon is mainly attributed to the insufficient volume of training samples, which consequently leads to an elevated false positive rate. In contrast, the AP scores of the other 8 APT malware families—excluding APT 1, APT 10 and Dark Hotel—all exceeded 0.98. Notably, the AP score of APT 21 reached the ideal value of 1.0. This result fully demonstrates that the HMSF-ADM model yields an extremely low false positive rate in the detection of most APT malware families.
Overall, HMSF-ADM achieves superior performance in the task of APT family classification, and it is capable of realizing efficient and accurate identification of multiple APT families.
4.5.2. Evaluation of HMSF-ADM on APT Malware Binary Classification
To comprehensively assess the generalization capability of the HMSF-ADM model, it was further applied to the APT malware binary classification task (APT malware vs. ordinary malware), with the experimental results presented in Table 5. This evaluation focuses on examining the model’s applicability in broader threat detection scenarios.
Table 5.
Binary classification results.
The experimental results demonstrate that HMSF-ADM achieves outstanding performance in the binary classification task. For APT malware detection, the model exhibits extremely high sensitivity, with a recall rate of 0.9915 while maintaining a precision of 0.9846, indicating that missed detections are minimal. In terms of ordinary malware identification, the model attains a precision of 0.9903 and a recall rate of 0.9828, keeping the false positive rate at an extremely low level.
An analysis of the confusion matrix illustrated in Figure 12 reveals that despite the favorable overall classification performance, a small number of samples are still misclassified (9 ordinary malware samples and 5 APT malware samples). These misclassification cases further confirm that certain behavioral features overlap between some APT malware and ordinary malware, which may be attributed to the fact that some APT groups adopt technical methods of ordinary malware to conceal the nature of their advanced threats.
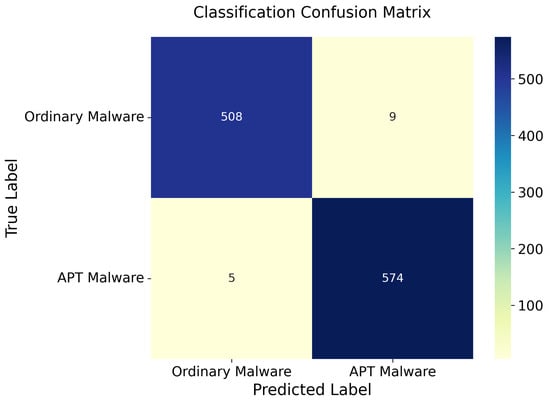
Figure 12.
Confusion matrix for APT binary classification.
Overall, the HMSF-ADM model performs excellently in the task of distinguishing between APT malware and ordinary malware, as it can not only effectively identify advanced persistent threats but also accurately discriminate conventional malware.
4.5.3. Multi-Classification Evaluation of HMSF-ADM with Data Augmentation
Finally, this subsection discusses whether class imbalance in training samples affects model performance in the multimodal scenario.
Research by Salaza et al. [33] has shown that the learning capability of a model is mainly constrained by the scale of the training set and the feature dimension. In this study, the initial feature dimensions of the sequence modality and image modality are and , respectively, which are both compressed to 100 dimensions after encoding via the HMSF-ADM module. Theoretically, for a 12-class classification task, the minimum number of training samples should be . Nevertheless, considering the inter-class feature similarity and the information loss introduced by dimensionality reduction, the actual number of samples required is far higher than this theoretical value.
To verify the minimum training sample size, the model was trained separately on the original training set (2182 samples) and the augmented training set (3729 samples), with their performance compared on the same test set. The results are presented in Table 6.
Table 6.
Experimental results using different training datasets.
Experimental results indicate that the performance difference between the original and augmented training sets is only 0.023, with both accuracy and F1-Score stably ranging between 0.94 and 0.95. This demonstrates that under the experimental setup of this study, class imbalance in the training set does not significantly affect the model’s learning effectiveness. Furthermore, in the prior classification evaluation of 12 APT families conducted in this study, the model also exhibited no obvious class preference.
In conclusion, the multimodal framework adopted in this study can already meet the training requirements with the scale of the original training set. Moreover, the multimodal learning mechanism itself has the advantage of alleviating the impact of class imbalance, enabling the model to maintain stable classification performance without additional data balancing processing.
4.6. Performance Comparison
This section explores the dominant position of the HMSF-ADM model in the field of multimodal malware detection through performance comparison and analysis. Meanwhile, to further investigate the impact of multimodal feature fusion, a performance comparison and analysis are first conducted on the models of sequence modality and image modality separately.
4.6.1. Performance Comparison of Sequence-Modal Models
To verify the effectiveness and superiority of the DPCFTE-T model in the API call sequence classification task, this study selects BiLSTM, TextCNN, and Transformer as baseline models, and also incorporates relevant models proposed by other scholars to carry out multi-classification performance comparison experiments on a unified API call sequence experimental dataset. The results are presented in Table 7.
Table 7.
Model performance comparison on API call sequence dataset.
The experimental results indicate that the difference in F1-Score between the baseline models BiLSTM and TextCNN is negligible, but the precision and recall of BiLSTM are both lower than those of TextCNN. Meanwhile, the precision of TextCNN is significantly higher than its recall. This phenomenon reveals the core characteristic of the convolutional architecture: this architecture optimizes the comprehensive classification performance by reducing the false positive rate (improving precision) at the cost of a partial increase in the false negative rate (reducing recall). In contrast, the BiLSTM architecture demonstrates a more balanced performance in terms of precision and recall. Among all baseline models, the Transformer model exhibits classification performance far exceeding that of other models, with an F1-Score as high as 0.9082, which fully reflects its strong capability to capture long-range dependencies in text sequences.
Among the methods proposed by other researchers, the core design of the LSTM-SA model lies in hierarchical LSTM encoding of individual API call features, combined with a self-attention mechanism to achieve feature weighting. The performance of this model is highly dependent on the scale of training samples, and it can only give full play to its advantages under the condition of large sample sizes, thus showing poor performance in small-sample classification scenarios. In contrast, although the BERT–Transformer–TextCNN (BTT) model integrates the architectural designs of multiple advanced models, its simple stacked fusion approach causes the TextCNN module to suppress the advantages of the Transformer model, resulting in performance that is even weaker than that of the basic Transformer model.
The DPCFTE-T model proposed in this study embeds the DPCFTE module before the multi-head attention mechanism of the Transformer, which effectively enhances the semantic correlation between adjacent tokens in the API call sequence. Meanwhile, relying on the advantage of the multi-head attention mechanism in modeling long-distance token dependencies, it further improves classification performance. The experimental results show that, while ensuring high computational efficiency, the DPCFTE-T model comprehensively outperforms all comparison models in all classification metrics, achieving an F1-Score of 0.9117.
However, the experimental results demonstrate that the performance improvement effect of DPCFTE on the Transformer model is limited, which may be attributed to the insufficient scale of the current API call sequence dataset. To more comprehensively evaluate the effectiveness of this method, future research can construct larger-scale API call sequence datasets or attempt validation on general text datasets.
4.6.2. Performance Comparison of Image-Modal Models
To verify the performance of the DPCFTE-CAS-ViT model, this study selects ResNet34, ResNet50, EfficientNet-B0, EfficientNet-B2, and ViT as baseline models, and conducts classification performance comparison experiments on the RGB image dataset of PE files. Detailed results are presented in Table 8.
Table 8.
Model performance comparison on PE file RGB image dataset.
The experimental results show that among the baseline models, ResNet50 achieves classification performance significantly superior to that of other models, with an F1-Score as high as 0.9077, which fully demonstrates the unique advantages of the residual architecture in image classification tasks. Although the EfficientNet series models realize efficient feature compression through the scaling strategy, the compression process is accompanied by the loss of partial feature information, which results in their weaker image feature extraction capability than that of the ResNet series. Notably, the F1-Score of the ViT model is only 0.8578, which is lower than that of the ResNet series. This indicates that the Transformer architecture, which performs excellently in the text domain, has certain limitations in image data modeling.
The DPCFTE-CAS-ViT model proposed in this study takes CAS-ViT as the basic architecture, and enhances the model’s capability of extracting local features by introducing the DPCFTE module to replace the original integrated sub-network. Experimental data demonstrate that the original CAS-ViT model has performance comparable to that of ViT, with neither of their F1-Scores exceeding 0.87. In contrast, the F1-Score of DPCFTE-CAS-ViT reaches 0.9120, surpassing that of the ResNet50 model. This verifies the effectiveness of the DPCFTE module, which can effectively reduce the risk of diluted correlation between image pixels during the downsampling process and significantly improve the capability of CAS-ViT to capture local features.
In conclusion, the DPCFTE-CAS-ViT model exhibits excellent performance in the PE image classification task and is worthy of further in-depth research.
4.6.3. Comparison of Multimodal-Based APT Malware Family Classification
To verify the effectiveness of HMSF-ADM in the multimodal malware detection task, this study conducts comparative experiments using various baseline methods and approaches proposed by other researchers. Table 9 summarizes the experimental results of different multimodal models on the APT family classification dataset. Overall, the model proposed in this study achieves the best performance across all evaluation metrics.
Table 9.
APT family classification experimental results comparison.
From the experimental results of the baseline models, BiLSTM-CNN and TextCNN–ResNet50 yield comparable performance, with their F1-Scores both exceeding 0.90—surpassing the performance of these models in unimodal tasks. This result indicates that the multimodal feature fusion strategy can indeed effectively enhance the performance of malware detection.
In the comparison with methods proposed by other researchers, we find that the combination of Transformer and ViT achieves the best performance, with an F1-Score of 0.9316. This verifies the advantage of the Transformer architecture in capturing the correlation between sequence features and image features. In contrast, the combination of Bidirectional Temporal Convolutional Network (BiTCN) and enhanced EfficientNet exhibits poor performance in the multi-classification task (F1-Score = 0.8269), which may be attributed to the excessive discrepancy in feature extraction across different categories, leading to unsatisfactory feature fusion results. Notably, the classification performance of the combination of BERT and enhanced multi-scale CNN (MSCNN) is comparable to that of the Transformer architecture, indicating that these two models have similar efficacy in feature extraction.
The HMSF-ADM model proposed in this study demonstrates outstanding performance both with and without the DPCFTE module, outperforming all comparison models with F1-Scores exceeding 0.94; the complete model even achieves an excellent F1-Score of 0.9463. These experimental results fully demonstrate that the innovative architectural design of HMSF-ADM has significant advantages in the field of multimodal malware detection and possesses certain practical value.
4.6.4. Comparison of Multimodal-Based APT Malware Binary Classification
To further verify the generalization capability of the HMSF-ADM model, this study conducts comparative experiments on a binary classification dataset composed of APT malware and ordinary malware, with the experimental results presented in Table 10.
Table 10.
APT malware binary classification experimental results comparison.
The experimental results show that the baseline models and methods proposed by other researchers achieve excellent performance in the binary classification task, with accuracy and F1-Score generally exceeding 0.98, which further confirms the advantages of multimodal fusion methods in malware detection tasks. However, BiTCN-TAEfficient exhibits relatively inferior performance, achieving an accuracy and F1-Score of 0.9763. This is consistent with its performance in the multi-classification task, indicating that there is still room for optimization in the feature fusion capability of this architecture.
In contrast, the HMSF-ADM model proposed in this study achieves the best performance in the binary classification task, with both accuracy and F1-Score reaching 0.9872. This result not only verifies the superiority of the model in the APT malware multi-classification task but also proves its robust performance in the binary classification detection task.
4.7. Ablation Experiment
In this section, multiple variants of the proposed HMSF-ADM model are constructed by removing the DPCFTE-T module, DPCFTE-CAS-ViT module, semantic fusion module, and TextCNN module, respectively. Ablation experiments are conducted on the APT multi-classification dataset to evaluate the impact of each module on the attribute classification performance. Table 11 presents the ablation experimental results of HMSF-ADM, which are used to assess the contribution of each module to the overall model performance.
Table 11.
Ablation study results.
The results demonstrate that DPCFTE-T plays a more critical role in model performance than DPCFTE-CAS-ViT. However, when applied individually, neither of them can achieve accuracy and F1-Score exceeding the threshold of 0.93, which reveals that unimodal features have obvious performance bottlenecks in APT malware detection tasks.
Notably, the performance degradation of HMSF-ADM is relatively minor when the cross-attention module or TextCNN module is removed. This phenomenon indicates two key points: first, the features extracted by DPCFTE-T and DPCFTE-CAS-ViT are inherently highly discriminative, and satisfactory classification performance can be maintained even without interactive fusion; second, in the classification stage, replacing TextCNN with ordinary pooling operations for feature extraction still yields acceptable classification performance.
Based on the above analysis, the features extracted by each module of the HMSF-ADM model possess favorable independent discriminative capability, and the model architecture exhibits high robustness with relatively low dependence on key components. While ensuring detection performance, the model allows a certain degree of simplification, providing flexibility for practical deployment.
4.8. Stability Evaluation
Model stability is a core metric for measuring its generalization capability and reliability. To evaluate the stability of the HMSF-ADM model, this study conducts repeated experiments on the APT multi-classification dataset using multiple random seeds.
The dataset is randomly partitioned into training and test sets at an 8:2 ratio. Seven random seeds (42, 73, 101, 137, 199, 313, 521) are selected for independent experiments. Taking Accuracy and F1-Score as the evaluation metrics, the performance fluctuations are quantified by the maximum value, minimum value, mean value, standard deviation, and coefficient of variation (CV). The experimental results are presented in Table 12.
Table 12.
Experimental results with random dataset partitions.
The experimental results demonstrate that the model exhibits favorable stability: for Accuracy, the maximum value is 0.9408, the minimum value is 0.9102, the mean value is 0.9277, the standard deviation is 0.01, and the CV is only 1.08%; for F1-Score, the maximum value is 0.9402, the minimum value is 0.9097, the mean value is 0.9264, the standard deviation is 0.01, and the CV is 1.08%. The CV values of both metrics are below 1.1%, indicating that the random partitioning of the training and test sets has a minimal impact on the model performance. Even under the random seed with the worst performance (199), the core metrics remain above 0.9.
In conclusion, the proposed model achieves excellent stability in scenarios with random dataset partitioning. Its core metrics are almost all above 0.92 with extremely low fluctuation ranges, which indicates that its performance is not dependent on specific data partitioning. The model can stably capture the core features of the data and thus possesses practical application value.
4.9. Robustness Evaluation
To evaluate the robustness of the proposed HMSF-ADM model against perturbed or obfuscated inputs, this study designs supplementary experiments based on the APT multi-classification dataset. Specifically, tampered test sequences and images are constructed to simulate the common evasion tactics of malware. Specifically, perturbation operations are implemented on API call sequences and image data using real anti-detection technology simulations, while strictly preserving the original functions of malware samples. Three perturbation schemes are designed as follows.
The first scheme is mild image perturbation: image resolution degradation is achieved through “downsampling and upsampling” operations, or new samples are generated by adding Gaussian noise, with an overall weak perturbation intensity. The second scheme is targeted perturbation of API embedding vectors: perturbations are generated based on the Fast Gradient Sign Method (FGSM) and directly applied to the embedding vectors of API calls. FGSM is an efficient gradient-sign-based adversarial example generation method that computes the perturbation direction via a single-step backpropagation. We test the model’s prediction accuracy under “semantic-preserving minor noise” perturbations by slightly shifting feature representations in the embedding space. The third scheme is cross-modal joint perturbation: FGSM is utilized to simultaneously impose perturbations on the API embedding layer and image data. The experimental results are presented in Table 13.
Table 13.
Robustness evaluation of HMSF-ADF against adversarial perturbations on APT multiclass data.
The experimental results show that the model performance is slightly affected when images are subjected to sampling and interpolation perturbations, with both accuracy and F1-Score maintained at 0.9174; even with Gaussian noise added, the two metrics can still stabilize above 0.86. However, FGSM perturbations exert a significant impact on model performance: when the perturbation intensity , all performance metrics of the model decrease by 24.11%; only under the extremely small perturbation of can the performance reduction be controlled at 8.90%. More critically, the negative impact of FGSM cross-modal joint perturbation is more prominent—regardless of whether or , the model performance decreases by more than 16%, indicating that the proposed model has obvious deficiencies in anti-interference capability.
Since this study does not use perturbed data for training, the classification performance of the model in anti-interference and anti-obfuscation scenarios is limited. Considering that the core contribution of this study focuses on multimodal malware detection, systematic research on adversarial defense and robustness optimization will be carried out in future work.
4.10. Limitations Analysis
Although the HMSF-ADM model proposed in this study demonstrates favorable adaptability in the tasks of APT malware family classification and APT malware binary classification, and its performance outperforms existing baseline models and related methods in the field, several limitations still need to be pointed out:
- Dataset Scale Limitation: The number of APT family training samples used in the current experiments is less than 3000. This scale limitation impairs the comprehensive evaluation of the model’s generalization capability and also hinders the full verification of the performance improvement effect of the DPCFTE module.
- Data Partition Sensitivity: In the stability evaluation, the average F1-Score of APT family classification is 0.9264, which is significantly different from the optimal experimental result of 0.9463. This indicates that the model performance is highly dependent on the representativeness of the training dataset, and it is necessary to include most typical samples of various APT families to achieve the best performance.
- Limitations of Feature Extraction Methods: The extraction of API call sequences is based on sandbox environments and high-frequency API screening, which may fail to effectively handle APT samples designed with targeted evasion mechanisms, leading to the inclusion of interfering APIs in the analysis. In the process of converting PE files into RGB images, critical information loss or noise introduction may occur, which affects multimodal fusion.
- Insufficient Anti-Interference Capability: Robustness tests show that the model is relatively sensitive to noise. Even minor interference can significantly affect the multimodal fusion effect and result in performance degradation.
In conclusion, although the HMSF-ADM model exhibits good detection performance, the aforementioned limitations still need to be addressed before practical deployment, especially in terms of data quality, model robustness, and feature extraction methods, which require further optimization.
5. Conclusions
This paper proposes an APT malware detection model named HMSF-ADM and designs a DPCFTE module to enhance local semantic representations. Based on DPCFTE, two models were constructed: DPCFTE-T and DPCFTE-CAS-ViT.
Experimental results indicate: (1) The HMSF-ADM model outperforms existing comparative models on the multimodal malware detection task and can, to some extent, mitigate the detection challenges posed by the high concealment of APT malware; (2) The DPCFTE module provides improvements for both Transformer and CAS-ViT architectures. The DPCFTE-T and DPCFTE-CAS-ViT models equipped with this module outperform benchmark models in the text and image domains on classification tasks; (3) The HMSF-ADM model has low dependency on specific components, offering good flexibility and tunability and can be adapted as needed for practical application scenarios; (4) The current model still has shortcomings in resisting interference and handling confusing samples, and requires further design and improvement in this area.
Future research will proceed along three directions: first, expanding data augmentation techniques and defenses against obfuscation and interference; second, introducing more advanced design ideas to the HMSF-ADM model such as knowledge distillation, generative adversarial networks, and hierarchical fusion; third, validating the effectiveness of the HMSF-ADM model and the DPCFTE module on larger-scale datasets and conducting deeper structural optimization and theoretical analysis, with the aim of further improving the models’ generalization ability and interpretability against complex adversarial environments.
Author Contributions
Conceptualization, L.W.; methodology, C.P.; software, C.P.; validation, L.W. and C.P.; investigation, C.P.; data curation, C.P.; writing—original draft, C.P.; writing—review and editing, C.P.; visualization, C.P.; supervision, L.W.; project administration, L.W.; funding acquisition, L.W. All authors have read and agreed to the published version of the manuscript.
Funding
Work was supported in part by the National Natural Science Foundation of China under Grant 62262004.
Institutional Review Board Statement
Not applicable.
Informed Consent Statement
Not applicable.
Data Availability Statement
This study utilizes two publicly available malware datasets: (1) the APT Malware dataset (https://github.com/cyber-research/APTMalware, accessed on 17 July 2025) containing advanced persistent threat samples, and (2) the DikeDataset (https://github.com/iosifache/DikeDataset, accessed on 30 July 2025) comprising ordinary malware specimens. Both datasets are openly accessible to support academic research in malware detection and analysis.
Conflicts of Interest
The authors declare that this research was conducted in the absence of any commercial or financial relationships that could be construed as potential conflicts of interest.
References
- Hutchins, E.; Cloppert, M.; Amin, R. Intelligence-Driven Computer Network Defense Informed by Analysis of Adversary Campaigns and Intrusion Kill Chains. Lead. Issues Inf. Warf. Secur. Res. 2011, 1, 80. [Google Scholar]
- Alshamrani, A.; Myneni, S.; Chowdhary, A.; Huang, D. A Survey on Advanced Persistent Threats: Techniques, Solutions, Challenges, and Research Opportunities. IEEE Commun. Surv. Tutor. 2019, 21, 1851–1877. [Google Scholar] [CrossRef]
- Arora, P.; Gupta, R.; Malik, N.; Kumar, A. Malware Analysis Types & Techniques: A Survey. In Proceedings of the 5th International Conference on Information Management & Machine Intelligence, New York, NY, USA, 23–25 November 2023; pp. 135:1–135:6. [Google Scholar]
- Bai, Z.; Wang, P.; Xiao, T.; He, T.; Han, Z.; Zhang, Z.; Shou, M.Z. Hallucination of Multimodal Large Language Models: A Survey. arXiv 2024, arXiv:2404.18930. [Google Scholar] [CrossRef]
- Zhou, J.; Zhao, Y.; Zhang, X.; Huang, C. Uncovering APT Malware Traffic Using Deep Learning Combined with Time Sequence and Association Analysis. Comput. Secur. 2022, 120, 102809. [Google Scholar] [CrossRef]
- Peng, G.; Zhang, D.; Gao, Y.; Li, C. PowerDetector: Malicious PowerShell Script Family Classification Based on Multi-Modal Semantic Fusion and Deep Learning. China Commun. 2023, 20, 202–224. [Google Scholar]
- Zhang, J.; Liu, S.; Liu, Z. Attribution Classification Method of APT Malware Based on Multi-Feature Fusion. PLoS ONE 2024, 19, e0304066. [Google Scholar] [CrossRef]
- Xiao, N.; Lang, B.; Wang, T.; Chen, Y. APT-MMF: An Advanced Persistent Threat Actor Attribution Method Based on Multimodal and Multilevel Feature Fusion. Comput. Secur. 2024, 144, 103960. [Google Scholar] [CrossRef]
- Li, J.; Zhang, R.; Liu, J. MM-LogVec: System Log Anomaly Detection Method Based on Multimodal Representation Learning. In Proceedings of the ICASSP 2025—2025 IEEE International Conference on Acoustics, Speech and Signal Processing (ICASSP), Hyderabad, India, 6–11 April 2025; pp. 1–5. [Google Scholar]
- Lemay, A.; Calvet, J.; Menet, F.; Fernandez, J.M. Survey of publicly available reports on advanced persistent threat actors. Comput. Secur. 2018, 72, 26–59. [Google Scholar] [CrossRef]
- Bao, H.; Wang, W.; Liu, F. Towards Open-Set APT Malware Classification under Few-Shot Setting. In Proceedings of the GLOBECOM 2023—2023 IEEE Global Communications Conference, Kuala Lumpur, Malaysia, 4–8 December 2023; pp. 6844–6849. [Google Scholar]
- Gibert, D.; Mateu, C.; Planes, J. The Rise of Machine Learning for Detection and Classification of Malware: Research Developments, Trends and Challenges. J. Netw. Comput. Appl. 2020, 153, 102526. [Google Scholar] [CrossRef]
- Li, S.; Li, Y.; Wu, X.; Otaibi, S.A.; Tian, Z. Imbalanced Malware Family Classification Using Multimodal Fusion and Weight Self-Learning. IEEE Trans. Intell. Transp. Syst. 2023, 24, 7642–7652. [Google Scholar] [CrossRef]
- Guo, J.; Wang, H.; Xu, Y.; Xu, W.; Zhan, Y.; Sun, Y.; Guo, S. Multimodal Dual-Embedding Networks for Malware Open-Set Recognition. IEEE Trans. Neural Netw. Learn. Syst. 2024, 36, 4545–4559. [Google Scholar] [CrossRef] [PubMed]
- Xuan, B.; Li, J.; Song, Y. BiTCN-TAEfficientNet Malware Classification Approach Based on Sequence and RGB Fusion. Comput. Secur. 2024, 139, 103734. [Google Scholar] [CrossRef]
- Chen, S.; Lang, B.; Liu, H.; Chen, Y.; Song, Y. Android Malware Detection Method Based on Graph Attention Networks and Deep Fusion of Multimodal Features. Expert Syst. Appl. 2024, 237, 121617. [Google Scholar] [CrossRef]
- Li, X.; Liu, L.; Liu, Y.; Zhao, Y.; Zhang, P.; Liu, H. Multimodal Fusion for Android Malware Detection Based on Large Pre-trained Models. IEEE Trans. Softw. Eng. 2025, 51, 1569–1590. [Google Scholar] [CrossRef]
- Zhang, S.; Su, H.; Liu, H.; Yang, W. MPDroid: A Multimodal Pre-Training Android Malware Detection Method with Static and Dynamic Features. Comput. Secur. 2025, 150, 104262. [Google Scholar] [CrossRef]
- Xie, P.; Zhao, M.; Hu, X. PiSLTRc: Position-Informed Sign Language Transformer with Content-Aware Convolution. IEEE Trans. Multimed. 2022, 24, 3908–3919. [Google Scholar] [CrossRef]
- Song, Y.; Zheng, Q.; Liu, B.; Gao, X. EEG Conformer: Convolutional Transformer for EEG Decoding and Visualization. IEEE Trans. Neural Syst. Rehabil. Eng. 2023, 31, 710–719. [Google Scholar] [CrossRef]
- Liu, C.; Dai, Y. Patch Attention Convolutional Vision Transformer for Facial Expression Recognition with Occlusion. Inf. Sci. 2023, 619, 781–794. [Google Scholar] [CrossRef]
- Bao, T.; Ren, N.; Luo, R.; Wang, B.; Shen, G.; Guo, T. A BERT-Based Hybrid Short Text Classification Model Incorporating CNN and Attention-Based BiGRU. J. Organ. End User Comput. JOEUC 2021, 33, 1–21. [Google Scholar] [CrossRef]
- Abas, A.R.; Elhenawy, I.; Zidan, M.; Othman, M. BERT-CNN: A Deep Learning Model for Detecting Emotions from Text. Comput. Mater. Contin. 2022, 71, 2943–2961. [Google Scholar] [CrossRef]
- Rafiepour, M.; Sartakhti, J.S. CTRAN: CNN-Transformer-based Network for Natural Language Understanding. Eng. Appl. Artif. Intell. 2023, 126, 107013. [Google Scholar] [CrossRef]
- LI, Q.Y.; GAO, L.T.; LIU, M.Z. Research on RGB Image Method of Malicious Code. J. Hebei Inst. Archit. Civ. Eng. 2023, 41, 226–231. [Google Scholar] [CrossRef]
- Vaswani, A.; Shazeer, N.; Parmar, N.; Uszkoreit, J.; Jones, L.; Gomez, A.N.; Kaiser, L.; Polosukhin, I. Attention is All You Need. arXiv 2023, arXiv:1706.03762. [Google Scholar]
- Zhang, T.; Li, L.; Zhou, Y.; Liu, W.; Qian, C.; Hwang, J.N.; Ji, X. CAS-ViT: Convolutional Additive Self-attention Vision Transformers for Efficient Mobile Applications. arXiv 2024, arXiv:2408.03703. [Google Scholar]
- Kim, Y. Convolutional Neural Networks for Sentence Classification. arXiv 2014, arXiv:1408.5882. [Google Scholar] [CrossRef]
- Huang, Z.; Xu, W.; Yu, K. Bidirectional LSTM-CRF Models for Sequence Tagging. arXiv 2015, arXiv:1508.01991. [Google Scholar] [CrossRef]
- He, K.; Zhang, X.; Ren, S.; Sun, J. Deep Residual Learning for Image Recognition. In Proceedings of the IEEE Conference on Computer Vision and Pattern Recognition, Las Vegas, NV, USA, 27–30 June 2016; pp. 770–778. [Google Scholar]
- Tan, M.; Le, Q.V. EfficientNet: Rethinking Model Scaling for Convolutional Neural Networks. In Proceedings of the International Conference on Machine Learning, Long Beach, CA, USA, 9–15 June 2019; Volume 97. [Google Scholar]
- Dosovitskiy, A.; Beyer, L.; Kolesnikov, A.; Weissenborn, D.; Zhai, X.; Dehghani, M.; Minderer, M.; Heigold, G.; Gelly, S.; Uszkoreit, J.; et al. An Image is Worth 16 × 16 Words: Transformers for Image Recognition at Scale. arXiv 2021, arXiv:2010.11929. [Google Scholar] [CrossRef]
- Salazar, A.; Vergara, L.; Vidal, E. A Proxy Learning Curve for the Bayes Classifier. Pattern Recognit. 2023, 136, 109240. [Google Scholar] [CrossRef]
- Wei, C.; Li, Q.; Guo, D.; Meng, X. Toward Identifying APT Malware Through API System Calls. Secur. Commun. Netw. 2021, 2021, 8077220. [Google Scholar] [CrossRef]
- Zhang, J.; Liu, S.; Liu, Z. Research on APT Malware Detection Based on BERT-Transformer-TextCNN Modeling. In Proceedings of the 2024 International Conference on Generative Artificial Intelligence and Information Security, New York, NY, USA, 10–12 May 2024. [Google Scholar]
Disclaimer/Publisher’s Note: The statements, opinions and data contained in all publications are solely those of the individual author(s) and contributor(s) and not of MDPI and/or the editor(s). MDPI and/or the editor(s) disclaim responsibility for any injury to people or property resulting from any ideas, methods, instructions or products referred to in the content. |
© 2026 by the authors. Licensee MDPI, Basel, Switzerland. This article is an open access article distributed under the terms and conditions of the Creative Commons Attribution (CC BY) license.