Featured Application
The evaluation of different bioelectrical impedance fat-free mass equations enables the selection of the best predictive formula to be used in an adult Romanian population.
Abstract
Bioelectrical impedance analysis (BIA) is a widely used and an easy-to-apply method for determining body composition. However, its accuracy depends on population-specific equations. The aim of the present study is to identify the most appropriate fat-free mass (FFM) prediction equation for an Eastern European population using air-displacement plethysmography (ADP) as the reference method. The study group included 101 Caucasian subjects (56 women and 45 men) with an average body mass index (BMI) of 25.37 ± 5.45 kg/m2. One set of FFMBIA values was automatically calculated with the analyzer (Maltron BioScan 920-2), and four others were computed using the published equations of Kyle, Kanellakis, Heitman, and Deurenberg. The results were compared to FFMADP values measured using a BOD POD Gold Standard Body Composition Tracking System by Bland–Altman analysis. The smallest bias was obtained with the equation by Deurenberg, which underestimated FFM by only −0.22 ± 4.52 kg. The largest bias was obtained with the equation by Kyle (5.92 ± 4.73 kg), followed by the formula of Kanellakis (3.04 ± 4.65 kg). The equations by Heitman and the Maltron inbuilt formula overestimated FFM by 2.15 ± 4.27 kg and, respectively, 1.95 ± 4.3 kg. Although Maltron’s automatically generated values were very strongly correlated with ADP results (CCC = 0.93, SEE = 4.7), the formula by Deurenberg provided the most reliable estimates in the studied population.
1. Introduction
Obesity has become a significant burden on health systems worldwide due to its increasing prevalence and its association with various pathologies, such as metabolic and cardiovascular diseases [1,2]. Almost 60% of European adults are overweight or obese. In Eastern Europe, the incidence is higher, with eight out of ten adults having excess body weight and almost one third of the population being affected by obesity [3].
Obesity is defined as abnormal or excessive fat accumulation; therefore, the evaluation of body composition plays an important role in its diagnosis and management. Apart from basic anthropometric measurements, several laboratory techniques can be used to assess nutritional status, such as dual-energy X-ray absorptiometry (DEXA), underwater weighing (UWW), air-displacement plethysmography (ADP), isotope dilution, and bioelectrical impedance analysis (BIA). Although well-established, some of these techniques are expensive, time-consuming, technically demanding, and require highly trained personnel.
BIA offers several advantages over other techniques. The measurement procedure is simple, fast, and non-invasive, yielding reproducible results. The equipment is portable and safe; therefore, measurements can be performed in patients with various diseases and used as a bedside assessment method.
BIA determines the impedance (Z) of the body by applying a low-intensity alternating current, typically within a frequency range of 1–1000 kHz. Impedance consists of two components, resistance (R) and reactance (Xc), related by the equation [4,5]. Conductive tissues and electrolyte-rich fluids permit current flow, whereas adipose tissue resists it. Reactance primarily reflects cell membrane capacitance, while resistance relates to extra- and intracellular fluids. BIA can use a single frequency (commonly 50 kHz) or multiple frequencies (typically 5–200 kHz) [6]. Using the connection between reactance, resistance, and total body water (TBW), body composition can be computed. The literature mentions over 100 different equations [6,7]. They have been derived using linear regression and different reference techniques. The large number of formulas is partially explained by the approximations used in this technique. For a cylinder in a homogenous conductive material, the resistance is proportional to the length (L) and inversely proportional to the cross-sectional area. Using an appropriate coefficient, the body is assimilated to an equivalent cylinder and an empirical relationship is described between the lean body mass, typically containing 73% water, and the impedance coefficient (height2/R) [6,8,9].
Differences in body fat distribution or differences in tissue resistivity between populations influence the accuracy of the equations [10,11,12,13,14]. Therefore, the fat-free mass (FFM) equations derived so far are population-specific. The choice of the formula must address the age, ethnicity, and clinical situation of the population to be tested [6,7,9].
The topology of the Romanian territory has influenced the intermixing of different populations. The study of mtDNA haplogroups has revealed a clear association with European populations. While the population in the area surrounded by the Carpathian arch is more closely related to Central European groups, the rest of the Romanian population shares more genetic similarities with the Balkans [15].
The higher incidence of obesity in the Romanian population compared to other European countries is associated with dietary habits, such as the increased consumption of animal products (e.g., meat and dairy products), bread, and pastries, as well as insufficient physical activity, inadequate hydration, and altered meal patterns [16,17,18,19].
ADP is a well-established reference technique, being relatively accurate and having high repeatability [20]. It allows for the measurement of body volume by repeated volume and pressure variations in a two-chamber, air-filled, closed system. Thus, the density and, subsequently, the FFM can be further computed.
The purpose of the present study is to evaluate the FFM derived by five previously published BIA equations for the general population against the FFM measured using ADP. This comparison aimed to determine the best predictive BIA equation to be used in an adult Romanian population.
2. Materials and Methods
2.1. Study Group
The study participants were recruited via flyers and announcements on social media. One of the researchers (O.M.) managed the enrollment telephone calls. On this occasion, a brief description of the methods was offered to the volunteers. Additionally, they were screened for acute and chronic diseases and informed about the manufacturers’ recommendations for both techniques, which were to be respected.
Healthy subjects aged 18 and above and reporting a stable body weight (<3% total body weight loss in the previous 6 months) were recruited in the study group. Exclusion criteria consisted of the following: (1) acute infection; (2) chronic diseases (cardiac, hepatic, renal, thyroid, respiratory, diabetes mellitus) that might cause hydro-electrolytic imbalance or alteration of the thoracic gas volume; (3) cancer; (4) neurological disorders (e.g., Parkinson disease, paresis, tremor); (5) claustrophobia; (6) significant mental impairment; and (7) pregnancy.
The study group included 101 participants (women and men) who were eligible for the study. Enrollment in the study was preceded by a detailed description of the measurement techniques, and participants were assured of the non-invasiveness of the procedures. The subjects were informed of their right to drop out at any moment and for any reason, and signed an informed consent form. The study was approved by the university’s Committee of Research Ethics (no. 20/24 July 2019 and no. 42/2 June 2022).
The participants abstained from eating and drinking for at least 8 h before presentation and from vigorous exercise for at least 12 h. Upon the arrival in the laboratory, subjects were instructed to empty their bladders and to remove their jewelry, watch, and glasses.
The determinations for each participant were performed within the same day. The sequence started with the anthropometric measurements, followed by BIA and ADP. The order of the two techniques was randomly assigned to avoid a test order effect.
2.2. Anthropometric Measurements
Two of the researchers (O.M. and I.C.) were trained to collect the data in a consistent manner. Weight and height were measured.
The subject’s body mass was measured to the nearest 0.001 kg using BOD POD’s scale, with the subjects barefoot and wearing light clothes. Height was determined to the nearest 0.5 cm with a GIMA 27,335 wall-mounted tape measure (GIMA, Gessate, Italy), with the subject’s Frankfort plane held horizontally and the participant barefoot. Measurements were repeated three times, and the mean value was computed. BMI was calculated as the ratio between weight (kg) and squared height (m2).
2.3. ADP Measurements
Body composition was evaluated for each participant using a BOD POD Gold Standard Body Composition Tracking System (COSMED USA, Concord, CA, USA) with software version 5.3.2. The measurements were preceded by calibration and a system quality check.
The subjects were instructed according to the manufacturer’s recommendations. In order to reduce measurement artifacts caused by loose clothing trapping isothermal air, participants wore minimal, form-fitting attire, such as swimsuits or spandex shorts with a non-padded exercise bra.
Measurements were performed by a team of two trained and experienced operators (IC and OM), following manufacturer’s instructions [21].
The complete measuring procedure was repeated three times. Each repetition consisted of two measurements. If they were within 1%BF, the mean value was computed. Otherwise, a third measurement was performed, and the two closest were used to compute the mean value.
Body density was converted to body fat percentage using the Siri equation. The predicted thoracic gas volume was used to account for air in the lungs.
FFM values were retrieved for further statistical analysis.
2.4. BIA Measurements
BIA was performed using a multifrequency Maltron BioScan 920-2 (Maltron International Ltd., Rayleigh, Essex, UK). All measurements were performed by a team of two trained operators (I.C. and O.M.) according to ESPEN guidelines [22].
The subjects maintained a supine position, with hands and feet extended, in slight abduction, to avoid contact with the torso. They were instructed to remain still for 10 min before measurements and during testing. Four adhesive electrodes were placed on the hand and foot of the dominant side, after the skin was cleaned with 70% alcohol. The electrodes were positioned as follows: two on the upper limb—the signal one over the metacarpophalangeal joints of the second and third fingers and the detection one proximally over the styloid processes of the radius and ulna—and the other two on the lower limb—the first over the metatarsophalangeal joints of the second and third toes and the second midway between the ankle bones, over the tibiotalar region. A minimum of 5 cm spacing between the signal and detection electrodes was ensured.
A code was generated for each participant, and the operators introduced the age, gender, weight, and height. The following results were extracted after measurement: resistance (R), impedance (Z), and reactance (Xc) at 50 kHz and the FFM value. The resistance index was computed as the ratio between the square of the height (cm) and the resistance (Ω).
2.5. Prediction Equations
Four equations from the literature were tested in the present study. They were selected based on the population on which they were developed (adult general population, European Caucasian) and the number of subjects on which they were developed; they are presented in Table 1. All formulas address the appropriate hand-to-foot BIA technique. The analysis also included Maltron’s outputs for FFM, although the device employs an undisclosed proprietary equation.

Table 1.
FFM prediction equations tested in the study population.
2.6. Statistical Analysis
The data were introduced in an Excel database (Microsoft Corporation, Redmond, WA, USA, Microsoft Excel 2010) using a double data entry method. Further data statistical analysis was performed using the R software version 4.5.1 (R Core Team 2024, Vienna, Austria).
The results are presented as mean ± standard deviation (SD). The normality of data was assessed with the Shapiro–Wilk test. The variables were compared using paired-samples t-tests when the data were normally distributed; otherwise, the Wilcoxon test was employed.
The correlations between FFM measured by ADP and FFM measured by BIA, or computed using the selected formulas, were assessed through simple regression analysis. The Pearson correlation coefficient was used to assess the linear relationship between the measurements, calculated as the covariance of the variables divided by the product of their standard deviations. In order to evaluate the agreement between the methods, the concordance correlation coefficient (CCC) was computed. The concordance was interpreted using the following cut-off points: negligible (CCC < 0.1), weak (CCC = 0.1–0.39), moderate (CCC = 0.4–0.69), strong (CCC = 0.7–0.89), and very strong (CCC = 0.9–1) [27]. The standard error of the estimate (SEE) was computed as , where SSE represents the sum of the squared differences between BIA values and ADP results and n is the number of subjects.
Bland–Altman plots were used to further assess the agreement between the two measurement techniques. The differences between paired measurements were plotted against their corresponding means. The bias—defined as the mean value of the differences—and the 95% limits of agreement—calculated as the mean ± 1.96* the standard deviation of the differences—were also included in the plots.
The analysis was also performed within sex-specific subgroups and is included in the Supplementary Materials.
3. Results
3.1. General Characteristics
Fifty-six woman and forty-five men were considered for analysis. Their general characteristics and body composition parameters are presented in Table 2.
Table 2.
General characteristics and body composition parameters of the study subjects (mean ± standard deviation, range of values).
3.2. Evaluation of FFM Equations
FFM values offered by the Maltron BioScan 920-2 and those calculated using the formulas by Kyle, Kanellakis, Heitmann, and Deurenberg are presented in Table 3, as well as the mean differences with the FFMADP, the limits of agreement, the Pearson coefficient, the CCC, and the SEE. ΔFFM was obtained as the difference between FFMBIA and FFMADP.
Table 3.
Comparison of fat-free mass between BIA equations and ADP in the studied group.
FFM was overestimated by the equations of Kyle and Kanellakis by 5.92 ± 4.73 kg and 3.04 ± 4.65 kg, respectively. Smaller biases were observed with Maltron’s inbuilt formula and the equation by Heitmann, which overestimated FFM by 1.95 ± 4.3 kg and 2.15 ± 4.27 kg, respectively. The best agreement was obtained with the equation by Deurenberg, which underestimated FFM by only 0.22 ± 4.52 kg.
FFM measured using all five equations correlated well with FFMADP, as shown by the values of the Pearson coefficient, which ranged between 0.93 and 0.94. A strong concordance with the ADP results was detected for Kyle’s and Kanellakis’ formulas, as shown by the CCC values (0.84 and 0.89, respectively). The FFM obtained using the other equations showed very strong concordance (CCC ranging from 0.93 to 0.94).
The Bland–Altman plots confirm the observations made by the previous statistical analysis. (Figure 1) Deurenberg’s equation (Figure 1E) showed the best agreement, followed by Maltron’s inbuilt equation (Figure 1A). Furthermore, the FFM differences obtained with both formulas were symmetrically distributed along the line of equality, suggesting that the errors were independent of the mean FFM. On the other hand, the Kanellakis (Figure 1C) and Heitmann’s formulas (Figure 1D) significantly overestimated FFM in individuals with low FFM and underestimated it in those with high FFM.
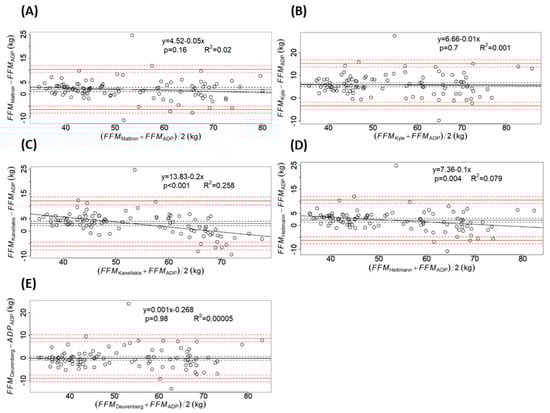
Figure 1.
Bland–Altman plots comparing fat-free mass (FFM) obtained by air-displacement plethysmography (ADP) and FFM obtained by each bioelectrical impedance equation (BIA): (A) Maltron’s inbuilt formula; (B) equation by Kyle; (C) equation by Kanellakis; (D) equation by Heitman; (E) equation by Deurenberg. The solid black line represents the bias, calculated as the mean of the differences and the black dashed lines correspond to the 95% confidence interval (CI). The red solid lines depict the limits of agreement, computed as the bias ± 1.96* standard deviation of the differences, while the red dashed lines mark their 95% CI. The linear regression equation between the differences and the means is given together with the p-value and the coefficient of determination (R2): Maltron - y = 4.52 − 0.05x, p = 0.16, R2 = 0.02; Kyle - y = 0.66 − 0.01x, p = 0.7, R2 = 0.001; Kanellakis - y = 13.83 − 0.2x, p < 0.001, R2 = 0.258; Heitmann - y = 7.36 − 0.1x, p = 0.004, R2 = 0.079; Deurenberg - y = 0.001x − 0.268, p = 0.98, R2 = 0.00005.
The analysis within sex-specific subgroups is presented in the Supplementary Materials. Deurenberg’s equation provided the best prediction in both genders, underestimating FFM by only 0.09 ± 3.1 kg in women and by 0.39 ± 5.86 kg in men. The biases for the other four formulas were larger in women than in the overall group.
By contrast, in men, the equation by Kyle was the only one to show significant differences (5.44 ± 5.9 kg, p < 0.001). The formulas by Heitman, Kanellakis, and the inbuilt Maltron equation showed biases ranging from 1.04 ± 5.58 kg to 1.55 ± 5.5 kg.
In both genders, the correlations between the two methods were poorer when compared with those obtained for the entire study group. Strong concordance was observed for the formulas by Deurenberg and Heitmann in women, and moderate concordances of FFMBIA results were observed with ADP measurements for the rest of the equations, as indicated by CCC values (with values ranging between 0.47 and 0.838 in women and 0.52–0.698 in men) (Table S1).
4. Discussion
BIA is a method with several advantages for assessing body composition. Several studies aiming to validate the inbuilt equations for different BIA devices found poor accuracy for the formulas and underlined the need to use population-specific equations [28,29,30].
The purpose of the present study was to identify the best predictive BIA equation to use in a Romanian adult population. The selection of the formulas to be tested was based on the procedure proposed by Campa et al. [7]. The equations selected in the present study address foot-to-hand technology, are adapted for a healthy adult population, and take geographical ancestry into account [15]. The analysis also included the inbuilt formula of the Maltron Bioscan 920-2.
FFM calculated by four of the five equations tested in the present study differed significantly from FFMADP. The biases ranged from 1.95 ± 4.3 kg for the Maltron formula to 5.92 ± 4.73 for the Kyle formula. A proportional bias was detected for the equations proposed by Kanellakis and Heitmann, both of which overestimated FFM, particularly in individuals with lower lean tissue values. On the other hand, the equation by Deurenberg showed a bias of only 0.22 ± 4.52 kg.
There are several possible explanations for the biases detected in the present study. It is generally acknowledged that the accuracy of BIA in the estimation of body composition depends upon the use of a specific population equation. Since BIA is not a direct method to assess body composition, the development of the equations was based on several assumptions. One of them is that the complex geometry of the human body is reduced to a model of five interconnected cylinders. The relationship between body fat and BMI is influenced by ethnicity. For the same BMI, Chinese subjects showed lower body fat compared to Indian subjects [31]. Hispanic American women tend to have more body fat than European American or Afro American ones with the same BMI [32]. Furthermore, the geometry of the body is also different among ethnic groups. It was observed that Afro-American subjects have longer appendicular bone lengths than Caucasians for the same stature [33]. Limb length and body weight relate positively to resistance [4,34]. Therefore, body shape, strongly influenced by ethnicity and environmental factors, has an important impact on FFM determined by BIA. Given the aforementioned findings, the present study selected equations addressing Caucasian populations.
The equations used in the present study have been previously tested in other European populations (Table S2). The formula by Kyle, which showed the largest bias in the present study, overestimated FFM by only 0.2 kg in a Swiss population [35] and by 0.64 kg in a Scandinavian one [36]. A larger bias was observed in Greek and North-African subjects, reaching values of 2.035 kg and 3.16 kg, respectively. At the other end, the equation by Deurenberg, which offered the best prediction in our study group, underestimated FFM by 6.7 kg in Swiss elderly subjects [35]. However, Kanellakis et al. reported results similar to the findings of the present study: 0.808 kg in women and −0.027 kg in men [24]. A possible explanation lies in the reference methods used in deriving the FFM equations. Kyle et al. used DEXA as the criterion method, whereas Deurenberg et al. used underwater weighing. The latter shares similar principles with ADP, as both are density-based methods. Underwater weighing determines total body volume by measuring the difference between a subjects’ weight in water and in air [37]. ADP, on the other hand, uses Boyle’s law and rapid volume–pressure oscillations in a two-compartment sealed chamber to measure body volume. Although each method has specific limitations, both rely on the same equations to compute body fat [38].
BIA’s accuracy is dependent on hydration status. Although it has been previously shown that FFM hydration is relatively constant in mammals (73.2%) [39], its value may vary according to age, obesity status, ethnicity, or pathological conditions [39,40,41,42,43]. It is also acknowledged that age is associated with significant changes in body composition, such as a decline in FFM [35]. Therefore, the inclusion of age as a variable in a FFM predictive equation may improve accuracy. Among the equations included in the analysis, only those by Heitman and Deurenberg included age, with a higher regression coefficient in the latter. Nevertheless, the formula by Kyle—exhibiting the highest bias in the present study—was developed specifically for an all-age Swiss population and offered a bias of only 0.2 kg in subjects over 65 years [35], which is comparable to that obtained with the formula by Deurenberg in the present study.
The present study aimed to validate the equations within gender subgroups. All five formulas showed smaller biases in men than in women. However, agreement with the reference method was better in the latter, as demonstrated by the regression coefficients and the CCC. The formula proposed by Deurenberg showed the best performance in both genders. Although this formula showed a mean difference of only −0.09 ± 3.1 kg in women compared with the FFMADP and a strong agreement with the values obtained by ADP, it exhibited a proportional bias, narrowing the FFM range over which the equation shows good agreement with the reference method. When analyzing raw BIA parameters, it can be observed that resistance had a higher value in women, although their height was smaller than men. These results may be attributable to differences in body composition between the two genders, with men having higher proportions of FFM and total body water [44].
Other factors may also contribute to the observed differences, such as between-device inconsistencies. Maltron’s inbuilt formula has provided the second-best prediction, overestimating FFM by 1.95 ± 4.3 kg. The results provided by commercially available BIA devices are often based on proprietary undisclosed equations, which may not be suitable for a specific population. Several devices are characterized by reduced accuracy in estimating body fat percentage in subjects with values at either end of the population distribution. This may be attributed to bias in the selection of the population used to develop the manufacturer’s algorithm or to a tendency to provide consumers with a “relatively normal” estimate [7,45,46]. Furthermore, biases may also arise from differences in the raw parameters provided by various devices, determined by technical or biological factors [47]. Therefore, prior to clinical use of BIA in clinical settings, a validation study and careful selection of predictive equations are necessary.
The formulas tested in the present study were developed between 1990 and 2020. Methodological procedures were updated in 2004 [22], and three of the equations analyzed in the present study were developed prior to these updates. Therefore, inconsistencies in the standardization of food and fluid intake before assessment, skin cleansing, or electrode placement may have influenced measurement results [7].
Our study has several limitations. Although the study group was balanced in regard to gender and covered a wide range of BMIs, almost half of the subjects were aged between 30 and 50 years, and only one subject was above 60 years. Older subjects are often more reticent to participate in health studies. Therefore, the results cannot be extrapolated for elders, and a future study is needed for this age group. Another potential limitation concerns the generalizability of our findings, as the sample was drawn from a single region of the country and might not be nationally representative. Therefore, future research will involve a larger study group and include other regions of the country, allowing for a more detailed analysis and the assessment of differences according to age groups, BMI, and physical activity levels.
The emergence of machine learning-based healthcare systems and the implementation of AI techniques for anthropometry promise to improve patient care. The outcomes are dependent on the quality of data acquisition of the user-derived data and on the design of the algorithms. Therefore, correct assessment of body composition parameters is not only necessary at an individual level, but also for the generalizability of the models for different ethnic groups [48,49].
5. Conclusions
It is acknowledged that the results provided by proprietary, undisclosed equations of BIA devices may not suit different populations. It is therefore recommended to use devices that allow for access to raw impedance parameters, and also to use population-specific predictive equations.
Although the Maltron inbuilt equation showed relatively good agreement with the values obtained by ADP, the formula by Deurenberg had the best predictive value.
The prediction value of BIA equations depends on the sample size and demographic characteristics of the populations, as well as on the reference method employed in their development.
Supplementary Materials
The following supporting information can be downloaded at https://www.mdpi.com/article/10.3390/app16021082/s1. Figure S1: Bland-Altman plots comparing fat-free mass obtained by air-displacement plethysmography (ADP) and fat-free mass obtained by each bioelectrical impedance equation: (A) Maltron’s inbuilt formula; (B) Kyle’s equation; (C) Kanellakis’ equation; (D) Heitman’s equation; (E) Deurenberg’s equation in women. The bias is indicated by a black solid line with the 95% confidence interval (CI) as black dashed lines. The limits of agreement (bias± 1.96SD) are marked by red solid lines with their CIs in red dashed lines. The linear regression equation is provided together with the p-value and the coefficient of determination (R2): Maltron – y = 7.78 – 0.128x, p = 0.18, R2 = 0.015; Kyle – y = 0.238x – 4.35; Kanellakis – y = 5.56 – 0.023x, p = 0.76, R2 = 0.002; Heitmann – y = 3.28 – 0.005x, p = 0.94, R2 = 0.00009; Deurenberg = y = 0.232x – 9.77, p = 0.003, R2 = 0.138.; Figure S2: Bland-Altman plots comparing fat-free mass obtained by air-displacement plethysmography (ADP) and fat-free mass obtained by each bioelectrical impedance equation: (A) Maltron’s inbuilt formula; (B) Kyle’s equation; (C) Kanellakis’ equation; (D) Heitman’s equation; (E) Deurenberg’s equation in men. The bias is indicated by a black solid line with the 95% confidence interval (CI) as black dashed lines. The limits of agreement (bias± 1.96SD) are marked by red solid lines with their Cis in red dashed lines. The linear regression equation is provided together with the p-value and the coefficient of determination (R2): Maltron – y = 8.96 – 0.114x, p = 0.36, R2 = 0.019; Kyle: y = 0.85 – 0.039 x, p = 0.77, R2 = 0.02; Kanellakis – y = 51.95 – 0.78x, p < 0.001, R2 = 0.497; Heitmann - y = 14.2 – 0.203x, p = 0.12, R2 = 0.033; Deurenberg – y = 4.96 – 0.083x, p = 0.53, R2 = 0.009; Table S1: Comparison of FFM between BIA equations and ADP within sex-specific subgroups; Table S2: Comparison table of results (biases and limits of agreement) from other studies evaluating equations included in the present study.
Author Contributions
Conceptualization, R.H.; methodology, R.H., I.C., and O.M.; software, R.H.; validation, I.C. and O.M.; formal analysis, R.H.; investigation, O.M. and I.C.; data curation, O.M. and I.C.; writing—original draft preparation, R.H., I.C., O.M., and V.M.; writing—review and editing, R.H.; visualization, V.M.; supervision, R.H. All authors have read and agreed to the published version of the manuscript.
Funding
This research was funded by “Victor Babes” University of Medicine and Pharmacy Timisoara, covering the costs of publication for this research paper.
Institutional Review Board Statement
This study was conducted in accordance with the Declaration of Helsinki and approved by the Committee of Research Ethics of the “Victor Babes” University of Medicine and Pharmacy of Timisoara (resolutions no. 20 from 24 July 2019 and no. 42 from 2 June 2022).
Informed Consent Statement
Informed consent was obtained from all subjects involved in the study.
Data Availability Statement
The data generated in the present study has been anonymized and made available in the Supplementary Materials.
Acknowledgments
We would like to acknowledge the “Victor Babes” University of Medicine and Pharmacy Timisoara for their support in publishing this research paper.
Conflicts of Interest
The authors declare no conflicts of interest.
Abbreviations
The following abbreviations are used in this manuscript:
| DEXA | dual-energy X-ray absorptiometry |
| UWW | under-water weighing |
| ADP | Air-displacement plethysmography |
| BIA | Bioelectrical impedance analysis |
| Z | impedance |
| R | resistance |
| XC | reactance |
| TBW | total body water |
| FFM | fat-free mass |
| SD | standard deviation |
| CCC | concordance correlation coefficient |
| SEE | standard error of the estimate |
References
- Booth, A.; Magnuson, A.; Foster, M. Detrimental and protective fat: Body fat distribution and its relation to metabolic disease. Horm. Mol. Biol. Clin. Investig. 2014, 17, 13–27. [Google Scholar] [CrossRef]
- Engin, A. The Definition and Prevalence of Obesity and Metabolic Syndrome: Correlative Clinical Evaluation Based on Phenotypes. In Obesity and Lipotoxicity [Internet]; Engin, A.B., Engin, A., Eds.; Advances in Experimental Medicine and Biology; Springer International Publishing: Cham, Switzerland, 2024; Volume 1460, pp. 1–25. Available online: https://link.springer.com/10.1007/978-3-031-63657-8_1 (accessed on 10 November 2025).
- Athanasakis, K.; Bala, C.; Kokkinos, A.; Simonyi, G.; Karoliová, K.H.; Basse, A.; Bogdanovic, M.; Kang, M.; Low, K.; Gras, A. The economic burden of obesity in 4 south-eastern European countries associated with obesity-related co-morbidities. BMC Health Serv. Res. 2024, 24, 354. [Google Scholar] [CrossRef]
- Lukaski, H.; Johnson, P.; Bolonchuk, W.; Lykken, G. Assessment of fat-free mass using bioelectrical impedance measurements of the human body. Am. J. Clin. Nutr. 1985, 41, 810–817. [Google Scholar] [CrossRef]
- Khalil, S.; Mohktar, M.; Ibrahim, F. The Theory and Fundamentals of Bioimpedance Analysis in Clinical Status Monitoring and Diagnosis of Diseases. Sensors 2014, 14, 10895–10928. [Google Scholar] [CrossRef]
- Kyle, U. Bioelectrical impedance analysis? part I: Review of principles and methods. Clin. Nutr. 2004, 23, 1226–1243. [Google Scholar] [CrossRef] [PubMed]
- Campa, F.; Coratella, G.; Cerullo, G.; Noriega, Z.; Francisco, R.; Charrier, D.; Irurtia, A.; Lukaski, H.; Silva, A.M.; Paoli, A. High-standard predictive equations for estimating body composition using bioelectrical impedance analysis: A systematic review. J. Transl. Med. 2024, 22, 515. [Google Scholar] [CrossRef] [PubMed]
- Houtkooper, L.; Lohman, T.; Going, S.; Howell, W. Why bioelectrical impedance analysis should be used for estimating adiposity. Am. J. Clin. Nutr. 1996, 64, 436S–448S. [Google Scholar] [CrossRef] [PubMed]
- Barbosa-Silva, M.C.G.; Barros, A.J. Bioelectrical impedance analysis in clinical practice: A new perspective on its use beyond body composition equations. Curr. Opin. Clin. Nutr. Metab. Care 2005, 8, 311–317. [Google Scholar] [CrossRef]
- Rush, E.C.; Freitas, I.; Plank, L.D. Body size, body composition and fat distribution: Comparative analysis of European, Maori, Pacific Island and Asian Indian adults. Br. J. Nutr. 2009, 102, 632–641. [Google Scholar] [CrossRef]
- Deurenberg, P.; Deurenberg-Yap, M.; Schouten, F. Validity of total and segmental impedance measurements for prediction of body composition across ethnic population groups. Eur. J. Clin. Nutr. 2002, 56, 214–220. [Google Scholar] [CrossRef]
- Siervo, M.; Davies, A.A.; Jebb, S.A.; Jalil, F.; Moore, S.E.; Prentice, A.M. Ethnic differences in the association between body mass index and impedance index (Ht2/Z) in adult women and men using a leg-to-leg bioimpedance method. Eur. J. Clin. Nutr. 2007, 61, 1337–1340. [Google Scholar] [CrossRef]
- Ward, L.C.; Heitmann, B.L.; Craig, P.; Stroud, D.; Azinge, E.C.; Jebb, S.; Cornish, B.H.; Swinburn, B.; O’Dea, K.; Rowley, K.; et al. Association between Ethnicity, Body Mass Index, and Bioelectrical Impedance: Implications for the Population Specificity of Prediction Equations. Ann. N. Y. Acad. Sci. 2000, 904, 199–202. [Google Scholar]
- Heitmann, B.; Swinburn, B.; Carmichael, H.; Rowley, K.; Plank, L.; McDermott, R.; Leonard, D.; O’Dea, K. Are there ethnic differences in the association between body weight and resistance, measured by bioelectrical impedance? Int. J. Obes. 1997, 21, 1085–1092. [Google Scholar] [CrossRef] [PubMed][Green Version]
- Cocoş, R.; Schipor, S.; Hervella, M.; Cianga, P.; Popescu, R.; Bănescu, C.; Constantinescu, M.; Martinescu, A.; Raicu, F. Genetic affinities among the historical provinces of Romania and Central Europe as revealed by an mtDNA analysis. BMC Genet. 2017, 18, 20. [Google Scholar] [CrossRef] [PubMed]
- Roman, G. Eating Patterns, Physical Activity and Their Association with Demographic Factors in the Population Included in the Obesity Study in Romania (ORO Study). Acta Endocrinol. Buchar. 2016, 12, 47–51. [Google Scholar] [PubMed]
- Cînpeanu, O.C.; Tarcea, M.; Cojan, P.; Iorga, D.; Olah, P.; Guiné, R.P.F. Perception of Healthy Eating among Romanian Adults. J. Interdiscip. Med. 2019, 4, 77–86. [Google Scholar] [CrossRef]
- Mititelu, M.; Popovici, V.; Neacșu, S.M.; Musuc, A.M.; Busnatu Ștefan, S.; Oprea, E.; Boroghină, S.C.; Mihai, A.; Streba, C.T.; Lupuliasa, D.; et al. Assessment of Dietary and Lifestyle Quality among the Romanian Population in the Post-Pandemic Period. Healthcare 2024, 12, 1006. [Google Scholar] [CrossRef]
- Balan, I.M.; Gherman, E.D.; Gherman, R.; Brad, I.; Pascalau, R.; Popescu, G.; Trasca, T.I. Sustainable Nutrition for Increased Food Security Related to Romanian Consumers’ Behavior. Nutrients 2022, 14, 4892. [Google Scholar] [CrossRef]
- Tucker, L.A.; Lecheminant, J.D.; Bailey, B.W. Test-Retest Reliability of the Bod Pod: The Effect of Multiple Assessments. Percept. Mot. Skills 2014, 118, 563–570. [Google Scholar] [CrossRef]
- COSMED. BOD POD Gold Standard Body Composition Tracking System Operator’s Manual—P/N 210-2400 Rev. M—DCO 1765; COSMED USA, Inc.: Concord, CA, USA, 2015. [Google Scholar]
- Kyle, U.G.; Bosaeus, I.; De Lorenzo, A.D.; Deurenberg, P.; Elia, M.; Manuel Gómez, J.; Lilienthal Heitmann, B.; Kent-Smith, L.; Melchior, J.-C.; Pirlich, M.; et al. Bioelectrical impedance analysis—Part II: Utilization in clinical practice. Clin. Nutr. 2004, 23, 1430–1453. [Google Scholar] [CrossRef]
- Kyle, U.G.; Genton, L.; Karsegard, L.; Slosman, D.O.; Pichard, C. Single prediction equation for bioelectrical impedance analysis in adults aged 20–94 years. Nutrition 2001, 17, 248–253. [Google Scholar] [CrossRef] [PubMed]
- Kanellakis, S.; Skoufas, E.; Karaglani, E.; Ziogos, G.; Koutroulaki, A.; Loukianou, F.; Michalopoulou, M.; Gkeka, A.; Marikou, F.; Manios, Y. Development and validation of a bioelectrical impedance prediction equation estimating fat free mass in Greek—Caucasian adult population. Clin. Nutr. ESPEN 2020, 36, 166–170. [Google Scholar] [CrossRef]
- Heitmann, B.L. Evaluation of body fat estimated from body mass index, skinfolds and impedance. A comparative study. Eur. J. Clin. Nutr. 1990, 44, 831–837. [Google Scholar]
- Deurenberg, P.; van der Kooy, K.; Leenen, R.; Weststrate, J.A.; Seidell, J.C. Sex and age specific prediction formulas for estimating body composition from bioelectrical impedance: A cross-validation study. Int. J. Obes. 1991, 15, 17–25. [Google Scholar]
- Silveira, E.A.; Barbosa, L.S.; Rodrigues, A.P.S.; Noll, M.; De Oliveira, C. Body fat percentage assessment by skinfold equation, bioimpedance and densitometry in older adults. Arch. Public Health Arch. Belg. Sante Publique 2020, 78, 65. [Google Scholar] [CrossRef]
- Rojano-Ortega, D.; Moya-Amaya, H.; Berral-Aguilar, A.J.; Baratto, P.; Molina-López, A.; Berral-de La Rosa, F.J. Development and validation of new bioelectrical impedance equations to accurately estimate fat mass percentage in a heterogeneous Caucasian population. Nutr. Res. 2024, 123, 80–87. [Google Scholar] [CrossRef]
- Lee, L.W.; Liao, Y.S.; Lu, H.K.; Hsiao, P.L.; Chen, Y.Y.; Chi, C.C.; Hsieh, K.C. Validation of two portable bioelectrical impedance analyses for the assessment of body composition in school age children. PLoS ONE 2017, 12, e0171568. [Google Scholar] [CrossRef] [PubMed]
- Campa, F.; Gobbo, L.A.; Stagi, S.; Cyrino, L.T.; Toselli, S.; Marini, E.; Coratella, G. Bioelectrical impedance analysis versus reference methods in the assessment of body composition in athletes. Eur. J. Appl. Physiol. 2022, 122, 561–589. [Google Scholar] [CrossRef] [PubMed]
- Deurenberg-Yap, M.; Schmidt, G.; Van Staveren, W.; Deurenberg, P. The paradox of low body mass index and high body fat percentage among Chinese, Malays and Indians in Singapore. Int. J. Obes. 2000, 24, 1011–1017. [Google Scholar] [CrossRef]
- Fernández, J.R.; Heo, M.; Heymsfield, S.B.; Pierson, R.N.; Pi-Sunyer, F.X.; Wang, Z.M.; Wang, J.; Hayes, M.; Allison, D.B.; Gallagher, D. Is percentage body fat differentially related to body mass index in Hispanic Americans, African Americans, and European Americans? Am. J. Clin. Nutr. 2003, 77, 71–75. [Google Scholar] [CrossRef]
- Gallagher, D.; Visser, M.; Sepulveda, D.; Pierson, R.N.; Harris, T.; Heymsfield, S.B. How Useful Is Body Mass Index for Comparison of Body Fatness across Age, Sex, and Ethnic Groups? Am. J. Epidemiol. 1996, 143, 228–239. [Google Scholar] [CrossRef]
- Macias, N.; Alemán-Mateo, H.; Esparza-Romero, J.; Valencia, M.E. Body fat measurement by bioelectrical impedance and air displacement plethysmography: A cross-validation study to design bioelectrical impedance equations in Mexican adults. Nutr. J. 2007, 6, 18. [Google Scholar] [CrossRef]
- Genton, L.; Karsegard, V.L.; Kyle, U.G.; Hans, D.B.; Michel, J.-P.; Pichard, C. Comparison of Four Bioelectrical Impedance Analysis Formulas in Healthy Elderly Subjects. Gerontology 2001, 47, 315–323. [Google Scholar] [CrossRef] [PubMed]
- Dey, D.K.; Bosaeus, I. Comparison of bioelectrical impedance prediction equations for fat-free mass in a population-based sample of 75 y olds. Nutrition 2003, 19, 858–864. [Google Scholar] [CrossRef] [PubMed]
- Biaggi, R.R.; Vollman, M.W.; Nies, M.A.; Brener, C.E.; Flakoll, P.J.; Levenhagen, D.K.; Sun, M.; Karabulut, Z.; Chen, K.Y. Comparison of air-displacement plethysmography with hydrostatic weighing and bioelectrical impedance analysis for the assessment of body composition in healthy adults. Am. J. Clin. Nutr. 1999, 69, 898–903. [Google Scholar] [CrossRef]
- Fields, D.A.; Goran, M.I.; McCrory, M.A. Body-composition assessment via air-displacement plethysmography in adults and children: A review. Am. J. Clin. Nutr. 2002, 75, 453–467. [Google Scholar] [CrossRef]
- Wang, Z.; Deurenberg, P.; Wang, W.; Pietrobelli, A.; Baumgartner, R.N.; Heymsfield, S.B. Hydration of fat-free body mass: New physiological modeling approach. Am. J. Physiol.-Endocrinol. Metab. 1999, 276, E995–E1003. [Google Scholar] [CrossRef]
- Wells, J.C.; Williams, J.E.; Chomtho, S.; Darch, T.; Grijalva-Eternod, C.; Kennedy, K.; Haroun, D.; Wilson, C.; Cole, T.J.; Fewtrell, M.S. Pediatric reference data for lean tissue properties: Density and hydration from age 5 to 20 y. Am. J. Clin. Nutr. 2010, 91, 610–618. [Google Scholar] [CrossRef]
- Rush, E.C.; Puniani, K.; Valencia, M.E.; Davies, P.S.W.; Plank, L.D. Estimation of body fatness from body mass index and bioelectrical impedance: Comparison of New Zealand European, Maori and Pacific Island children. Eur. J. Clin. Nutr. 2003, 57, 1394–1401. [Google Scholar] [CrossRef] [PubMed]
- Minderico, C.S.; Silva, A.M.; Keller, K.; Branco, T.L.; Martins, S.S.; Palmeira, A.L.; Barata, J.T.; Carnero, E.A.; Rocha, P.M.; Teixeira, P.J.; et al. Usefulness of different techniques for measuring body composition changes during weight loss in overweight and obese women. Br. J. Nutr. 2008, 99, 432–441. [Google Scholar] [CrossRef]
- Costa, R.F.D.; Masset, K.V.D.S.B.; Silva, A.M.; Cabral, B.G.D.A.T.; Dantas, P.M.S. Development and cross-validation of predictive equations for fat-free mass and lean soft tissue mass by bioelectrical impedance in Brazilian women. Eur. J. Clin. Nutr. 2022, 76, 288–296. [Google Scholar] [CrossRef] [PubMed]
- Ekingen, T.; Sob, C.; Hartmann, C.; Rühli, F.J.; Matthes, K.L.; Staub, K.; Bender, N. Associations between hydration status, body composition, sociodemographic and lifestyle factors in the general population: A cross-sectional study. BMC Public Health 2022, 22, 900. [Google Scholar] [CrossRef]
- Siedler, M.R.; Rodriguez, C.; Stratton, M.T.; Harty, P.S.; Keith, D.S.; Green, J.J.; Boykin, J.R.; White, S.J.; Williams, A.D.; DeHaven, B.; et al. Assessing the reliability and cross-sectional and longitudinal validity of fifteen bioelectrical impedance analysis devices. Br. J. Nutr. 2023, 130, 827–840. [Google Scholar] [CrossRef]
- Dupertuis, Y.M.; Jimaja, W.; Beardsley Levoy, C.; Genton, L. Bioelectrical impedance analysis instruments: How do they differ, what do we need for clinical assessment? Curr. Opin. Clin. Nutr. Metab. Care 2025, 28, 379–387. [Google Scholar] [CrossRef]
- Bennett, J.P.; Cataldi, D.; Liu, Y.E.; Kelly, N.N.; Quon, B.K.; Gonzalez, M.C.; Heymsfield, S.B.; Shepherd, J.A. Variations in bioelectrical impedance devices impact raw measures comparisons and subsequent prediction of body composition using recommended estimation equations. Clin. Nutr. ESPEN 2024, 63, 540–550. [Google Scholar] [CrossRef] [PubMed]
- Santhanam, P.; Nath, T.; Peng, C.; Bai, H.; Zhang, H.; Ahima, R.S.; Chellappa, R. Artificial intelligence and body composition. Diabetes Metab. Syndr. Clin. Res. Rev. 2023, 17, 102732. [Google Scholar] [CrossRef] [PubMed]
- Bibbò, L.; Angiulli, G.; Laganà, F.; Pratticò, D.; Cotroneo, F.; La Foresta, F.; Versaci, M. MEMS and IoT in HAR: Effective Monitoring for the Health of Older People. Appl. Sci. 2025, 15, 4306. [Google Scholar] [CrossRef]
Disclaimer/Publisher’s Note: The statements, opinions and data contained in all publications are solely those of the individual author(s) and contributor(s) and not of MDPI and/or the editor(s). MDPI and/or the editor(s) disclaim responsibility for any injury to people or property resulting from any ideas, methods, instructions or products referred to in the content. |
© 2026 by the authors. Licensee MDPI, Basel, Switzerland. This article is an open access article distributed under the terms and conditions of the Creative Commons Attribution (CC BY) license.