Abstract
Efficient soil conditioning is critical for controlling the mechanical behavior of sandy muck in earth pressure balance (EPB) shield tunneling. This study investigates the undrained shear response of sand conditioned with slurry, a newly developed bubble–slurry, and foam under vertical stresses of 0–300 kPa, considering different injection ratios and shear rates. Under atmospheric pressure, conditioning reduces both peak and residual shear strengths by more than 90% compared with untreated sand. Foam- and bubble–slurry-conditioned sands show stable strength within 6 h; after 24 h, peak strength increases from 0.39 to 4.67 kPa for foam-conditioned sand but only from 0.67 to 0.84 kPa for bubble–slurry-conditioned sand. Shear strength increases nearly linearly with shear rate, especially for residual strength. Pore-scale mechanisms were interpreted by considering bubble proportion and size, pore-fluid rheology, and surface tension. Rheology governs whether dynamic or viscous resistance dominates at different shear rates, while surface tension influences stress transmission through bubble stability and interparticle lubrication. The void ratio range of e/emax = 1.00–1.36 was identified as achieving low shear strength and good flowability. Field application in Jinan Metro Line R2 confirmed that combined conditioning (25% foam + 13% slurry) reduced cutterhead torque by about 37% without spewing.
1. Introduction
Earth pressure balance (EPB) shield tunneling in water-rich, coarse-grained strata is often confronted with significant challenges such as face instability, spewing, and accelerated wear of mechanical components. These geotechnical and operational risks can compromise construction safety and drastically reduce excavation efficiency [1,2]. To overcome such difficulties, soil conditioning is widely applied to modify the physical and mechanical properties of the excavated muck.
Foam and bentonite slurry are the two most commonly used conditioning agents in EPB tunneling. Foam conditioning primarily reduces the undrained shear strength by increasing the porosity of the soil and encapsulating soil particles within bubbles [3,4]. In contrast, slurry conditioning focuses on decreasing soil permeability to suppress groundwater seepage and enhance support pressure effectiveness [5,6,7]. The shear strength of conditioned soil in the pressurized chamber is a critical factor that governs torque of the cutterhead and screw conveyor. Extensive research has identified void ratio as a key parameter affecting the shear strength of conditioned sands [8,9,10]. Most existing studies have focused on the macroscopic porosity behavior [11,12], which provides limited insight into strength evolution. Conditioned sands with similar void ratios may exhibit markedly different shear resistance, stability, and time-dependent behavior, especially when gas phases are introduced. This indicates that macro-scale parameters alone are insufficient to explain the mechanical response of conditioned sands and that pore-scale gas–liquid distribution and fluid properties must be explicitly considered to clarify strength reduction and recovery mechanisms. In contrast to previous studies that predominantly rely on macroscopic indicators, the present study emphasizes a multi-scale framework that links pore-scale characteristics to macroscopic undrained shear behavior, thereby providing new insight into the mechanisms governing conditioned sand strength under EPB conditions.
Conventional foam and slurry conditioning also suffer from inherent limitations. Foam-treated sands often experience bubble instability and strength recovery under pressurized conditions, while slurry conditioning typically requires high additive dosages, leading to increased material consumption and environmental burden. Motivated by these limitations, a greener and more stable conditioning agent, bubble–slurry, was previously developed by our research group. Unlike foam or slurry used separately, bubble–slurry represents a hybrid strategy in which stable microbubbles are structurally integrated into a bentonite slurry matrix. Previous studies demonstrated that bentonite particle adsorption at the gas–liquid interface significantly enhances bubble stability, reduces permeability relative to conventional slurry, and achieves more than 33% reduction in additive consumption [13]. Compared with the combined use of foam and slurry, bubble–slurry provides a more stable and efficient three-phase system. However, its undrained shear behavior and pore-scale mechanisms under pressurized conditions have not yet been systematically investigated.
This study was conducted using the shield tunnel of the R2 line in Jinan, China, as the base project. Under vertical total pressure ranging from 0 to 300 kPa, the undrained shear strength tests were carried out on foam-conditioned sand, slurry-conditioned sand, and bubble–slurry-conditioned sand. The objective of this study is to systematically investigate the undrained shear behavior of sand conditioned with slurry, foam, and the newly developed bubble–slurry under EPB tunneling conditions. Specifically, this work aims to quantitatively evaluate the effects of conditioning agent type, injection ratio, vertical stress, conditioning duration, and shear rate on both peak and residual shear strength. Furthermore, the study seeks to elucidate the pore-scale mechanisms governing shear strength reduction by linking bubble proportion and size, pore-fluid rheology, and surface-tension-related interfacial effects to macroscopic shear responses. Finally, the engineering applicability of the proposed conditioning framework is verified through a full-scale EPB shield tunneling case.
2. Materials and Methods
2.1. Materials
The present study is grounded in the R2 line of the Jinan Metro in China. The project utilized a 6.68 m diameter EPB shield tunneling machine to excavate long distances through strongly weathered diorite layers, medium sand layers, medium-coarse sand layers, and gravel layers. The primary challenges it faces pertain to the issue of excessive cutter torque and that of mechanical wear, both of which are a consequence of the high shear strength of excavated soil. The experimental sands were prepared using a soil sample obtained from the excavation of the EPB shield tunnel section of the Jinan Metro Line R2.
The particle distribution curve of sand is shown in Figure 1. The content of fine particles (particles with a diameter < 0.075 mm) was 0.08%; the sand is classified as well-graded gravel (GW), with the uniformity coefficient (Cu), curvature coefficient (Cc), and permeability coefficient (k) being 13.5, 2.02, and 4.82 × 10⁻³ cm/s, respectively.
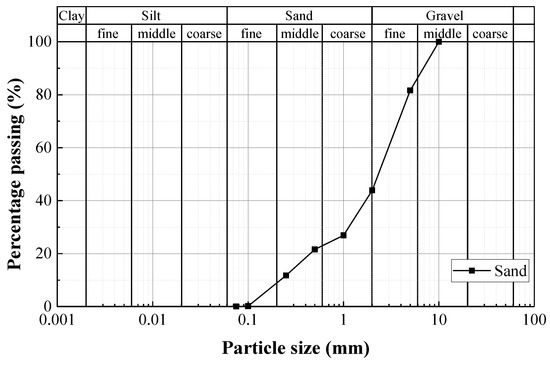
Figure 1.
Particle distribution curve of experimental sand.
A commercial anionic surfactant (SS, Jiangsu Ting’an Fire Protection Materials Co., Ltd., Taizhou, China) was used as the foaming agent. The primary raw material of the surfactant was fatty alcohol polyethylene ether sulfate sodium. A bentonite slurry was prepared using natural calcium-based bentonite (Nanjing Hengfeng Calcium Carbonate Plant, Nanjing, China).
2.2. Definition of Conditioning Agent Parameters
Based on the guidelines [14], the parameters involved in this study include the foaming agent concentration (cf, %), foam expansion ratio (FER), foam injection ratio (FIR, %), slurry concentration (csl, %), surfactant concentration in bubble–slurry (css, %), bubble–slurry expansion ratio (BSER), bubble–slurry injection ratio (BSIR, %), slurry injection ratio (SIR, %), and the proportion of bubbles in the conditioning agent (BVR, %), as defined by Equations (1)–(9).
where mss, ml,f, and mw represent the masses of the surfactant, foaming agent solution, and water used for diluting the surfactant, respectively. Vf, Vl,f, Vs represent the volumes of foam, foaming agent solution, and excavated soil, respectively. mb, msl, and ml,bs denote the masses of bentonite, slurry, slurry and surfactant mixture before foaming. Vbs, Vl,bs, Vsl, Vb, and Va correspond to the volumes of bubble–slurry, slurry and surfactant mixture before foaming, slurry, bubbles, and the conditioning agent. Unless otherwise specified, all mass-related parameters are expressed in grams (g), and all volume-related parameters are expressed in liters (L).
Based on Boyle’s gas law and assuming constant temperature and ideal gas behavior, the theoretical formulas for the conditioning parameters FERp, FIRp (%), BSERp, and BSIRp (%) are given as follows:
where P is the pore pressure, Patm is the atmospheric pressure, both in kPa.
2.3. Preparation of Conditioning Agents
2.3.1. Preparation of Slurry
The preparation of foam, slurry, and bubble–slurry was carried out at 25 °C. The mineral composition of the calcium-based bentonite was determined using X-ray diffraction (XRD), as shown in Figure 2. Montmorillonite, with a content of 60.15%, was identified as the primary component of the bentonite, and its swelling index was determined to be 11. Based on the physical properties of the calcium-based bentonite used in this study, its hydration characteristics, and relevant engineering practice, the slurry concentration (csl) was set to 25%, which ensures sufficient viscosity and stability while maintaining good pumpability and workability for soil conditioning applications. The bentonite was dispersed into water, followed by the addition of anhydrous sodium carbonate at 4% of the bentonite mass, which was used as an activator to enhance bentonite dispersion and swelling capacity. The mixture was stirred using an electric mixer at 700 rpm for 20–30 min and then allowed to stand for 24 h to ensure complete hydration and structural development of the bentonite slurry, resulting in a homogeneous slurry with a density of 1.18 g/cm3. The appearance of the slurry used in this study is shown in Figure 2. The rheological properties of the slurry were measured using an NXS-11A rotational viscometer (Chengdu Instrument Factory, Chengdu, China).
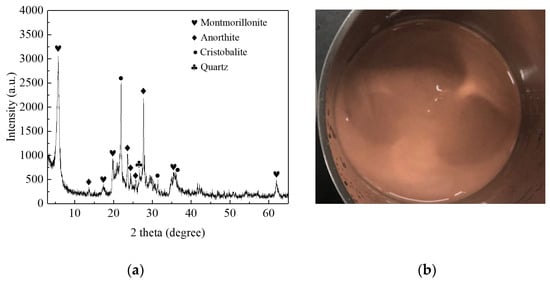
Figure 2.
Bentonite—(a) X-ray diffraction; (b) general view.
2.3.2. Preparation of Foam
Based on prior studies, the foaming agent concentration (cf) was selected to be 3% [15,16]. The foaming equipment and foam appearance are shown in Figure 3. The foaming chamber was filled with glass beads of diameters ranging from 0.2 to 4 mm. The gas supply of the air compressor was set to a pressure of 0.2 MPa. This gas was then injected into the foaming chamber in order to mix with the foaming agent. The foam generation system used in this study has been verified to provide stable and repeatable foam properties under fixed preparation conditions. When the same surfactant, constant surfactant concentration, and fixed gas pressure were applied, the physical properties of the generated foam remained consistent. The FER was determined to be 16, and the foam’s half-life (the time required for the foam volume to decrease to half of its initial volume) was determined to be approximately 25 min.
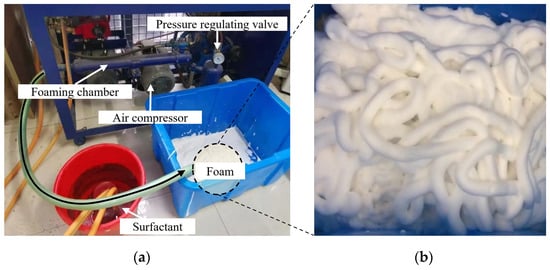
Figure 3.
Foam—(a) preparation scheme; (b) general view.
2.3.3. Preparation of Bubble–Slurry
The surfactant concentration (css) was selected as 1.0%, and the slurry concentration (csl) was maintained at 25%. The surfactant was added to the slurry to form a homogeneous mixture, which was then stirred at 5000 rpm for 3 min to produce bubble–slurry, as shown in Figure 4. The mixing speed and duration were selected based on previous studies [13], which demonstrated that these conditions result in bubble–slurry with high stability and an effective reduction in sand permeability, indicating strong potential for practical engineering applications. The resulting bubble–slurry exhibited an expansion ratio (BSER) of 1.97, corresponding to a bubble volume fraction of approximately 50%, and a half-life of about 275 h. Such an exceptionally long half-life indicates excellent bubble stability, which is particularly advantageous for soil conditioning in EPB shield tunneling, as it allows the conditioned soil to maintain stable mechanical behavior during mixing, conveyance, and pressure-controlled excavation.
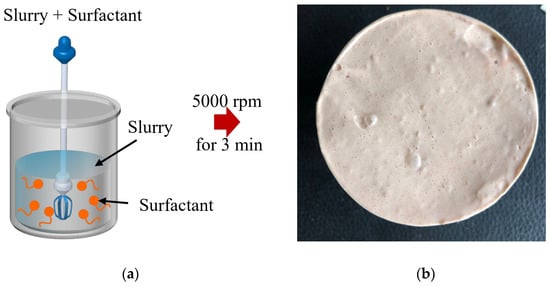
Figure 4.
Bubble–slurry—(a) preparation scheme; (b) general view.
2.4. Undrained Shear Test
2.4.1. Pressurized Vane Shear Apparatus
Foam-conditioned sands have been characterized using various shear testing methodologies, including triaxial tests [17], direct shear tests [18,19], screw conveyor model tests [20], and rotary shear tests [21,22,23,24,25]. Among these, rotary shear testing is particularly prevalent, as it enables concurrent determination of undrained shear strength and rheological behavior through shear rate versus shear stress curves [26,27,28,29]. Accordingly, this study employs a pressurized vane shear apparatus to elucidate the shear response of conditioned sands under controlled stress conditions.
The components and dimensions of the pressurized cross-vane shear apparatus are illustrated in Figure 5. Vane rotation speeds (n) range from 0 to 180 °/min, in accordance with ASTM D4648 recommendations for soil shear testing [30]. The pressurized vane shear apparatus consists of a pressure chamber, a vane blade, a loading piston, and a pneumatic pressure control system. The cylindrical chamber has an inner diameter of 120 mm and a height of 200 mm. Vertical stress is applied by compressed air acting on a piston with a thickness of 10 mm, providing constant loading under radially confined conditions (zero lateral strain). The drainage outlet at the bottom of the chamber is closed during testing to ensure undrained shear conditions.
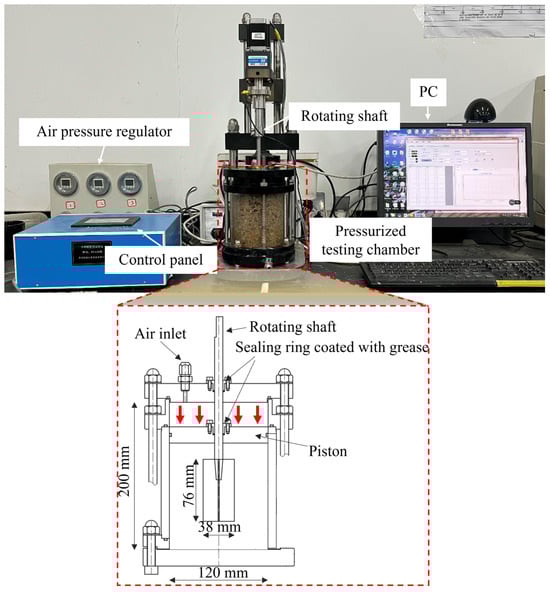
Figure 5.
Pressurized vane shear apparatus.
The vane blade has a diameter of 38 mm and a height of 76 mm, and a torque sensor is installed on the rotation shaft. During pressurized shear testing, the shaft passes through the chamber lid and piston, where friction is minimized using embedded sealing rings and lubricating grease to prevent air leakage. Prior to testing, the apparatus is operated under pressurized empty-chamber conditions to measure the frictional torque between the shaft and the sealing interfaces. The measured friction torque is subtracted from the total torque recorded during testing to obtain the net torque of the conditioned sand. And the dimensions of the soil specimens and the vane shear apparatus used in this study comply with established criteria for neglecting scale effects [12,26].
In EPB shield operations, conditioned sand must balance low undrained shear strength to reduce torque and wear with sufficient flowability to ensure smooth conveyance and prevent spewing. Therefore, combining shear strength and slump flowability measurements provides a comprehensive evaluation of the conditioned soil’s performance.
The shear stress (τ) of soil can be estimated using Equation (14) [12].
where τ is the shear stress, and T is the torque. In this study, the torque transducer’s measurement range was 0–30 N·m. This corresponds to a maximum shear stress of 165 kPa, which is sufficient to characterize conditioned sands under typical EPB shield tunneling conditions, as the undrained shear stresses in the pressure chamber are generally below this limit.
2.4.2. Test Method and Scheme
Shear tests were conducted by rotating the vane at prescribed angular velocities (n = 20, 40, 60, 100, 140, 180°/min) using the control panel. The corresponding shear rate () was calculated according to Equation (15) [29]. A data-acquisition system recorded torque values every 2 s. After subtracting the previously measured frictional torque, the net torque was converted to shear stress using Equation (14).
where the D is internal diameter of the pressurized testing chamber, and Dv is diameter of the shear vane.
Table 1 summarizes the test scheme conducted with the pressurized cross-vane shear apparatus. The undrained shear strength of sand conditioned for EPB tunneling is governed primarily by the type of conditioning agent and its injection ratio. To elucidate the underlying mechanisms, shear tests were conducted on sands treated with bentonite slurry, bubble–slurry, and foam at varying dosages. As shown in numbers 1~9 in Table 1.

Table 1.
Shear test scheme.
Vertical total stress compresses internal pores and modifies interparticle contacts, thereby influencing shear resistance. To evaluate this effect, undrained shear tests were conducted at a fixed conditioning agent injection ratio of 20% under vertical total stresses of 0, 150, and 300 kPa, as listed in numbers 10–15 in Table 1.
When using an EPB shield machine for tunnel operations, it usually experiences a period of downtime for reasons such as installing pipe segments, carrying out maintenance and making adjustments. Over time, the decay of bubbles can cause structural changes in the conditioned sand, ultimately affecting its shear strength. Therefore, the undrained shear strength of foam- and bubble–slurry-conditioned sand was measured at 6 and 24 h under vertical pressures of 0 and 150 kPa, as shown in numbers 16–19 in Table 1. For each test condition, shear tests were conducted in triplicate. The measured shear stress curves exhibited highly consistent trends and magnitudes. The curves presented in this study were selected from one randomly chosen replicate; averaging the replicates may slightly shift the peak positions, so the original single-replicate curves are shown to clearly represent the test result.
3. Results
3.1. Effect of Conditioning Agent Type and Injection Ratio on Shear Strength
To better evaluate the effect of conditioning agents on shear strength, the undrained shear strength of untreated sand was first measured under atmospheric pressure, as shown in Figure 6. It can be observed that, within the rotation rate range of 20–180°/min, the untreated sand consistently exhibits pronounced and relatively high peak shear strength. The measured peak strengths range from approximately 25 to 70 kPa, indicating the strong shear resistance of the original material prior to conditioning.
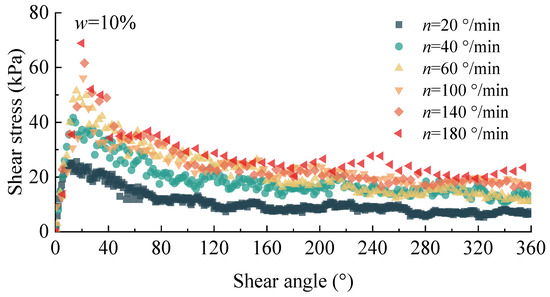
Figure 6.
Shear stress curve of untreated sand under atmospheric pressure.
Figure 7 presents shear stress versus rotation angle curves for all three conditioning agents at a rotational speed of 100°/min. In each case, shear stress decreased as the agent dosage (SIR, BSIR, or FIR) and the corresponding bubble volume ratio increased. Notably, only the slurry-conditioned sand at SIR = 10% exhibited a pronounced peak; the other eight treatments produced relatively flat stress–strain curves with low shear stresses. Compared with the untreated sand, the conditioned sands display significantly lower peak and residual strengths together with flatter shear stress–rotation curves. This contrast highlights the effectiveness of conditioning agents in suppressing interparticle friction and weakening force chains, thereby transforming the original sand from a high-strength material into a more workable and flowable conditioned soil suitable for EPB tunneling.
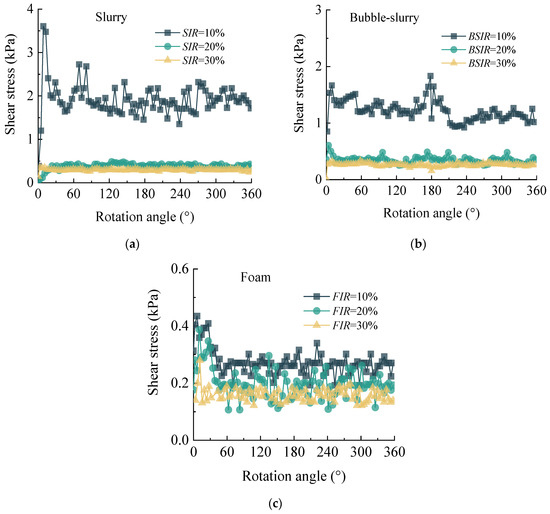
Figure 7.
Shear stress curves of conditioned sands under atmospheric pressure: (a) slurry-conditioned sand; (b) bubble–slurry-conditioned sand; (c) foam-conditioned sand.
Figure 8 compares the peak and residual strengths across all treatments, confirming that each agent effectively reduced shear strength relative to the unconditioned sand. Under atmospheric conditions, very low peak shear strengths were observed for the conditioned sands, with values of 0.485 kPa at SIR = 20%, 0.546 kPa at BSIR = 20%, and 0.435 kPa at FIR = 10%, indicating that all three conditioning agents can significantly reduce the shear strength of sand.
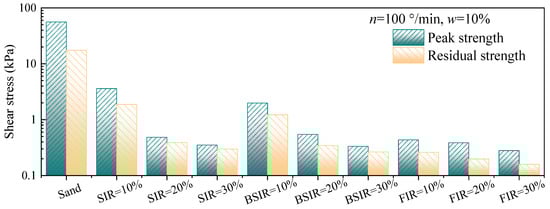
Figure 8.
Peak and residual strengths of conditioned sands at atmospheric pressure.
3.2. Effect of Vertical Total Stresses on Shear Strength
Vertical total pressures of 0, 150, and 300 kPa were selected based on EPB shield operation data from the Jinan Metro R2 line, where chamber pressures rarely exceed 300 kPa. Shear strength at 0 kPa represents conditions at the screw conveyor discharge, allowing assessment of strength evolution from the chamber to discharge. Figure 9 shows the shear strength of different conditioned sands under vertical total pressures of 0, 150 and 300 kPa at a rotation speed of 100°/min. In Figure 9, slurry- and bubble–slurry-conditioned sands display distinct peaks at 150 kPa and 300 kPa, whereas foam-conditioned sand exhibits more gradual stress–strain behavior.
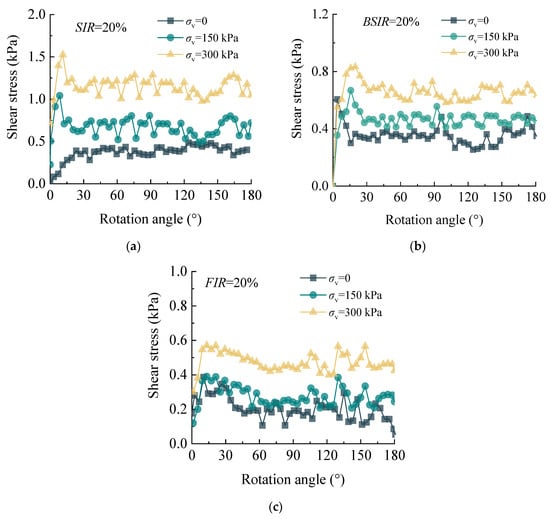
Figure 9.
Shear stress curves of conditioned sands under vertical stress: (a) SIR = 20%; (b) BSIR = 20%; (c) FIR = 20%.
Figure 10 quantifies the pressure dependence of peak and residual strengths: all conditioned sands demonstrate increasing strength with pressure, but the bubble–slurry sample at BSIR = 10% shows the greatest sensitivity. This behavior can be attributed to the relatively underdeveloped bubble structure at low injection ratios, where increasing vertical stress induces partial bubble compression and collapse, enhances interparticle contacts, and leads to a more pronounced increase in shear strength. In contrast, at higher BSIR values, a more continuous and stable bubble network forms, reducing pressure sensitivity and maintaining low shear strength even at 300 kPa, highlighting the effectiveness of appropriate conditioning under high-pressure conditions.
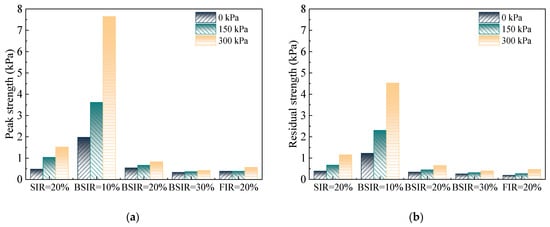
Figure 10.
Shear strength of conditioned sands under vertical stress: (a) peak strengths; (b) residual strengths.
3.3. Effect of Time on Shear Strength
Figure 11 shows the undrained shear strengths of foam or bubble–slurry mixed with sand under vertical pressures of 0 and 150 kPa after 0, 6, and 24 h. Figure 11 shows that when the BSIR and FIR are both 20%, the shear strength of bubble–slurry-conditioned sand fluctuates between 0.2 and 0.6 kPa over 24 h. In contrast, the shear strength of foam-conditioned sand increases significantly after 24 h.
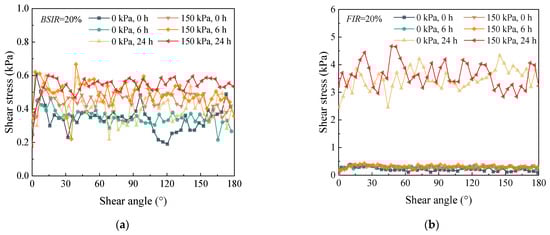
Figure 11.
Shear stress–rotation evolution considering different times: (a) bubble–slurry-conditioned sand (BSIR = 20%); (b) foam-conditioned sand (FIR = 20%).
Figure 12 shows that the shear strength of both bubble–slurry- and foam-conditioned sand does not change significantly within the first 6 h. After 24 h, however, the peak shear strength of foam-conditioned sand increases markedly from approximately 0.39 kPa to 4.67 kPa, whereas that of bubble–slurry-conditioned sand increases only slightly, from about 0.67 kPa to 0.84 kPa. This pronounced increase in foam-conditioned sand indicates partial bubble rupture and structural degradation over time. Nevertheless, compared to the shear strength of unconditioned sand (Figure 8), the shear strength remains relatively low, suggesting that residual bubbles and surfactants in the free water continue to lubricate the sand to some extent. From an engineering perspective, these results indicate that both conditioning methods maintain stable shear strength during short-term shutdowns (≤6 h), while bubble–slurry conditioning offers superior resistance to strength recovery during longer downtimes. This characteristic is advantageous for EPB shield operations, as it helps maintain favorable workability and reduces the risk of excessive torque or restart difficulties after prolonged stoppages.
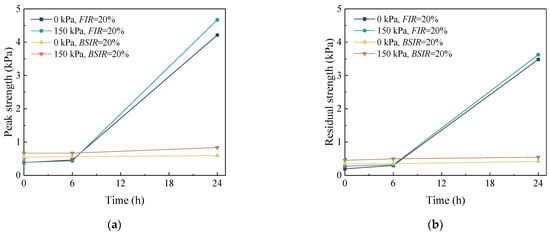
Figure 12.
Peak and residual strength vs. time: (a) peak strength; (b) residual strength.
3.4. Effect of Shear Rate on Shear Strength
The relationship between shear rate (0.013–0.116 s−1) and shear strength of conditioned sand is shown in Figure 13.
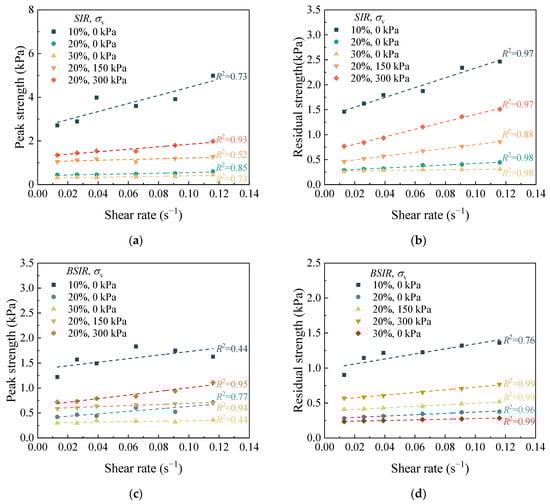
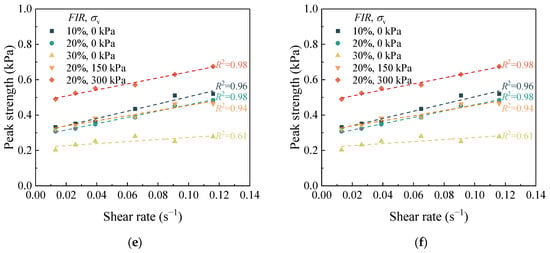
Figure 13.
The effect of shear rate on shear strength of conditioned sand: (a) peak strength and (b) residual strength of slurry-conditioned sand; (c) peak strength and (d) residual strength of bubble–slurry-conditioned sand; (e) peak strength and (f) residual strength of foam-conditioned sand.
As shown in Figure 13, under vertical total pressure ranging from 0 to 300 kPa, the shear strength of all conditioned sand exhibits a linear relationship with shear rate. The linear regression equations were obtained with a confidence level of 95% and are summarized in Table A1 and Table A2, while R2 is used to evaluate the goodness of fit. It was observed that, compared to the peak strength, the residual strength exhibited an R2 value closer to 1 with respect to shear rate. This indicates that under the current shear rate and conditioning scheme, the mechanical behavior of the conditioned sand conforms to the Bingham fluid model. The intercept and slope of the fitted curve represent the initial dynamic shear stress and viscosity coefficient of the improved soil, respectively. From an engineering perspective, the Bingham-type behavior of conditioned sand has direct implications for screw conveyor performance in EPB shield tunneling. Lower dynamic yield stress and viscosity are beneficial for reducing driving torque, improving conveyance efficiency, and ensuring stable soil discharge under pressurized conditions. Regarding the rheological modeling of conditioned sand, such as extending the shear rate range, considering additional conditioning schemes, and incorporating different pressure conditions, these aspects are beyond the scope of this study and will be the focus of future research.
4. Discussion
4.1. Mechanism of the Effect of the Proportion and Size of Bubbles in Pores on Shear Strength
The three-phase distribution of soil critically controls its undrained shear strength [31,32]. Under piston-applied vertical total stress (σv), this load is shared among pore-water pressure, internal bubble pressure, and effective stress in the solid framework [24], with bubble pressure closely matching pore-water pressure in magnitude [12]. Hence, differences in how void ratio decreases under pressure could explain the observed strength variations among slurry-, bubble–slurry-, and foam-conditioned sands.
Figure 14a shows the evolution of total void ratio (e) versus vertical total stress (σv) for sands conditioned at a conditioning agent injection rate of 20%. Solid markers denote experimental e values, which were derived from the specific gravity of soil particles, the density of the sand, and its water content. The solid line represents the “air-governed” void ratio predicted by Boyle’s law, assuming that all volume change under σv arises from gas compression. According to the research [33], for a unit volume of excavated soil under pore pressure, the solid volume, pore-water volume, and bubble volume in conditioned sand can be calculated. Theoretically, for a unit volume of excavated soil under pore pressure P, the solid volume (Vs), pore-water volume (Vw), and bubble volume (VB) in bubble–slurry-conditioned sand can be calculated using Equations (16)–(18). By analogy, corresponding three-phase proportions for slurry-conditioned and foam-conditioned sands can be derived.
where the n0 and Vw0 are the initial porosity and pore-water volume of the excavated sand, respectively, and the ρsl and ρbp are the densities of slurry and bentonite particles, respectively.
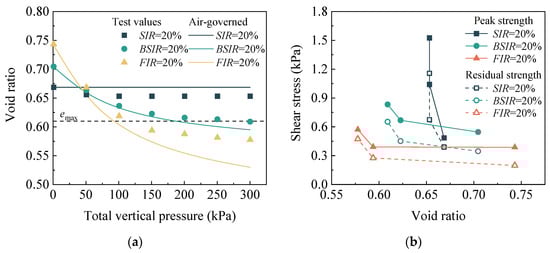
Figure 14.
Correlation of void ratio with: (a) vertical total pressure; (b) shear strength.
As shown in Figure 14a, the slurry-conditioned sand is in a saturated state, and its measured e remains consistently close to the air-governed e. The minor differences between the two are primarily due to the inevitable gaps that arise during the installation of blades and shafts. Due to the introduction of bubbles, as pressure increases, the e of bubble–slurry-conditioned sand and foam-conditioned sand gradually decreases from a value higher than the maximum void ratio of unconditioned sand (emax) to a value below it. When e < emax, a significant difference appears between the measured e and the air-governed e, indicating that sand particles have begun to come into contact with each other, and the changes in e are now dominated by particle contact. The larger the difference, the more complete the particle contact. However, as shown in Figure 14, even when the vertical total pressure exceeds 100 kPa, the foamy-conditioned sand has the lowest e, yet its shear strength remains the smallest. This indicates that void ratio alone cannot adequately explain the strength differences among conditioned sands.
Therefore, further analysis of the three-phase distribution of foam- and bubble–slurry-conditioned sand is needed, as shown in Figure 15. At FIR = 20% and BSIR = 20%, although the total pore volume fraction of both conditioned sands decreases similarly from approximately 42% to 37–38% as the vertical total pressure increases from 0 to 300 kPa, foam-conditioned sand consistently retains a much higher gas volume fraction (7.5–16.3%) than bubble–slurry-conditioned sand (3.1–8.6%). This two- to three-fold difference in gas fraction explains why foam-conditioned sand exhibits lower shear strength than bubble–slurry-conditioned sand despite nearly identical total void ratios. Thus, the entrapped gas fraction emerges as a more sensitive determinant of shear strength than total void ratio. At comparable void ratios, pores dominated by gas differ fundamentally from water-filled pores: gas-filled pores introduce compressible and discontinuous inclusions that disrupt force chains and delay effective stress transfer, whereas water-filled pores mainly transmit pore pressure without significantly impeding particle contact.
Figure 15.
Effect of vertical total stress on three-phase proportions of conditioned sands: (a) FIR = 20%; (b) BSIR = 20%.
When investigating the mechanism by which bubbles influence the shear strength of conditioned sand, it is essential to analyze not only the proportion of bubbles within pores but also the impact of bubble size through microscopic structural examination. To this end, an optical microscope (Axio Imager A1, Carl Zeiss, Oberkochen, Germany) equipped with a digital camera (AxioCam ICc 3, Carl Zeiss, Oberkochen, Germany) was used to observe the bubble microstructure in the conditioned sand. Additionally, the changes in bubble size within 2 h were measured using ImageJ 2.0 software. As shown in Figure 16, the bubble diameter in foam-conditioned sand is generally below 900 μm, whereas that in bubble–slurry-conditioned sand does not exceed 300 μm. Moreover, after 2 h, the median bubble diameter in foam-conditioned sand increased from approximately 450 μm to about 500 μm, indicating progressive bubble coalescence, while the median bubble diameter in bubble–slurry-conditioned sand remained nearly unchanged. Consistent with previous findings [34], the adsorption and separation effects of the slurry lead to smaller and more stable bubbles in bubble–slurry systems. After mixing with sand, this pattern remains consistent. This finer and more stable bubble structure more effectively inhibits direct sand–sand contact over time, thereby explaining why bubble–slurry-conditioned sand can maintain low shear strength even after 24 h.
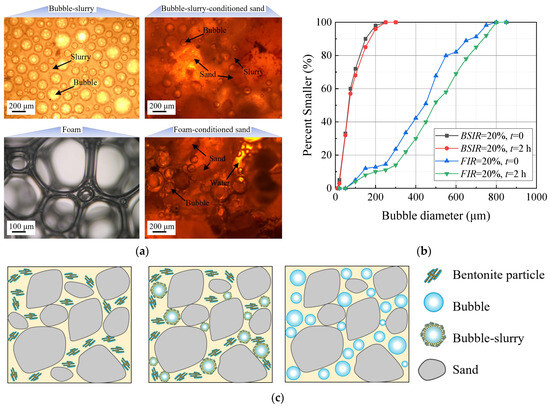
Figure 16.
Microstructural characteristics and bubble size features of conditioned sands under different conditioning methods: (a) microscopic images of bubble–slurry and bubble–slurry-conditioned sand, and foam and foam-conditioned sand; (b) bubble size distribution within conditioned sands; (c) schematic illustration of the microstructure of conditioned sand.
4.2. Mechanism of the Effect of Rheological and Surface Tension of Agents on Shear Strength
The rheological parameters of the conditioning agent directly influence stress transfer in conditioned sand during shear, thereby affecting the variation in shear strength with shear rate [28]. A conditioning agent with higher viscosity helps maintain uniform stress distribution during shear. The rheological properties of the slurry, foam, and bubble–slurry were measured using an NXS-11A rotational viscometer, and rheological models were determined through curve fitting, as summarized in Table 2. The initial dynamic shear stress is reported in pascals (Pa), and the viscosity coefficient is reported in pascal seconds (Pa·s). For each conditioning agent, rheological parameters were determined from three parallel measurements, ensuring good repeatability and reliability of the results. It can be observed that all three conditioning agents conform to the Herschel–Bulkley rheological model. Among them, the slurry has the highest initial dynamic shear stress, the foam has the lowest initial dynamic shear stress and viscosity coefficient, and the bubble–slurry has a relatively high viscosity coefficient.
Table 2.
Rheological parameters of the conditioning agents.
The Bingham number is a dimensionless parameter commonly used to characterize the relative contribution of the initial dynamic shear force to the viscous resistance during fluid flow. In this study, it is simply defined as the ratio of the initial dynamic shear force of conditioned sand to the product of the viscosity coefficient and shear rate. It should be noted that this definition is essentially an approximation, introduced for comparative and interpretative purposes rather than as a constitutive parameter of a rigorous rheological model. When the Bingham number > 1, shear strength is dominated by the initial dynamic shear force; otherwise, it is dominated by viscous resistance. The variation in the Bingham number with shear rate under different conditioning schemes and pressure conditions is shown in Figure 17. The results indicate that as the shear rate increases, the Bingham number of all conditioned sand decreases, indicating that the contribution of the initial dynamic shear force to shear strength gradually weakens, while the relative influence of viscous resistance gradually increases. When the shear rate reaches 0.091 s−1, the Bingham number of slurry-conditioned sand is less than 1, indicating that its shear strength is now dominated by viscous resistance.
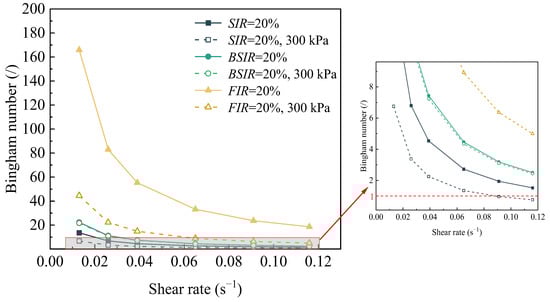
Figure 17.
The Bingham number of conditioned sand.
According to existing research, the surface tension and related interfacial properties of the conditioning agent govern bubble stability and liquid film drainage rates, thereby influencing the size distribution of bubbles within the conditioned sand, pore connectivity, and lubrication and bonding effects [35,36]. Therefore, surface tension (γ) is introduced as a qualitative parameter to help interpret the pore-scale mechanisms governing shear strength reduction. After completion of the shear test, the drainage outlet at the base of the apparatus was opened to discharge the pore liquid from the conditioned sand, and the surface tension was measured using a Dataphysics DCAT21 surface tension analyzer (Dataphysics, Filderstadt, Germany) based on the platinum plate method. Table 3 summarizes the surface tension (γ) of pore liquids for all conditioned sands.
Table 3.
Surface tension of pore fluid in conditioned sands.
The results show that foam-conditioned sand has the lowest γ value, bubble–slurry-conditioned sand has an intermediate γ value, and slurry-conditioned sand has the highest γ value. Low surface tension helps stabilize microbubbles and promotes lubrication at the gas–liquid–solid interface, thereby weakening the effective stress transfer between particles. When using foam conditioning, the significant reduction in shear strength is attributed to the low surface tension and the stabilization of bubbles by sand particles. The bubbles uniformly separate the sand particles, disrupting the transmission of effective stress. In contrast, the influence of surface tension on slurry-conditioned sand is negligible, and its shear strength is primarily controlled by the rheological parameters of the slurry fluid. Bubble–slurry-conditioned sand exhibits composite behavior, where the lower γ bonded bentonite particles and sand particles provide multiple stabilizing effects on the bubbles, enabling the bubbles and slurry to jointly form lubricating separations between particles, thereby comprehensively influencing their shear response. In summary, the rheological properties of the conditioning agent primarily determine the extent to which shear strength is dominated by initial dynamic shear force or viscous resistance at different shear rates, while surface tension further alters the stress transmission mechanism through bubble stability, interfacial lubrication, and pore structure regulation. In this study, surface tension is introduced as a qualitative parameter to assist in explaining the observed differences in shear strength reduction among the three conditioning strategies. A systematic investigation using conditioning agents with varied surface tensions was beyond the scope of the present work and will be addressed in future studies.
5. Engineering Application
Figure 18 provides a practical guideline for selecting optimal injection ratios in slurry, bubble–slurry, and foam conditioning. The results indicate that when e/emax = 1.00~1.36, the conditioned sand exhibits both low undrained shear strength and suitable flowability (slump between 100 and 200 mm).
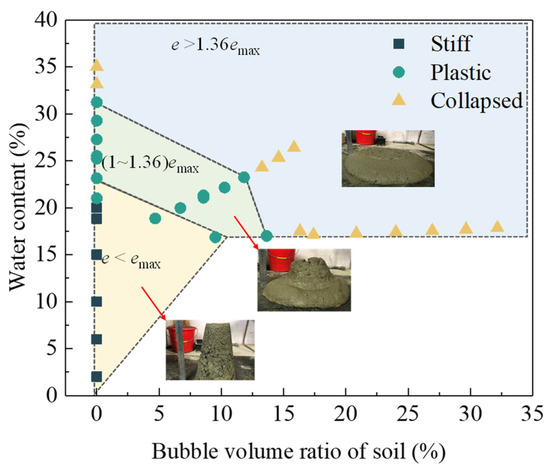
Figure 18.
Influence of bubble volume ratio and water content on void ratio and slump of conditioned sands (chamber pressure ≤ 3 bar).
In a field project on the Jinan Metro Line R2, EPB shield tunneling reached ring 486, where the strata transitioned from fine silty sand to a composite of fine and medium-coarse sand. During tunneling, conditioning effectiveness was monitored in real time using EPB shield machine-integrated indicators, including cutterhead torque and soil discharge efficiency. The latter was evaluated by the ratio of the actual discharged volume per unit time to the theoretical capacity of the screw conveyor, providing a direct measure of soil flowability and clogging tendency. From rings 487 to 508, as the formation became coarser, the foam conditioning with a FIR of 30% resulted in a conditioned void ratio of only e/emax ≈ 0.71, which was insufficient to ensure effective particle separation. Consequently, cutterhead torque increased sharply from approximately 2500 kN·m to 4600 kN·m, accompanied by a significant reduction in muck discharge efficiency, with the ratio of actual muck discharge to the theoretical capacity of the screw conveyor decreasing to about 0.6, indicating poor flowability and a high risk of clogging (Figure 19).
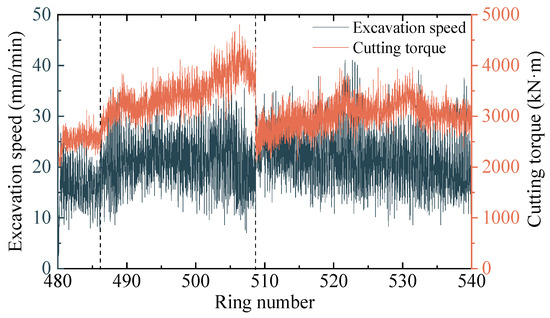
Figure 19.
Torque and excavation speed of the cutterhead before and after conditioning.
Guided by the laboratory findings, a combined foam and slurry conditioning scheme was implemented on site (Table 4). Injection of 25% foam and 13% bentonite slurry increased the conditioned void ratio to e/emax = 1.08, leading to a substantial reduction in cutterhead torque from approximately 4600 kN·m to about 2900 kN·m (a decrease of nearly 37%). At the same time, muck discharge became smooth and continuous, and no clogging of the screw conveyor was observed, without inducing spewing.
Table 4.
Conditioning schemes implemented in the EPB shield tunnel project.
The proposed conditioning strategy and the recommended void ratio range (e/emax = 1.00~1.36) are derived from laboratory tests conducted on coarse sand–gravel soils and are applicable to gravelly soils and sandy soils under groundwater pressures up to 300 kPa. In practice, short-term fluctuations in groundwater pressure can be accommodated by fine-tuning the foam and slurry injection ratio to maintain the target void ratio and chamber stability. For coarser formations such as sand–pebble or pebble-dominated strata, the maximum allowable void ratio is expected to be slightly lower than the range proposed herein, as excessively high void ratios may increase the risk of spewing under water pressure. When abrupt changes in soil gradation are encountered, timely adjustment of conditioning dosage is recommended to avoid torque escalation or discharge inefficiency. In contrast, for finer sandy soils with stronger resistance to spewing but higher susceptibility to clogging, a relatively higher optimal void ratio range may be acceptable. Under variations in advance rate, maintaining consistency between excavation speed and conditioned soil discharge capacity is essential to prevent clogging or face instability. Although the engineering application in this study is limited to a single tunneling project, future work will focus on systematic laboratory investigations and additional field applications under diverse geological conditions, groundwater pressures, and EPB operational settings, aiming to establish a more comprehensive reference framework for conditioned soil design in EPB tunneling.
The engineering application of bubble–slurry will continue to be explored because it has good economic and environmental benefits. The bubble–slurry contains approximately 50% gas by volume, allowing a significant reduction in slurry consumption. Moreover, its improved stability enables conditioned sand to maintain favorable properties for extended periods, reducing the need for frequent agent replenishment during EPB machine shutdown. The lower slurry dosage further contributes to reduced muck volume, thereby decreasing spoil transportation and disposal requirements. Future work will explore the partial replacement of bentonite with excavated soil to further enhance sustainability. Based on the laboratory results and field observations, the following practical guidelines are proposed for EPB tunneling in coarse-grained soils (Table 5).
Table 5.
Practical guidelines for soil conditioning in EPB tunneling.
6. Conclusions
This study systematically investigates the undrained shear behavior of sand conditioned with slurry, foam, and a newly developed bubble–slurry under varying vertical stress, time, and shear-rate conditions, and clarifies how pore-scale gas–liquid characteristics govern macroscopic mechanical response and engineering performance.
(1) The shear strength of conditioned sand is controlled not only by void ratio but also by gas-phase characteristics within pores. A recommended range of e/emax = 1.00–1.36 ensures low undrained shear strength while maintaining adequate flowability under chamber pressures up to 300 kPa, providing a practical reference for coarse sand–gravel soils.
(2) Bubble–slurry-conditioned sand exhibits superior time stability compared with conventional foam conditioning. While both systems remain stable within 6 h, after 24 h the peak shear strength of foam-conditioned sand increases markedly (from 0.39 to 4.67 kPa), whereas bubble–slurry-conditioned sand shows only a slight increase (from 0.67 to 0.84 kPa), indicating delayed strength recovery and improved tolerance to EPB downtime.
(3) The bubble–slurry conditioning approach demonstrates clear novelty and practical advantages. By integrating stable microbubbles into a bentonite slurry matrix, it forms a more efficient and stable three-phase system than conventional foam, reducing slurry consumption, enhancing conditioning efficiency, and prolonging favorable soil properties, with potential benefits for operational continuity.
(4) Engineering application confirms the effectiveness of void ratio control guided by laboratory findings. In the Jinan Metro Line R2 project, adjusting the conditioned void ratio from e/emax ≈ 0.71 to 1.08 reduced cutterhead torque from 4600 to 2900 kN·m, corresponding to a reduction of approximately 37%, demonstrating the practical value of the proposed framework. This study is currently limited to coarse sand–gravel soils; future work will extend validation to different soil types, groundwater conditions, conditioning schemes, and long-term field performance.
Author Contributions
Conceptualization, L.W. and J.H.; methodology, L.W.; software, L.W.; validation, L.W., J.H. and W.Z.; formal analysis, W.Z.; investigation, F.M.; resources, L.W. and W.Z.; data curation, J.H.; writing—original draft preparation, L.W.; writing—review and editing, W.Z. and F.M.; visualization, L.W.; supervision, J.H.; project administration, W.Z.; funding acquisition, L.W. All authors have read and agreed to the published version of the manuscript.
Funding
This research was funded by Basic Science (Natural Science) Research Project of Higher Education Institutions in Jiangsu Province, grant number 24KJB560013, and the Research Fund Project of Nanjing Vocational Institute of Transport Technology, grant number JZ2401.
Institutional Review Board Statement
Not applicable.
Informed Consent Statement
Not applicable.
Data Availability Statement
The original contributions presented in this study are included in the article. Further inquiries can be directed to the corresponding author.
Conflicts of Interest
The authors declare no conflicts of interest.
Abbreviations
The following abbreviations are used in this manuscript:
| BSER | Bubble–slurry expansion ratio |
| BSERp | Bubble–slurry expansion ratio under pore pressure |
| BSIR | Bubble–slurry injection ratio |
| BSIRp | Bubble–slurry injection ratio under pore pressure |
| BVR | Proportion of bubbles in the conditioning agent |
| Cc | Curvature coefficient |
| cf | Foaming agent concentration |
| csl | Slurry concentration |
| css | Surfactant concentration in bubble–slurry |
| Cu | Uniformity coefficient |
| D | Internal diameter of pressurized testing chamber |
| Dv | Diameter of shear vane |
| e | Void ratio of conditioned sand |
| emax | Maximum void ratio of unconditioned sand |
| FER | Foam expansion ratio |
| FERp | Foam expansion ratio under pore pressure |
| FIR | Foam injection ratio |
| FIRp | Foam injection ratio under pore pressure |
| k | Permeability coefficient |
| mb | Mass of bentonite |
| ml,bs | Mass of slurry and surfactant mixture |
| ml,f | Mass of foaming agent solution |
| msl | Mass of slurry |
| mss | Mass of surfactant |
| mw | Mass of water |
| n | Vane rotation speed |
| n0 | Initial porosity |
| P | Pore pressure |
| Patm | Atmospheric pressure |
| SIR | Slurry injection ratio |
| T | Torque |
| Va | Volume of conditioning agent |
| Vb | Volume of bubbles |
| VB | Bubble volume |
| Vbs | Volume of bubble–slurry |
| Vf | Volume of foam |
| Vl,bs | Volume of slurry and surfactant mixture |
| Vl,f | Volume of foaming agent solution |
| Vs | Volume of excavated soil |
| Vs | Solid volume |
| Vsl | Volume of slurry |
| Vw | Pore-water volume |
| Vw0 | Initial pore-water volume |
| w | Sand water content |
| γ | Surface tension |
| ρbp | Density of bentonite particle |
| ρsl | Density of slurry |
| σv | Vertical total stress |
| τ | Shear stress |
| Shear rate |
Appendix A
Based on the fitting results shown in Figure 12, the Bingham rheological parameters of the conditioned sands under different operating conditions are summarized in Table A1 and Table A2.
Table A1.
Bingham fluid rheological parameters obtained based on peak strength of conditioned sand.
Table A1.
Bingham fluid rheological parameters obtained based on peak strength of conditioned sand.
| Conditioning Agent | σv (kPa) | Initial Dynamic Shear Stress (kPa) | Viscosity Coefficient (kPa·s) | R2 |
|---|---|---|---|---|
| SIR = 10% | 0 | 2.607 | 18.463 | 0.73 |
| SIR = 20% | 0 | 0.413 | 1.363 | 0.85 |
| 1.5 | 1.047 | 1.701 | 0.52 | |
| 3 | 1.275 | 5.716 | 0.93 | |
| SIR = 30% | 0 | 0.292 | 1.113 | 0.73 |
| BSIR = 10% | 0 | 1.374 | 3.570 | 0.44 |
| BSIR = 20% | 0 | 0.384 | 2.476 | 0.77 |
| 1.5 | 0.582 | 1.082 | 0.94 | |
| 3 | 0.642 | 3.627 | 0.95 | |
| BSIR = 30% | 0 | 0.299 | 0.448 | 0.44 |
| FIR = 10% | 0 | 0.299 | 2.044 | 0.96 |
| FIR = 20% | 0 | 0.280 | 1.785 | 0.98 |
| 1.5 | 0.309 | 1.455 | 0.94 | |
| 3 | 0.474 | 1.707 | 0.98 | |
| FIR = 30% | 0 | 0.216 | 0.572 | 0.61 |
Table A2.
Bingham fluid rheological parameters obtained based on residual strength of conditioned sand.
Table A2.
Bingham fluid rheological parameters obtained based on residual strength of conditioned sand.
| Conditioning Agent | σv (kPa) | Initial Dynamic Shear Stress (kPa) | Viscosity Coefficient (kPa·s) | R2 |
|---|---|---|---|---|
| SIR = 10% | 0 | 1.354 | 9.816 | 0.97 |
| SIR = 20% | 0 | 0.271 | 1.531 | 0.97 |
| 1.5 | 0.418 | 3.829 | 0.99 | |
| 3 | 0.658 | 7.490 | 0.99 | |
| SIR = 30% | 0 | 0.266 | 3.950 | 0.88 |
| BSIR = 10% | 0 | 0.986 | 3.602 | 0.76 |
| BSIR = 20% | 0 | 0.276 | 0.951 | 0.97 |
| 1.5 | 0.388 | 1.093 | 0.99 | |
| 3 | 0.537 | 1.901 | 0.99 | |
| BSIR = 30% | 0 | 0.231 | 0.465 | 0.99 |
| FIR = 10% | 0 | 0.224 | 0.587 | 0.98 |
| FIR = 20% | 0 | 0.192 | 0.089 | 0.89 |
| 1.5 | 0.250 | 0.362 | 0.96 | |
| 3 | 0.424 | 0.732 | 0.98 | |
| FIR = 30% | 0 | 0.156 | 0.052 | 0.93 |
References
- Gharahbagh, E.A.; Qiu, T.; Rostami, J. Evaluation of Granular Soil Abrasivity for Wear on Cutting Tools in Excavation and Tunneling Equipment. J. Geotech. Geoenviron. Eng. 2013, 139, 1718–1726. [Google Scholar] [CrossRef]
- Lee, H.; Kim, D.; Shin, D.; Oh, J.; Choi, H. Effect of Foam Conditioning on Performance of EPB Shield Tunnelling through Laboratory Excavation Test. Transp. Geotech. 2022, 32, 100692. [Google Scholar] [CrossRef]
- Cheng, C.; Liao, S.; Huo, X.; Chen, L. Experimental Study on the Soil Conditioning Materials for EPB Shield Tunneling in Silty Sand. Adv. Civ. Eng. 2020, 2020, 8856569. [Google Scholar] [CrossRef]
- Yang, Z.; Yang, X.; Ding, Y.; Jiang, Y.; Qi, W.; Sun, Z.; Shao, X. Characteristics of Conditioned Sand for EPB Shield and its Influence on Cutterhead Torque. Acta Geotech. 2022, 17, 5813–5828. [Google Scholar] [CrossRef]
- Li, S.; Wan, Z.; Zhao, S.; Ma, P.; Wang, M.; Xiong, B. Soil Conditioning Tests on Sandy Soil for Earth Pressure Balance Shield Tunneling and Field Applications. Tunn. Undergr. Space Technol. 2022, 120, 104271. [Google Scholar] [CrossRef]
- Xu, Q.; Zhang, L.; Zhu, H.; Gong, Z.; Liu, J.; Zhu, Y. Laboratory Tests on Conditioning the Sandy Cobble Soil for EPB Shield Tunnelling and its Field Application. Tunn. Undergr. Space Technol. 2020, 105, 103512. [Google Scholar] [CrossRef]
- Yang, Y.; Li, X.; Su, W. Experimental Investigation on Rheological Behaviors of Bentonite- And CMC-Conditioned Sands. KSCE J. Civ. Eng. 2020, 24, 1914–1923. [Google Scholar] [CrossRef]
- Bezuijen, A.; Schaminee, P. Simulation of the EPB-Shield TBM in Model Tests with Foam as Additive. In Modern Tunneling Science and Technology; CRC Press: London, UK, 2001; pp. 935–940. [Google Scholar]
- Bezuijen, A.; Schaminee, P.; Kleinjan, J.A. Additive Testing for Earth Pressure Balance Shields. In Geotechnical Engineering for Transportation Infrastructure, VOLS 1–3: Theory and Practice, Planning and Design, Construction and Maintenance, 1991–1996; CRC Press: London, UK, 1999. [Google Scholar]
- Houlsby, G.T.; Psomas, S. Soil Conditioning for Pipejacking and Tunnelling: Properties of Sand/Foam Mixtures. In Proceedings of the Underground Construction, London, UK, 18–20 September 2001; pp. 128–138. [Google Scholar]
- Mori, L.; Mooney, M.; Cha, M. Characterizing the Influence of Stress on Foam Conditioned Sand for EPB Tunneling. Tunn. Undergr. Space Technol. 2018, 71, 454–465. [Google Scholar] [CrossRef]
- Zhong, J.; Wang, S.; Qu, T. Undrained Vane Shear Strength of Sand-Foam Mixtures Subjected to Different Shear Rates. J. Rock Mech. Geotech. Eng. 2022, 15, 1591–1602. [Google Scholar] [CrossRef]
- Wang, L.; Zhu, W.; Qian, Y.; Xing, H. The New Bubble-Slurry for Sand Conditioning During EPB Shield Tunnelling: A Laboratory Scale Study. KSCE J. Civ. Eng. 2023, 27, 2191–2201. [Google Scholar] [CrossRef]
- EFNARC. Specifications and Guidelines for the Use of Specialist Products for Mechanized Tunnelling (TBM) in Soft Ground and Hard Rock; EFNARC: Flums, Switzerland, 2005. [Google Scholar]
- Hu, Q.; Wang, S.; Qu, T.; Xu, T.; Huang, S.; Wang, H. Effect of Hydraulic Gradient on the Permeability Characteristics of Foam-Conditioned Sand for Mechanized Tunnelling. Tunn. Undergr. Space Technol. 2020, 99, 103377. [Google Scholar] [CrossRef]
- Ling, F.; Wang, S.; Hu, Q.; Huang, S.; Feng, Z. Effect of Bentonite Slurry on the Function of Foam for Changing the Permeability Characteristics of Sand Under High Hydraulic Gradients. Can. Geotech. J. 2022, 59, 1061–1070. [Google Scholar] [CrossRef]
- Martinelli, D.; Todaro, C.; Luciani, A.; Peila, D. Use of a Large Triaxial Cell for Testing Conditioned Soil for EPBs Tunnelling. Tunn. Undergr. Space Technol. 2019, 94, 103126. [Google Scholar] [CrossRef]
- Djeran-Maigre, I.; Dubujet, P.; Vogel, T.M. Variation Over Time of Excavated Soil Properties Treated with Surfactants. Environ. Earth Sci. 2018, 77, 67. [Google Scholar] [CrossRef]
- Wu, L.; Qu, F. Discrete Element Simulation of Mechanical Characteristic of Conditioned Sands in Earth Pressure Balance Shield Tunneling. J. Cent. South Univ. Technol. 2009, 16, 1028–10333. [Google Scholar] [CrossRef]
- Merritt, A.S.; Mair, R.J. Mechanics of Tunnelling Machine Screw Conveyors; Model Tests. Géotechnique 2006, 56, 605–615. [Google Scholar] [CrossRef]
- Avunduk, E.; Copur, H. Empirical Modeling for Predicting Excavation Performance of EPB TBM Based on Soil Properties. Tunn. Undergr. Space Technol. 2018, 71, 340–353. [Google Scholar] [CrossRef]
- Avunduk, E.; Copur, H.; Tolouei, S.; Tumac, D.; Balci, C.; Bilgin, N.; Shaterpour Mamaghani, A. Possibility of Using Torvane Shear Testing Device for Soil Conditioning Optimization. Tunn. Undergr. Space Technol. 2021, 107, 103665. [Google Scholar] [CrossRef]
- Hu, W.; Rostami, J. A New Method to Quantify Rheology of Conditioned Soil for Application in EPB Tbm Tunneling. Tunn. Undergr. Space Technol. 2020, 96, 103192. [Google Scholar] [CrossRef]
- Hu, W.; Rostami, J. Evaluating Rheology of Conditioned Soil Using Commercially Available Surfactants (Foam) for Simulation of Material Flow through EPB Machine. Tunn. Undergr. Space Technol. 2021, 112, 103881. [Google Scholar] [CrossRef]
- Martinelli, D.; Peila, D.; Campa, E. Feasibility Study of Tar Sands Conditioning for Earth Pressure Balance Tunnelling. J. Rock Mech. Geotech. Eng. 2015, 7, 684–690. [Google Scholar] [CrossRef]
- Dzuy, N.Q.; Boger, D.V. Direct Yield Stress Measurement with the Vane Method. J. Rheol. 1985, 29, 335–347. [Google Scholar] [CrossRef]
- Galli, M.; Thewes, M. Rheological Characterisation of Foam-Conditioned Sands in EPB Tunneling. Int. J. Civ. Eng. 2019, 17, 145–160. [Google Scholar] [CrossRef]
- Lee, H.; Kwak, J.; Choi, J.; Hwang, B.; Choi, H. A Lab-Scale Experimental Approach to Evaluate Rheological Properties of Foam-Conditioned Soil for EPB Shield Tunnelling. Tunn. Undergr. Space Technol. 2022, 128, 104667. [Google Scholar] [CrossRef]
- Meng, Q.; Qu, F.; Li, S. Experimental Investigation on Viscoplastic Parameters of Conditioned Sands in Earth Pressure Balance Shield Tunneling. J. Mech. Sci. Technol. 2011, 25, 2259–2266. [Google Scholar] [CrossRef]
- ASTM. Standard Test Method for Laboratory Miniature Vane Shear Test for Saturated Fine-Grained Clayey Soil; ASTM International: Mumbai, India, 2000. [Google Scholar]
- Huang, X.; Horn, R.; Ren, T. Deformation and Pore Water Pressure Change During Static and Cyclic Loading with Subsequent Shearing on Soils with Different Textures and Matric Potentials. Soil Tillage Res. 2021, 209, 104909. [Google Scholar] [CrossRef]
- Wheeler, S.J. The Undrained Shear Strength of Soils Containing Large Gas Bubbles. Géotechnique 1988, 38, 399–413. [Google Scholar] [CrossRef]
- Wang, L.; Zhu, W.; Min, F.; Hou, H. Shear Strength of Bubble–Slurry-Conditioned Sand Under Total Vertical Pressure Based on Void Characteristics. KSCE J. Civ. Eng. 2025, 29, 100201. [Google Scholar] [CrossRef]
- Wang, L.; Zhu, W.; Qian, Y. Interface Characteristics and Stability Mechanisms of Bubbles in High-Concentration Bentonite Slurry. J. Mol. Liq. 2023, 387, 122602. [Google Scholar] [CrossRef]
- Feng, Z.; Wang, S.; Qu, T.; Zheng, X.; Ling, F. Experimental Study on Workability and Permeability of Sandy Soils Conditioned with Thickened Foam. J. Rock Mech. Geotech. Eng. 2024, 16, 532–544. [Google Scholar] [CrossRef]
- Sebastiani, D.; Vilardi, G.; Bavasso, I.; Di Palma, L.; Miliziano, S. Classification of Foam and Foaming Products for EPB Mechanized Tunnelling Based on Half-Life Time. Tunn. Undergr. Space Technol. 2019, 92, 103044. [Google Scholar] [CrossRef]
Disclaimer/Publisher’s Note: The statements, opinions and data contained in all publications are solely those of the individual author(s) and contributor(s) and not of MDPI and/or the editor(s). MDPI and/or the editor(s) disclaim responsibility for any injury to people or property resulting from any ideas, methods, instructions or products referred to in the content. |
© 2026 by the authors. Licensee MDPI, Basel, Switzerland. This article is an open access article distributed under the terms and conditions of the Creative Commons Attribution (CC BY) license.