Abstract
The use of waste rubbers and polyurethane has a significant impact on the abrasion resistance of the porous elastic road surface (PERS) mixture. The purpose of this work is to study the anti-abrasion performance of the PERS mixture under different contents of waste rubbers. First, features of the surface of the PERS mixture were collected by image processing technology. Then, the abrasion performance of the mixture was studied by image processing and wear tests. The correlation between the surface texture parameters and the anti-abrasion performance of the mixture was analyzed by the gray entropy correlation method. It is found that the change of convex particle area in the equivalent diameter range of 2–5 mm had the greatest correlation with the abrasion resistance of the PERS mixture. The effect of the waste rubber content of the mixture on the anti-abrasion performance was investigated, and a waste rubber content of 10% showed the best anti-abrasion performance. It is expected that this work can provide a new method for analyzing the anti-abrasion performance of functional pavement.
1. Introduction
With the improvement of living standards, the demand for transportation is gradually increasing; meanwhile, the requirements for green, functional, and durable highways are becoming higher and higher. The increase in cars contributes to severe noise pollution around the road, which has seriously affected the work and rest of surrounding residents [1,2,3]. Moreover, long-term exposure to a noisy road also has a negative influence on hearing, or even leads to hypertension and cardiovascular diseases. Porous Elastic Road Surface (PERS), as a new noise reduction pavement, possesses characteristics of large air void content and high elasticity, which have excellent sound absorption and vibration reduction ability [4,5,6].
The PERS mixture is formed by polyurethane adhesive, open-graded sand, and gravel as aggregates. In addition, the stone aggregates are partly replaced by waste rubber particles of the same size [7,8]. Many studies have been carried out to explore the road performance and other features, such as sound absorption ability. Zhong determined that the optimal oil–stone ratio of the PERS was 4.7% according to the leakage loss rate and scattering loss rate. Stones were partly replaced with 1.18–2.36 mm rubber particles by the internal mixing method, and it was found that the replaced mixture had good mechanical properties [9,10]. Xiaoshun Li compared and evaluated the road performance of PERS and asphalt mixture and found that polyurethane as an adhesive has better resistance to loosening, low temperature cracking, water loss, rutting and skid than asphalt mixture [11]. In addition, the effects of different moulding methods on aggregate gradation were explored [12], and the effects of three PERS with different rubber contents on their road performance and noise reduction performance were studied. It was found that when the rubber content was 10%, the scattering loss rate was the smallest [13,14]. The sound absorption ability was also investigated. The noise reduction performance of the PERS mixture is better than that of the porous asphalt concrete mixture under a certain porosity ratio, and the noise reduction performance increased first and then decreased with the extension of the thermal and oxidative aging time [15,16,17]. The mechanism of noise reduction of PERS was also investigated; it was found that the main reasons for the decline of pavement noise reduction function were void plugging and elastic attenuation [18,19].
However, the rubber particles in the PERS mixture, as the important component connecting vehicles and road surfaces, are easy to be attacked, which affects the anti-abrasion ability of PERS [20]. Some researchers studied the anti-abrasion ability of coarse aggregates by simulating and using digital image processing technology for the abrasion surface, while the anti-abrasion ability of rubber particles and mixtures has not been explored. The digital image processing technology is mostly applied to the internal segregation problem and the surface anti-slip performance of the asphalt mixture. Li analyzed the homogeneity evaluation of hot in-place recycling asphalt mixture using digital image processing technique, the microstructure of each cross section was extracted using digital image processing technique, including image enhancement, iterative threshold segmentation and maximum between-class variance (OTSU threshold). Gong characterized the meso-structural distribution of asphalt mixtures via digital image processing and relation to macroscopic performances [21,22,23]. The surface texture change of the mixture after abrasion has barely been studied, and the prior art is limited only to the anti-skid performance of the mixture; research on the anti-abrasion is limited. Therefore, it is important to analyze the surface texture and the anti-abrasion properties of the PERS mixture.
In this work, the surface texture characteristic parameters of the PERS mixture were studied using image processing technology, and a suitable image processing method for mixtures was obtained. The number of convex particles and the convex area were proposed as new indicators to evaluate the anti-abrasion performance of the mixture. In addition, the anti-abrasion performance of the PERS mixture with different rubber particle contents was studied by the mixture-based scattering instrument, and the relationship between the surface texture parameters of the high-elastic porous mixture was investigated. Finally, the structural depth and the friction coefficient were analyzed by the ash entropy correlation analysis method. It is expected that this work can provide an effective method for the analysis of abrasion resistance for the PERS mixtures, which is beneficial to the research and application of PERS in road engineering.
2. Raw Materials and Experimental Design
2.1. Raw Materials
2.1.1. Polyurethane Adhesive
The single-component polyurethane with a long curing time was selected from Wanhua Chemical Co., Ltd., Jinan, China. to serve as the binder for the PERS mixture; it possesses the characteristics of yellow color, viscoelastic, and minimal sensitivity to temperature. The technical indices are shown in Table 1.

Table 1.
The technological indices of polyurethane.
2.1.2. Rubber Particles
Rubber particles are incorporated into PERS as aggregates, with the same size (1.18~2.36 mm, 2.36~4.75 mm) being substituted in equal volume to enhance the elastic damping performance of PERS. The rubber particle samples are shown in Figure 1, and the technical indices are shown in Table 2.
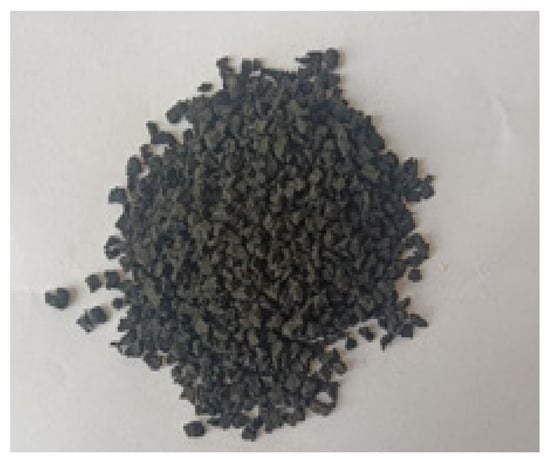
Figure 1.
The rubber particles.
Table 2.
The technological indices of rubber particles.
2.1.3. Aggregates
The coarse aggregate used in the experiment is basalt aggregate, while the fine aggregates and mineral powders are limestone aggregates. The technical indices of coarse aggregate and fine aggregate are shown in Table 3 and Table 4, respectively.
Table 3.
The technological indices of coarse aggregate.
Table 4.
The technological indices of fine aggregate.
2.2. Mix Proportion Design
The target porosity range for PERS is set to be 24%. The design gradation of PERS can be preliminarily determined based on the gradation of OGFC-13 in porous drainage pavements. It is considered to design the mix proportion of the mixture with different rubber particle contents [24]. The results are shown in Table 5.
Table 5.
PERS design gradation.
In this study, PERS was mixed with rubber particles instead of some stone materials as aggregates, and rubber particles mainly replaced stone materials in the ranges of 1.18–2.36 mm and 2.36–4.75 mm. The specific replacement equation is shown in Equation (1):
where m1 is the mass of the target rubber particles; m2 is the total mass of stone and rubber particles; ρ1 is the density of rubber particles; ρ2 is the density of the stone material; α is the percentage of rubber particles.
According to the influence of rubber particle content and oil stone ratio on the wear resistance of PERS, the polyurethane content is calculated using Equations (2) and (3):
where h is the initial estimated thickness of polyurethane film, taken as 80 mm; A is the total surface area of the aggregate; is the amount of polyurethane used; , , c, , , , and are the pass rates of 4.75 mm to 0.075 mm sieve size, respectively.
Based on the previous results of matching and coordinating noise reduction performance and mechanical properties [9,17], the polyurethane dosage for the PERS is determined to be 4.3%.
The air void of PERS (with rubber particle content of 10% and 20% respectively) under the above two gradations was tested, which meets the requirements of the “Technical Specifications for Design and Construction of Porous Asphalt Pavement (Chinese Standard JTG/T 3350-03-2020)” [25], indicating that the selection of rubber particle content of 10% and 20% meets the requirements of this study [26].
2.3. Test Specimen Forming Method
The standard Marshall specimens (Φ101.6 ± 0.2 mm × 63.5 ± 1.3 mm), large Marshall specimens (Φ152.4 ± 0.2 mm × 95.3 ± 2.5 mm) and rutting specimens (300 mm × 300 mm × 50 mm) with the target air void of 24%, which were used in accordance with Chinese standard JTG 3410-2025 [27]. The prepared specimens were demoulded after curing at room temperature for 7 days.
2.4. Image Processing
This paper uses image processing techniques to analyze the texture distribution of PERS road surfaces and accurately explores the wear resistance of PERS under different rubber particle and polyurethane dosages [23]. Image processing technology mainly consists of the following steps: (1) image acquisition; (2) grayscale processing; (3) image enhancement; and (4) image segmentation. The specific operation steps of image processing technology are shown in Figure 2.
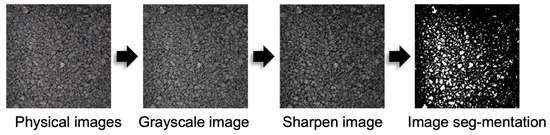
Figure 2.
Analysis of the surface texture structure of PERS by image processing technology.
2.4.1. Image Acquisition
As described above, the size of the image pixel matrix determines the accuracy of the image information, and the factors affecting the image acquisition mainly include lighting, polyurethane pavement color, camera shooting position, etc. The pavement color of the polyurethane mixture is relatively uniform, all of which are black, so the color of the specimen has little influence on the image acquisition [24]. During the collection process, the following points need to be noted:
- (1)
- The camera lens should be about 50–60 cm away from the specimen, and the actual short-side distance of the field of view should be less than 35 cm.
- (2)
- The whole specimen should be in a square area of 25 cm × 25 mm.
- (3)
- The shooting angle should be vertical.
2.4.2. Image Preprocessing
- (1)
- Image size calibration
Before processing an image, the image is cropped or processed into a standard image. In this study, the image size of the polyurethane mixture specimens is calibrated as 200 mm × 200 mm.
- (2)
- Image grayscale processing
The collected picture of the specimen of PERS is a color image; however, the information content of the color picture is too large, and only the information in the grayscale image needs to be used when the picture is recognized. To improve the operation speed, the color image of the PERS needs to be converted into a grayscale image [28]. As shown in Figure 2.
- (3)
- Image denoising processing
Digital images may be polluted by noise in the process of acquisition and transmission. The goal of image denoising is to improve a given image and solve the problem of image quality degradation due to noise interference in the actual image [29]. The denoising image of the PERS is shown in Figure 2.
2.4.3. Image Enhancement
Image enhancement is a distortion process carried out to enhance the useful information contained in an image, and its main goal is to improve the legibility of the image. In this work, the method of median filtering was used to enhance the image. The specific implementation method of median filtering is to remove the two-dimensional sliding template of a certain structure, sort the pixels in the board according to the size of the pixel value, and generate a monotonously rising (or falling) two-dimensional data sequence. The two-dimensional median filter output is , among them, and are the original image and the processed image, respectively. W is a two-dimensional template, usually 3 × 3, 5 × 5 area [30,31]. The image is smoothed by median filtering.
2.4.4. Image Segmentation
Image segmentation refers to the method and procedure of dividing an image into specific areas with specific features and describing them. The existing image segmentation methods are mainly divided into the following categories: edge-based segmentation methods, region-based segmentation methods, threshold-based grayscale segmentation methods, and segmentation methods based on specific theories [32,33]. In this study, the image will be processed using the method of threshold segmentation
The principle of threshold segmentation is to divide image pixels into several categories by setting different feature thresholds. Commonly used features include grayscale or color features that come directly from the original image, as well as features that are transformed from the original grayscale or color values. Set the original image as , the several eigenvalues , , …… are found in , where in ≥ 1, split the image into parts, and the split image is shown in Equation (4):
The threshold function can be written as , among them , , and is the grayscale value, local domain characteristics, and the pixel value of the processed black and white image of . In the process of threshold segmentation, you can binarize the image by selecting the threshold by iteratively selecting the threshold, first selecting the median value of the image grayscale as the initial threshold, dividing the entire image into two parts, and then calculating the new threshold according to the following Equations (5) and (6):
After that, a new threshold is calculated with the following Equation (7), then the count is repeated until the requirements are met:
To make the image binary more accurate, the tiny holes can be filled, and the final segmentation image is shown in Figure 3.
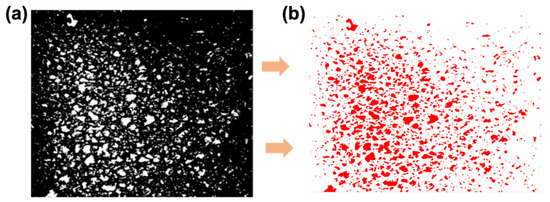
Figure 3.
The image processing (a) and the background separation diagram of PERS (b).
2.5. Wear Resistance Performance Test
The anti-abrasion performance of PERS is closely related to its surface texture structure. The anti-abrasion performance of PERS is tested using a wheel-type scattering instrument, and the surface texture of PERS is analyzed in depth using the above image processing techniques.
The anti-wear performance of the PERS mixture is tested by using a wheel-type mixture scattering meter. The contaminants on the formed and cured rut plate specimen are rinsed with water, wiped dry with a rag, and placed in the oven and adjusted to the temperature of 30 ± 5 °C after 2 h, when the temperature is naturally cooled, before the abrasion test begins. The load is 2000 N, the tire pressure is positioned at 200 kPa, the speed is set to 80 km/h, and the running time is 8 h.
In addition, the friction coefficient and structural depth are also two major indicators for evaluating the surface structure of the mixture. The friction coefficient can represent the microstructure state of the road surface, while the depth of the structure can evaluate the size of the macroscopic structure of the mixed material road surface. Therefore, this paper will compare and analyze the decay rule of texture construction features of PERS under different conditions by combining the three anti-wear performance testing methods mentioned above. The three indoor testing methods for PERS wear resistance are shown in Figure 4.
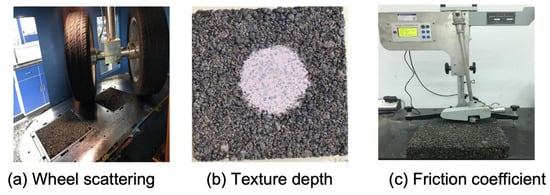
Figure 4.
Three types of abrasion tests for PERS.
The surface structure depth of the specimen is obtained by the known volume of the machine-made sand and the area of the paved circle. Due to a certain error in the sand laying method, in order to make the data accurate, the maximum and minimum values are removed after obtaining 10 sets of data, and then the average is taken.
The friction coefficient of the specimen before wear was measured by a pendulum friction instrument. Considering that different specimens will be affected by the indoor temperature difference after moulding, it is necessary to use the temperature coefficient to correct the friction coefficient and convert the BPNx (specimen temperature at x °C) into the BPN pendulum value at the standard temperature of 20 °C. The Equation (8) for correcting the temperature coefficient is as follows:
where BPN20 is the temperature correction value of the mixture specimen, and it was adopted according to Table 6.
Table 6.
The temperature correction value.
The Equation (9) for calculating the friction coefficient is as follows:
3. Results and Discussions
3.1. Analysis of Texture Structure Distribution of PERS
The texture structure distribution of PERS was analyzed by the Image J software. (1.52, Mac OS, 2025) Firstly, the PERS mixture specimen images collected by the camera were preprocessed, enhanced, and separated. It can be clearly seen that the PERS mixture specimen image was separated into black and white color regions by comparing the mixture specimens. In addition, the white area in the surface image of the PERS mixture is owing to the convex texture structure composed of the surface aggregate and other random textures, while the black area is the concave texture structure formed of the surface void and random textures. In terms of texture distribution and uniformity of the PERS mixture, the convex region corresponded to the concave region, and hence, the distribution of the surface can be characterized by analyzing the distribution of any region separately. To better perform statistical analysis of the data, the convex region of the texture structure in the image was selected for further exploration.
The area and number of convex areas can be summarized by the Image J software, and then the surface texture distribution of the PERS mixture can be characterized by the area, number, and area ratio of the convex areas within the effective diameter of each small area. To accurately analyze the texture structure distribution of PERS, the binarized specimen image can be operated using the Image J software. The contrast between the convex research object and the background in the image was processed, and the background separation of the PERS mixture is shown in Figure 5. Next, the analyze particles function in Image J can be used to capture the target object and obtain the specific quantity and area of the convex area, as shown in Figure 5b. After an area of the small convex region was obtained, the convex object image in different diameters can be analyzed by introducing the equivalent diameter. Meanwhile, to facilitate calculation, the convex region can be regarded as a circle, and the equivalent diameter can be calculated according to the diameter and the area of the circle, as shown in Equation (10):
where is the area of the number i small convex region, and is the equivalent diameter of the number i convex region.
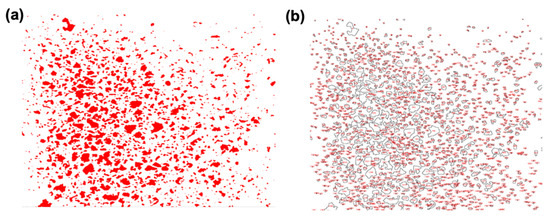
Figure 5.
The background separation diagram of PERS (a) and the number of convex areas (b) of the PERS mixture.
The distribution of convex particles in different diameters can be obtained. The change of convex particles after the subsequent abrasion test was compared to obtain the change law of the region, and the results are shown in Table 7.
Table 7.
The distribution of convex areas in the plane.
The equivalent diameter of the largest number of convex on the mixture specimen is mainly distributed in the range of 2–5 mm and 5–10 mm. The number of convexes in the whole particle size range shows a downward trend due to the presence of the convex area on the mixture surface, which is mainly composed of PU, aggregates, and rubber particles. The rubber particles have a certain resilience during the process of specimen moulding. In addition, the smoothness of the rubber particles is not as good as that of the stones, and hence, there is a significant correlation between the number of convex particles on the specimen and the content of the rubber particles of the PERS.
In the range of different equivalent diameters, the ratio of the total area and convex was basically coincident with the total area, which was relatively stable in the range of 2–5 mm, and the distribution was relatively uniform. After, it rose suddenly in the range of 10–15 mm and 10–15 mm, it is because the intercalation of large particle size stones and rubber particles in the PERS mixture was affected by the amount of PU. Therefore, the amount of PU adhesive is important for the total convex area and area ratio of the polyurethane mixture.
3.2. Analysis of Texture Structure Distribution of PERS for Different Abrasion Conditions
By processing the surface texture image of the mixture specimen under different wear conditions, the variation trend in the number area of convex particles was analyzed. Next, the PERS mixture specimens under different abrasion times were preprocessed, enhanced and segmented, respectively, and the results are shown in Figure 6.
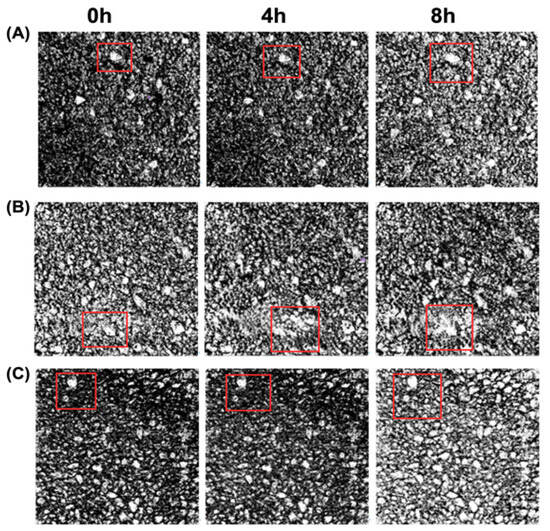
Figure 6.
The binary images (A–C) of the PERS mixture for different contents of waste rubber under different abrasion times.
As is well known, the number and area of the convex area would change after the mixture was worn at different times. To obtain the anti-abrasion performance of the PERS mixture for different working conditions, the Image J software was used to analyze the abrasion resistance of PERS mixtures with different additive amounts of rubber particle dosages after binary treatment. During the processing process, the scale bar needs to be calibrated, and the straight-line drawing tool on the Image J software is selected to draw a straight line on the specimen image. After obtaining the pixel value on the image, the scale bar is set according to the actual length of the specimen, the distribution of the convex region is shown in the Figure 7, and the variation in bump number and area under different wear conditions is shown in Table 8.
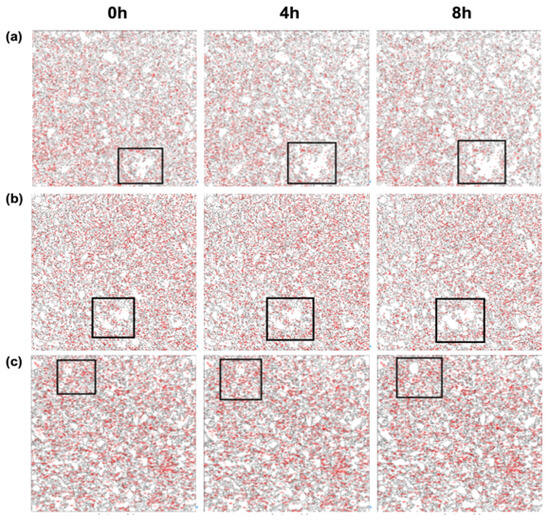
Figure 7.
The number of convex areas (a–c) of the PERS mixture for different contents of waste rubber under different abrasion times.
Table 8.
Changes in the convex area of PERS after different abrasion times.
There was a small difference in the number of convex particles between the mixture specimens with replaced rubber particles due to the incomplete mixing and forming process of the mixture specimens when the wear time was 0 h. The number of convex particles decreased with the abrasion time, and the sample of 4.3–0% shows the largest number of convex particles for different abrasion times. It is the result of the presence of stone, for which the anti-abrasion ability is better than that of the waste rubbers and can be used as aggregates to bear the abrasion effect. The introduction of rubber particles would cause the anti-abrasion performance of mixtures to decrease. The rubber particles would be squeezed to the surface of the specimen because of the tire rolling, and the intercalation effect would occur, then fall off. In addition, it can be concluded that the number of convex particles of the 4.3–20% sample significantly changed in all samples. In the early stage of abrasion, the polyurethane on the surface of the PERS mixture bears part of the abrasion effect for the raised aggregate, the thickness of the polyurethane and the wrapping range decreased, and the protective effect on the aggregate was obviously weakened as the time of abrasion increased.
For the change of area of convex particles, the convex area on the surface of the PERS mixture increased with the abrasion time and tire action times increasing, which was positively correlated with the amount of rubber particles for the abrasion time of 0 h. It is the result of the bonding effect between stone and polyurethane is stronger than the bonding effect between rubber particles and polyurethane. With the abrasion time increasing, the area of the convex area of the samples increased. When the abrasion time is 8 h (wheel action 143,520 times), the convex area of each rutting plate specimen increases. There was no significant change in the convex area for the 4.9–10% sample during the entire wear loading process, during a high oil stone ratio and no rubber particles. The convex areas of the 4.3–0% and 4.3–10% samples gradually show a consistent upward trend with the increase in abrasion time and the number of wheel actions. However, the growth trend of the convex area of 4.3–20% was the most obvious, indicating that the rubber particle content has a great impact on the change in the convex area of the mixture when the abrasion time and the number of wheel actions increased.
3.3. The Relationship Between Surface Texture Parameters and Anti-Wear of Mixtures
The structural depth of polyurethane mixtures with different rubber particles under different oil-to-stone ratios under different wear times, as shown in Table 9.
Table 9.
Structural depth of polyurethane mixtures.
When the oil-to-rock ratio is constant, the rubber particle content is positively correlated with the structural depth value. When the content of rubber particles is constant, the oil-to-stone ratio is also directly proportional to the structural depth value. After 8 h of wearing, the polyurethane film on the surface of the mixture is more worn than that of the early wear, that is, the structural depth of the 4.3–20% of PERS changed greatly. The 4.3–0% mixtures have little change in the structural depth before and after wearing due to the large bond strength between pure stone and polyurethane, and the wear resistance of stone compared with rubber particles.
The friction coefficient of PERS with different rubber particles under different oil-to-stone ratios, under different wear times, is shown in Table 10. When the oil-to-stone ratio is constant, the rubber particle content is directly proportional to the friction coefficient of the mixture specimen. When the rubber particles are dosed, the oil-to-stone ratio is inversely proportional to the friction coefficient.
Table 10.
Friction coefficient of polyurethane mixtures.
After 4 h of wearing, the content of rubber particles was large, and its wear resistance was worse than that of stone, resulting in a large change in its friction coefficient. After 8 h of wearing, 4.3–20% of the PERS specimens were further worn out due to the increase in wear time, and the adhesion between the aggregate and the polyurethane adhesive decreased, and the friction coefficient changed the most. The reason for the small friction changes before and after wear of the mixed specimens is that the polyurethane adhesive is large, and there are no rubber particles.
To further analyze the correlation between the surface texture and anti-abrasion performance of the PERS mixture, the gray entropy correlation method was introduced. First, the area of the regions within different equivalent diameters was calculated. It is the result that the total number of convex regions is the same as the total number of different equivalent diameter levels in the convex regions. In addition, there are significant grading effects on the total number of convex regions produced by different equivalent diameter sizes. To minimize the impact of this factor and better analyze the changes in the convex regions after different abrasion times, the total number of convex regions can be divided into five different equivalent diameter levels: 2–5 mm, 5–10 mm, 10–15 mm, 15–20 mm, and >20mm. The changes in the area and number of convex regions within different equivalent diameters of PERS with different content of rubber particles after different wear times are obtained as shown in Table 11, Table 12 and Table 13.
Table 11.
The convex region of PERS with 0% rubber particle content after different abrasion times.
Table 12.
The convex region of PERS with 10% rubber particle content after different abrasion times.
Table 13.
The convex region of PERS with 20% rubber particle content after different abrasion times.
Gray correlation entropy is used to analyze the relationship between surface texture parameters and the wear resistance of the mixture. The indices obtained by the anti-wear performance of PERS are as follows: the structural depth, total number of convexity, total area of convexity, number of convexity and convex area of the PERS mixture with wear of 0 h, 4 h, and 8 h under different oil-to-stone ratios and rubber particle content, the number of convexity, and the area of convexity in the diameter range of 2–5 mm, 5–10 mm, 10–15 mm, 15–20 mm, and greater than 20 mm. The gray entropy and gray entropy correlation degree of each comparison series are calculated, as shown in Table 14, .
Table 14.
The correlation between gray entropy and the gray entropy of each comparison sequence (Structural depth as reference sequence).
From the results, test indices are sorted with the gray correlation entropy of the tectonic depth, when the tectonic depth is used as the reference sequence in the order from largest to smallest of X4, X6, X3, X8, X5, X9, X7, X2, X12, X11, X10, and X1.
The indices obtained by the anti-wear related properties of PERS are as follows: the friction coefficient, total number of convexity, total area of convexity, 2–5 mm, 5–10 mm, 10–15 mm, 15–20 mm, and more than 20 mm diameter of the PERS mixture under different oil-to-stone ratios and rubber particle content are as follows: the friction coefficient is used as the reference sequence, and the other indicators are used as the comparison sequence.
The gray entropy and the gray entropy correlation degree of each comparison series were calculated, .
From the Table 15, it can be seen that the gray correlation entropy of the friction coefficient from largest to smallest is X4, X5, X2, X3, and X1 when the friction coefficient is used as the reference sequence. That is, when analyzing the relationship between the surface texture parameters, structural depth and friction coefficient of the PERS mixture, the correlation coefficient between the convex area of the aggregate in the range of 2–5 mm and the structural depth and friction coefficient of the mixture is the highest, and the anti-wear performance of the mixture can be evaluated by using the convex particle area of the equivalent diameter level of 2–5 mm.
Table 15.
The correlation between gray entropy and the gray entropy of each comparison sequence (Friction coefficient as reference sequence).
3.4. Effect of Aggregates on the Anti-Abasion Performance of PERS
The effect of different rubber particle content on anti-abrasion performance of the PERS mixtures can be expressed by the change range of convex particle area in the equivalent diameter range of 2–5 mm. The results are shown in Figure 8. Based on this, the anti-abrasion performance of the PERS mixtures under different conditions in the range of 2–5 mm equivalent diameter was analyzed. The variation trend in the convex area in equivalent diameters was analyzed under different abrasion times. The convex area of the surface of the PERS mixtures in different equivalent diameter ranges is different, and the convex area of the mixture specimens with different rubber particle contents mainly increases with the abrasion time. In addition, the convex area distribution in the equivalent diameter range of the convex area value in the range of 2–5 mm, 5–10 mm, and >20 mm equivalent diameter of each mixture specimen is relatively tight before being abraded, and the convex area value in the particle size range of 10–15 mm and 15–20 mm is the largest.
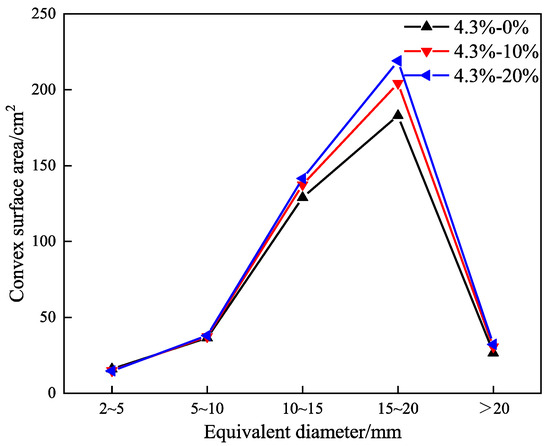
Figure 8.
The effect of different contents of waste rubbers on the anti–abrasion performance of the PERS mixture.
As is well known, the contact area with the tire is greater than the small particle size aggregate when the large particle size aggregate is abraded, and some aggregates with too small a particle size would be unidentified because of falling off or denting during the process of being abraded. Therefore, the convex area change value in the range of 10–15 mm equivalent diameter is the largest with the increase in wear time. However, the change of the convex area of some aggregates greater than 15 mm equivalent diameter range is smaller, because the aggregates in the larger particle size range are all stones, for which the abrasion resistance is better. In the range of 2–5 mm equivalent diameter, the convex area rate of all specimens was greater than 2.5%, and the area decreased with the increase in wear time. The change range of the convex area of 4.3–20% in the abrasion time of 0–4 h is significantly higher than that of the rest of the mixture, and the overall anti-abrasion performance fading range was higher. The change range of 4.3–0% and 4.3–10% convex area before and after abrasion was relatively steady; however, the change rate of 4.3–0% and 4.3–10% was more consistent with that of 0–4 h in the abrasion time of 4 h~8 h, and the anti-abrasion performance was more excellent.
4. Conclusions
In this work, the basic theoretical methods of digital image processing, including the basic types, collection, and preprocessing of images, were investigated. The anti-abrasion performance of PERS was analyzed by the abrasion tests and digital image processing under different contents of waste rubbers. The conclusions are as follows:
- (1)
- The structural depth and friction coefficient of the PERS mixture specimen under different wear times decreased with wear time. The structural depth is negatively correlated with the content of rubber particles, while the friction coefficient is positively correlated with the content of rubber particles.
- (2)
- The structure parameters of the surface texture and the friction coefficient of the structure depth of the mixture were analyzed by the gray entropy correlation method. It was found that the area of convex particles with a diameter of 2–5 mm was correlated with the structure depth of the mixture specimen under different wear times. The gray entropy correlation of the friction coefficient was the highest. The structure depth and friction coefficient of the PERS mixture before and after wear were evaluated by the convex particle area of 2–5 mm in diameter.
- (3)
- According to the change in amplitude of the convex particle area in the diameter range of 2–5 mm under different wear times, the content of waste rubbers of 10% showed the best anti-abrasion performance.
In summary, the influence of waste rubbers and polyurethane on the abrasion resistance of the PERS was concluded, and it is expected that this work can guide the material composition, design, and durability of PERS.
Author Contributions
Investigation, H.L.; Resources, J.G.; Writing—original draft, Y.L.; Writing—review & editing, T.G.; Funding acquisition, K.Z. All authors have read and agreed to the published version of the manuscript.
Funding
This paper is supported by special funded projects for the development of high-level and high-skilled talents and teams (No. 2024-04), Central Fundamental Scientific Research Funds (No. 2025-9003A) and Pilot Project of China’s Strength in Transportation for the Central Research Institute (No. QG2021-1-4-7).
Institutional Review Board Statement
Not applicable.
Informed Consent Statement
Not applicable.
Data Availability Statement
The original contributions presented in this study are included in the article. Further inquiries can be directed to the corresponding author.
Conflicts of Interest
Author Hongjin Liu was employed by the company China-Road Transportation Verification & Inspection Hi-Tech Co., Ltd. The remaining authors declare that the re-search was con-ducted in the absence of any commercial or financial relationships that could be construed as a potential conflict of interest.
References
- Mikhailenko, P.; Piao, Z.; Kakar, M.R.; Bueno, M.; Athari, S.; Pieren, R.; Heutschi, K.; Poulikakos, L. Low-Noise pavement technologies and evaluation techniques: A literature review. Int. J. Pavement Eng. 2020, 23, 1911–1934. [Google Scholar] [CrossRef]
- Münzel, T.; Sørensen, M.; Daiber, A. Transportation noise pollution and cardiovascular disease. Nat. Rev. Cardiol. 2021, 18, 619–636. [Google Scholar] [CrossRef]
- Wang, H.; Zhang, X.; Jiang, S. A Laboratory and Field Universal Estimation Method for Tire–Pavement Interaction Noise (TPIN) Based on 3D Image Technology. Sustainability 2022, 14, 12066. [Google Scholar] [CrossRef]
- Puccini, M.; Leandri, P.; Tasca, A.L.; Pistonesi, L.; Losa, M. Improving the Environmental Sustainability of Low Noise Pavements: Comparative Life Cycle Assessment of Reclaimed Asphalt and Crumb Rubber Based Warm Mix Technologies. Coatings 2019, 9, 343. [Google Scholar] [CrossRef]
- Seifeddine, K.; Amziane, S.; Toussaint, E. Experimental investigation of physical characteristics to improve the cooling effect of permeable pavements. Constr. Build. Mater. 2022, 345, 128342. [Google Scholar] [CrossRef]
- Lyu, L.; Dong, Y.; Zhao, D.; Wen, Y.; Li, R.; Ren, X.; Pei, J. Mechanical and Acoustic Properties Composition Design and Effects Analysis of Poroelastic Road Surface. J. Mater. Civil Eng. 2021, 33. [Google Scholar] [CrossRef]
- Luo, Y.; Han, S.; Wu, C.; Zheng, Y.; Men, C. Laboratory evaluation on performance of Polyurethane Porous Elastic Mixture. Constr. Build. Mater. 2023, 397, 132399. [Google Scholar] [CrossRef]
- Xu, Y.; Duan, M.; Li, Y.; Ji, J.; Xu, S. Durability Evaluation of Single-Component Polyurethane-Bonded Porous Mixtures. J. Mater. Civil Eng. 2021, 33, 04021170. [Google Scholar] [CrossRef]
- Zhong, K.; Luo, G.; Zhai, B.; Shi, G.; Sun, M. Deterioration of the Noise Reduction Performance of Polyurethane Porous Elastic Mixture under Void Clogging and Thermal-Oxidative Aging Conditions. J. Mater. Civil Eng. 2023, 35, 04023468. [Google Scholar] [CrossRef]
- Zhong, K.; Lu, Z.; Guo, Q.; Mu, R.; Sun, M.; Li, Y. Thermal decomposition kinetics and aging lifetime prediction of waste rubbers in porous elastic road surface. Constr. Build. Mater. 2024, 435, 136677. [Google Scholar] [CrossRef]
- Frigio, F.; Canestrari, F. Characterisation of warm recycled porous asphalt mixtures prepared with different WMA additives. Eur. J. Environ. Civ. Eng. 2018, 22, 82–98. [Google Scholar] [CrossRef]
- Frigio, F.; Stimilli, A.; Virgili, A.; Canestrari, F. Performance Assessment of Plant-Produced Warm Recycled Mixtures for Open-Graded Wearing Courses. Transp. Res. Rec. 2017, 2633, 16–24. [Google Scholar] [CrossRef]
- Liao, G.; Wang, H.; Xiong, J.; Chen, J.; Qi, K. Mechanical Properties of Poroelastic Road Surface with Different Material Compositions. J. Mater. Civil Eng. 2020, 32, 04020253. [Google Scholar] [CrossRef]
- Ejsmont, J.; Goubert, L.; Ronowski, G.; Świeczko-Żurek, B. Ultra Low Noise Poroelastic Road Surfaces. Coatings 2016, 6, 18. [Google Scholar] [CrossRef]
- Liao, G.; Wang, H.; Zhu, H.; Sun, P.; Chen, H. Shear Strength between Poroelastic Road Surface and Sublayer with Different Bonding Agents. J. Mater. Civil Eng. 2018, 30. [Google Scholar] [CrossRef]
- Tao, C.; Yan, Q.; Li, Y. Hierarchical Shared Control of Cane-Type Walking-Aid Robot. J. Healthc. Eng. 2017, 2017, 8932938. [Google Scholar] [CrossRef]
- Zhong, K.; Shao, C.; Sun, M.; Tian, X. Evaluation of the Attenuation Mechanism of the Noise Reduction Performance of Polyurethane Porous Elastic Road Surface. Constr. Build. Mater. 2024, 448, 138247. [Google Scholar] [CrossRef]
- Zhao, G.; Liu, Y.; Wu, X.; Yan, Z.; Lv, X. Dynamic response of vehicle–road coupling with initial defects in asphalt pavements by discrete element method. Int. J. Solids Struct. 2025, 323, 113617. [Google Scholar] [CrossRef]
- Shi, X.; Cai, C.S. Simulation of dynamic effects of vehicle on pavement using a 3D interaction model. J. Transp. Eng. 2017, 135, 736–744. [Google Scholar] [CrossRef]
- Baghel, R.S.; Kasu, S.R.; Chandrappa, A.K. Effect of dual and new generation wide-base tire assembly on inverted pavements. J. Road Eng. 2022, 2, 124–136. [Google Scholar] [CrossRef]
- Li, X.; Lv, X.; Zhou, Y.; You, Z.; Chen, Y.; Cui, Z.; Diab, A. Homogeneity evaluation of hot in-place recycling asphalt mixture using digital image processing technique. J. Clean. Prod. 2020, 258, 120524. [Google Scholar] [CrossRef]
- Gong, X.; Jiang, Y.; Ou, S.; Qian, G.; Liu, Z. Characterization on the mesostructural distribution of asphalt mixtures via digital image processing and relation to macroscopic performances. Constr. Build. Mater. 2023, 404, 133212. [Google Scholar] [CrossRef]
- Ren, Z.; Tan, Y.; Xing, C.; Zhang, L.; Huang, L.; Meng, A.; Liu, X. Heterogeneity detection of void structure in discrete particle assemblies: Case-based analysis on asphalt mixtures utilizing digital image processing. Powder Technol. 2026, 469, 121738. [Google Scholar] [CrossRef]
- Hatt, M.; Laurent, B.; Ouahabi, A.; Fayad, H.; Tan, S.; Li, L.; Lu, W.; Jaouen, V.; Tauber, C.; Czakon, J.; et al. The first MICCAI challenge on PET tumor segmentation. Med. Image Anal. 2018, 44, 177–195. [Google Scholar] [CrossRef]
- JTG/T 3350-03-2020; Technical Specifications for Design and Construction of Porous Asphalt Pavement. Ministry of Transport of the People’s Republic of China: Beijing, China, 2020.
- Shi, L.; Guo, H.; Zeng, G.; Zhou, R.; Li, X.; Lin, B.; Liang, H. Key parameters and effects in image processing and aggregate–aggregate contact calculation of asphalt mixtures. Measurement 2025, 239, 115439. [Google Scholar] [CrossRef]
- JTG 3410-2025; Standard Test Methods of Asphalt and Asphalt Mixture for Highway Engineering. Ministry of Transport of the People’s Republic of China: Beijing, China, 2025.
- Cong, L.; Shi, J.; Wang, T.; Yang, F.; Zhu, T. A method to evaluate the segregation of compacted asphalt pavement by processing the images of paved asphalt mixture. Constr. Build. Mater. 2019, 224, 622–629. [Google Scholar] [CrossRef]
- Li, Z.; Yin, C.; Zhang, X. Crack Segmentation Extraction and Parameter Calculation of Asphalt Pavement Based on Image Processing. Sensors 2023, 23, 9161. [Google Scholar] [CrossRef]
- Wan, T.; Wang, H.; Feng, P.; Diab, A. Concave distribution characterization of asphalt pavement surface segregation using smartphone and image processing based techniques. Constr. Build. Mater. 2021, 301, 124111. [Google Scholar] [CrossRef]
- Fang, H.; He, N. Detection Method of Cracks in Expressway Asphalt Pavement Based on Digital Image Processing Technology. Appl. Sci. 2023, 13, 12270. [Google Scholar] [CrossRef]
- Alawneh, M.; Soliman, H. Using Imaging Techniques to Analyze the Microstructure of Asphalt Concrete Mixtures: Literature Review. Appl. Sci. 2023, 13, 7813. [Google Scholar] [CrossRef]
- Liao, W.; Liang, B.; Hu, M.; Liu, Z.; Zheng, J. Digital imaging technology-assisted water-sensitivity assessment of asphalt mixtures: A comprehensive review. Measurement 2025, 242, 115871. [Google Scholar] [CrossRef]
Disclaimer/Publisher’s Note: The statements, opinions and data contained in all publications are solely those of the individual author(s) and contributor(s) and not of MDPI and/or the editor(s). MDPI and/or the editor(s) disclaim responsibility for any injury to people or property resulting from any ideas, methods, instructions or products referred to in the content. |
© 2026 by the authors. Licensee MDPI, Basel, Switzerland. This article is an open access article distributed under the terms and conditions of the Creative Commons Attribution (CC BY) license.