Abstract
The indoor low-voltage power line network is characterized by highly irregular interferences, where background noise coexists with bursty impulsive noise originating from household appliances and switching events. Traditional noise models, which are considered monofractal models, often fail to reproduce the clustering, intermittency, and long-range dependence seen in measurement data. In this paper, a Multifractal Random Walk (MRW) framework tailored for Power Line Communication (PLC) noise modelling is developed. MRW is a continuous time limit process based on discrete-time random walks with stochastic log-normal variance. As such, the formulated MRW framework introduces a stochastic volatility component that modulates Gaussian increments, thus generating heavy-tailed statistics and multifractal scaling laws which are consistent with the measured PLC noise data. Empirical validation is carried out through structure function analysis and covariance of log-amplitudes, both of which reveal scaling characteristics that align well with MRW-simulated predictions. This proposed model captures both the bursty nature and correlation structure of impulsive PLC noise more effectively as compared to the conventional monofractal approaches, thereby providing a mathematically grounded framework for accurate noise generation and the robust system-level performance evaluation of PLC networks.
1. Introduction
Analysis of complex systems such as Power Line Communication (PLC) systems can be made easier if a suitable analogy that is more tractable and offers new insights into the behaviour of the measured data can be determined. Bursty impulsive PLC noise can be seen as a turbulent flow through the indoor low-voltage network. The hierarchy of the PLC network at different levels, besides the geographical and topological complexity of the indoor low-voltage network, plays an important role in the statistical scaling properties displayed by bursty impulsive noise traffic. In addition, narrowband interferences from within and outside the power line network and radio broadcast stations operating within the same frequency band, as established in [1,2,3], also contribute to the complex nature of the PLC network. The indoor low-voltage network topology is time-variant and thus requires dynamic readjustments in resource sharing and management. Since the size of the low-voltage power line distribution and connectivity increases annually, internet connectivity and service provision have shifted not only to teleconferencing and multimedia applications but also to services based on real-time data (audio, video), among other broadband telecommunication services. Unfortunately, the ever-present bursty impulsive noise traffic in the indoor low-voltage networks renders the PLC network into a complex entity whose understanding is critical to the smooth operation and management of the network. Therefore, the major problem in PLC noise modelling is to effectively and economically simulate practical bursty impulsive PLC noise traffic.
Previously, in [4], refinements to classical impulsive noise models tailored for indoor narrowband PLC focusing on more accurate amplitude distributions and burst durations were proposed. The work improved the practicality for narrowband PLC systems. However, the models remained within the paradigm of memoryless or short-memory impulsive noise models and did not capture the long-range correlations and scaling behaviour in PLC noise. Refined statistical models for indoor PLC impulsive noise incorporating more realistic amplitude distributions and temporal bursting behaviour are explored in [5]. The focus in this work is on distributional and short-term burst models; however, they do not deal with generative stochastic frameworks that handle long-memory and scale-invariance characteristics present in PLC noise. Recently, in [6], a multi-feature space domain fusion neural network was proposed to mitigate impulsive noise in PLC channels by learning discriminative features that attenuate bursts while preserving useful signals. Even though this approach was effective for practical denoising, it remains a data-driven and reactive approach that fails to consider the multifractal scaling and stochastic generative aspects of PLC noise. A broad survey of noise sources, models, and suppression techniques in PLC-based energy networks, ranging from classical statistical models to adaptive and learning-based methods, is provided in [7]. Even though this work covers a range of deterministic, statistical, and adaptive mitigation approaches ranging from the traditional impulsive noise models to current machine-learning filters, it fails to capture the multifractal scaling behaviour of PLC noise. While all these approaches are comprehensive, they fail to consider the multifractal scaling and stochastic generative aspects of MRW-based frameworks, rendering them useful as contextual references but lacking in stochastic generative aspects that are relevant for the modelling of bursty impulsive PLC noise.
Impulsive noise has been observed to be scale-invariant and time-varying due to power supplies and switching transients in the power line network, in works such as [8,9,10], among others. The phenomenon of scale invariance in noise traffic expresses itself as increased burstiness. From a performance analysis persepective of PLC networks, this is crucial, as increased burstiness leads to lower resource utilization. Hence, the quality of service parameters that include available bandwidth, data transfer delay and loss probability of the system are adversely affected. As such, the time scales that are of interest in PLC networks are of short variance, from a few microseconds, since there exists a wide spectrum of properties in different time scales. For example, at large time scales, there exists self-similarity, as established in [11], while at a medium time scale, approximate periodicity is present, as established in [12,13,14]. More importantly, it was observed that at small time scales, surprisingly multifractal phenomena are evident. Even though the multifractal structure of PLC noise and its impacts on PLC systems are not yet well covered in the literature, multifractal approaches are suited to explain such scaling behaviour. Studies on this scaling behaviour in PLC noise and signals consistently point to the presence of multifractality and Long-Range Dependence (LRD). Empirical results presented in [15] confirmed the existence of multifractal scaling in PLC noise traffic besides characterizing the burstiness present in PLC network traffic. This involved using Multifractal Detrended Fluctuation Analysis (MF-DFA) and Multifractal Detrending Moving Average analysis (MF-DMA), showing that correlations rather than heavy-tailed amplitudes drive the observed multifractality, particularly in the 0.1–10 MHz frequency band. In a similar effort, the researchers in [16] confirmed that broadband PLC signals display both fractal and multifractal behaviours, with scaling properties varying across different frequency bands and modulation schemes. These studies established the fundamentally non-Gaussian and multiscaling nature of PLC noise, showing the limitations of monofractal Gaussian and memoryless impulsive noise approaches while providing empirical evidence for multifractal stochastic frameworks such as the Multifractal Random Walk (MRW). However, both works remained largely descriptive in their results, rather than generative, providing very important evidence of scaling behaviour but not explicitly linking their empirical results to stochastic model parameters or system-level performance metrics. Earlier attempts were made to define a MRW process using fractional Gaussian noise in [17]. In this paper, only the case of Gaussian white noise is addressed by defining a stochastic process, which is not a strictly an increasing process. This will involve building such a process by simply subordinating a Brownian motion as given in [18], which is widely used to build multifractal processes. This subordination of a Brownian process with an increasing process was introduced by [19] and has been the subject of extensive research in mathematical finance.
The research design proposed herein is driven by the need to accurately characterize the complex statistical behaviour of impulsive PLC noise, which is known to exhibit heavy-tailed fluctuations, intermittent energy bursts, and long-range dependence caused by various household electrical loads and switching devices. Conventional monofractal noise models that include Gaussian- and Middleton-based formulations do not reproduce these multiscale features adequately. As such, this work adopts an MRW framework to address this gap, which provides a mathematically grounded framework for modelling impulsive noise burstiness through a log-normal stochastic volatility process superimposed on Gaussian increments. This research design follows a structured approach that ensures that the proposed MRW is both theoretically appropriate and empirically justified, respectively. Firstly, the measured PLC noise measurements are preprocessed to obtain stationary increments that are suitable for multifractal analysis. Secondly, a set of diagnostic tools that include probability density functions (PDFs), increment histograms, structure functions, power spectral densities (PSDs), and the covariance of log-amplitudes are applied to the measured data to reveal the scaling behaviour, intermittency, and correlation structures that motivate the selection of MRW as an appropriate model. Thirdly, the main MRW parameters, which include the Hurst exponent, the intermittency coefficient, and the integral scale, are estimated from acquired noise data directly. These data-driven parameters are then used to generate simulated MRW sequences that replicate the temporal behaviour of impulsive PLC noise. Lastly, the simulated MRW sequences are compared with the measured noise data quantitatively through similar multiscale diagnostics, thus allowing a consistent and transparent validation of the model. This proposed research design ensures that the proposed MRW framework is rigorously anchored in experimental evidence and analysed across the full range of appropriate and relevant statistical properties. By aligning the modelling strategy with both the physical characteristics of PLC channels and the mathematical structure of multifractal processes, this work aims to show that MRW provides a robust, scalable, and system-relevant framework for the characterization and generation of bursty impulsive PLC noise. This study introduces an MRW framework for the first time in PLC research which is capable of reproducing the heavy tails, intermittency, and long-range correlations behaviour present in indoor PLC noise. In contrast to conventional monofractal and impulsive noise-only models, the proposed MRW model provides a combined stochastic structure in which Gaussian increments are modulated by a log-normal volatility process, thus enabling the generation of realistic impulsive noise bursts that develop across multiple time scales. The contribution of this includes a full experimental characterization of measured PLC noise through structure functions, PSDs, and log-amplitude covariance. Secondly, a data-driven strategy is proposed for estimating MRW parameters from measurements directly. Thirdly, a validated multifractal noise generator whose statistical evidence is appropriately equal to the real PLC noise is put forward, thus providing a mathematically grounded and practically deployable model for system-level PLC performance evaluation.
This paper is organized into five sections, as follows: Section 2 presents preliminaries on multifractal processes and the derivation of the MRW that will be required for bursty impulsive noise. The experimental procedure used for the data collection and processing of measurements in the frequency range of 1–30 MHz is provided in Section 3. In Section 4, the results and discussion are presented. Lastly, the paper ends with concluding remarks in Section 5.
2. Multifractal Random Walk for Bursty Impulsive PLC Noise
Herein, Multifractal Random Walk (MRW), defined as a stochastic integral of an infinitely divisible noise with respect to a dependent fractional Brownian motion (fBm), is introduced. Let define a Brownian motion while is a Gaussian noise process developed with a logarithmic correlation. Then, the subordinated MRW process is defined by the stochastic integral [17,18,20,21],
where is a slowly varying multiplicative cascade process that modulates the local Gaussian increments . In the case of PLC bursty impulsive noise, this models amplitude bursts through together with fast zero-mean fluctuations through . The multifractal model in (1) is able to capture scaling and volatility clustering or long-range dependence properties observed on the measurement data. Since is a Gaussian noise process, its statistical specification can be defined through its covariance for two different times separated by lag , as in [17,18,20,21],
where defines the intermittency parameter that control the multifractal strength, is the correlation (integral) scale of the cascade beyond which correlations vanish, and is a small regularization that will be sent to zero in asymptotics. This logarithmic covariance in (2) is the crucial ingredient that yields exact or log-normal multifractal scaling.
2.1. Increments and the Small-Scale Approximation
In MRW, increments are the carriers of multifractality. This corresponds to short observation windows where strong impulsive noise events dominate and are non-Gaussian. The small-scale approximation, on the other hand, provides explanations as to why PLC noise looks bursty and heavy-tailed at microsecond scales, but smoother at longer aggregation scales. This means that at small scales, they show heavy-tailed distributions, non-linear scaling exponents, and intermittent bursts, which are features observed in PLC impulsive noise. The MRW increment at scale is modelled as [17,18,20,21],
such that when is smaller than the volatility correlation scale , then varies slowly over . For small , the volatility inside the interval is well-approximated by its value at the local average, as in [17,18,20,21],
where, is Brownian motion characterized with mean zero and variance proportional to the time step . This approximation in (4) is the “adiabatic” approximation employed in the MRW derivation, showing the volatility levels with respect to the fast Gaussian fluctuations.
2.2. q-th Order Structure Functions and Scaling Law
To link the MRW theory to the measured PLC noise data, the q-th order structure functions which are at the heart of multifractal analysis are used. The q-th order structure function is defined as the q-th absolute moment of increments [17,18,20,21]:
Under the slow volatility approximation, (5) becomes
since is taken independently of the fast increment in the first approximation. In addition, for Brownian increments, . Consequently, the dependence becomes
This scale dependence of , induced by the log-correlated variance of , is required since is Gaussian with variance that depends on the small cut off. This cut off is found after a regularization parameter in a continuous range and multiplicative decomposition, showing that the moments at scale behave as a power law in . As shown in [17,18], the MRW model results in an asymptotic scaling, given as
where is the multifractal spectrum defined by the generalized Parabolic law [17,18,20,21],
for general roughness H that replaces with increments of a fBm if desired. The classical MRW uses ; otherwise, a flexible MRW form is used if the empirical small-scale monofractal roughness is . This parameter H is very useful in PLC noise modelling, since the raw impulsive noise data often shows temporal clustering and memory characteristics due to the repetitive switching events and electrical devices’ activities. By tuning H, the MRW model aligns its correlation structure with such physical characteristics, thus enabling the simulated noise to replicate the smoothness, burstiness, and long-range dependence seen in measurement data. As such, H functions as a fundamental scaling parameter that directly connects the MRW formulation to the empirical behaviour of PLC noise. In monofractal signals, all structure functions scale with a single exponent, giving a linear relation . This results in parallel log–log plots for different q. In contrast, multifractal processes such as MRW display a non-linear, concave graph due to intermittency. This means that higher-order moments grow more slowly with scale, and the deviations from linear scaling clearly distinguish multifractal PLC noise from classical monofractal behaviour. Through Legendre transform, (9) can also be described using the multifractal spectrum function and the singularity strength function as [15,17,20],
2.3. Covariance of Log-Amplitudes (Empirical Testable Relation)
In [11], it was established that PLC impulsive noise possessed long-range correlations in energy. As such, to capture these correlations beyond variance-only models, the covariance of log-amplitudes is used. For the MRW model, the log-amplitude of increments at scale is defined as [17,18,20,21]:
where, . Therefore, the MRW prediction for two different points with lags l with is given by [17,18,20,21],
The covariance in (12) is asymptotically logarithmic in the lag and is an empirically testable relation that allows for the estimation of intermittency and correlation scales. In addition, it is widely used to estimate and from measured data. In PLC bursty impulsive noise, this characteristic is very important due to its ability to quantify long-range correlations and the clustering of noise bursts, thus improving realism in PLC noise modelling beyond conventional and monofractal approaches.
3. Experimental Procedure
To capture the bursty impulsive PLC noise in the frequency range of 1–30 MHz, a custom monitoring arrangement was devised within four typical low-voltage indoor electrical environments that included a postgraduate office, an electronics lab, a computer lab and an isolated apartment. These environments contained varied electrical loads (see detailed description in [12,22]) that have been confirmed in [8,9,23,24,25,26,27] to contain thermostats, switched mode power supplies and other switching devices that inject impulsive noise into the power line network. The setup is as shown in Figure 1, and consisted of a coupling interface inserted between the mains outlet and the measuring instruments, thus ensuring galvanic isolation while preserving the broadband characteristics of the channel. Noise signals were acquired using a Rigol DS2202A Digital Storage Oscilloscope (DSO), allowing simultaneous coverage of both background and impulsive disturbances. The DSO was set to sample at 1 Giga-samples per second, resulting in a -s window length (14 mains cycles). This sampling rate resulted in a window length with high temporal resolution that ensured accurate capturing of fast impulsive noise events. Figure 2 shows the time series plots for each environment, showing the varying levels of amplitude, frequency of impulses, and burst patterns. Care was taken to log measurements during varying indoor activity periods across the different environments in order to record both steady interference and burst-type impulsive events associated with appliance switching. Acquired noise measurements were stored in time-stamped segments with sufficient resolution to enable subsequent multifractal and statistical analysis. This approach resulted in a dataset that reflected the temporal irregularities, spectral spread, and burst clustering which are typical of PLC noise in indoor low-voltage networks.
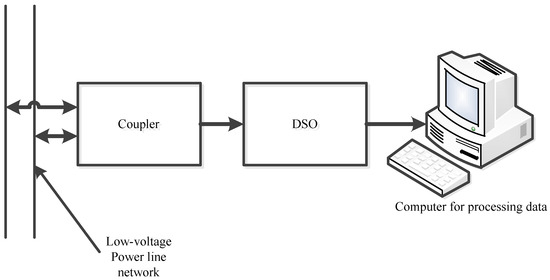
Figure 1.
Experimental set-up for PLC noise measurements.
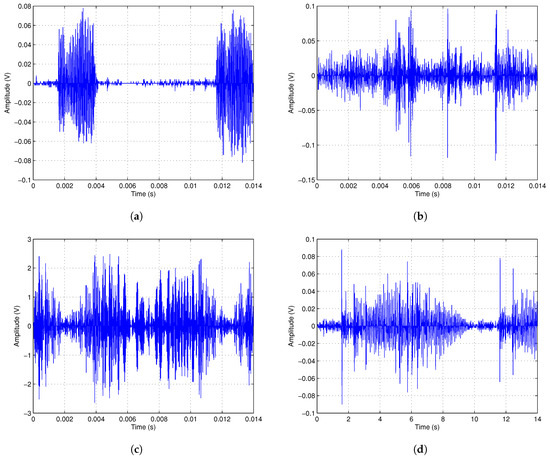
Figure 2.
Power line noise measurements from (a) Apartment. (b) Computer Lab. (c) Electronics Lab. (d) Postgraduate office.
These series plots represent PLC noise captured from four different indoor venues and demonstrate the intrinsic variability of impulsive PLC noise across real environments. The measured noise signals naturally differ in amplitude patterns, burst density, and background fluctuations due to the existence of different electrical loads, switching activities, and appliances at each venue. By presenting these four representative measurements, a key motivation for this study is highlighted: PLC noise does not exhibit a single universal shape, and as such cannot be accurately modelled by simple monofractal and stationary Gaussian approaches. However, its variability is driven by burstiness, intermittency, and heterogeneous temporal structure, all of which are characteristics that the proposed MRW model is designed to capture. As such, Figure 2 establishes the empirical basis for adopting a multifractal modelling framework.
4. Results and Discussion
In this section, the statistical and multifractal characterization of the measurement dataset and its comparison with the MRW model are presented. This validation is based on several complementary statistical diagnostics that are presented in the manuscript. These include histograms/PDFs, tail behaviour, ACF and covariance of log-amplitudes, PSD analysis, structure–function scaling and multifractal spectrum. Each of these captures a different aspect of impulsive PLC noise, including distributional shape, intermittency, memory, and multifractality. Considered together, these results provide a complete and rigorous experimental validation of the model, demonstrating that MRW captures all key empirical behaviours of measured PLC noise.
It can be observed from Figure 3 that the measured PLC noise histograms have sharp narrow peaks at the central regions and long tails, a characteristic of strong impulsive noise behaviour. These histograms of PLC noise increments show sharp central peaks with long heavy tails, confirming non-Gaussian impulsive fluctuations typical of indoor low-voltage networks. The sharp narrow peaks at the central regions show the domination of small fluctuations most of the time, while the long tails confirm the existence of large and rare bursty impulsive noise events typical of bursty PLC noise. The tails can also be observed to deviate from exponential decay significantly, signifying intermittent energy bursts across multiple scales.
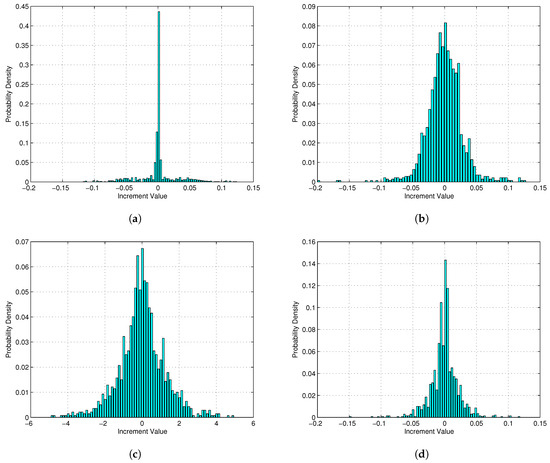
Figure 3.
Histogram of increment distributions for (a) Apartment. (b) Computer Lab. (c) Electronics Lab. (d) Postgraduate office.
The MRW-simulated distribution in Figure 4 approximates this behaviour, although with lower peak magnitude. This alignment demonstrates that the MRW model effectively captures the scaling and intermittency structure of the PLC noise increments. In addition, the heavy-tailed distributions further show that bursty impulsive PLC noise cannot be adequately described by single-scale random models, but instead follows a multifractal cascade process characterized by large fluctuations that emerge from the non-linear amplification of smaller ones. The tail view (semi-log) of the PDFs also shows a clearer view of the tail behaviour of the measured PLC noise increments. The measured data shows a slowly decaying, nearly linear trend in the tails, confirming the existence of heavy-tailed statistics and a high probability of large bursty impulsive noise events. In addition, this confirms the dominance of high-energy bursts in the noise distribution. The MRW-simulated PDF is comparable but has slightly smoother decay, consistent with a stretched multifractal tail. This characteristic validates the ability of the MRW model to reproduce the scale-invariant intermittency and long-tailed amplitude statistics present in real PLC noise networks.
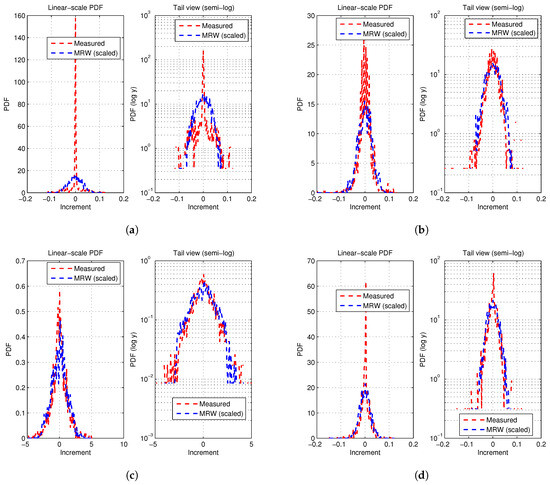
Figure 4.
Simulated vs. measured PDF plots for (a) Apartment. (b) Computer Lab. (c) Electronics Lab. (d) Postgraduate office.
Figure 5 shows the plotted ACF of increments and squared increments with confidence bounds for the various venues. The ACF of increments provides a measure of the correlation of the raw amplitude changes over time, while the ACF of squared increments shows the energy or volatility in the noise (since squaring highlights large amplitudes). It allows for the detection of dependence in the intensity of fluctuations rather than their sign or direction. It can be observed that the ACF of increments tends sharply to zero after Lag 0 or within very few lags. This reveals weak or no linear correlation, meaning that the bursty impulsive noise events themselves are nearly uncorrelated in time. Moreover, this indicates that successive noise samples fluctuate independently, typical of bursty impulsive noise processes. In the ACF of squared increments, the correlation exhibits a slow decay or oscillating trend, often following a power law or long-memory behaviour, a signature of multifractality. This means that clusters of high-energy impulses tend to display volatility clustering or intermittency as they appear together. Such behaviour corresponds to bursts of impulsive interference separated by quieter intervals, common in PLC and electromagnetic environments.
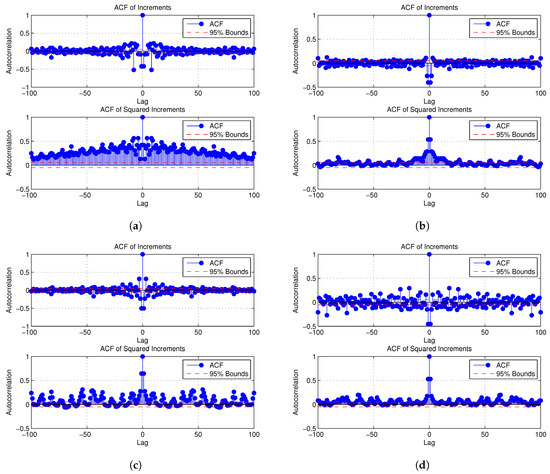
Figure 5.
ACF of increments and squared increments with confidence bounds: (a) Apartment. (b) Computer Lab. (c) Electronics Lab. (d) Postgraduate office.
The Power Spectral Density (PSD) analysis results presented in Figure 6 provide a frequency-domain characterization of the temporal variability and scaling properties of the bursty impulsive PLC noise. In this work, both the measured and MRW-simulated PSDs share comparable spectral trends, indicating that the MRW model effectively captures the main frequency-dependent characteristics of the noise process. The measured PSD maintains an average power level of approximately , while the MRW PSD averages around . Even though lower amplitudes can be observed on the simulated spectrums, both curves show similar decay and flattening patterns across the frequency range, confirming that the MRW preserves the scaling characteristics of the measured data, though with a slight underestimation of power. This can be attributed to its log-normal structure, which smoothens out the strong impulsive noise components present in real PLC environments. This variance implies that the measured noise contains higher-energy events and burst-like disturbances that are not fully modelled by MRW.
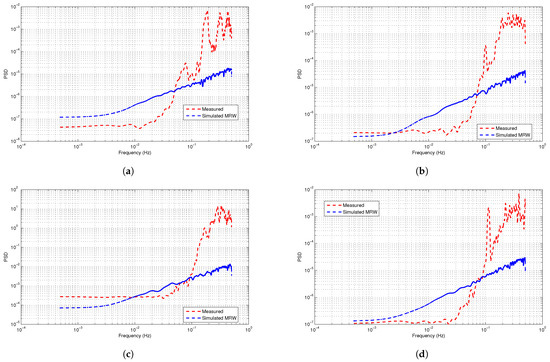
Figure 6.
PSD of simulated vs. measured noise for (a) Apartment. (b) Computer Lab. (c) Electronics Lab. (d) Postgraduate office.
The scaling behaviour of the measured and MRW-simulated PLC noise signals was analysed through the q-th order structure functions , from which the corresponding scaling exponents were extracted using linear regression in the log–log space. Even though the log–log plots are not presented here, clear linearity was observed over the scaling range, confirming the existence of a power-law dependence between and the scale parameter . The extracted scaling exponents are as shown in Table 1, where the exponent values are positive and non-uniform, indicating that the bursty impulsive PLC noise exhibits multifractal scaling that reflects the coexistence of both small- and large-scale fluctuations within the noise. In addition, the non-linearity of with respect to q further supports the intermittent and scale-dependent energy distribution which is typical of bursty impulsive noise, where captures the average magnitude of increments and relates to variance or energy scaling, while and capture the increasing extreme fluctuations present in the data. These extracted scale exponents confirm that PLC noise is not monofractal but exhibits multifractal behaviour, with scaling signatures that reflect both correlated background fluctuations and sporadic impulsive bursts. In addition, the extracted positive values of further imply persistent correlations across scales, confirming the suitability of the MRW model in reproducing the observed scaling dynamics of measured PLC noise.

Table 1.
Extracted Scaling Exponents.
Figure 7 shows the q-th order structure functions for , , and for the various venues under study. These structure functions can be observed to be “zig-zag” in shape. This “zig-zag” is a fingerprint of non-uniform scaling due to bursty impulsive noise events, besides confirming the presence of intermittency, which is not purely Gaussian. In PLC noise, impulsive bursts dominate the high-order structure functions, which leads to irregularities since the scaling law breaks for extreme values. Such an irregularity shows that the noise is non-stationary and is also evidence of multifractality but also of finite sampling and impulsiveness. In addition, it can also be seen that still shows an overall non-linear increasing trend despite local fluctuations, confirming the validity of the multifractal scaling. The q-th order structure functions of the noise increments exhibited a distinct power-law behaviour across the several temporal scales confirming the presence of scale-invariant dynamics as presented in Table 1. The non-linear dependence of on q shows a multifractal structure within the bursty impulsive PLC noise, consistent with intermittent processes described by the MRW model. Such characteristics suggest that bursty impulsive PLC noise events exhibit hierarchical energy formation, with larger fluctuations dominating the scaling structure.
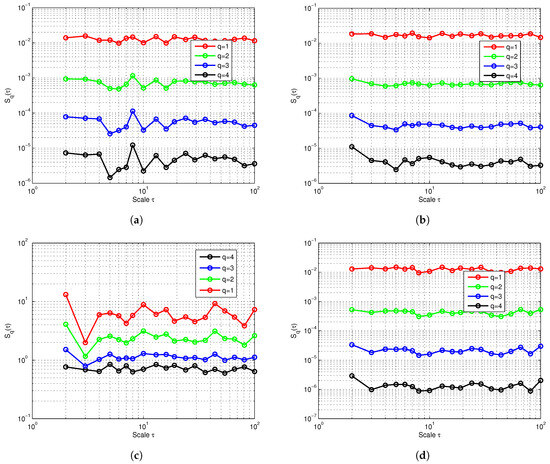
Figure 7.
q-th order structure functions for (a) Apartment. (b) Computer Lab. (c) Electronics Lab. (d) Postgraduate office.
To validate the underlying multifractal cascade assumption and quantify the long-range correlations and clustering of noise bursts, the covariance of log-amplitudes was used. This provides a measure of how fluctuations in the measured noise magnitudes remain correlated across the different time lags, exhibiting long-range dependence in the intermittency of the PLC noise. From Figure 8, the smoothed measured data shows a gradual decay in covariance with increasing lag, indicating that PLC noise retains memory across several scales before decorrelating. This behaviour is typical of bursty impulsive noise with intermittent structure rather than pure white noise. The smoothing is undertaken before determining the covariance of log-amplitudes to reduce the effect of high-frequency oscillations or spurious spikes that can distort covariance estimates. The MRW-simulated covariance shows similar decay profiles that match the overall trend of the measured data. This confirms that the MRW model captured the scale-dependent correlations present in the PLC noise successfully. Even though slight amplitude mismatches can be observed, the agreement in the general shape and rate of decay validates the multifractal hypothesis. This means that the noise amplitudes evolve as a cascade process with persistent but diminishing correlations over time. The theoretical MRW covariance curve provides an upper envelope consistent with both the measured and simulated trends, further confirming that the measured PLC noise possesses multifractal intermittency and long-term memory characteristics which the MRW framework effectively models.
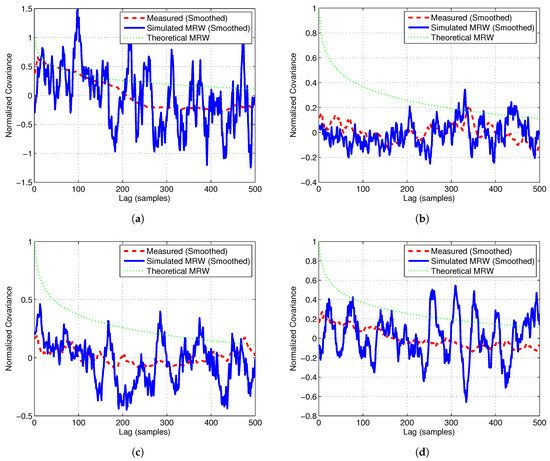
Figure 8.
Covariance of log-amplitudes: simulated vs. measured for (a) Apartment. (b) Computer Lab. (c) Electronics Lab. (d) Postgraduate office.
The scaling exponents derived from the structure function analysis form the foundation of the multifractal spectrum through (9). In this context, the curvature and spread of gives a more detailed characterization of the scaling irregularities inferred from . The multifractal spectrum of the measured vs. MRW model is shown in Figure 9. It can be observed that the curve of the bursty PLC impulsive noise resembles the concave parabolic shape of the MRW model. This confirms multifractality and intermittency in the noise bursts. The width of the curve shows how heterogeneous the scaling behaviour in the data is, while the height and symmetry around reflect the dominance of certain scaling features that include impulsive vs. background noise, as well as indicating the most probable singularity.
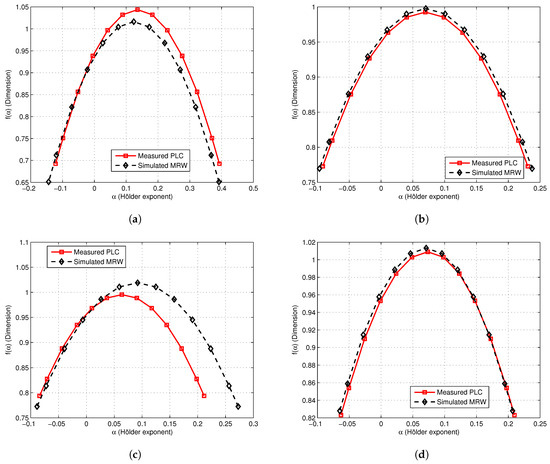
Figure 9.
Multifractal spectrum: measured vs. MRW for (a) Apartment. (b) Computer Lab. (c) Electronics Lab. (d) Postgraduate office.
The Q-Q plots shown in Figure 10 compare the quantiles of the measured PLC data shown in bue dashed lines against the simulated MRW data shown in red dashed lines. This comparison yielded an , , , and for the apartment, computer lab, postgraduate office, and the electronics lab, respectively. This indicates a moderate correspondence between the two distributions in the apartment data, while a strong correspondence between the two distributions can be observed in the other venues. These results suggest that the MRW model effectively captures the scaling behaviour and central statistical features of the measured bursty, impulsive PLC noise. However, the slight deviation from perfect linearity reflects a mismatch in the extreme quantiles. Such deviations are common in PLC environments, where impulsive bursts introduce heavier tails and imply that the MRW does not fully reproduce the rare extreme tails of impulsive bursts present in real PLC environments.
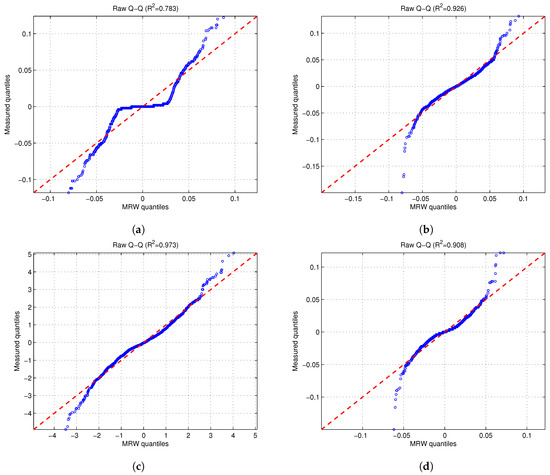
Figure 10.
Q-Q plots fit for : (a) Apartment. (b) Computer Lab. (c) Electronics Lab. (d) Postgraduate office.
5. Conclusions
In this paper, a multifractal random walk (MRW) approach has been employed to characterize and model bursty impulsive noise present in PLC systems. Based on the results and analysis carried out on the measured data, MRW has proved successful in reproducing key scaling properties that include the heavy-tailed increment distributions, long-range correlation, and multifractal spectrum seen in the measured data. In addition, MRW has the capability to capture higher-order statistics beyond second-order moments, thus rendering it superior to conventional models like Gaussian-based noise models that tend to underestimate extreme bursty impulsive noise events. Even though the Q-Q diagnostic plots show that MRW matches closely with quantiles from measurement data specifically in the tails, thus providing a better representation of the bursty impulses that are dominant in PLC noise, the analysis also reveals some limitations. Calibration of MRW parameters that include H, , and are computationally intensive and sensitive to finite sample size, leading to noticeable variations between simulated and measured scaling exponents. Moreover, MRW has difficulties in reproducing similar amplitude variability and spectral decay characteristics since it can be observed that flatter probability density functions and power spectral densities are produced by MRW simulations as compared to measured data. Overall, MRW provides a more realistic approach to modelling than Gaussian-based approximations for bursty impulsive noise and PLC noise, specifically for extreme-value characteristics and multifractal scaling. However, a refined MRW model or hybrid approach may be required to properly capture both the temporal correlations and spectral characteristics present in real-world PLC channels.
Author Contributions
Conceptualization, S.O.A. and B.N.; methodology, S.O.A.; software, S.O.A.; validation, B.N. and S.O.A.; formal analysis, S.O.A. and B.N.; investigation, S.O.A. and B.N.; resources, S.O.A.; data curation, S.O.A. and B.N.; writing—original draft preparation, S.O.A.; writing—review and editing, S.O.A. and B.N.; visualization, S.O.A.; supervision, B.N.; project administration, S.O.A.; funding acquisition, S.O.A. and B.N. All authors have read and agreed to the published version of the manuscript.
Funding
This work was supported by Durban University of Technology under the Harnessing Talent (HANT) Postdoctoral Fellowship (PDF) Programme.
Institutional Review Board Statement
Not applicable.
Informed Consent Statement
Not applicable.
Data Availability Statement
The raw data supporting the conclusions of this article will be made available by the authors on request.
Acknowledgments
We acknowledge Thomas Afullo from the University of KwaZulu-Natal for facilitating the measurements used in this research.
Conflicts of Interest
The authors declare no conflicts of interest.
Abbreviations
The following abbreviations are used in this manuscript:
| PLC | Power Line Communication |
| MRW | Multifractal Random Walk |
| LRD | Long-Range Dependence |
| MF-DFA | Multifractal Detrended Fluctuation Analysis |
| MF-DMA | Multifractal Detrending Moving Average analysis |
| fBm | fractional Brownian motion |
| DSO | Digital Storage Oscilloscope |
| PSD | Power Spectral Density |
| ACF | Autocorrelation Function |
| Q-Q plot | Quantile–Quantile plot |
| Probability Distribution Function |
References
- Lu, Y.; Liu, W. Spectrum analyzer based measurement and detection of MW/SW broadcast radios on power lines for cognitive PLC. In Proceedings of the International Symposium on Power Line Communications and Its Applications, Johannesburg, South Africa, 24–27 March 2013; pp. 103–108. [Google Scholar]
- Awino, S.O.; Afullo, T.J.O.; Mosalaosi, M.; Akuon, P.O. Empirical identification of narrowband interference in broadband PLC networks at the receiver. In Proceedings of the Progress of Electromagnetics Research Symposium, Toyama, Japan, 1–4 August 2018; pp. 2160–2164. [Google Scholar]
- Shongwe, T.; Vinck, A.J.H. Narrow-band interference model for OFDM systems for power line communications. In Proceedings of the International Symposium on Power Line Communications and Its Applications, Johannesburg, South Africa, 24–27 March 2013; pp. 268–272. [Google Scholar]
- Rouissi, F.; Vinck, A.J.H.; Gassara, H.; Ghazel, A. Improved impulse noise modeling for indoor narrow-band power line communication. Int. J. Electron. Commun. (AEÜ) 2019, 103, 74–81. [Google Scholar] [CrossRef]
- Karakus̨, O.; Kuruoğlu, E.E.; Altınkaya, M.A. Modelling impulsive noise in indoor powerline communication systems. Signal Image Video Process. 2020, 14, 1655–1661. [Google Scholar] [CrossRef]
- Ouyang, S.; Liu, G.; Huang, T.; Liu, Y.; Xu, W.; Wu, Y. Impulsive noise suppression network for power line communication. IEEE Commun. Lett. 2024, 28, 2628–2632. [Google Scholar] [CrossRef]
- Yu, Z.; Zhang, B. The art of noise modeling and mitigation on power line communication in distributed energy system. IEEE Trans. Instrum. Meas. 2025, 74, 5503423. [Google Scholar] [CrossRef]
- Meng, H.; Guan, Y.L.; Chen, S. Modeling and analysis of noise effects on broadband power line communications. IEEE Trans. Power Deliv. 2005, 20, 630–637. [Google Scholar] [CrossRef]
- Vines, R.M.; Trussell, H.J.; Gale, L.J.; O’neal, J.B. Noise on Residential Power Distribution Circuits. IEEE Trans. Electromagn. Comp. 1984, EMC-26, 161–168. [Google Scholar] [CrossRef]
- Zimmermann, M.; Dostert, K. Analysis and modelling of impulsive noise in broad-band power line communications. IEEE Trans. Electromagn. Comp. 2002, 44, 249–258. [Google Scholar] [CrossRef]
- Asiyo, M.O.; Afullo, T.J.O. Prediction of long-range dependence in cyclostationary noise in low-voltage PLC networks. In Proceedings of the Progress of Electromagnetics Research Symposium, Shanghai, China, 8–11 August 2016; pp. 4954–4958. [Google Scholar]
- Awino, S.O.; Afullo, T.J.O.; Mosalaosi, M.; Akuon, P.O. Time series analysis of impulsive noise in power line communication (PLC) networks. SAIEE Afr. Res. J. 2018, 109, 237–249. [Google Scholar] [CrossRef]
- Awino, S.O.; Afullo, T.J.O. On the application of parsimoniuos periodic autoregressive models to bursty impulsive noise in low-voltage PLC networks. In Proceedings of the 2021 IEEE AFRICON, Arusha, Tanzania, 13–15 September 2021; pp. 1–5. [Google Scholar]
- Awino, S.O.; Afullo, T.J.O.; Mosalaosi, M.; Akuon, P.O. On the application of periodic autoregressive models to PLC impulsive noise. In Proceedings of the Southern Africa Telecommunication Networks and Applications Conference (SATNAC), Ballito, South Africa, 1–4 September 2019; pp. 328–333. [Google Scholar]
- Asiyo, M.O.; Afullo, T.J.O. Analysis of bursty impulsive noise in low-voltage indoor power line communication channels: Local scaling behaviour. SAIEE Afr. Res. J. 2017, 108, 98–107. [Google Scholar] [CrossRef][Green Version]
- Ma, Y.J.; Zhai, M.Y. Fractal and multi-fractal features of the broadband power line communication signals. Comput. Electr. Eng. 2018, 72, 566–576. [Google Scholar] [CrossRef]
- Bacry, E.; Muzy, J.F. Multifractal stationary random measures and multifractal random walks with log-infinitely divisible scaling law. Phys. Rev. E 2002, 66, 056121. [Google Scholar]
- Bacry, E.; Muzy, J.F. Log-Infinitely Divisible Multifractal Processes. Commun. Math. Phys. 2003, 236, 449–475. [Google Scholar] [CrossRef]
- Mandelbrot, B.B.; Taylor, H.M. On the distribution of stock price differences. Oper. Res. 1967, 15, 1057–1062. [Google Scholar] [CrossRef]
- Duchon, J.; Robert, R.; Vargas, V. Forecasting volatility with the multifractal random walk model. Math. Financ. Int. J. Math. Stat. Financ. Econ. 2012, 22, 83–108. [Google Scholar] [CrossRef]
- Fauth, A.; Tudor, C.A. Multifractal random walks with fractional Brownian motion via Malliavin calculus. IEEE Trans. Inf. Theory 2014, 60, 1963–1975. [Google Scholar] [CrossRef][Green Version]
- Awino, S.O.; Afullo, T.J.O.; Mosalaosi, M.; Akuon, P.O. Measurements and Statistical Modelling For Time Behaviour of Power Line Communication (PLC) Impulsive Noise. Int. J. Commun. Antenna Propag. (IRECAP) 2019, 9, 236–246. [Google Scholar] [CrossRef]
- Antoniali, M.; Versolatto, F.; Tonello, A.M. An Experimental Characterization of the PLC Noise at the Source. IEEE Trans. Power Deliv. 2016, 31, 1068–1075. [Google Scholar] [CrossRef]
- Emleh, A.; de Beer, A.S.; Ferreira, H.C.; Vinck, A.J.H. The impact of the CFL lamps on the power-line communications channel. In Proceedings of the IEEE International Symposium on Power Line Communications and Its Applications, Johannesburg, South Africa, 24–27 March 2013; pp. 225–229. [Google Scholar]
- Emleh, A.; de Beer, A.S.; Ferreira, H.C.; Vinck, A.J.H. The influence of fluorescent lamps with electronic ballast on the low voltage PLC network. In Proceedings of the IEEE 8th International Power Engineering and Optimization Conference (PEOCO2014), Langkawi, Malaysia, 24–25 March 2014; pp. 276–280. [Google Scholar]
- Tlich, M.; Chaouche, H.; Zeddam, A.; Gauthier, F. Impulsive noise characterization at source. In Proceedings of the 2008 1st IFIP Wireless Days (WD), Dubai, United Arab Emirates, 24–27 November 2008; pp. 1–6. [Google Scholar]
- Tlich, M.; Zeddam, A.; Moulin, F.; Gauthier, F. Indoor power line communications channel characterization up to 100 MHz-part II: Time-frequency analysis. IEEE Trans. Power Deliv. 2008, 23, 1402–1409. [Google Scholar] [CrossRef]


Disclaimer/Publisher’s Note: The statements, opinions and data contained in all publications are solely those of the individual author(s) and contributor(s) and not of MDPI and/or the editor(s). MDPI and/or the editor(s) disclaim responsibility for any injury to people or property resulting from any ideas, methods, instructions or products referred to in the content. |
© 2025 by the authors. Licensee MDPI, Basel, Switzerland. This article is an open access article distributed under the terms and conditions of the Creative Commons Attribution (CC BY) license.