Abstract
The present work develops an explicit dynamic finite element model of soil–disc interaction for a notched harrow disc, aiming to quantify how APS coatings, soil type and disc–soil friction influence stresses in the disc and surrounding soil. The model reproduces a four-gang offset harrow operating at 7 km/h, 0.15 m working depth, with 18°disc angle and 15° tilt angle, and compares an uncoated steel disc with three APS-coated variants (P1 Metco 71NS, P2 Metco 136F, P3 Metco 45C-NS). Mechanical properties of the substrate and coatings are obtained from micro-indentation tests and introduced via a bilinear steel model and Johnson–Cook plasticity for the coatings, while disc–soil friction coefficients are calibrated from microscratch measurements. Soil behaviour is described using the AUTODYN Granular model for four representative agricultural soils, spanning sandy loam to saturated heavy clay. Results show that the uncoated disc develops von Mises stresses in the disc–soil contact region of ≈150–220 MPa, with intermediate-stiffness soils being most critical. APS coatings significantly alter both the level and distribution of stresses: P2, the stiffest ceramic, yields the highest stresses (≈421–448 MPa), P1 keeps stresses near the baseline while shielding the substrate through extended plastic zones, and P3 provides an intermediate, more uniformly distributed stress regime. Increasing disc–soil friction systematically amplifies von Mises stresses in the contact region, especially for P2. Overall, the calibrated explicit model captures the coupled influence of soil properties, coating stiffness and friction, and indicates that P1 is better suited for light-to-medium soils, P3 offers the most balanced response in medium-to-stiff soils, whereas P2 should be reserved for highly abrasive conditions and used with caution in cohesive soils.
1. Introduction
Disc harrows remain among the most widely used implements for primary and secondary tillage due to their robustness and versatility across soil textures and residue conditions. Nevertheless, their operation is strongly constrained by traction demand, which governs tractor–implement matching and fuel consumption, and accelerated abrasive wear of the working discs, which increases maintenance cost and can degrade soil processing quality over time [1].
Accurate prediction of draught force is central to implement design and optimal pairing with available tractors. Regression-based approaches have shown that soil strength indicators can dominate traction demand: for offset disc harrows, a multiple regression model identified soil cone index as the most influential predictor, followed by working depth, forward speed and gang/working angles [2]. An analytical estimator built on classical soil mechanics captured the combined contribution of soil cutting, clod rupture and rolling resistance and reported prediction errors below typical engineering thresholds [3]. Complementary experimental evidence confirms the sensitivity of draught-to-soil state and operating regime: controlled tests on disc-harrow operation highlighted a pronounced dependence on soil moisture and speed, with low-to-moderate draught levels reported under soil-bin/controlled conditions [4]. At implement scale, field studies on compact disc harrows further demonstrate how disc settings and adjustment angles affect longitudinal resistance and vertical reactions, influencing both penetration stability and energy demand [5]. In addition, practical optimisation studies reported that suitable combinations of disc angle and speed can reduce fuel consumption while maintaining acceptable residue incorporation and soil structure outcomes [6], whereas comparative field datasets emphasise that draught response depends strongly on soil texture (e.g., silty loam versus clay) and travel speed [7].
For operating regimes where direct field measurement is costly or difficult to control, numerical methods, particularly FEM and DEM, have become essential. Calibrated DEM frameworks can reproduce traction forces with very low relative error when soil and contact parameters are carefully identified, supporting predictive studies across depth, speed and gang-angle domains [8]. DEM-based modelling is also increasingly applied to complex soil states, where dedicated contact models have been validated against traction-force measurements for disc-type openers in flooded soils [9]. Semi-analytical models and DEM studies applied to flat seeding discs have shown that only the active portion of the disc contributes effectively to soil failure, and that the force trends as functions of sweep and tilt angles are consistent and repeatable, and that DEM predictions align more closely with measurements than simplified analytical formulas. These findings provide a useful framework for sensitivity analyses with respect to disc mounting angles [10,11]. Beyond force prediction, coupled strategies broaden applicability: DEM–multibody dynamics can capture passive disc kinematics and rotation trends under realistic constraints [12,13], while DEM–FEM coupling enables deformable-tool modelling and the study of passively vibrating tools, with demonstrated implications for reduced traction demand and improved soil mixing [14]. Together, these contributions indicate a clear trend toward physics-based simulation as a complement to experimental campaigns, especially when investigating parameter spaces that are impractical to cover only by field trials.
Alongside traction, disc geometry and structural response influence both functional performance and durability. Studies comparing disc edge configurations reported measurable differences in residue-cutting efficiency and operational smoothness, supporting the use of notched designs under conservation and residue-rich conditions [15]. Controlled investigations of vertical tillage also showed that working depth can dominate cutting forces and residue-processing effectiveness, reinforcing the need to interpret traction and cutting loads jointly [16]. In parallel, finite element analyses have been used to evaluate stress concentrations and deformation patterns of harrow components and disc-inspired geometries, including bionic concepts, thereby supporting design optimisation before prototyping [17]. These studies collectively show that realistic soil-loading conditions and disc geometry must be considered simultaneously to obtain reliable stress and performance predictions.
The durability of disc harrows is limited primarily by abrasive wear, erosive soil action and contact-fatigue phenomena in severe soil environments. Recent reviews emphasise that surface engineering, hardfacing and sprayed coatings can significantly improve wear resistance, but outcomes depend on soil mineralogy, moisture and coating microstructure [18,19]. In particular, atmospheric plasma spraying (APS) has attracted attention for agricultural discs due to its flexibility in depositing metallic and cermet layers with tailored hardness and damage tolerance, with recent syntheses highlighting the potential of NiCrBSi-based systems and carbide or oxide-containing coatings for demanding abrasive conditions [20]. However, despite strong experimental progress, a practical gap persists in propagating experimentally measured coating properties into explicit, transient soil–disc simulations in a way that allows systematic comparison across soils and frictional regimes. Many studies focus on wear rates and field outcomes, while fewer quantify how coating stiffness modifies the transient and quasi-steady stress fields generated during soil contact, which is critical for understanding cohesive failure risks and coating–substrate load sharing.
This study proposes an Explicit Dynamics finite element framework for soil–disc interaction of a real 24″ notched agricultural harrow disc operating under representative conditions (forward speed 7 km·h−1, working depth 0.15 m, horizontal attack angle 18°, vertical tilt angle 15°). Three APS coatings are investigated as thin functional layers representative of Metco 71NS, Metco 136F and Metco 45C-NS. The substrate and coating constitutive inputs are parameterised from indentation-based experimental measurements, enabling a consistent comparison of stress redistribution between coating and steel. The soil is represented using the AUTODYN Granular formulation, and four representative soil variants—selected from the Laine–Sandvik E–S matrix to cover the mechanical envelope relevant to Moldavian field conditions—are analysed. The simulations quantify the coupled influence of soil properties, coating behaviour and disc–soil friction on von Mises stress fields in the disc or coating region and on the deformation response of the surrounding soil, providing coating-selection guidance within the investigated operating regime.
2. Materials and Methods
2.1. Coated Notched Harrow Disc System and Experimental Characterisation
2.1.1. Geometry and Operating Conditions of the Reference Harrow Disc
The numerical model represents a double offset tandem disc harrow, consisting of four gangs arranged in a “V” configuration, each gang carrying ten scalloped discs mounted on a common shaft. The discs have a diameter of 610 mm (24″), a thickness of 6 mm and a maximum concavity of 88 mm. Along each gang shaft, the discs are spaced at 220 mm between adjacent discs, according to the standard configuration given in the operating manual [21] (Figure 1).
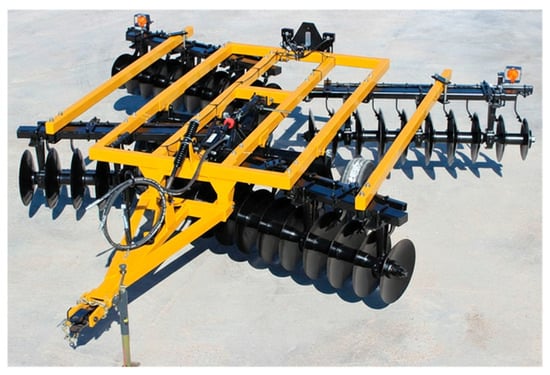
Figure 1.
Double offset tandem disc harrow (four-gang configuration) used as the reference implement in this study.
The mounting angles are consistent with common agricultural practice: the disc angle in the horizontal plane (with respect to the travel direction) is 18°, while the tilt angle in the vertical plane is 15°, ensuring uniform penetration of the disc into the soil down to a working depth of 150 mm (Figure 2).
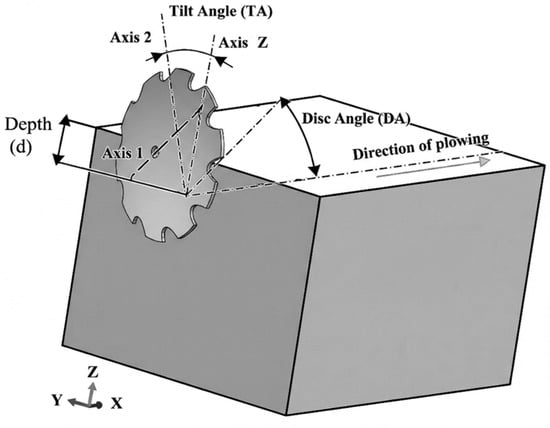
Figure 2.
Schematic representation of the soil–disc interaction, illustrating the disc angle (DA) between the disc horizontal axis (Axis 1) and the plowing direction (Z), the tilt angle (TA) between the disc vertical axis (Axis 2) and the vertical axis (Y), and the working depth d of the disc in the soil.
The total working width of the harrow is 4.4 m, and its weight is assumed to be uniformly distributed over the 40 discs mounted in parallel. This leads to an average normal load of about 150 kgf/disc (≈1471 N/disc), which is used in the simulations as a constant mean normal load at the disc–soil interface. In the finite element model, this load is introduced as an equivalent gravitational force acting along the normal to the contact surface, representing the vertical component of the effective weight transmitted through the frame and gang mounting system. This modelling choice ensures a realistic distribution of contact pressure and working depth, enabling a direct comparison between the uncoated disc and the coated discs under identical loading conditions. Dynamic fluctuations of the vertical load due to frame vibrations and local soil heterogeneity are not included in the present single-disc model, as capturing them would require coupling with the full implement and tractor dynamics or using measured force–time histories; this constitutes a limitation of the present modelling framework.
2.1.2. Base Material and APS Coatings
The base disc is made of steel, representative of commercial agricultural discs. Its mechanical properties were determined on real specimens by micro-indentation tests, yielding an average hardness of H ≈ 1.84 GPa. In the explicit simulation, the material was defined in ANSYS 2025R1, starting from the Structural Steel template, with the measured values overriding the defaults: density ρ = 7800 kg/m3, Young’s modulus E = 210 GPa and Poisson’s ratio ν = 0.30. Plastic behaviour was introduced using a bilinear isotropic hardening (BISO) model with an initial yield stress of σy0 ≈ 590 MPa, obtained from the Tabor-type relation σy0 ≈ 0.32·H [22]. The hardness-to-yield conversion is a first-order approximation: it provides an effective indentation-scale estimate of the onset of plastic flow and is not strictly equivalent to a unique uniaxial yield stress because the constraint factor depends on indentation conditions and material strain hardening. For thin, heterogeneous APS coatings, indentation-derived yield parameters should be interpreted as homogenised effective values representative of the coating microstructure at the indentation scale; their applicability is more limited for coatings with a predominantly brittle response. This constitutes a limitation of the present material calibration.
On the active surface of the disc—namely the outer concave face and the cutting edges of the scallops—three types of functional coatings deposited by atmospheric plasma spraying (APS) were applied, corresponding to the experimentally identified compositions:
- P1—Metco 71NS: a cermet based on W2C/WC–12Co, a hard ceramic WC–Co type coating;
- P2—Metco 136F: a pure ceramic coating based on Cr2O3 with silicates and titanium oxides (Cr2O3–SiO2–TiO2), exhibiting very high hardness;
- P3—Metco 45C-NS: a hard metallic coating Co–Cr–Ni–W, with a metallic binder and fine carbides, self-compatible with the steel substrate.
The APS coatings were deposited to an average thickness of about 500 μm, each coated disc carrying a single distinct layer of one of the three materials. Thus, three coated disc configurations (P1, P2 and P3) were analysed and compared to the uncoated base disc. The main objective was to assess the influence of each coating on the global mechanical response of the disc, on the stress fields generated at the soil contact and on the distribution of von Mises equivalent stresses both in the coating and in the steel substrate.
2.1.3. Microstructural Characterisation (SEM)
Metallic and ceramic coatings deposited via atmospheric plasma spraying (APS) onto sandblasted specimens result in dense and compact layers exhibiting consistent thickness, which correlates nearly linearly with the number of spray passes. Scanning electron microscopy provides a detailed visualisation of the microstructure of these deposited layers. Application of Metco 45C-NS enhances resistance to abrasive wear, Metco 71NS improves compressive strength and Metco 136F is effective for increasing both hardness and corrosion resistance. The APS process generates coatings with homogeneous layering, although occasional unmelted particles, microporosity and microcracking are present due to process dynamics. Electron microscopy cross-sectional images illustrate the excellent bonding of these coatings to the metallic substrate. The layers characteristically display splat formations—flattened particles originating from sprayed powder. Minor, sporadic porosity is observed, attributed to disparities in the melting points between tungsten carbide and cobalt constituents. Although SEM reveals occasional microporosity and microcracking typical of APS layers, the numerical model represents each coating as a homogeneous continuum layer with effective properties.
Three representative samples were examined:
- Sample 1—Metco 71NS (W2C/WC12Co);
- Sample 2—Metco 136F (Cr2O3–4SiO2–3TiO2);
- Sample 3—Metco 45C-NS (Co–Cr–Ni–W–C).
SEM images at different magnifications (50×, 200×, 2000×) reveal dense and compact coatings with homogeneous layering and nearly constant thickness, which correlates almost linearly with the number of spray passes (Figure 3, Figure 4 and Figure 5).
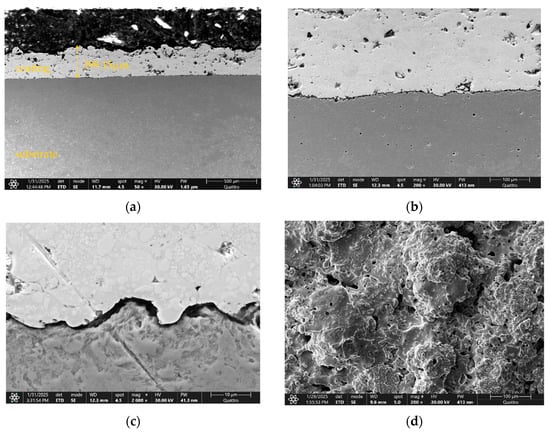
Figure 3.
Sample 1—SEM images at different magnifications: (a) 50×; (b) 200×; (c) 2000× and morphologic aspect (d) 200×.
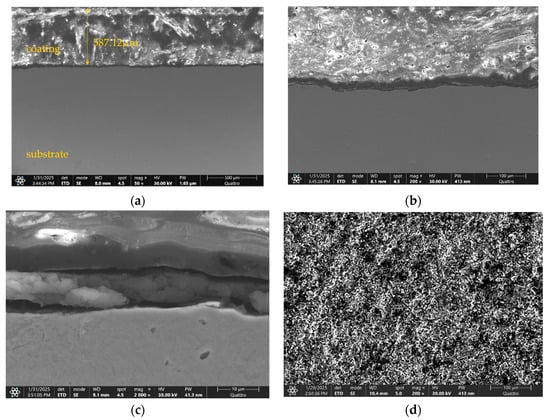
Figure 4.
Sample 2—SEM images at different magnifications: (a) 50×; (b) 200×; (c) 2000× and morphologic aspect (d) 200×.
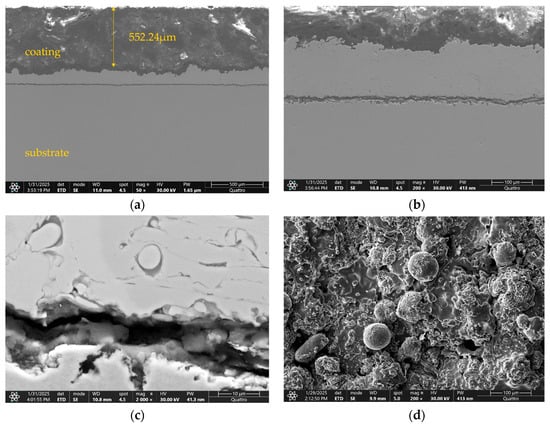
Figure 5.
Sample 3—SEM images at different magnifications: (a) 50×; (b) 200×; (c) 2000× and morphologic aspect (d) 200×.
Cross-sectional SEM images show excellent bonding between the APS coatings and the metallic substrate, without macroscopic discontinuities at the interface. For the base material, SEM observations after metallographic preparation (Figure 6) indicate a fine microstructure, while the surface obtained after sandblasting (Figure 7) exhibits a controlled roughness and open porosity that promote mechanical interlocking and improve coating adhesion.
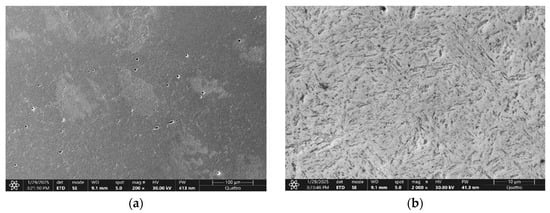
Figure 6.
Base material after metallographic preparation: (a) 200× and (b) 2000×.
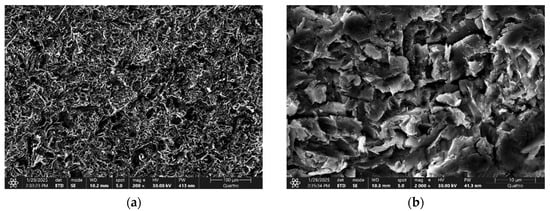
Figure 7.
The surface resulting from the sandblasting operation of the base material which was subsequently thermally deposited in mesh jet. Porosity necessary for a better bond between the base material and the coating: (a) 200× and (b) 2000×.
2.1.4. Mechanical Properties
The mechanical properties of the base material and of the three coatings (Metco 71NS, Metco 136F, Metco 45C-NS) were determined by micro-indentation and microscratch tests performed using a CETR UMT-2 tribometer, in accordance with ASTM E18 for Rockwell hardness and the Oliver–Pharr methodology for evaluating Young’s modulus [23,24].
For each coating, five samples (P1–P3) and two base material samples were tested, using a maximum load of 10 N and three repetitions per load level. Micro-indentation tests were performed on five specimens for each APS coating (P1–P3) and two specimens for the base steel, with three indents per specimen, using a maximum load of 10 N, yielding n = 15 measurements per coating and n = 6 for the base steel. From the force–displacement curves (Figure 8), the average values of hardness H and Young’s modulus E were extracted, yielding the following:
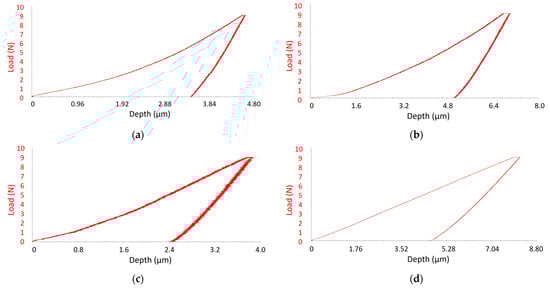
Figure 8.
Force–displacement curves obtained by micro-indentation for the base material (a), sample 1—P1 Metco 71NS (b), sample 2—P2 Metco 136F (c) and sample 3—P3 Metco 45C-NS (d).
- Steel (base disc): H = 1.84 ± 0.05 GPa, E = 210 ± 0.12 GPa;
- Coating P1—Metco 71NS: H = 0.88 ± 0.15 GPa, E = 178 ± 10.82 GPa;
- Coating P2—Metco 136F: H = 2.21 ± 0.18 GPa, E = 255 ± 8.32 GPa;
- Coating P3—Metco 45C-NS: H = 1.02 ± 0.16 GPa, E = 223 ± 5.92 GPa.
The plastic behaviour of the base material and coatings was described by the Johnson–Cook constitutive model, in which the flow stress depends on the equivalent plastic strain, strain rate and temperature [25]. In its simplified form, relevant for the loading range, the analysed the model can be written as
where σ is the equivalent flow (yield) stress, ε is the equivalent plastic strain, ε′ is the equivalent plastic strain rate, A represents the initial yield stress, B and n govern isotropic strain hardening and C controls the strain-rate sensitivity [26,27].
σ = (A + Bεn)·(1 + Cln ε′),
In this study, temperature dependence in the Johnson–Cook formulation is not included and no coupled heat-generation or heat-transfer analysis is performed. Although frictional sliding may produce interfacial heating and localised temperatures, this represents a limitation of the present model, which neglects heat generation and temperature-dependent constitutive behaviour.
These values were used to build Table 1, which summarises, for all four materials, density ρ, Young’s modulus E, Poisson’s ratio ν, bulk modulus K, shear modulus G, specific heat Cp, hardness H and the Johnson–Cook parameters (A, B, n, C). The initial yield stress A = σy0 was estimated via the Tabor relation (σy0 ≈ 0.32·H), while B and n were chosen within ranges recommended in the literature for quenched steels, WC–Co cermets and Co–Cr alloys, to reproduce moderate strain hardening. Parameters B and n were adopted as effective post-yield hardening constants within literature-consistent ranges for similar steels and Co-/WC–Co-based materials, to provide a coherent hardening response consistent with the indentation-derived yield parameter A. As these parameters control post-yield strengthening, stress levels may show some sensitivity to their assumed values when plastic strains become significant; this constitutes a modelling limitation.

Table 1.
Mechanical and Johnson–Cook plasticity parameters for the steel substrate and APS coatings P1–P3.
2.2. Soil Types and Constitutive Modelling
2.2.1. Selection of Representative Agricultural Soils
The numerical modelling of the soil–disc interaction was based on the SAND predefined material available in the Explicit Materials library of ANSYS 2025R1 Explicit Dynamics. This material relies on the AUTODYN Granular constitutive formulation, which is suitable for granular and particulate geomaterials under large deformation, exhibiting nonlinear compressibility and pressure-dependent shear strength. In this framework, the soil response is defined through tabulated functions, including a compaction equation of state P(ρ) (with unloading), a pressure-dependent shear yield strength σy(P) and density-dependent elastic wave and stiffness descriptors such as sound speed c(ρ) and shear modulus G(ρ). Consequently, the model is not parameterised by Mohr–Coulomb cohesion and friction angle (c, φ); instead, it is governed by the above pressure–density and pressure-dependent strength relationships.
Following the methodology proposed by Laine and Sandvik [37], a complete set of 16 soil variants (E1–S1 to E4–S4) was generated by combining four compaction/EOS levels (E1→E4) with four shear-strength levels (S1→S4). The E-axis controls the overall compressive stiffness through the tabulated compaction EOS P(ρ), while the S-axis controls the pressure-dependent shear strength through the σy(P) curve [38]. This matrix enables independent variation of compressibility and shear resistance while maintaining robust numerical behaviour in severe contact conditions.
Although all 16 variants were implemented in the material library, the present study analyses a reduced set of four representative soils (E1–S2, E2–S3, E3–S3, E4–S4) selected to ensure both relevance to the dominant soil texture–moisture conditions encountered in Moldavian agricultural fields (from light sandy loam and loess-derived silt loam to silty-clay loam and wet–saturated heavy clay) and adequate coverage of the mechanical domain defined by the Laine–Sandvik E–S matrix [39], spanning increasing compaction stiffness (E1→E4) and shear-strength scaling (S2→S4), from well-drained light soils to cohesive, wet limit conditions.
The key AUTODYN Granular parameters of the four selected soils are summarised in Table 2, while the full tabulated curves were implemented directly from Laine and Sandvik’s matrix (compaction EOS, unloading, σy(P), c(ρ) and G(ρ)).
Table 2.
Key AUTODYN Granular (Laine–Sandvik [38]) parameters for the four selected representative soils.
These four soils span a broad range of textures and moisture conditions and are consistent with cambic chernozem, brown and alluvial soils frequently encountered in regional agricultural fields, according to FAO/WRB and Corine Land Cover classifications.
Soil E1–S2—Sandy Loam with Medium Shear Strength
This case represents a light, deformable soil condition with a low initial bulk density (ρ0 ≈ 1674 kg/m3) and comparatively low confinement at the onset of loading. Its granular stiffness and strength scaling corresponds to a soil that allows easier penetration and larger rearrangements under the disc, representative of well-drained light fields. E1–S2 is representative of weakly cohesive, well-drained soils such as eutric Cambisols and alluvial terraces along the rivers under low-moisture conditions [20,40].
Soil E2–S3—Loess-Derived Silt Loam, Representative for Normal Field Conditions
E2–S3 represents intermediate conditions (ρ0 ≈ 1752 kg/m3) associated with typical loess-derived silt-loam agricultural soils under normal moisture. It is adopted as the reference operating scenario in the present study. Pedologically, it is typical of cambic chernozems, widely used for cereals and row crops. E2–S3 is thus considered the reference operating scenario for normal tillage conditions [40,41].
Soil E3–S3—Silty-Clay Loam with Increased Stiffness
E3–S3 increases the compressive stiffness level relative to E2 while maintaining the same shear-strength scaling S3 (ρ0 ≈ 1830 kg/m3). This case represents stiffer, finer-textured field conditions, in which the disc–soil interaction is expected to induce higher normal reactions and larger lateral force components during disc motion. In practical terms, such soils, typically richer in active clay, may lead to increased side forces and higher draft requirements to maintain a constant working depth. Pedologically, this behaviour is consistent with clay-influenced soils frequently encountered in hilly areas, such as eutric Luvisols or clayey paleosols [20,40].
Soil E4–S4—Saturated Heavy Clay with Extreme Plastic Behaviour
E4–S4 corresponds to the most extreme condition in the selected set, combining the highest compressive stiffness level (E4) with the lowest shear-strength scaling (S4) in the Laine matrix (ρ0 ≈ 1908 kg/m3; σy,max at the MPa level). This case is treated as a wet–saturated limit scenario representative of poorly drained field conditions (e.g., after intense rainfall or in local depressions), where the soil may undergo large deformations and exhibit a pronounced tendency to adhere to the disc [40,42].
Overall, these four soils span from a soft, highly deformable light soil (E1–S2) to progressively stiffer and more demanding conditions (E2–S3 and E3–S3), culminating in a wet–saturated heavy-soil analogue (E4–S4). This selection enables a systematic analysis of soil-type effects on disc and coating stress fields while preserving a feasible computational scope.
2.2.2. Tribological Properties and Disc–Soil Friction Coefficients
Tribological behaviour was characterised by microscratch tests on the APS coatings, using the same CETR UMT-2 tribometer. Tests were carried out according to ASTM D7187, with a linearly increasing load from 1 to 10 N and a constant sliding speed. For each material (base steel and P1–P3 coatings), the friction force Ft was recorded as a function of the normal force Fn, and the apparent coefficient of friction (COF) was computed using μ = Ft/Fn, [43]. Laboratory COF values obtained from microscratch tests represent coating–counterbody friction under controlled conditions and are not directly equivalent to the effective disc–soil friction in the field, which depends on soil texture, moisture, normal stress and surface roughness. Therefore, in the present model, microscratch results are used only to define relative correction factors between coatings and the base steel, while the absolute friction levels are anchored to soil-dependent ranges reported for soil–metal interfaces. This constitutes a limitation of the present friction calibration approach.
The average COF values were as follows:
- μ = 0.54 ± 0.004 for P1—Metco 71NS;
- μ = 0.67 ± 0.037 for P2—Metco 136F;
- μ = 0.57 ± 0.028 for P3—Metco 45C-NS;
- μ = 0.55 ± 0.029 for the steel base material.
Based on these values, correction factors relative to the base material COF were defined: 1.00 for P1, 1.22 for P2 and 1.04 for P3. These factors were applied to typical geotechnical ranges for disc–soil friction (e.g., μ ≈ 0.3 for dry sand, μ ≈ 0.5 for wet clay) to obtain the Coulomb static (μs) and dynamic (μd) friction coefficients used in the “Body Interaction→Frictional” contact definition in ANSYS 2025R1, for each material–soil combination and for all four soil types. The final values, including μd = 0.9·μs, are listed in Table 3.
Table 3.
Disc–soil Coulomb friction coefficients (μs, μd) for the base disc and APS coatings P1–P3 across the four selected soil types.
2.3. Finite Element Model of Soil–Disc Interaction in ANSYS Explicit Dynamics
In the numerical model, each disc is represented by a three-dimensional geometry that preserves the serrated profile and the concave shape. The soil–disc assembly was discretised in ANSYS 2025R1 Explicit Dynamics using the Explicit physics option and linear tetrahedral finite elements of type Solid185 in a Lagrangian formulation. The mesh was generated to provide an optimal compromise between accuracy and computational cost, with local refinement in the regions exhibiting high stress gradients, i.e., in the contact area between the disc and the soil.
The disc model was meshed with a non-uniform three-dimensional grid, with a mean element size of about 30.7 mm, while preserving the geometrical details of the serrations and the concave profile. In these regions, the mesh size was progressively reduced down to 0.5 mm in order to accurately capture the von Mises stress gradients and the distribution of contact pressure. The deposited layer was introduced by extracting the coated faces (outer concave face and serrated cutting edges) and converting them into surface bodies, to which a constant thickness of 0.5 mm was assigned (shell-type representation). The coating surface was split into a contact sub-region and a remaining region, enabling local mesh control. The contact sub-region was discretised with a finer sizing of 0.25 mm, while the disc solid mesh in the serration/contact area was refined down to 0.5 mm. This strategy ensures that the coating is resolved in-plane in the contact zone, while keeping the explicit time step computationally feasible. Further mesh refinement below 0.25 mm was not performed because it would drastically reduce the stable explicit time increment; therefore, the coating discretisation represents a compromise and constitutes a limitation of the present modelling framework. The quality of the tetrahedral elements was monitored automatically, the minimum value of the Tet Collapse parameter being 0.184, within the recommended limits for explicit dynamic analyses. The soil volume was modelled as a parallelepiped block split into two sub-volumes, so that the mean element size is 20 mm in the inner region and reduced to 2 mm in the contact zone (Figure 9).
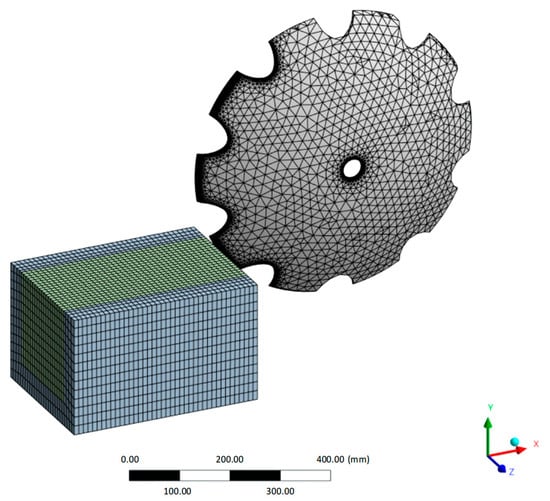
Figure 9.
Finite element model of the notched harrow disc and soil block, showing mesh discretisation and surface refinement in the soil–disc contact zone.
The global mesh consists of approximately 25,506 nodes and 47,780 elements, including both the disc and the soil block, with more than 95% of the elements classified as “good quality mesh” according to deformability and distortion indicators. The simulations were performed with explicit time integration using automatic stable time stepping. A time-step safety factor of 0.9 was used and automatic mass scaling was disabled. The resulting stable time increment was on the order of Δt = 4.14 × 10⁻⁸ s, nearly constant over the 0–0.2 s simulation.
To evaluate the contact behaviour, a region of interest denoted as coating zone was defined, comprising the coating deposited on the concave face and on the cutting edge of the disc, together with the superficial volume of the base material located immediately beneath the coating in the direct interaction area with the soil. This region corresponds to the volume where the highest stresses and strains are expected to develop under contact loading and thus where contact fatigue and wear mechanisms are likely to initiate. In each simulation, the equivalent von Mises stress was computed within the coating zone and the maximum value over this volume was extracted at every time step.
All simulations were carried out using the Explicit Dynamics solver in ANSYS 2025R1 over a time interval of 0–0.20 s, corresponding to the penetration of the disc into the soil and to the stabilisation of the working regime.
In all cases, the harrow disc is subjected to representative field conditions (forward speed 7 km/h, working depth 0.15 m, disc and tilt angles of 18° and 15°, respectively), and the soil–disc interaction is described by a nonlinear Coulomb frictional contact between the active disc surface (including the coating) and the soil volume.
The main response quantity monitored in the disc and in the coatings was the equivalent von Mises stress, evaluated at element level throughout the geometry. Within the coating zone, the maximum value of the von Mises stress was extracted at each time step and subsequently used for the comparative analysis of the disc–soil combinations. In parallel, total displacement fields in the soil were postprocessed for the four soil types at times 0.06, 0.12, 0.16 and 0.20 s, to visualise the development of the soil wedge in front of the disc and to correlate soil deformation with the stress levels in the coating zone.
3. Results
3.1. Baseline Response of the Uncoated Disc for Different Soils
The mechanical response of the uncoated disc is directly controlled by the way the soil deforms around the active cutting edge. Figure 10 illustrates the total soil displacement fields for the base disc, for the four soil types considered (E1–S2…E4–S4) and for the times 0.06 s, 0.12 s, 0.16 s and 0.20 s. Vertically, the soils are arranged from E1–S2 to E4–S4, while the horizontal axis represents the time evolution. Blue corresponds to very small displacements, whereas green, yellow and red indicate increasing displacement levels. The colour scale is adapted for each soil; at 0.20 s, the maximum displacements are on the order of ≈230 mm for E1–S2, ≈200 mm for E2–S3, ≈170 mm for E3–S3 and ≈140 mm for E4–S4.
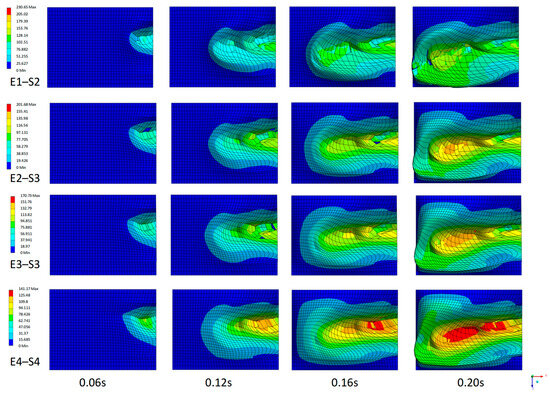
Figure 10.
Evolution of soil displacement [mm] around the base disc for the four soil types (E1–S2, E2–S3, E3–S3, E4–S4) at times t = 0.06, 0.12, 0.16 and 0.20 s.
The time evolution highlights the formation and growth of the “soil wedge” in front of the disc. At 0.06 s, the affected soil region is still relatively limited; the disc has penetrated only the superficial layer and the deformation is concentrated in the immediate vicinity of the edge. At 0.12 s, the soil wedge is clearly visible for all soils: in E1–S2, the mobilised soil volume is extensive, with high displacements over a considerable length in front of the disc, whereas in E3–S3 and E4–S4, the deformation is more compact and localised. At 0.16 s and 0.20 s, these differences become more pronounced: the sandy-loam soil E1–S2 shows large maximum displacements and a high volume of rearranged material, while the heavy clay soil E4–S4 deforms over a smaller region, with lower maximum displacements, indicating a higher global stiffness and increased resistance to flow.
Evolution of Disc Loading and Stabilised Force Levels
To establish an order-of-magnitude validation of the loading level predicted by the Explicit Dynamics model, reaction forces were extracted at the disc hub, with the forward travel direction aligned with the global X axis. Quantitative comparisons are reported at t = 0.20 s. For the uncoated base disc, the predicted longitudinal reaction Fx lies in the 1.80–2.80 kN range across the four representative soils (E3–S3: 1.81 ± 0.55 kN; E4–S4: 2.76 ± 0.78 kN; E2–S3: 1.49 ± 0.30 kN; E1–S2: 1.57 ± 0.30 kN), while the resultant hub reaction magnitude spans 2.49–5.66 kN (E3–S3 to E2–S3). Although these quantities are measured locally at the disc support, they provide a consistent per-disc mechanical indicator that can be assessed against published draught-force ranges. Field measurements on trailed disc harrows during primary tillage report total draught forces of approximately 15.9–16.8 kN at 3.62–6.84 km·h−1, corresponding to unit draught levels of 7.68–8.12 kN·m−1, confirming that disc-harrow draught commonly reaches the tens-of-kN domain under practical speeds and working depths [5]. Specifically, soil-bin experiments on a compact disc harrow reported a minimum draft of approximately 658 N, and a regression model calibrated over the investigated moisture and speed domain predicted draft values of roughly 0.68–1.13 kN, indicating that per-tool draft forces around 1 kN are realistic under controlled, low-speed test conditions [4]. Complementary studies also show a strong soil and speed dependence: in silty-loam soils, overall draught values of 2.68–4.54 kN were reported as speed increased from 2.54 to 5.77 km·h−1, rising to 5.30–7.08 kN in clay soils, consistent with the sensitivity of traction demand to soil strength and texture [7]. Instrumented multi-disc tandem harrows exhibit draught-force envelopes of roughly 14–42 kN; when normalised by a typical 28-disc configuration, this corresponds to approximately 0.5–1.5 kN per disc, which brackets the present single-disc predictions (≈1.0–1.6 kN in Fx) for a 24″ disc operating at 0.15 m working depth [2]. Collectively, these comparisons support that the present model yields physically plausible forward force levels, while any deviations from specific field values are expected due to the single-disc idealisation and the absence of full implement tractor dynamics.
3.2. Effect of APS Coatings on Stress Redistributions
The introduction of APS coatings significantly modifies both the level and the distribution of equivalent von Mises stresses in the coating zone for all disc–soil combinations. The dataset comprises, for each disc/coating–soil pair, the time evolution of the maximum equivalent stress in the coating zone over 0–0.20 s, the uncoated disc being used as a reference and compared with three coated variants: P1 (Metco 71NS), P2 (Metco 136F) and P3 (Metco 45C-NS).
The time evolution of the maximum equivalent stresses in the coating zone for soil E3–S3 (Figure 11) further highlights the differences between the four configurations. In the initial interval (up to ≈0.02–0.03 s), all curves show pronounced oscillations associated with the transient phase: contact establishment between disc and soil, wave propagation in the disc and coating, and rapid alternation between stick and slip at the interface. No additional numerical filtering of the stress histories and no artificial structural damping were applied. Dissipation is provided by material inelasticity and frictional contact within the explicit formulation. After this phase, the behaviour stabilises into a quasi-steady regime, which is used for quantitative comparison. The uncoated disc and the P1-coated disc exhibit maximum stresses fluctuating within a relatively narrow band, without a strong upward trend; P3 shows a gradual increase towards intermediate values, whereas P2 produces an increase in the maximum stress up to ≈446–448 MPa at the end of the simulation.
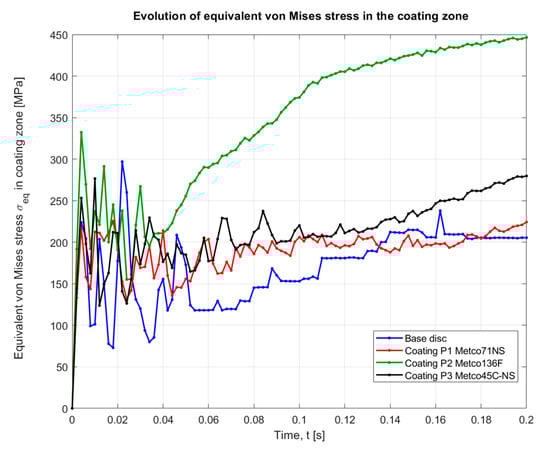
Figure 11.
Time evolution of the equivalent von Mises stress σeq in the coating zone for soil E3–S3, comparing the base disc and the coated discs with layers P1 (Metco 71NS), P2 (Metco 136F) and P3 (Metco 45C-NS).
In the quasi-steady regime at t = 0.20 s, Table 4 shows that, for the uncoated disc, the maximum equivalent von Mises stresses in the coating zone lie in the range ≈150–220 MPa, depending on soil type. For the same soils, coating P1 leads to maximum values of about 189–256 MPa, coating P2 to ≈421–448 MPa, and coating P3 to intermediate values of ≈219–280 MPa.
Table 4.
Maximum equivalent von Mises stress in the coating zone for the base disc and APS coatings P1–P3 in the four selected soils at different simulation times, and percentage difference relative to the uncoated disc at t = 0.20 s.
A representative example is soil E2–S3, considered the “normal” field scenario: at t = 0.20 s, the maximum stress in the coating zone is ≈219 MPa for the base disc, ≈224 MPa for P1, ≈445 MPa for P2 and ≈275 MPa for P3. This leads to a clear ranking:
- P2 (Metco 136F)—a stiff ceramic coating, produces the highest maximum stresses for all soils, with a strong increase relative to the base disc.
- P1 (Metco 71NS)—a more compliant layer, generally reduces or keeps at moderate levels the stresses compared to the reference disc, especially in E1–S2 and E2–S3.
- P3 (Metco 45C-NS)—an intermediate solution, with maximum stresses slightly higher than the base disc but much lower than P2.
The spatial distribution of stresses for soil E2–S3 at t = 0.20 s confirms this hierarchy (Figure 12). For P1, labels in the coating indicate stress levels in the range 136–178 MPa along the serrations, with moderate variation from tooth to tooth, while in the base material immediately beneath the coating the stresses are much lower, typically 3–17 MPa, indicating that P1 absorbs and attenuates a significant part of the load before it reaches the substrate. For P2, stresses in the coating increase markedly to 221–295 MPa, with local zones up to ≈393 MPa, whereas in the steel substrate they remain relatively low (≈2–12 MPa), revealing a sharp contrast between layer and substrate. For P3, the coating stresses are intermediate (≈168–200 MPa), and in the base material they remain at levels similar to P1 (≈3–13 MPa).
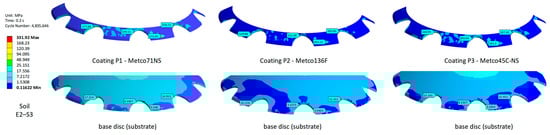
Figure 12.
Equivalent von Mises stresses at t = 0.20 s for soil E2–S3: upper row—coatings P1, P2 and P3; lower row—steel base disc (substrate), stresses beneath each coating.
From a mechanical standpoint, these findings are consistent with theoretical predictions for layered disc–coating–substrate systems. For P2, the much higher Young’s modulus compared to steel reduces the elastic deformability of the layer, limits the real contact area and increases local pressures and, consequently, von Mises stresses. High stiffness also causes stress localisation within a small volume of the coating and near the coating–substrate interface, promoting the formation of highly stressed zones. Coating P1, with a lower Young’s modulus than the substrate, deforms more under load, better accommodates soil irregularities and redistributes the load over a larger volume, thus reducing peak stresses in the coating zone at the expense of more extensive plastic strains in the layer. P3 lies between these two extremes: its Young’s modulus, close to that of steel, ensures good elastic compatibility at the interface, reduces stiffness gradients and limits stress concentration in this region, leading to moderate stress levels with a more favourable spatial distribution.
From the viewpoint of contact fatigue, three distinct scenarios emerge:
- P2—a rigid ceramic coating with very high maximum stresses in the coating zone and narrow plastic zones, making it the most susceptible to pitting, spalling and delamination, especially in silty-clay and heavy clay soils where contact loading is most severe.
- P1—a more compliant coating with comparatively low maximum stresses but extended plastic zones; the main risk is associated with the accumulation of cyclic plastic strains and progressive surface wear.
- P3—a coating operating under a balanced stress regime, with moderate stress levels and relatively uniform distribution, leading to a lower risk of brittle cracking than P2 and reduced sensitivity to excessive plasticisation compared to P1, thus offering the best overall mechanical performance within the investigated operating range.
4. Discussion
4.1. Influence of Soil Mechanical Properties
Figure 13 presents the correlation between maximum soil displacement and maximum Coating-zone stress, summarises this trend: large soil deformations (E1–S2) are generally associated with lower stress levels in the coatings, whereas stiffer and more cohesive soils (E3–S3, E4–S4) produce higher stresses, particularly for P2. For coatings P1 and P3, the effect of soil stiffness is more moderate: although maximum displacements decrease from E1–S2 to E4–S4, the ability of P1 to plasticise and the ability of P3 to redistribute stresses over a larger volume keep the maximum stresses within ≈220–260 MPa for P1 and ≈220–280 MPa for P3.
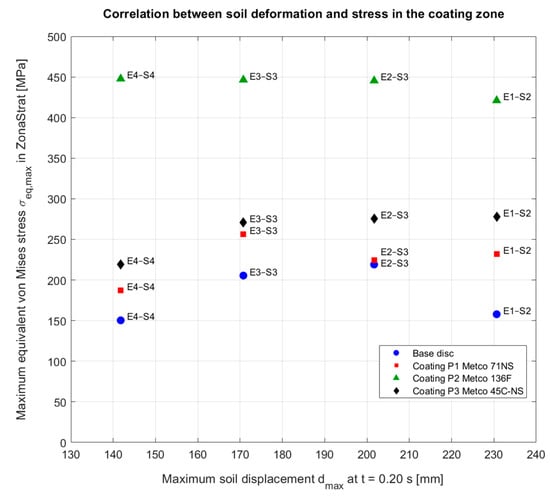
Figure 13.
Correlation between maximum soil displacement at t = 0.20 s and maximum equivalent von Mises stress in the coating zone for all soils and disc/coating configurations. Larger soil deformation is generally associated with lower stress levels in the coating zone, while stiffer soils produce higher stresses in the coatings.
For the uncoated disc, this evolution does not translate into an increase in coating zone stresses. At t = 0.20 s, the highly deformable soil E1-S2, with maximum displacements of ≈230 mm, leads to a maximum equivalent stress of ≈158 MPa, while intermediate-stiffness soils E2–S3 and E3–S3 produce higher stress levels of about ≈219 MPa and ≈205 MPa, respectively. In soil E4–S4, despite the more localised deformation and smaller maximum displacements, the maximum stress returns to a value similar to E1–S2, around 150 MPa. This indicates that intermediate-stiffness soils (E2–S3, E3–S3) may induce more severe contact conditions for the base disc than very soft or extremely plastic soils.
The influence of soil properties is much more pronounced for stiff coatings, especially P2. As the soil becomes clayey, global soil deformation is constrained, and an increasing fraction of the input work is transferred to the disc and coating in the form of high normal pressures and tangential loads. For coating P2, the maximum stresses in the coating zone exceed 420 MPa for all soils and reach ≈446–448 MPa in E3–S3 and E4–S4, precisely where Figure 10 shows a compact soil wedge and strongly concentrated deformation in the vicinity of the edge.
4.2. Influence of Disc–Soil Friction on Stresses
Disc–soil friction is the third key factor in the mechanical response, alongside the elastic/plastic properties of the disc and coatings and the mechanical properties of the soil. In the numerical model, the interface was described by a Coulomb friction law with static (μs) and dynamic coefficients (μd) defined for each material–soil pair, the values used being summarised in Table 3.
The effect of these coefficients on stresses is captured in Figure 14, where for all disc/coating–soil combinations, the maximum equivalent stress in the coating zone at t = 0.20 s is plotted as a function of μs. Each point represents a specific soil and contact material; its horizontal position is defined by μs, while its vertical position corresponds to σeq,max; Table 4.
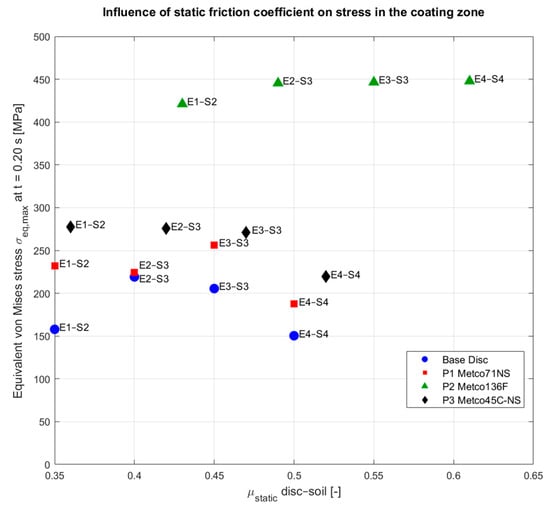
Figure 14.
Relationship between static disc–soil friction coefficient and maximum equivalent von Mises stress in the coating zone at t = 0.20 s for the base disc and APS coatings P1–P3 in soils from E1–S2 to E4–S4.
The point cloud reveals a clear increasing trend of equivalent stresses with increasing friction, especially for stiff coatings. For P2 (Metco 136F), the points cluster at the upper-right corner of the diagram: for μs between 0.43 and 0.61, the maximum coating-zone stresses range between ≈421 MPa (E1–S2) and ≈448 MPa (E4–S4). In contrast, the base disc and P1 (with 0.35–0.50 friction coefficients) occupy the lower portion of the plot, with maximum stresses of ≈150–230 MPa for the uncoated disc and ≈190–260 MPa for P1, whereas P3 lies in-between with μs = 0.36–0.52 and σeq,max ≈ 220–280 MPa.
A direct comparison for a given soil highlights the combined role of friction and stiffness. In E3–S3, increasing μs from 0.45 (base disc and P1) to 0.55 (P2) leads to an increase of the maximum stress from ≈205–256 MPa to ≈447 MPa. For the same soil, coating P3 with μs = 0.47 yields an intermediate value of ≈271 MPa, confirming that moderately higher friction than steel amplifies stresses. A similar pattern is observed for E2–S3 and E4–S4, where high friction in cohesive soils results in the highest σeq,max levels for P2.
The results show that disc–soil friction acts as a stress amplifier in the coating zone, with an effect that becomes stronger as the contact material stiffness increases and the soil becomes more cohesive. Coating P2, combining the highest friction coefficients with the highest Young’s modulus, consistently occupies the extreme region of the diagram, associated with very high stress levels; the base disc and P1 develop significantly lower stresses, while P3 behaves as an intermediate solution. These findings confirm that a realistic assessment of the contact-fatigue risk in coated discs must explicitly include disc–soil friction parameters, in addition to the mechanical properties of coatings and soils.
4.3. Influence of Plastic Behaviour on Stress Redistribution
The steel base disc shows a high initial yield stress (A ≈ 590 MPa) and a significant strain-hardening capacity, promoting the formation of a relatively extended subsurface plastic zone where local stress peaks are progressively attenuated. Coating P1 (Metco 71NS) has a markedly lower yield stress (A ≈ 283 MPa) and moderate hardening, entering the plastic regime at lower stress levels and conforming more readily to soil surface irregularities. Coating P2 (Metco 136F) exhibits the highest yield stress (A ≈ 708 MPa) combined with limited hardening, its overall behaviour being close to elastic–perfectly plastic. Coating P3 (Metco 45C-NS) shows an intermediate yield stress (A ≈ 328 MPa) and stronger hardening than P2, leading to a controlled plasticisation and an efficient stress redistribution over a larger volume.
The combined effect of these differences is reflected in the redistribution of equivalent von Mises stresses in the coating zone. For the uncoated disc, maximum stresses in the quasi-steady regime remain below the yield strength, but the initial transient activates local plasticity; due to effective hardening, the plastic zone grows and tends towards an elasto–plastic domain. For P1, the low yield stress makes the material work close to the plastic domain even at later times, with extended plastic zones that reduce stress peaks at the expense of significant accumulated plastic strains. For P2, the very high yield stress and modest hardening promote plasticisation in small, highly stressed volumes, where equivalent stresses remain very high (above 430–440 MPa), favouring a brittle, crack-prone regime. Coating P3 lies between these extremes: it yields at moderate stress levels, its plastic zone expands enough to smooth local peaks, and σeq,max remains at intermediate values (≈270–280 MPa), without extremely localised stress concentrations.
To quantify the relative severity of contact for each material, a dimensionless stress ratio SR = σeq,max/σy0 was introduced and presentation in Figure 15 for soil E3–S3. This ratio directly compares the maximum stress level in the coating zone with the yield strength of each material. Values closer to unity indicate a more severe contact regime with respect to the material yield strength.
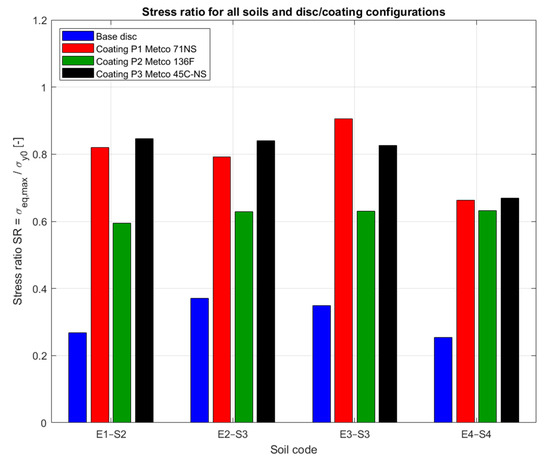
Figure 15.
Stress ratio σeq,max/σy0 for all soils and base disc and coatings P1, P2 and P3.
5. Conclusions
Based on explicit FEM simulations of a notched harrow disc, uncoated and coated with three APS layers (P1—Metco 71NS, P2—Metco 136F, P3—Metco 45C-NS), in four representative agricultural soils (E1–S2, E2–S3, E3–S3, E4–S4), the main conclusions are as follows:
- The maximum soil displacements and the shape of the soil wedge vary significantly from the sandy-loam soil E1–S2 to the more cohesive and stiffer soils E3–S3 and E4–S4. Stiffer, more cohesive soils reduce the amplitude of soil deformation but lead to more severe contact conditions and higher stresses in the disc and coatings.
- For the steel uncoated disc, maximum equivalent von Mises stresses in the coating zone at t = 0.20 s lie in the range ≈150–220 MPa, depending on soil type, below the material yield strength. Intermediate-stiffness soils (E2–S3, E3–S3) generate the highest coating-zone stresses, indicating that they may be more critical for the base disc than highly deformable or extremely plastic soils.
- APS coatings markedly modify both the magnitude and distribution of stresses in the coating zone: P2 (Metco 136F) systematically produces the highest maximum stresses (≈421–448 MPa), with pronounced localisation within the layer, especially in cohesive soils; P1 (Metco 71NS) keeps maximum stresses at levels close to or slightly above those of the uncoated disc while shielding the substrate through extended plastic zones in the coating; P3 (Metco 45C-NS) exhibits an intermediate regime, with moderate maximum stresses (≈220–280 MPa) and a favourable volumetric distribution, providing the most balanced overall response among the three coatings.
- Increasing the static disc–soil friction coefficient systematically raises coating-zone stresses. Configurations that combine the stiff coating P2 with elevated friction levels in cohesive soils consistently exhibit the most unfavourable stress state, being associated with the highest σeq,max values.
- The plasticity parameters (A, B, n) govern the development of plastic zones and stress redistribution: the base disc and P3, with moderate yield strengths and effective hardening, tend to attenuate stress peaks through relatively extended plastic zones; P1 further reduces peak stresses by enhanced plasticisation in the coating, with an increased potential for accumulated plastic strain; P2, with a very high yield strength and limited hardening, concentrates plasticity in small volumes and maintains very high equivalent stresses, especially in stiff, cohesive soils.
- Mechanical properties of the disc and coatings (H, E, Johnson–Cook parameters) and disc–soil friction coefficients calibrated via microindentation and microscratch tests were directly propagated into the explicit FEM model, ensuring a consistent link between specimen-scale characterisation and disc-scale behaviour in the agricultural soils considered.
Regarding soil-dependent coating selection, within the investigated operating point (forward speed 7 km·h−1, working depth 0.15 m, prescribed disc angles and mean normal load), P1 (Metco 71NS) appears particularly suitable for light-to-medium soils (E1–S2, E2–S3), where soil flow is pronounced and the main objective is to protect the base disc and reduce the risk of brittle contact fatigue while accepting progressive coating wear. Under the same operating conditions, P3 (Metco 45C-NS) provides the most balanced response for medium-to-stiff soils (E2–S3, E3–S3, E4–S4), combining good resistance with moderate stress levels in both coating and substrate. While, for the analysed speed and depth, P2 (Metco 136F) should be reserved for highly abrasive environments and applied with caution in cohesive soils due to its comparatively critical stress regime. It should be noted that these coating–soil recommendations are conditioned by the restricted operational envelope adopted in this study; variations in travel speed and working depth are expected to modify the force level, slip conditions and contact pressure field, and may therefore shift the relative ranking of coatings.
Surface material selection (coating type, microstructure, roughness and finishing treatments) offers a practical route to adjust the effective disc–soil friction and, consequently, the stress level. However, the above implications on friction should be interpreted in the context of the present operating point; a broader exploration of speed or depth effects on frictional response and stress regimes will be addressed in future parametric work.
The proposed framework shows that explicit FEM simulations informed by experimentally measured mechanical properties can support design-oriented comparisons at a fixed operating condition—namely coating selection, verification of stress regimes for dominant regional soils and the definition of inspection intervals tailored to each coating–soil combination—while full generalisation to other operating settings requires additional simulations and experimental confirmation.
Author Contributions
Conceptualisation, C.M. and A.T.; methodology, A.T. and B.I.; software, A.T.; validation, M.B. and V.V.; formal analysis, V.N.A.; investigation, B.I. and F.C.L.; resources, V.N.A.; data curation, M.B. and B.I.; writing—original draft preparation, A.T. and F.C.L.; writing—review and editing, B.I.; visualisation, I.M. and V.V.; supervision, C.M. and B.I.; project administration, C.M. and I.M.; funding acquisition, C.M. and V.N.A. All authors have read and agreed to the published version of the manuscript.
Funding
This work was supported by a grant from the Ministry of Research, Innovation and Digitalization, CNCS-UEFISCDI, project number PN-IV-P8-8.3-ROMD-2023-0108, within PNCDI IV.
Institutional Review Board Statement
Not applicable.
Informed Consent Statement
Not applicable.
Data Availability Statement
The original contributions presented in the study are included in the article, further inquiries can be directed to the corresponding authors.
Conflicts of Interest
The authors declare no conflicts of interest.
Abbreviations
| APS | Atmospheric Plasma Spraying |
| FE | Finite Element |
| DEM | Discrete element methods |
| MBD | Multibody Dynamics |
| DA | disc angle |
| TA | tilt angle |
| BISO | Bilinear Isotropic Hardening |
| SEM | Scanning electron microscopy |
| EOS | Equation Of State |
| FAO | Food and Agriculture Organization |
| WRB | World Reference Base for Soil Resources |
| COF | coefficient of friction |
References
- Kozachenko, O.; Aliiev, E.; Sedykh, K. Results of investigation of the spring shank disc harrow performance. UPB Sci. Bull. Ser. D Mech. Eng. 2021, 83, 123–140. [Google Scholar]
- Upadhyay, G.; Raheman, H. Specific draft estimation model for offset disc harrows. Soil Tillage Res. 2019, 191, 75–84. [Google Scholar] [CrossRef]
- Ahmadi, I. A draught force estimator for disc harrow using the laws of classical soil mechanics. Biosyst. Eng. 2018, 171, 52–62. [Google Scholar] [CrossRef]
- Okyere, F.G.; Qasim, W.; Basak, J.K.; Khan, F.; Lee, Y.J.; Park, J.; Arulmozhi, E.; Yoon, Y.C.; Kang, D.S.; Kim, H.T. Analysis of draft force requirement of a compact disc harrow and model development for future predictions. J. Biosyst. Eng. 2019, 44, 47–56. [Google Scholar] [CrossRef]
- Kogut, Z.; Sergiel, L.; Żurek, G. The effect of the disc setup angles and working depth on disc harrow working resistance. Biosyst. Eng. 2016, 151, 328–337. [Google Scholar] [CrossRef]
- Damanauskas, V.; Velykis, A.; Satkus, A. Efficiency of disc harrow adjustment for stubble tillage quality and fuel consumption. Soil Tillage Res. 2019, 194, 104311. [Google Scholar] [CrossRef]
- Muhsin, S.H. Comparison Between Draft Force Requirement and Tractor Speed of Mounted Disk Harrow and Offset Disk Harrow. Basrah J. Agric. Sci. 2017, 30, 1–15. [Google Scholar] [CrossRef]
- Sadek, M.A.; Chen, Y.; Zeng, Z. Draft force prediction for a high-speed disc implement using discrete element modelling. Biosyst. Eng. 2021, 202, 133–141. [Google Scholar] [CrossRef]
- Ahmad, F.; Qiu, B.J.; Ding, Q.S.; Ding, W.M.; Khan, Z.M.; Shoaib, M.; Chandio, F.A.; Rehim, A.; Khaliq, A. Discrete element method simulation of disc type furrow openers in paddy soil. Int. J. Agric. Biol. Eng. 2020, 13, 103–110. [Google Scholar] [CrossRef]
- Khosravani, A.; Desbiolles, J.M.A.; Fielke, J.M.; Ucgul, M.; Saunders, C. Prediction of single disc seeding system forces, using a semi-analytical and discrete element method (DEM). Agriculture 2023, 13, 206. [Google Scholar] [CrossRef]
- Paraschiv, G.; Maican, E.; Biriş, S.Ș.; Costoiu, M.; Paraschiv, I. Finite elements analysis of a harrow’s disc train during the working process. In Proceedings of the 39th Symposium “Actual Tasks on Agricultural Engineering”, Opatija, Croatia, 22–25 February 2011. [Google Scholar]
- Ibrahmi, A.; Bentaher, H. Simulation of tillage forces and soil movement during soil–disc plow interaction using FEM. Sci. Rep. 2025, 15, 36022. [Google Scholar] [CrossRef]
- Ucgul, M. Simulating soil–disc plough interaction using Discrete Element Method–Multi-Body Dynamic coupling. Agriculture 2023, 13, 305. [Google Scholar] [CrossRef]
- Pásthy, L.; Farkas, Z.J.; Haba, T.; Tamás, K. Development of a multi-way coupled discrete-finite element method simulation procedure for modelling soil-passive vibration tool interaction. Comput. Electron. Agric. 2024, 216, 108459. [Google Scholar] [CrossRef]
- Nalavade, P.P.; Soni, P.; Salokhe, V.M.; Niyamapa, T. Comparative Performance of Standard, Notched and Spiral-Notched Tillage Discs. Int. Agric. Eng. J. 2011, 20, 18–26. [Google Scholar]
- Zeng, Z.; Thoms, D.; Chen, Y.; Ma, X. Comparison of soil and corn residue cutting performance of different discs used for vertical tillage. Sci. Rep. 2021, 11, 2537. [Google Scholar] [CrossRef]
- Chirende, B.; Li, J.Q.; Vheremu, W. Application of Finite Element Analysis in Modeling of Bionic Harrowing Discs. Biomimetics 2019, 4, 61. [Google Scholar] [CrossRef]
- Malvajerdi, A.S. Wear and coating of tillage tools: A review. Heliyon 2023, 9, e16669. [Google Scholar] [CrossRef] [PubMed]
- Yazıcı, A. Wear on steel tillage tools: A review of material, soil and dynamic conditions. Soil Tillage Res. 2024, 242, 106161. [Google Scholar] [CrossRef]
- Munteanu, C.; Melnic, I.; Istrate, B.; Hardiman, M.; Gaiginschi, L.; Lupu, F.C.; Arsenoaia, V.N.; Chicet, D.L.; Zirnescu, C.; Badiul, V. A comprehensive review of improving the durability properties of agricultural harrow discs by atmospheric plasma spraying (APS). Coatings 2025, 15, 632. [Google Scholar] [CrossRef]
- AMCO Manufacturing Company. F17 Double Offset Tandem: Operation, Maintenance and Set-Up Instructions; AMCO Manufacturing Company: Yazoo City, MS, USA, 2023. [Google Scholar]
- Zhang, P.; Li, S.X.; Zhang, Z.F. General relationship between strength and hardness. Mater. Sci. Eng. A 2011, 529, 62–73. [Google Scholar] [CrossRef]
- ASTM E18-20; Standard Test Methods for Rockwell Hardness of Metallic Materials. ASTM International: West Conshohocken, PA, USA, 2020.
- Oliver, W.C.; Pharr, G.M. Measurement of hardness and elastic modulus by instrumented indentation: Advances in understanding and refinements to methodology. J. Mater. Res. 2004, 19, 3–20. [Google Scholar] [CrossRef]
- Viana, C.A.A.; Scaduto, G.F.; Menezes, M.Á. A new computational method for determining the parameters of Johnson–Cook model. In Proceedings of the 24th ABCM International Congress of Mechanical Engineering (COBEM 2017), Curitiba, Brazil, 3–8 December 2017. [Google Scholar]
- Burley, M.; Campbell, J.E.; Dean, J.; Clyne, T.W. Johnson–Cook parameter evaluation from ballistic impact data via iterative FEM modelling. Int. J. Impact Eng. 2018, 112, 180–192. [Google Scholar] [CrossRef]
- Postek, E.; Sadowski, T. Temperature Effects during Impact Testing of a Two-Phase Metal–Ceramic Composite Material. Materials 2019, 12, 1629. [Google Scholar] [CrossRef] [PubMed]
- Bredemann, S. Specific Heat Capacity of Metals—Table. MechBlog, MISUMI USA, 2025. Available online: https://us.misumi-ec.com/blog/specific-heat-capacity-of-metals/ (accessed on 11 November 2025).
- Kyoritsu Gokin Co., Ltd. EVERLOY Cemented Carbide Tools: General Catalog; Kyoritsu Gokin Co., Ltd.: Nishinomiya, Japan, 2025. [Google Scholar]
- Liao, Y. Practical Electron Microscopy and Database: An Online Book, 2nd ed.; Cr2O3—Table 1828: Properties of Cr2O3. 2006. Available online: https://www.globalsino.com/EM/page1828.html (accessed on 11 November 2025).
- Shrivastava, S. (Ed.) Medical Device Materials: Proceedings from the Materials & Processes for Medical Devices Conference 2003, 8–10 September 2003, Anaheim, CA, USA; ASM International: Materials Park, OH, USA, 2004. [Google Scholar]
- Li, H.; Zhao, W.; Gao, X.; Shi, W.; He, N. Establishment of a constitutive model for tungsten carbide with different cobalt content and grain size based on the split Hopkinson pressure bar impact test. J. Mech. Sci. Technol. 2024, 38, 1789–1801. [Google Scholar] [CrossRef]
- Kar, S.; Bandyopadhyay, P.P.; Paul, S. Effect of arc-current and spray distance on elastic modulus and fracture toughness of plasma-sprayed chromium oxide coatings. Friction 2018, 6, 387–394. [Google Scholar] [CrossRef]
- AZoM. Super Alloy HAVAR (UNS R30004). AZoM.com—AZoM, 2012. Available online: https://www.azom.com/article.aspx?ArticleID=7658 (accessed on 11 November 2025).
- Postek, E.; Sadowski, T. High-Velocity Impact of 2-Phase WC/Co Composite Plate—Beginning of the Process. Arch. Metall. Mater. 2020, 65, 265–274. [Google Scholar] [CrossRef]
- ACNIS Group. Cobalt-Chrome (Co–Cr–Mo) FT 029—Version 0: Technical Datasheet; ACNIS Group. Available online: www.acnis-group.com (accessed on 11 November 2025).
- Laine, L.; Sandvik, A. Derivation of mechanical properties for sand. In Proceedings of the 4th Asia-Pacific Conference on Shock and Impact Loads on Structures, Singapore, 27–29 November 2001; CI-Premier PTE Ltd.: Singapore, 2001; pp. 361–368. [Google Scholar]
- Laine, L. Study of planar ground shock in different soils and its propagation around a rigid block. In Proceedings of the 77th Shock and Vibration Symposium; Shock and Vibration Information Analysis Center, Monterey, CA, USA, 29 November–2 October 2006; pp. 1–10. [Google Scholar]
- Laine, L.; Larsen, O.P. Re-implementation and Characterization of Sjöbo Dry Sand in OpenRadioss: Improving Ground Shock Predictions through Triaxial and Wave Velocity Testing. In Proceedings of the 15th International Conference on Shock & Impact Loads on Structures, Gothenburg, Sweden, 12–13 June 2025; pp. 1–13. [Google Scholar]
- Patriche, C.V.; Roșca, B.; Pîrnău, R.G.; Vasiliniuc, I. Spatial Modelling of Topsoil Properties in Romania Using Geostatistical Methods and Machine Learning. PLoS ONE 2023, 18, e0289286. [Google Scholar] [CrossRef]
- Holmer, A.S.; Boesze, I.; Moosbauer, G.; Lindauer, S.; Völkel, J. Neolithic Formation of Chernozem in South-Eastern Germany? Catena 2025, 248, 108543. [Google Scholar] [CrossRef]
- ScienceDirect. Vertisol—An Overview. In ScienceDirect Topics: Agricultural and Biological Sciences; Elsevier: Amsterdam, The Netherlands; Available online: https://www.sciencedirect.com/topics/agricultural-and-biological-sciences/vertisol (accessed on 12 November 2025).
- ASTM D7187-15; Standard Test Method for Measuring Mechanistic Properties of Asphalt Binder Using a Dynamic Shear Rheometer (DSR). ASTM International: West Conshohocken, PA, USA, 2015.
- Fine Software, Ltd. Table of Ultimate Friction Factors for Dissimilar Materials. GEO5 Online Help—Influence of Friction between Soil and Back of the Structure. Available online: https://www.finesoftware.eu/help/geo5/en/table-of-ultimate-friction-factors-for-dissimilar-materials-01/ (accessed on 12 November 2025).
- Mat Su, A.S.; Ahmad, D. Friction Coefficients of Selected Agricultural Soil and Agro-Products—A Review. In Proceedings of the 2nd Mytribos Symposium, Faculty of Mechanical Engineering, Universiti Teknologi Malaysia, Skudai, Johor, Malaysia, 8 October 2017; pp. 19–21. [Google Scholar]
Disclaimer/Publisher’s Note: The statements, opinions and data contained in all publications are solely those of the individual author(s) and contributor(s) and not of MDPI and/or the editor(s). MDPI and/or the editor(s) disclaim responsibility for any injury to people or property resulting from any ideas, methods, instructions or products referred to in the content. |
© 2025 by the authors. Licensee MDPI, Basel, Switzerland. This article is an open access article distributed under the terms and conditions of the Creative Commons Attribution (CC BY) license.