Abstract
Accurate and real-time detection of rice pests is crucial for protecting crop yield and advancing precision agriculture. However, existing models often suffer from limitations in small-object recognition, background interference, and computational efficiency. To overcome these challenges, this study proposes an improved lightweight detection framework, CRRE-YOLO, developed based on YOLOv11. The model integrates four enhanced components—the EIoU loss function, C2PSA_ELA module, RPAPAttention mechanism, and RIMSCConv module—to improve localization accuracy, feature extraction, and fine-grained pest recognition. Experimental results on the RP11-Augmented dataset show that CRRE-YOLO achieves 0.852 precision, 0.787 recall, 83.6% mAP@0.5, and 71.9% mAP@0.5:0.95, outperforming YOLOv11 by up to 7.8% and surpassing YOLOv8 and RT-DETR in accuracy while maintaining only 2.344M parameters and 6.1G FLOPs. These results demonstrate that CRRE-YOLO achieves an optimal balance between accuracy and efficiency, providing a practical and deployable solution for real-time rice pest detection and offering potential for integration into smart farming and edge computing applications.
1. Introduction
As a staple food for more than half of the world’s population, rice is an indispensable crop [1]. Its industrial utility, extending to sectors like brewing and sugar manufacturing, further underscores its critical importance. However, its yield and quality are constantly jeopardized by destructive insect pests such as the brown planthopper, rice leaf folder, and rice stem borer, which cause significant yield losses and economic impacts each year [2]. Traditional field survey approaches, which depend on the skills of agricultural specialists, are inefficient, subjective, and costly, and are thus inapplicable to the timely and large-scale monitoring of pests [3].
To tackle these issues, research began to focus on traditional image processing and machine learning techniques. All of these traditional approaches are based on the combination of manually designed low-level visual features (e.g., color, texture) [4] and machine learning classifiers (e.g., SVM, AdaBoost) [5]. The above studies differ in their main contributions: one group focuses on the innovation of low-level visual features, for instance, Thenmozhi et al. [6] used geometric shape features and Pantazi et al. [7] used LBP texture features; another group emphasizes the choice and optimization of classifiers, for instance, Wang et al. [8] constructed an identification system based on SVM and Yao et al. [9] used the AdaBoost algorithm for pest counting. Although the above methods could achieve high accuracy in certain situations and even have advantages of being lightweight, the inherent defect of these methods was the high dependence on manual designed features. That is, the generalization performance of these methods was poor. It was hard to extend these methods to certain challenging problems, such as complex field backgrounds, pest occlusion, and morphological variations [10]. In summary, compared with purely manual methods, these traditional technologies could improve recognition efficiency and objectivity in certain situations, but these methods were usually only applicable to certain specific pests in certain specific scenarios with high dependence on manual designed features. The generalization performance of these methods was poor and these methods required high-quality images. Therefore, these technologies were hard to extend to real-world fully automated monitoring based on complex field backgrounds [11].
Early rice pest monitoring technology systems initially relied heavily on manual methods, which suffered from issues such as low sampling density and high subjective bias. The advancement of computer vision has introduced new solutions for the automated identification of rice pests through deep learning [12]. With the constantly improving computing capabilities and deep learning technologies, research on intelligent pest detection in agriculture has developed rapidly [13]. Deep learning removes the need for manually designing features and can directly learn hierarchical feature representations from raw images for end-to-end pest identification, localization, and counting [14], and can provide more robust and powerful solutions for crop protection [15]. Shi et al. [16] enhanced the R-FCN framework by integrating DenseNet-121 for insect detection in grain storage. To mitigate missed detections, they incorporated soft-NMS, while data augmentation and multiscale training were employed to further improve detection accuracy; Shen et al. [17] combined a physical insect trapping device and stored grain pest Faster R-CNN; Rong et al. [18] improved the recognition accuracy of small pests on yellow sticky trap by designing structural improvements on Feature Pyramid Network (FPN) of Mask R-CNN. These models have powerful feature representation ability and high localization precision. In terms of agricultural application, these models have also been proven to have great application potential. However, as a two-stage model, it has slow inference speed and high computational complexity due to its multi-step process. The limitation restricts its application to edge devices widely used in field environments [19]. Single-stage detectors, including SSD and YOLO series, directly predict the object categories and bounding boxes from input images in a single forward process, which greatly improves the inference efficiency with an end-to-end strategy [20]. Therefore, these models are increasingly applied in real-time agricultural applications. For these single-stage detectors, a large number of works focus on applying them to pest detection. For example, Dong et al. [21] proposed Pest Lite, which reduced the parameters of YOLOv5 to only 1.2M while keeping the mAP of 85.7%. Yang et al. [22] proposed that Maize-YOLO has a better balance between accuracy and efficiency on maize pest detection. While Yin et al. [23] applied JujubeSSD, which was based on SSD, achieving 97.1% mAP on jujube disease spot detection, it has some sacrifices on inference time.
Although these remarkable achievements have been obtained, applying deep learning for rice pest detection in complex field settings still confronts the following challenges: First, it is hard to reach a proper balance between detection accuracy and computational efficiency; many excellent models are too big and expensive to be applied on edge devices [24]. Second, the multiscale characteristics of rice pests exist in two aspects: one is that there are large size variations between different rice species; another is that there are also large size variations between larval and adult stages of the same rice species [25]. These challenges make it hard for models to adapt to different target sizes. Third, complex field backgrounds, occlusions, and diverse lighting conditions will greatly impair model performance; therefore, more feature discrimination should be enhanced, and robustness should be improved [26].
In this paper, the main contributions can be summarized into the following four aspects:
- (1)
- To enhance the feature-extraction capacity, we design a C2PSA_ELA module, which introduces an Efficient Local Attention (ELA) mechanism to improve the model’s ability to capture fine-grained pest features. This mechanism capably relieves the problem of feature suppression in complex backgrounds.
- (2)
- To improve the localization accuracy, we use the EIoU loss function to replace the commonly used CIoU. By taking advantage of more reasonable geometric constraints, the model converges faster, and the bounding box regression is more accurate. Especially when facing multiscale pests, it can provide more accurate bounding box regression for small targets.
- (3)
- To enhance the multiscale perception of the network, we build a lightweight RIM-SCConv module. It uses multiscale depthwise separable convolutions to enhance the network’s perception of pests with different shapes and sizes; meanwhile, it carefully maintains low computational cost.
- (4)
- To adaptively reinforce the feature, we propose the RPAPAttention mechanism. As an innovative component, it uses frequency domain enhancement combined with a dynamic gating strategy to adaptively reinforce some important textural details of pests, so as to increase the discriminative power of feature representation against background interference and occlusion.
The experimental results on the comprehensively augmented rice pest dataset (RP11-Augmented) show that compared with the baseline and several state-of-the-art models, our model achieves significant improvements on both detection accuracy and lightweight design, which further verifies the effectiveness of the above improvements. These contributions provide a practical and effective solution to achieve precise and intelligent pest monitoring in complex farmland settings.
2. Materials and Methods
2.1. Image Dataset
This research utilizes the RP11 (Rice Pest 11) dataset, crafted by Ding et al. [27], as its foundation. The RP11 dataset came from the large-scale IP102 pest dataset [28] through a process of screening, cleaning, and professional re-annotation by plant protection experts based on strict morphological criteria. It is significantly different from the original dataset in terms of taxonomy, annotation accuracy, and image quality.
The RP11 dataset is built upon images from two sources. One is the manually selected high-quality adult insect images from “rice” as a super-category of IP102. The other is the extra image datasets scraped from some authoritative web databases, such as GBIF and Insect Images, by a Latin name-based web crawler. These were added to balance the category distribution and were subsequently verified by experts. Figure 1 shows representative image samples from the adult pest categories in the RP11 dataset. The distribution of labels across categories is provided in Table 1.
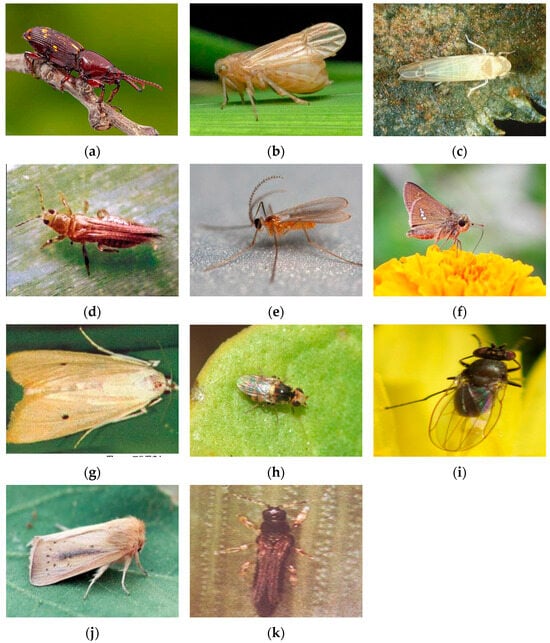
Figure 1.
Samples of the 11 pest classes: (a) Curculionidae; (b) Delphacidae; (c) Cicadellidae; (d) Phlaeothripidae; (e) Cecidomyiidae; (f) Hesperiidae; (g) Crambidae; (h) Chloropidae; (i) Ephydridae; (j) Noctuidae; (k) Thripidae.

Table 1.
Distribution of labels across categories.
In order to enhance the generalization ability of the model in a complex field environment and prevent over-fitting, we apply offline data augmentation to the training set. We adopt both geometric transformation and content transformation to expand the training set. Geometric transformations, including random scaling and cropping, horizontal flipping, translation, and rotation, are used to simulate the variation of target scale and spatial position. And content transformations, including adjusting brightness and injecting Gaussian noise, are used to simulate the variation of lighting conditions and sensor noise from different capture devices. The whole data augmentation flow is shown in Figure 2.

Figure 2.
Data augmentation.
These augmentation strategies collectively enhance the model’s adaptability to varying illumination, occlusion, and sensor noise, improving its robustness in complex field environments.
The dataset was randomly divided into training, validation, and test subsets with a ratio of 7:2:1 (3189/911/457 images). To prevent data leakage, each image in the RP11 dataset was assigned to only one subset, ensuring no overlap between training, validation, and test data.
2.2. CRRE-YOLO
YOLO series is a mainstream architecture in object detection. It is effective at balancing real-time capability and accuracy [29]. This paper adopts YOLOv11n [30] as the baseline model. YOLOv11n is optimized in structure to get a better feature extractor and inference. YOLOv11n can be rescaled to get other variants with more or fewer parameters and representational ability, such as (n, s, m, l, x). To meet the requirements of edge computing and real-time analysis in agricultural applications, we choose the lightest and fastest variant in YOLOv11n as our baseline, YOLOv11n.
However, when applying YOLOv11n to paddy pest detection, we found that it had some limitations in a complex field environment. Firstly, it was hard for YOLOv11n to extract delicate pest features. Secondly, it was not easy to regress accurate bounding boxes for targets of different sizes. Thirdly, it was difficult for YOLOv11n to adapt to complex scenes.
To address these issues, we propose a new model, CRRE-YOLO, which introduces four innovative components to enhance the detection performance in an iterative way: C2PSA_ELA, an Efficient Local Attention module; RPAPAttention, an Adaptive Perceptual Attention mechanism; RIMSCConv, a lightweight MultiScale Convolution module; and EIoU loss function. The whole architecture of CRRE-YOLO is shown in Figure 3.
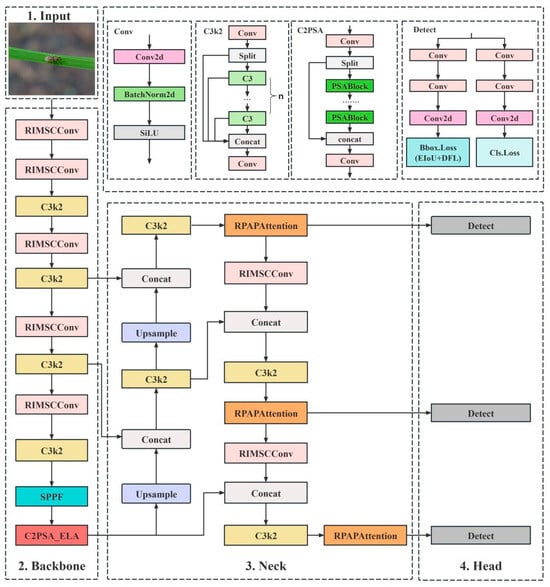
Figure 3.
CRRE-YOLO architecture diagram.
The design of CRRE-YOLO follows a problem-driven rationale aimed at the specific challenges of rice-pest detection. Rice pests are typically small, densely distributed, and often visually similar to background textures under complex field illumination, while real-time edge deployment demands high computational efficiency.
To address these issues, four complementary modules were integrated:
EIoU loss improves localization stability for small and overlapping pests.
C2PSA_ELA enhances local-detail extraction to distinguish fine pest features from complex backgrounds.
RPAPAttention strengthens texture discrimination and robustness to occlusion or illumination changes.
RIMSCConv provides efficient multiscale perception with minimal computation for edge devices.
Together, these modules form a compact and efficient architecture that directly addresses small-target recognition, background interference, and computational efficiency constraints, establishing a clear methodological rationale for the proposed CRRE-YOLO framework.
Each component plays a key role in addressing these challenges. C2PSA_ELA enhances fine-grained feature perception, RPAPAttention improves feature discrimination under complex backgrounds, RIMSCConv strengthens multiscale adaptability, and EIoU loss refines bounding-box regression. Together, these modules greatly enhance the model’s robustness and detection accuracy in real-world paddy fields.
2.2.1. C2PSA_ELA
Compared with rice leaves and panicles, rice pests target present a high degree of similarity with their background. For example, Curculionidae and Delphacidae are almost indistinguishable from rice leaves in both color and texture. Therefore, it is challenging for models to distinguish foreground from background. In contrast to previous methods, the proposed method partially improved the modeling of features through Position-Sensitive Attention in C2PSA. However, because Position-Sensitive Attention heavily relied on global spatial relationships, its local perception ability was relatively weak. This limited the improvement of detection accuracy in complex paddy field scenes. Specifically, this local perception ability often leads to the missing of small targets and ambiguous representation of features, which also restricts the improvement of subsequent detection accuracy.
To address the above issues, we design an Efficient Local Attention (ELA) mechanism [31]. As shown in Figure 4, the ELA adaptively performs statistical modeling in horizontal and vertical directions of feature maps to extract row and column dimensional information. Afterwards, lightweight convolutions are used to enhance the localized features. Different from previous attention methods that focused on global spatial relationships, the proposed ELA focuses on spatially local structures and enhances the discriminative local details at a low computational cost. Meanwhile, it can suppress the interference of the background and enhance the model’s sensitivity to subtle features. Thus, it is suitable for the detection scenarios with complex backgrounds and varying textures in rice fields.
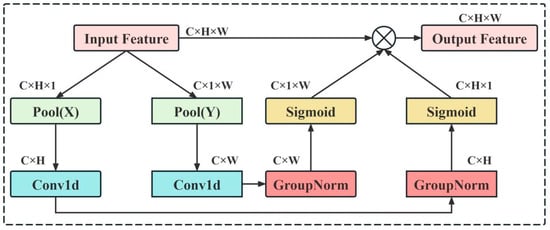
Figure 4.
ELA mechanism structure diagram.
Based on the ELA mechanism, we further propose C2PSA_ELA, whose structure is shown in Figure 5. Similar to the original C2PSA module, this module still uses a dualbranch convolutional structure. However, we embed ELA into PSABlock to construct the multi-level local attention enhancement path. Specifically, one branch keeps the stability of input features, while the other concatenates multiple EBs based on ELA-PSABlock to sequentially perform the local attention extraction and nonlinear transformation. Through the stacked design, C2PSA_ELA can enhance the visual saliency of target regions in a gradual way. Finally, the two branches enhance the model discrimination ability in a complementary way during the feature fusion stage, which is performed by the lightweight convolutional structure.

Figure 5.
Architecture of C2PSA_ELA module.
When running in the backbone network, the C2PSA_ELA shows the following advantages in rice field pest detection: Firstly, compared with the original module, the ELA method can solve the problem that the original module cannot express enough local features well, and improve the ability of expressing small target features and perception of differences between targets and backgrounds. Secondly, the local feature expression of two branches is enhanced and not at the expense of global semantic information, which avoids the problem of semantic information loss caused by excessive localization. Finally, this module can realize accurate localization of small-sized pests while controlling the complexity of computation, and greatly improve the overall accuracy and robustness of the model. The experimental results show that C2PSA_ELA, as an effective enhancement of C2PSA, provides strong technical support for intelligent pest monitoring in rice fields with a complex environment.
2.2.2. EIoU
In rice field pest detection, targets present minute scale, diverse morphology and a large degree of similarity to complex backgrounds, which bring severe challenges for the bounding box regression in rice field pest detection: Compared with general object detection tasks, the traditional CIoU (Complete IoU) loss function performs well, but its optimization mechanism shows obvious disadvantages in tasks like pest detection, which have dense small targets and obvious interference from backgrounds: first, its limitations on aspect ratio parameters will cause training instability in the process of regression of small targets; second, the target is easy to converge slowly in the case of complex background noise interference; third, the optimization is greatly dependent on geometric features and is unable to model local target characteristics in the boundary areas between pest and plant, often causing great positioning errors of detection boxes in pest detection.
To solve the problems, this paper proposes the Efficient IoU (EIoU) loss function [32]. By reorganizing the mathematical expression of the loss term, this method makes the optimization target clearly decompose into three basic geometric elements: measuring the overlapping part, center point distance, and the length of the edge. Its mathematical expression is defined as follows:
where and denote the center coordinates of the predicted and target boxes, respectively; ρ(⋅) represents the Euclidean distance metric; and and are the width and height of the minimum bounding rectangle covering both boxes. While maintaining the advantages of CIoU, this expression effectively solves the problem that CIoU has optimized the aspect ratio parameters unsteadily by minimizing the width and height difference between target boxes and predicted boxes.
In rice field pest detection, the EIoU loss function has the following advantages: First, it greatly accelerated the convergence of bounding boxes of small targets, and improved the overall ability of the model to detect the recall rate of small pests. Second, when faced with complex field environment disturbance such as leaf occlusion and changes in lighting, the boxes optimized based on EIoU have more accurate boundary fitting ability, and the false positive rate is greatly reduced. The experimental results show that the EIoU loss function can greatly improve the accuracy of bounding box regression and the stability of training while maintaining the lightweight of the model, and provides a more reliable loss function for intelligent pest monitoring in rice fields with a complex environment. Besides EIoU, several IoU-based losses (SDIoU, SIoU, WIoU, MPDIoU) were tested to evaluate localization robustness under class imbalance. EIoU showed the most stable precision–recall trade-off and faster convergence, effectively improving the detection of rare pests. Thus, it was adopted as the default loss in CRRE-YOLO.
2.2.3. RIMSCConv (Rice Insect MultiScale Convolution)
In rice field pest detection tasks, the diverse target species with significant morphological variations (e.g., Curculionidae, Delphacidae, Cicadellidae) present challenges characterized by small scales, dense distribution, and high environmental blending. These characteristics make traditional standard convolutions (Conv) inadequate for the task [33]. The original Conv module employs a single fixed convolution kernel with a limited receptive field. When processing pest infestations in complex natural environments like rice fields, this approach often suffers from insufficient feature extraction. Particularly when dealing with small targets and areas with heavy background interference, the model struggles to capture fine-grained structural features. Simultaneously, traditional Conv kernels suffer from computational redundancy and excessive parameter overhead during feature representation. This makes it challenging to balance detection accuracy with inference speed and lightweight requirements. Thus, designing a multi-scale convolutional structure that concurrently tackles small target perception, complex background suppression, and efficient computation has become the key solution to surmounting the bottlenecks in rice field pest detection. Thus, formulating a multi-scale convolutional structure that concurrently takes care of small target perception, complex background suppression, and efficient computation has become the vital solution to surmounting the difficulties in rice field pest detection.
To surmount these challenges, the RIMSCConv module puts forth a strategy combining multiscale separable convolutions and lightweight feature fusion, as illustrated in Figure 6. The core principle is to use convolutional kernels of different scales to enhance the model’s multiscale perception ability, thus improving the feature representation of rice field pest targets. In detail, assuming the input feature map is , a 1 × 1 convolution first performs channel compression to yield a compact feature map , where denotes the channel compression operation. The output dimensions are , with representing the compression factor. Subsequently, RIMSCConv performs separable convolutions at three distinct scales:
where denotes the depthwise separable convolution operation , which effectively reduces computational complexity while ensuring receptive field expansion. Subsequently, the multiscale features are concatenated:
where denotes the channel-wise concatenation operation. Finally, the concatenated features are fused using a shared 1 × 1 convolution , and the output is obtained through batch normalization and the SiLU activation function:
where denotes the SiLU activation function. Through this process, RIMSCConv effectively merges information from different scales while preserving computational lightness, and thus accomplishes feature representations that balance local and global context.

Figure 6.
RIMSCConv module structure diagram.
The RIMSCConv module offers several advantages over traditional Conv modules. First, by introducing 5 × 5, 9 × 9, and 17 × 17 multiscale convolutional kernels, it covers both small target details and the overall distribution of larger pest populations, significantly enhancing the model’s multi-level feature capture capability for rice field pest detection tasks. Second, RIMSCConv resorts to channel compression strategies and depthwise separable convolutions to effectively diminish parameter counts and computational load. This lets the model keep resource consumption low and ensure real-time detection, which is crucial for its deployment on edge devices like drones or agricultural smart terminals. Thirdly, RIMSCConv raises the stability of gradient flow during training by leveraging the smooth nonlinear attributes of the SiLU activation function. This prevents the weakening of small-target features during backpropagation, thereby accelerating model convergence and improving generalization performance. On the whole, RIMSCConv not only addresses the problem of suboptimal multi-scale feature representation in existing Conv modules for rice field pest detection but also boosts the robustness against small-scale pest targets and complex backgrounds while keeping a lightweight framework. This contributes more viable technical support to the intelligent monitoring of pests in rice fields. It supplies more trustworthy technical backing for the intelligent monitoring of pests in rice croplands.
2.2.4. RPAPAttention (Rice Pest Adaptive Perception Attention)
The principal issue in rice pest target detection stems from the targets’ commonly small size, high density, and strong linkage with the environmental background. This makes it tough for traditional detection models to effectively tell pests from background textures during feature extraction, thus causing a reduction in detection accuracy. In particular, for the detection of pests like Curculionidae, Delphacidae, and Cicadellidae, their fine body contours and colors similar to those of rice leaves pose difficulties for conventional convolutional operations to capture high-frequency texture details. Moreover, global average pooling or channel attention mechanisms regularly overlook the crucial nature of local high-frequency features, causing inadequate small object detection [34]. Therefore, the proposed RPAPAttention aims to effectively mitigate the issues of “feature blurring” and “small targets being drowned in the background” in rice field pest detection by combining frequency domain enhancement with dynamic weight allocation. This approach provides more robust and fine-grained representations for small object detection, as illustrated in Figure 7.
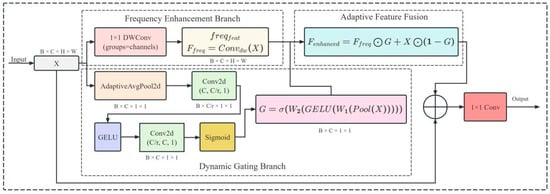
Figure 7.
RPAPAttention module structure diagram.
Conceptually, the RPAPAttention module introduces a dual-branch architecture: a frequency domain enhancement branch and a dynamic gating branch. Let the input feature map be represented as , where denotes the batch size, represents the number of channels, and denote the spatial dimensions, respectively. The frequency domain enhancement branch extracts high-frequency textures through per-channel convolutions, with its output expressed as
The dynamic gating branch first obtains channel-level statistical features through global adaptive average pooling. It then constructs gating weights via two layers of 1×1 convolutions (one for dimension reduction and one for dimension expansion) combined with nonlinear activation functions:
where Pool (⋅) denotes global average pooling, represents the GELU activation function, denotes the Sigmoid mapping, and denote the dimension–reduction and dimension–increase convolution matrices, respectively. Subsequently, the module achieves a balance between high-frequency features and original features through residual-style adaptive fusion:
Finally, the original features and enhanced features are concatenated along the channel dimension and compressed to the original channel count via a 1 × 1 convolution:
yielding the final output feature .
The RPAPAttention module demonstrates significant advantages in rice pest detection. First off, the frequency-domain enhancement branch successfully highlights pest edges and texture details, enabling the model to extract features of small targets even when dealing with complex paddy field backgrounds. Secondly, the dynamic gating mechanism assures the adaptive adjustment of feature importance among channels in line with the input data. This stops over-reliance on any single feature category while retaining essential information. This elevates the robustness in cross-species detection. At the end, the residual fusion design preserves the original global semantic information and then introduces locally enhanced high-frequency features. This approach keeps the model’s stability intact while further refining small-object perception capabilities. Generally speaking, the RPAPAttention module efficiently deals with the setbacks of “small targets, weak features, and complex backgrounds” in rice pest detection with low computational complexity, presenting an effective solution for balancing accuracy and real-time performance in intelligent rice pest monitoring.
2.3. Experimental Platform and Parameter Settings
All models were trained on Windows 11 using PyTorch 2.7.1. The experimental computer was equipped with an Intel Core i5-14600KF CPU, 32GB of memory, and an NVIDIA GeForce RTX 5060 Ti (16GB GPU). The parallel computing environment was CUDA 12.8. The software environment included Python 3.10.18, with PyTorch 2.7.1, NumPy 1.26.4, and deterministic training mode enabled, using a fixed random seed (seed = 0) for reproducibility. The input image was resized to 640 × 640 pixels, with a training batch size of 4 and 200 epochs. Inference performance was evaluated under a single-batch setting (batch size = 1), with an average latency of 3.0 ms per image: 0.2 ms preprocessing, 2.0 ms inference, and 0.8 ms post-processing, resulting in a throughput of 333 FPS for 640 × 640 inputs. Although power consumption was not measured, future work will assess CRRE-YOLO’s performance on various edge devices, including power usage, throughput, and latency under real-world conditions. All the experiments were trained and validated on the local computer. The environment is configured in detail in Table 2. The Parameter Settings are detailed in Table 3.
Table 2.
Environment configuration.
Table 3.
Parameter settings.
2.4. Model Evaluation Metrics
This study opted for precision (P), recall (R), F1 score, and mean average precision (mAP) as evaluation metrics [35] to assess the effectiveness of the CRRE—YOLO network model in rice pest detection.
In object detection tasks, a prediction is considered a true positive (TP) when the predicted bounding box correctly matches a ground-truth object of the same category with an IoU threshold greater than 0.5. Predictions that overlap less than this threshold or belong to an incorrect category are counted as false positives (FP), while undetected ground-truth objects are false negatives (FN). These definitions clarify the computation of precision and recall for detection results.
For mAP evaluation, mAP@0.5, assuming an IoU threshold of 0.5 was employed. Precision is calculated as shown in Equation (9), recall as in Equation (10), F1 score as in Equation (11), and mAP as in Equation (12). To ensure reproducibility, the model was trained under consistent settings with minimal variation. Future work will include multiple runs with different random seeds and incorporate confidence intervals, t-tests, and p-values for improved statistical transparency.
3. Results
3.1. Ablation Study
To systematically analyze the contribution of each module proposed in our paper to the network performance, we perform ablation experiments on the benchmark dataset. The experimental results are shown in Table 4, which is very intuitive to show the performance change process from the baseline model to the final model by gradually adding each component.
Table 4.
Results of ablation experiments.
In complex rice-field environments, detecting small and highly camouflaged pests presents significant challenges. To evaluate the effectiveness of the proposed EIoU loss, C2PSA_ELA module, RPAPAttention module, and RIMSCConv convolution module, we conducted 16 ablation experiments, progressively adding individual and combined modules to assess their independent and synergistic contributions. The baseline YOLO11 model, without any enhancements, achieved P = 0.791, R = 0.719, mAP@0.5 = 0.789, and mAP@0.5:0.95 = 0.641, and underperformed in complex backgrounds with high texture similarity. Incorporating EIoU resulted in a notable improvement, with mAP@0.5:0.95 increasing to 0.667, demonstrating its efficacy in accelerating convergence and improving small target bounding-box regression. The C2PSA_ELA module, when applied alone, further enhanced performance, raising mAP@0.5:0.95 to 0.669 by refining local texture feature extraction. RPAPAttention improved mAP@0.5:0.95 to 0.666 and increased recall (R = 0.733) by enhancing frequency-domain texture features and dynamically adjusting channel weights. The introduction of RIMSCConv increased mAP@0.5:0.95 to 0.674 while reducing FLOPs to 5.8G, demonstrating that multiscale depthwise separable convolutions enhance small-scale detail modeling while maintaining computational efficiency. Performance improvements were more pronounced when combining multiple modules. For instance, the combination of EIoU and C2PSA_ELA led to mAP@0.5 = 0.815 and mAP@0.5:0.95 = 0.680, while combining RPAPAttention and RIMSCConv resulted in mAP@0.5 = 0.823 and mAP@0.5:0.95 = 0.690. Several three-module combinations further enhanced accuracy, maintaining low complexity, and highlighted the complementary strengths in localization, local feature enhancement, and multiscale representation. Finally, integrating all four modules yielded the best performance: mAP@0.5 = 0.836, mAP@0.5:0.95 = 0.719, R = 0.787, with only 6.1G FLOPs and 2.344M parameters. These results underscore the strong synergy between EIoU, C2PSA_ELA, RPAPAttention, and RIMSCConv. EIoU improves small-object boundary regression, C2PSA_ELA enhances local feature perception in complex backgrounds, RPAPAttention enriches frequency-domain texture representation, and RIMSCConv strengthens multiscale feature extraction while reducing computational cost. Together, these modules form an accurate, efficient, and real-time pest detection framework, ideal for rice-field environments characterized by small target sizes, strong camouflage, and complex background noise.
The convergence behavior of the baseline and the improved model is further analyzed in Section 3.8.
3.2. Comparison of Different Model Results
To demonstrate the benefits of our proposed model in terms of computational efficiency and pest detection performance, we compared RT—DETR, YOLOv3—tiny, YOLOv5, YOLOv6, YOLOv8, YOLOv9, YOLOv10, YOLOv11, YOLOv12, YOLOv13, and our proposed model. Results are demonstrated in Table 5, and Figure 8 and Figure 9 present the comparisons of model performance.
Table 5.
Comparison results of different models.
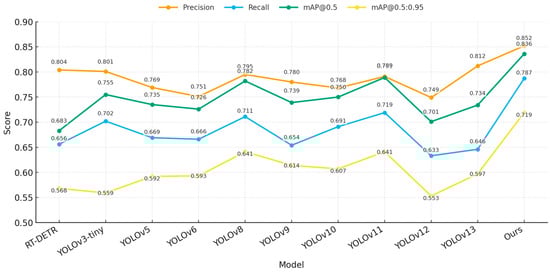
Figure 8.
Performance comparison of different models.

Figure 9.
Performance comparison of different models.
Analysis shows that our model is obviously superior to others on all four accuracy indicators: precision (0.852), recall (0.787), mAP@0.5 (0.836), and mAP@0.5:0.95 (0.719), which are all higher than all compared models. In terms of computational complexity, our model parameter size is only 2.344M, which reduces 92.68% compared with the RT-DETR model (32.006M), and is comparable to YOLOv13 (2.450M) while achieving higher accuracy. The FLOPs consumption is only 6.1G, which is lower than that of the RT-DETR model (103.5G) as well as YOLOv5 (7.1G), YOLOv6 (11.8G), and YOLOv8 (8.1G), while YOLOv12 (5.8G) shows relatively lower accuracy (mAP@0.5 = 0.701). In terms of mAP@0.5, our model improves 4.7 percentage points over YOLOv11 (0.789), and 5.4 percentage points over YOLOv8 (0.782). In addition, our model also shows better performance than YOLOv8 and YOLOv11 on mAP@0.5:0.95. Specifically, our model is 7.8 percentage points better than YOLOv8 and YOLOv11 (both 0.641). In addition, as shown in Figure 7, our model also has advantages in terms of accuracy-computational overhead advantages.
3.3. Comparison of Results Across Different Loss Functions
In addition, to improve the detection performance, this study also systematically explores the influence of five loss functions (EIoU, SDIoU, SIoU, WIoU, and MPDIoU) on rice pest detection on the basis of the YOLOv11 model. The accuracy and recall, as well as other detailed information, are shown in Table 6 and Figure 10 and Figure 11.
Table 6.
Results of different loss functions.

Figure 10.
Performance comparison of different loss functions.
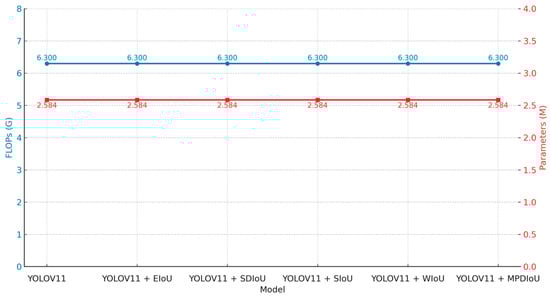
Figure 11.
Performance comparison of different loss functions.
According to the analysis of Table 6, the model based on the MPDIoU loss function obtained the most excellent precision of 0.844, which was 5.3 percentage points more than that of the basic YOLOv11 model (0.791), and was slightly better than that of the EIoU loss function model (0.838). In terms of recall, the model based on the EIoU loss function was the best, which was 1.2 percentage points more than that of the basic YOLOv11 model (0.719). Especially on the comprehensive evaluation index mAP@0.5, the model based on the EIoU loss function achieved the best performance, which was 1.7 percentage points more than that of the basic YOLOv11 model (0.806). In addition, the model based on the EIoU loss function was also the best on the mAP@0.5:0.95 indicator, with 0.667. In addition, the FLOPs and parameters of all compared models were not changed. That is to say, the performance improvement of the model comes from the optimal loss function. Figure 10 and Figure 11 are the figure that shows the above results more intuitively.
EIoU has a clear advantage in recall and overall detection performance (mAP). MPDIoU has a clear advantage in precision. Overall, the EIoU loss function has a better balance between precision and recall, which improves the overall detection performance. Therefore, we believe that using EIoU as the bounding box regression loss function is the best choice.
3.4. Comparison of Different Attention Mechanisms
In addition, we applied and compared five types of attention mechanisms (RPAPAttention, CBAM, DynamicSpatialAttention, HPAttention, and LCA) on the basis of YOLOv11 to further improve the effectiveness of pest and disease feature extraction. We conducted detailed analysis and comparison from multiple perspectives of detection accuracy, recall rate, global performance, and computational overhead, as shown in Table 7 and Figure 12 and Figure 13.
Table 7.
Results of different attention mechanisms.
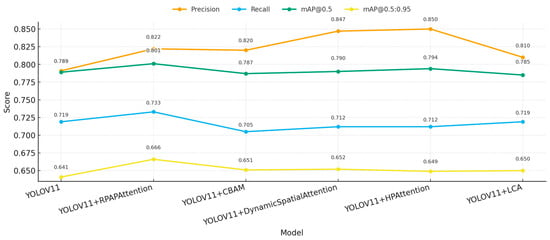
Figure 12.
Performance comparison of different attention mechanisms.
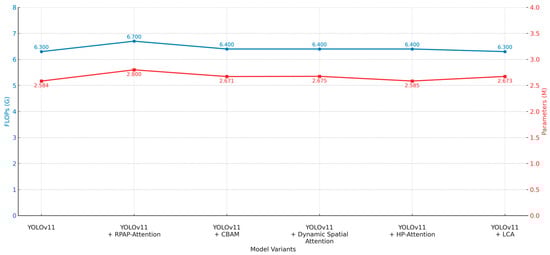
Figure 13.
Performance comparison of different attention mechanisms.
From the analysis of precision, as shown in Table 7, the model using the HPAttention mechanism reached the best precision of 0.850, which was 5.9 percentage points more than the baseline YOLOv11 model (0.791). The mechanism of DynamicSpatialAttention reached the precision of 0.847. In the case of recall, as shown in Table 7, the RPAPAttention model reached the best performance of 0.733, which was 1.4 percentage points more than the baseline. In addition, the comprehensive detection capability mAP@0.5 reached the best performance of 0.801, which was 1.2 percentage points more than the baseline. The comprehensive detection capability mAP@0.5:0.95 reached the best performance of 0.666. The LCA mechanism maintains the same FLOPs (6.3G) compared with the baseline, and only slightly increases the parameter size.
From Figure 12 and Figure 13, we can find that the HPAttention and DynamicSpatialAttention can greatly improve the classification accuracy, and the RPAPAttention mechanism is more effective in improving the ability of recall and comprehensive detection capability. In terms of computational efficiency, except for the other attention mechanism, which only causes a slight increase in FLOPs (6.7G) compared with the RPAPAttention, the other attention mechanism has little inference overhead, and the parameter size remains in an acceptable range.
Overall, the experimental results show that RPAPAttention can greatly improve the recall ability and comprehensive performance while keeping high detection accuracy, which makes RPAPAttention the best choice of attention enhancement strategy in rice pest detection. In addition, if there are some specific requirements on computational efficiency, the LCA mechanism also has practical significance.
3.5. Comparison of Different Convolution Blocks
In order to analyze more effective feature extraction structures, we compared several convolutional modules, such as RIMSCConv, DWConv, GhostConv, PConv, and SAConv, based on YOLOv11. We performed the overall comparison with the metric of detection accuracy, recall, overall performance, and computational overhead. The experimental results are summarized in Table 8; the comparison of metrics is shown in Figure 13 and Figure 14. Besides improving efficiency, the proposed RIMSCConv and RPAPAttention modules also enhance robustness. By strengthening multiscale feature perception and spatial attention, they help maintain stable detection under illumination changes and occlusion.
Table 8.
Results of different convolution blocks.

Figure 14.
Performance comparison of different convolution blocks.
Overall, our proposed RIMSCConv shows remarkable performance on all evaluation metrics, and at the same time, high detection accuracy. Precision of RIMSCConv is 0.828, which is 3.7 percentage points higher than that of the baseline YOLOv11 (0.791). As for mAP@0.5, the two baselines achieve the same value of 0.800. However, when comparing mAP@0.5:0.95, RIMSCConv obtains 0.674, which is higher than that of the baseline (0.641), indicating that our method has better comprehensive detection ability. It is worth noting that, compared with the baseline model, RIMSCConv improves accuracy but reduces FLOPs to 5.8G and parameters to 2.161M, while the parameters of the baseline model are 2.584M and FLOPs are 6.3G, which shows obvious advantages in efficiency.
As for lightweighting, compared with the baseline model, DWConv and SAConv greatly reduce the number of parameters. DWConv reduces parameters to 1.922 million and FLOPs to only 4.7 G. SAConv achieves parameters of 3.421 million and FLOPs of 4.6 G, which is the lowest among all modules compared in this paper. As for accuracy, both have certain accuracy degradation, especially, mAP@0.5:0.95 drop to 0.611 and 0.587 for DWConv and SAConv, respectively, which means that these two modules cannot greatly reduce the feature extraction ability of the model. As for PConv, although the number of parameters increases slightly, FLOPs will rise to 7.1G, and there is no improvement in inference efficiency.
From Figure 14 and Figure 15, we can find that different convolutional modules will have a great impact on model performance. RIMSCConv can obtain a better balance between accuracy and efficiency. Compared with traditional lightweight modules, although the computational overhead is reduced, a large amount of detection performance is sacrificed.
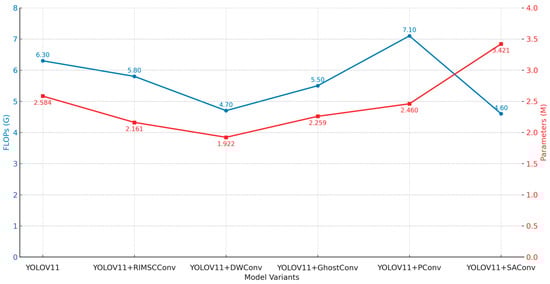
Figure 15.
Performance comparison of different convolution blocks.
Specifically, our proposed RIMSCConv not only has strong feature representation ability, but also can effectively control the consumption of computational resources, which makes it more applicable to rice pest detection in the field with limited computing resources.
3.6. C2PSA Module Variant Comparison Experiments
To identify the most effective attention substructure within the C2PSA module, we systematically compared the performance differences of five attention mechanisms—ELA, CAA, DynamicCBAM, FCAttention, and NAMAttention—when embedded into C2PSA within the YOLOv11 framework. The analysis comprehensively evaluated detection accuracy, recall, overall detection capability, and parameter efficiency. Experimental results are presented in Table 9, with performance comparisons shown in Figure 16 and Figure 17.
Table 9.
Results of different C2PSA module variants.
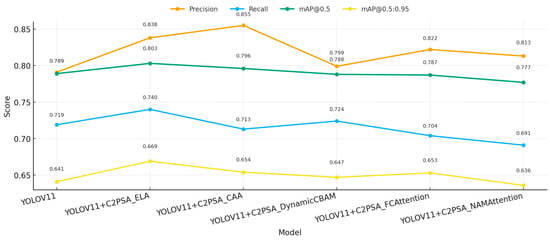
Figure 16.
Performance comparison of different C2PSA module variants.
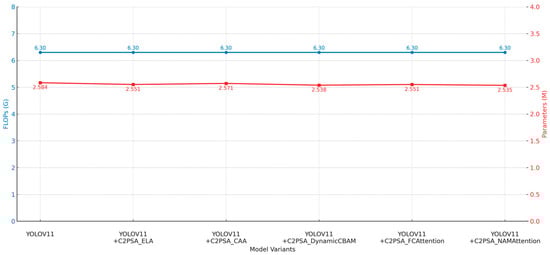
Figure 17.
Performance comparison of different C2PSA module variants.
Overall, the analysis shows that although the FLOPs are almost the same (6.3G), the performance of different variants is still significantly different. Specifically, for precision, the best result was obtained by C2PSA_CAA, which was 0.855, an increase of 6.4 percentage points over baseline YOLOv11 (0.791), followed by C2PSA_ELA, 0.838. For recall, C2PSA_ELA significantly improved recall compared with other variants. The recall of C2PSA_ELA was 0.740, which was 2.1 percentage points better than the baseline. As for the comprehensive detection metric mAP@0.5, C2PSA_ELA obtained the best improvement; its mAP@0.5 was 0.803, which was 1.4 percentage points better than the baseline. On the mAP@0.5:0.95 metric, C2PSA_ELA was also the best, achieving 0.669, which proved that C2PSA_ELA had stronger robustness in multiscale detection. All variants were based on the same parameter scale of about 2.55M (similar to the baseline 2.584M), which also reflected that C2PSA was well structured and parameter efficient.
From Figure 16 and Figure 17, we can also find that C2PSA_ELA keeps high precision, recall, and overall performance, and the overall performance is the best. C2PSA_CAA has the best performance in precision, while the recall is relatively low, which means that there may be certain areas where C2PSA_CAA cannot detect. The rest of the variants have little improvement.
In summary, C2PSA_ELA keeps the efficiency of the model while comprehensively improving the detection performance, so C2PSA_ELA is the best choice for attention configuration of rice pest in the C2PSA module, and the overall performance is the best. The experimental results also provide evidence for the selection of attention structure in the lightweight detection model.
3.7. CRRE-YOLO Test Result Analysis
The confusion matrix is a crucial element in machine learning for comparing classification results against actual predictions. It is an easy-to-understand and useful means to view each classification result in the training phase. By carrying out statistical analysis on the prediction results of all classes, the accuracy, recall, and misclassification rate are calculable. Figure 18 reveals the confusion matrix, with Table 10 giving the detailed recognition results for each category.
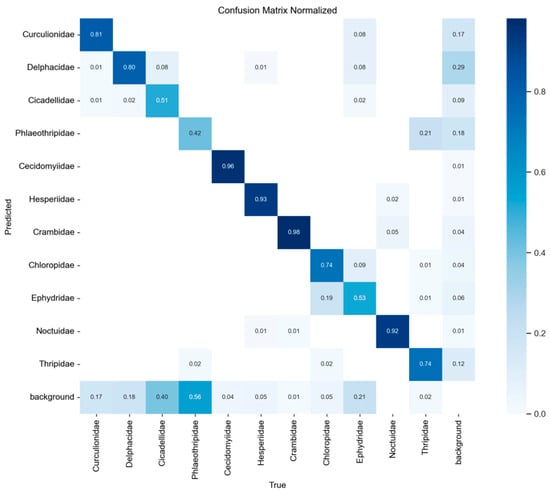
Figure 18.
Confusion matrix.
Table 10.
Recognition results for each category.
Analysis of the confusion matrix reveals that insect targets were classified into eleven categories in this experiment: Curculionidae, Delphacidae, Cicadellidae, Phlaeothripidae, Cecidomyiidae, Hesperiidae, Crambidae, Chloropidae, Ephydridae, Noctuidae, and Thripidae. Taking Crambidae as an example, the model achieved a classification accuracy of 98% for this category, with a false negative rate (i.e., the proportion of rice blast misclassified as background) of 2%. The performance table indicates the model excels in identifying Cecidomyiidae and Crambidae, achieving mAP@0.5 accuracies of 0.99 and 0.993, respectively. Hesperiidae and Noctuidae also demonstrate outstanding performance with mAP@0.5 accuracies of 0.974 and 0.955. Additionally, Curculionidae and Delphacidae achieved relatively high recognition accuracy with mAP@0.5 scores of 0.865 and 0.833, respectively. However, the model demonstrated relatively poor performance in identifying Phlaeothripidae and Cicadellidae, with mAP@0.5 accuracy of only 0.484 and 0.572, respectively. Among all categories, these two groups also exhibited the lowest comprehensive performance metrics (mAP@0.5:0.95). In this experiment using the CRRE-YOLO network for training, the F1 curve, PR curve, P curve, and R curve during model training are presented in Figure 19: (a) F1 curve; (b) PR curve; (c) P curve; (d) R curve.
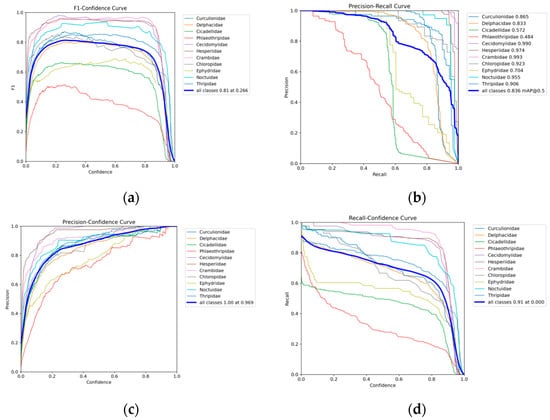
Figure 19.
(a) F1_curve; (b) PR_curve; (c) P_curve; (d) R_curve.
These curves provide insights into the model’s learning performance across different insect categories. The F1 curve shows the balance of recognition accuracy. The PR curve can clearly show the mAP@0.5 of each category. The area included between the curve and the x/y axis is larger, the better the performance.
In this experiment, the configuration file of training specifies a batch size of 4, which means that each time, four images are used for training. YOLO algorithm provides full visualization support during the training process. After the training process begins, users can visually check the training sample data enhanced in training and its corresponding labels by viewing images such as train_batch0.jpg and train_batch1.jpg. After the completion of each round of training, the system will automatically output comparison images between the label of the validation set and the prediction result: val_batch0_labels.jpg shows the actual bounding box annotation result, val_batch0_pred.jpg shows the result of model prediction in this round of the cycle. In addition, the training process will also output multiple evaluation charts, such as a confusion matrix, a PR curve, and an F1 curve (for example, confusion_matrix.png, PR_curve.png, F1_curve.png), comprehensively reflecting the performance of the model. Prediction examples in the validation set are shown in Figure 20.
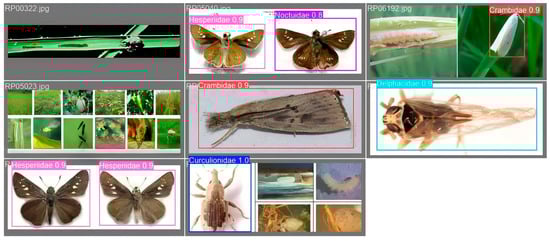
Figure 20.
Prediction result in validation set.
The performance of the fully trained model on the validation set was tested according to Figure 20. The model had performed well in overall recognition, and its effectiveness was mainly dependent on morphological and distributional features of target pests. That is, the model could present robust performance in effective and accurate detection for relatively larger pests appearing in sparse distributions, such as Cecidomyiidae; however, the model’s performance dropped significantly for relatively smaller pests appearing in dense distributions and presenting visual similarities, such as Cicadellidae and Phlaeothripidae. Then, the model architecture was iteratively adjusted to optimize its effectiveness. The final optimized model obtained a considerable performance improvement on the independent test set. As shown in Table 7, compared with the previous model, the final optimized model achieved an F1-score of 81.85%, a precision of 85.19%, and an mAP@0.5 of 83.62%. Subsequently, per-class analysis was conducted to find the performance disparity of different rice pest categories. As shown in Table 10, the performance disparity is explicitly presented by mAP@0.5 of different categories. For example, compared with other categories, the mAP@0.5 of Cicadellidae was 57.2%, and that of Phlaeothripidae was 48.4%; whereas the mAP@0.5 of Cecidomyiidae was 99.0%. These results can provide a clear understanding of the capability of our model for different categories of rice pests and clarify the specific limitations of our model, which provide a basis for subsequent research on model improvement.
3.8. Convergence Analysis
As shown in Figure 21, the loss values of both the original YOLOv11 model and CRRE-YOLO drop rapidly during the first 50 training epochs and gradually enter a stable convergence phase after approximately 120–150 epochs. In the later stages of training, the loss curves remain smooth with minimal fluctuations, showing no signs of loss rebound or unstable convergence. Notably, CRRE-YOLO maintains consistently lower loss levels and exhibits a more stable downward trend throughout the entire training process, indicating higher optimization efficiency and further confirming that the model achieves stable convergence without overfitting.

Figure 21.
Convergence curves of the original YOLOv11 and CRRE-YOLO models.
3.9. Analysis of CRRE-YOLO Experimental Results
In the inference testing, YOLOv7, YOLOv13, and CRRE-YOLO were utilized to recognize rice pests in the test images. The recognition result is shown in Figure 21.
Figure 22 shows the performance comparison of YOLOv11, YOLOv13, and CRRE-YOLO in the detection of Delphacidae and Hesperiidae. The results show that YOLOv11 has relatively limited detection ability, and CRRE-YOLO has the most outstanding performance. Specifically, in the detection of Hesperiidae, CRRE-YOLO successfully detected two targets, but YOLOv11 only detected one. In the detection of Delphacidae, CRRE-YOLO produced five detection boxes and completely covered all targets in the image, and showed a more comprehensive recognition ability. Overall, CRRE-YOLO allows for rapid, accurate, and comprehensive multi-class pest detection, providing reliable technical support for crop protection.
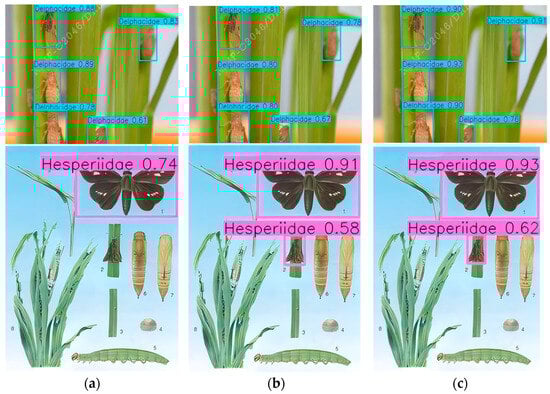
Figure 22.
Recognition result. (a) YOLOv11; (b) YOLOv13; (c) CRRE-YOLO.
4. Discussion
Although the CRRE-YOLO model in this study achieved remarkable results in both accuracy and lightweightness for pest detection, compared with several mainstream detection models, its excellent performance, possible limitations, and future improvement directions should be thoroughly discussed.
Firstly, the construction of datasets and model quality are inseparable. We used the RP11 dataset in this study. Its taxonomic rigor and annotation accuracy provided a high-quality training set for models. Furthermore, offline comprehensive data augmentation (RP11-Augmented) greatly increased the scale of the training set and simulated various complex field situations. Undoubtedly, this has played a vital role in improving the model’s generalization ability. However, it should be noted that there are still certain sample imbalance situations in the categories within the dataset (as shown in Table 1), i.e., Curculionidae appeared 825 times, while Chloropidae appeared 152 times. This long-tail situation may cause insufficient learning for minority classes and affect the ability of the model to detect rare pests and diseases in real-world situations. In addition, data augmentation strategies can simulate various kinds of diversity. However, their coverage is definitely limited in complexity. This may be insufficient to simulate the extreme diversity of backgrounds, occlusions, and lighting situations that appear in real agricultural fields. In the future, we should try to use targeted oversampling methods (such as Copy-Paste augmentation) or category-based loss function reweighting strategies to improve the model’s sensitivity toward rare classes, as well as try to collect more balanced field data. In this study, we prioritized structural optimization and lightweight design rather than incorporating additional loss reweighting mechanisms, as the dataset does not exhibit severe class-imbalance characteristics. As shown in Section 2.2.2 and Table 6, EIoU improves bounding-box regression efficiency and yields a more stable precision–recall balance, which indirectly benefits the detection of small and hard-to-localize pest categories. Future work will further investigate explicit reweighting and oversampling strategies to enhance class-level robustness.
Secondly, previous studies have shown that YOLOv10 performs excellently in small-object recognition tasks such as construction-site personal protective equipment (PPE) detection [36,37]. These studies highlight YOLOv10’s robustness in handling small objects and complex background scenarios. In this study, YOLOv11 was selected because its improved anchor-free design and dynamic head mechanism provide better adaptability for agricultural pest detection. However, YOLOv10 was not experimentally compared, and architectural differences between YOLOv10 and YOLOv11 may affect detection performance. This limitation has been acknowledged in the study.
Finally, regarding the balance between model architecture and efficiency, we successfully improve the detection performance without much increase in computational overhead by designing some novel modules, as shown in EIoU, C2PSA_ELA, RPAPAttention, and RIMSCConv. The results of the ablation experiment also show that the effectiveness of these modules is undeniable. And the effective improvement of synergy is brought about by the combination of these modules. Finally, CRRE-YOLO reaches an accurate balance of accuracy (such as mAP@0.5 of 0.836) and efficiency (FLOPs of 6.1G). This design method proves that, apart from designing lightweight frameworks, introducing efficient attention mechanisms and convolutional strategies is another feasible method to improve model performance. In the future, if we want to practically apply this model to real farmland, we can further explore model quantization and structural pruning techniques to compress the model without reducing accuracy and make it suitable for operation on limited mobile/IoT devices.
Moreover, the final test of any model is its robustness and practicality in real situations. Our experimental results show that CRRE-YOLO performs excellently on the independent test set, but this is still an evaluation in a controlled situation. If we want to apply it to the dynamic and unstructured real farmland, it will meet completely new challenges. For example, canopy occlusion will be a big challenge, and the morphology of pests and diseases is uncertain. In addition, there will also be differences in the target appearance at different growth stages. Therefore, large-scale and long-term field deployment and evaluation are the next steps. Future work will evaluate latency, throughput, and power consumption on typical edge devices, including multi-run latency averaging, throughput testing, and power consumption assessments, ensuring a comprehensive evaluation of CRRE-YOLO’s real-time performance and efficiency.
Furthermore, the proposed CRRE-YOLO model shows strong potential for generalization to other cereal crops, such as wheat and maize, as these crops share similar pest morphologies and imaging characteristics with rice. Expanding the dataset to include wheat and maize pest images will allow for a more comprehensive assessment of the model’s cross-crop adaptability and robustness in diverse agricultural environments. This extension could contribute to the development of a unified and scalable pest detection framework for multiple cereal crops, further enhancing the practical applicability of CRRE-YOLO in precision agriculture.
While this study provides robust results, we recognize the importance of statistical rigor, especially in assessing model stability across different training conditions. While the structural improvements in our model are deterministic, future work will include multiple runs with different random seeds to further evaluate the consistency and stability of the results. We will also incorporate confidence intervals, t-tests, SEM, and p-values to enhance statistical transparency and ensure a more comprehensive assessment of the model’s performance.
5. Conclusions
To address the challenges of achieving precise and real-time rice pest detection in complex field environments, this study proposes an enhanced lightweight model, CRRE-YOLO, based on YOLOv11.The framework integrates four key modules—the EIoU loss function, C2PSA_ELA module, RPAPAttention mechanism, and RIMSCConv module—forming a compact yet high-performance detection architecture.
Comprehensive experiments on the RP11-Augmented dataset demonstrate that CRRE-YOLO achieves the highest detection accuracy among all compared models. Specifically, it attains a precision (P) of 0.852, a recall (R) of 0.787, an mAP@0.5 of 83.6%, and an mAP@0.5:0.95 of 71.9%, exceeding the baseline YOLOv11 by 4.7%,6.8%, and 7.8%, respectively. Compared with mainstream detectors such as YOLOv8(mAP@0.5:0.95 of 64.1%) and RT-DETR (56.8%), CRRE-YOLO demonstrates substantial gains of 7.8% and 15.1% in mAP@0.5:0.95, respectively.
Despite its superior performance, CRRE-YOLO maintains a lightweight architecture with only 2.344M parameters and 6.1G FLOPs, which are lower than YOLOv11 (2.584M, 6.3G) and YOLOv8 (3.008M, 8.1G). These results indicate that CRRE-YOLO achieves the best trade-off between accuracy and computational cost, making it particularly suitable for real-time deployment on mobile and edge devices.
Ablation studies confirm that the four enhanced modules synergistically contribute to the model’s performance improvements. The EIoU loss strengthens localization precision, the C2PSA_ELA module enhances feature extraction, the RPAPAttention mechanism improves focus on pest regions, and the RIMSCConv module boosts fine-grained recognition of small targets. Collectively, these components form the foundation of CRRE-YOLO’s superior accuracy and efficiency.
The model’s strong generalization ability across eleven pest categories highlights its robustness and scalability. It not only satisfies the requirements of accuracy, speed, and efficiency for real-time pest monitoring but also shows potential for broader agricultural applications, such as disease identification and crop health assessment.
Looking ahead, CRRE-YOLO can be seamlessly integrated into smart agricultural robots, UAV-based monitoring systems, and IoT edge platforms. By leveraging multi-source agricultural data—including climatic, environmental, and historical information—it may enable early pest outbreak prediction, enhance precision crop management, and contribute to the realization of sustainable intelligent agriculture.
Author Contributions
Conceptualization, G.Z. and Y.R.; methodology, G.Z.; validation, G.Z. and Y.R.; formal analysis, Y.R.; investigation, G.Z.; resources, Y.R.; writing—original draft preparation, G.Z.; writing—review and editing, Y.R.; visualization, G.Z.; supervision, Y.R.; project administration, G.Z.; funding acquisition, Y.R. All authors have read and agreed to the published version of the manuscript.
Funding
This research was funded by the Talent Fund of Zhejiang Ocean University, grant number JX6311061523.
Institutional Review Board Statement
Not applicable.
Informed Consent Statement
Not applicable.
Data Availability Statement
The raw data supporting the conclusions of this article will be made available by the authors on request.
Acknowledgments
The authors would like to acknowledge the valuable comments by the editors and reviewers, which have greatly improved the quality of this work.
Conflicts of Interest
The authors declare no conflicts of interest.
References
- Zheng, Y.; Zheng, W.; Du, X. Paddy-YOLO: An accurate method for rice pest detection. Comput. Electron. Agric. 2025, 238, 110777. [Google Scholar] [CrossRef]
- Way, M.; Heong, K. The role of biodiversity in the dynamics and management of insect pests of tropical irrigated rice—A review. Bull. Entomol. Res. 1994, 84, 567–587. [Google Scholar] [CrossRef]
- Gong, H.; Liu, T.; Luo, T.; Guo, J.; Feng, R.; Li, J.; Ma, X.; Mu, Y.; Hu, T.; Sun, Y. Based on FCN and DenseNet framework for the research of rice pest identification methods. Agronomy 2023, 13, 410. [Google Scholar] [CrossRef]
- Du, P.; Bai, X.; Tan, K.; Xue, Z.; Samat, A.; Xia, J.; Li, E.; Su, H.; Liu, W. Advances of Four Machine Learning Methods for Spatial Data Handling: A Review. J. Geovis. Spat. Anal. 2020, 4, 13. [Google Scholar] [CrossRef]
- Wang, R. AdaBoost for feature selection, classification and its relation with SVM, a review. Phys. Procedia 2012, 25, 800–807. [Google Scholar] [CrossRef]
- Thenmozhi, K.; Reddy, U.S. Image processing techniques for insect shape detection in field crops. In Proceedings of the 2017 International Conference on Inventive Computing and Informatics (ICICI), Coimbatore, India, 23–24 November 2017; pp. 699–704. [Google Scholar]
- Pantazi, X.E.; Moshou, D.; Tamouridou, A.A. Automated leaf disease detection in different crop species through image features analysis and One Class Classifiers. Comput. Electron. Agric. 2019, 156, 96–104. [Google Scholar] [CrossRef]
- Wang, J.-C.; Lian, L.-X.; Lin, Y.-Y.; Zhao, J.-H. VLSI design for SVM-based speaker verification system. IEEE Trans. Very Large Scale Integr. (VLSI) Syst. 2014, 23, 1355–1359. [Google Scholar] [CrossRef]
- Chen, P.; Li, W.; Yao, S.; Ma, C.; Zhang, J.; Wang, B.; Zheng, C.; Xie, C.; Liang, D. Recognition and counting of wheat mites in wheat fields by a three-step deep learning method. Neurocomputing 2021, 437, 21–30. [Google Scholar] [CrossRef]
- Shoaib, M.; Sadeghi-Niaraki, A.; Ali, F.; Hussain, I.; Khalid, S. Leveraging deep learning for plant disease and pest detection: A comprehensive review and future directions. Front. Plant Sci. 2025, 16, 1538163. [Google Scholar] [CrossRef] [PubMed]
- Dee, H.M.; Velastin, S.A. How close are we to solving the problem of automated visual surveillance? A review of real-world surveillance, scientific progress and evaluative mechanisms. Mach. Vis. Appl. 2008, 19, 329–343. [Google Scholar] [CrossRef]
- Chithambarathanu, M.; Jeyakumar, M. Survey on crop pest detection using deep learning and machine learning approaches. Multimed. Tools Appl. 2023, 82, 42277–42310. [Google Scholar] [CrossRef]
- Chen, C.-J.; Huang, Y.-Y.; Li, Y.-S.; Chang, C.-Y.; Huang, Y.-M. An AIoT based smart agricultural system for pests detection. IEEE Access 2020, 8, 180750–180761. [Google Scholar] [CrossRef]
- Wang, S.; Xu, D.; Liang, H.; Bai, Y.; Li, X.; Zhou, J.; Su, C.; Wei, W. Advances in deep learning applications for plant disease and pest detection: A review. Remote Sens. 2025, 17, 698. [Google Scholar] [CrossRef]
- Hu, X.; Chen, C.; Yang, Z.; Liu, Z. Reliable, large-scale, and automated remote sensing mapping of coastal aquaculture ponds based on Sentinel-1/2 and ensemble learning algorithms. Expert Syst. Appl. 2025, 293, 128740. [Google Scholar] [CrossRef]
- Shi, Z.; Dang, H.; Liu, Z.; Zhou, X. Detection and identification of stored-grain insects using deep learning: A more effective neural network. IEEE Access 2020, 8, 163703–163714. [Google Scholar] [CrossRef]
- Shen, Y.; Zhou, H.; Li, J.; Jian, F.; Jayas, D.S. Detection of stored-grain insects using deep learning. Comput. Electron. Agric. 2018, 145, 319–325. [Google Scholar] [CrossRef]
- Zhang, Z.; Rong, J.; Qi, Z.; Yang, Y.; Zheng, X.; Gao, J.; Li, W.; Yuan, T. A multi-species pest recognition and counting method based on a density map in the greenhouse. Comput. Electron. Agric. 2024, 217, 108554. [Google Scholar] [CrossRef]
- Abbas, N.; Zhang, Y.; Taherkordi, A.; Skeie, T. Mobile edge computing: A survey. IEEE Internet Things J. 2017, 5, 450–465. [Google Scholar] [CrossRef]
- Chandio, A.; Gui, G.; Kumar, T.; Ullah, I.; Ranjbarzadeh, R.; Roy, A.M.; Hussain, A.; Shen, Y. Precise single-stage detector. arXiv 2022, arXiv:2210.04252. [Google Scholar] [CrossRef]
- Zhang, F.; Tian, C.; Li, X.; Yang, N.; Zhang, Y.; Gao, Q. MTD-YOLO: An Improved YOLOv8-Based Rice Pest Detection Model. Electronics 2025, 14, 2912. [Google Scholar] [CrossRef]
- Yang, S.; Xing, Z.; Wang, H.; Dong, X.; Gao, X.; Liu, Z.; Zhang, X.; Li, S.; Zhao, Y. Maize-YOLO: A new high-precision and real-time method for maize pest detection. Insects 2023, 14, 278. [Google Scholar] [CrossRef]
- Yin, Z.-B.; Liu, F.-Y.; Geng, H.; Xi, Y.-J.; Zeng, D.-B.; Si, C.-J.; Shi, M.-D. A high-precision jujube disease spot detection based on SSD during the sorting process. PLoS ONE 2024, 19, e0296314. [Google Scholar] [CrossRef] [PubMed]
- Chen, J.; Ran, X. Deep learning with edge computing: A review. Proc. IEEE 2019, 107, 1655–1674. [Google Scholar] [CrossRef]
- Lv, P.; Xu, H.; Zhang, Y.; Zhang, Q.; Pan, Q.; Qin, Y.; Chen, Y.; Cao, D.; Wang, J.; Zhang, M. An improved multi-scale feature extraction network for rice disease and pest recognition. Insects 2024, 15, 827. [Google Scholar] [CrossRef]
- Lin, J.; Ming, J.; Crookes, D. Robust face recognition with partial occlusion, illumination variation and limited training data by optimal feature selection. IET Comput. Vis. 2011, 5, 23–32. [Google Scholar] [CrossRef]
- Ding, B.; Tian, Y.; Guo, X.; Wang, L.; Tian, X. Improving Rice Pest Management Through RP11: A Scientifically Annotated Dataset for Adult Insect Recognition. Life 2025, 15, 910. [Google Scholar] [CrossRef]
- Wu, X.; Zhan, C.; Lai, Y.-K.; Cheng, M.-M.; Yang, J. Ip102: A large-scale benchmark dataset for insect pest recognition. In Proceedings of the IEEE/CVF Conference on Computer Vision and Pattern Recognition, Long Beach, CA, USA, 15–20 June 2019; pp. 8787–8796. [Google Scholar]
- Ge, Z.; Liu, S.; Wang, F.; Li, Z.; Sun, J. Yolox: Exceeding yolo series in 2021. arXiv 2021, arXiv:2107.08430. [Google Scholar] [CrossRef]
- Khanam, R.; Hussain, M. Yolov11: An overview of the key architectural enhancements. arXiv 2024, arXiv:2410.17725. [Google Scholar] [CrossRef]
- Xu, W.; Wan, Y. ELA: Efficient local attention for deep convolutional neural networks. arXiv 2024, arXiv:2403.01123. [Google Scholar] [CrossRef]
- Zhang, Y.-F.; Ren, W.; Zhang, Z.; Jia, Z.; Wang, L.; Tan, T. Focal and efficient IOU loss for accurate bounding box regression. Neurocomputing 2022, 506, 146–157. [Google Scholar] [CrossRef]
- Zhang, L.; Zhong, Y.; Wang, J.; Min, Z.; Liu, L. Rethinking 3D Convolution in ℓp-norm Space. Adv. Neural Inf. Process. Syst. 2024, 37, 91012–91035. [Google Scholar]
- Wang, W.; Lai, Q.; Fu, H.; Shen, J.; Ling, H.; Yang, R. Salient object detection in the deep learning era: An in-depth survey. IEEE Trans. Pattern Anal. Mach. Intell. 2021, 44, 3239–3259. [Google Scholar] [CrossRef] [PubMed]
- Patil, R.R.; Kumar, S.; Chiwhane, S.; Rani, R.; Pippal, S.K. An artificial-intelligence-based novel rice grade model for severity estimation of rice diseases. Agriculture 2022, 13, 47. [Google Scholar] [CrossRef]
- Wang, S.; Park, S.; Kim, J.; Kim, J. Safety helmet monitoring on construction sites using YOLOv10 and advanced transformer architectures with surveillance and body-worn cameras. J. Constr. Eng. Manag. 2025, 151, 04025186. [Google Scholar] [CrossRef]
- Wang, S. Automated non-PPE detection on construction sites using YOLOv10 and transformer architectures for surveillance and body worn cameras with benchmark datasets. Sci. Rep. 2025, 15, 27043. [Google Scholar] [CrossRef]
Disclaimer/Publisher’s Note: The statements, opinions and data contained in all publications are solely those of the individual author(s) and contributor(s) and not of MDPI and/or the editor(s). MDPI and/or the editor(s) disclaim responsibility for any injury to people or property resulting from any ideas, methods, instructions or products referred to in the content. |
© 2025 by the authors. Licensee MDPI, Basel, Switzerland. This article is an open access article distributed under the terms and conditions of the Creative Commons Attribution (CC BY) license.