Abstract
Ensuring the stability of underground structure engineering in deep coal mines is the key to the successful exploitation of deep geothermal resources in coal mines. Therefore, this paper carried out mechanical tests on rock–coal combinations under different rock properties and studied their stress–strain laws, energy and acoustic emission evolution laws, as well as deformation and failure laws. The main conclusions are as follows: (1) The strength of rock–coal assemblages mainly depends on the strength of coal samples far from the interface, and coal samples are the main bearing bodies in the process of uniaxial compression. (2) Because oil shale has a relatively low strength and large deformations, the rock property of relatively large deformations can improve the ability of the combinations to convert external energy into elastic energy. (3) The acoustic emission energy rate signals of rock–coal combinations can be divided into three stages: quiet, active, and sudden increase. The acoustic emission energy rate signals of limestone–coal and sandstone–coal assemblages are of the “lone-shock” type, while the acoustic emission energy rate signals of oil shale coal assemblages are of the “Multi-peak” type. (4) When oil shale with a relatively low strength and large deformations occurs, both the rock sample and coal sample of the combination appear to have deformation localization zones, and the deformation localization zones in the rock sample and coal sample run through the rock–coal interface, which eventually leads to the failure of both the rock sample and coal sample of the combination. These relevant research results help ensure the safe utilization of geothermal resources in deep coal mines and promote the global energy structure in accelerating the transformation to low-carbon and clean energy.
1. Introduction
Coal has been the main energy source in China for many years, shouldering the important task of national economic and social development [1,2,3,4]. With the depletion of shallow coal resources, coal has gradually entered the stage of deep mining [5,6,7,8,9,10]. Deep coal mining is accompanied by stable and widely distributed geothermal resources. The full utilization of these geothermal resources will help accelerate the transformation of the global energy structure to low-carbon and clean energy [11,12], but under the action of complex conditions such as deep high-stress and high-strength excavation unloading disturbances, disasters such as rock bursts as well as coal and gas outbursts in deep roadways occur frequently [13,14,15,16,17,18,19,20,21,22], which seriously threaten underground operation and personnel safety [23,24,25]. This leads to the failure of safe and effective utilization of deep geothermal resources in coal mines. Ensuring the stability of deep underground structure engineering is the key to the successful exploitation of deep geothermal resources in coal mines [26]. Due to the influence of geological movement and coal formation, coal-bearing strata are mostly layered or interbedded, forming different forms of “rock mass–coal mass” combination structures [27]. However, the occurrence of disasters in deep roadways is not only determined by the mechanical properties of independent coal or rock but also the result of the overall failure and instability of the ‘rock mass–coal mass’ composite structure under the influence of mining [28,29,30,31]. In order to further reveal the damage and failure mechanisms of surrounding rock in deep coal mine tunnels and ensure the safe utilization of geothermal resources in deep mines, it is necessary to study the synergistic bearing characteristics and failure instability mechanisms of rock–coal combinations.
At present, scholars in China and abroad have carried out a large number of pioneering and fruitful studies on the establishment of tightly bonded or nonbonded coal–rock combination samples and numerical models by bonding rock samples and coal samples with adhesives or free stacking. On the one hand, scholars have carried out outstanding research on the strength laws of rock–coal combination samples, such as Wang et al. [32], who performed conventional triaxial compression tests on rock–coal–rock combination samples to analyze the characteristics of the mechanical behavior under different pressures. Zuo Jianping et al. [33] carried out uniaxial and triaxial compression tests on rock–coal–rock composites containing weak coal samples and investigated the basic mechanical properties of the composites. Liu et al. [34] established an intrinsic damage model for coal samples of rock–coal and rock–coal–rock combinations and experimentally verified its accuracy. The existing research mainly focuses on the mechanical properties of coal–rock combinations, while research on the laws of cooperative bearing strength of this combination, considering different rock properties in the interaction between rock and coal, was scarce. On the other hand, scholars have carried out meaningful research on the evolution laws of energy and acoustic emissions of rock–coal combination samples, such as Yang et al. [35], who revealed the characteristics of the mechanical responses of the combinations with different strength ratios and the evolution of laws of energy partitioning. Xu et al. [36] carried out a uniaxial cyclic loading and unloading test on a coal–rock combination and studied the evolution laws of its input energy density, elastic energy density, and dissipated energy density. Li et al. [37] investigated the influence of the fissure position and inclination on the fractal dimension of combination crushing, and they explored the energy evolution characteristics of combinations in different fissure forms and the characteristics of the crushing block size. The existing studies mainly focus on the phased characteristics of energy dissipation and acoustic emission of rock–coal combination samples, but there are few studies on the calculation of energy density or the division of acoustic emission stages according to the stress–strain curve of the combination, as well as research on the evolution law of cooperative bearing energy and acoustic emission of the combination under different rock properties. Finally, some scholars have studied the deformation and failure law of coal–rock combination samples: Yu et al. [38] carried out uniaxial loading test of ‘rock–coal–rock’ combination with different height ratios and studied the loading failure law of coal–rock combination with different height ratios. Chen et al. [39] carried out uniaxial compression tests of tuff–coal combinations with different rock–coal (height) ratios and quantitatively revealed the deformation and damage characteristics of the combination samples in terms of the deformation field evolution, rebound deformation, energy dissipation, and acoustic emission characteristics. The existing studies mainly focus on the crack propagation or macro failure law of rock–coal combination samples. Based on the whole process of deformation and failure of the combination under collaborative loading, there are few studies on the deformation and failure law of the combination under different rock property factors from the perspectives of deformation field evolution, deformation localization zone displacement evolution, rock coal deformation evolution at the interface, and rock sample rebound deformation law.
Therefore, rock and coal composite samples with different lithologies were prepared in this study. Additionally, an acoustic emission system and DIC (Digital Image Correlation) three-dimensional full-field strain measurement and analysis system were combined. Then, uniaxial compression tests of the composite samples were conducted, and the composite synergistic bearing strength law was analyzed. Finally, the composite energy and acoustic emission evolution law, as well as the synergistic bearing deformation and failure law of collaborative bearing, based on cross-scale cracks, were revealed. It provides theoretical support for the safe utilization of geothermal resources in deep mining.
2. Sample Preparation and Test Scheme
2.1. Sample Preparation
All the rock and coal samples were taken from the same rock and coal blocks (From Shanxi Province, China.). At Shandong University of Science And Technology, State Key Laboratory of Disaster Prevention and Ecology Protection in Openpit Coal Mines, first, a rock cutting and grinding machine was used to cut and polish the coal and rock blocks, which were processed into 50 mm × 50 mm × 50 mm square samples. The six end faces of the samples were polished and treated using a stone grinding machine. The end faces were required to be smooth, and the corresponding end faces were polished to ensure they were a degree of parallelism of no more than 0.05 mm and an axial deviation of no more than 0.25°. Then, epoxy resin AB glue was used to bond the rock and coal samples into a combination with a size of 50 mm × 50 mm × 100 mm. At the same time, rock and coal monomer samples were prepared by the same method. The sample size was a square sample with length × width × height of 50 mm × 50 mm × 100 mm.
2.2. Test Scheme
The loading and monitoring system for this test is shown in Figure 1, which mainly includes a Shimadzu AG-X250 electronic universal testing machine (Produced by Shimadzu company, Kyoto, Japan), MISTRAS series PCI-2 acoustic emission system (Produced by Beijing Softland Times Technology Co., Ltd., Beijing, China), and DIC (Digital Image Correlation) three-dimensional full-field strain measurement and analysis system (Produced by XTOP3D, Xi’an, China). The test was controlled by displacement loading, with the loading rate set at 0.005 mm/s and the experiment was stopped automatically when the loading stress drops to 1% of the peak stress. The loading system, acoustic emission system, and three-dimensional full-field strain measurement system were synchronized to ensure the data acquisition of all three systems was synchronized. The speckle pattern of the combination sample was collected with an industrial camera (5 million pixels) of the digital scattering strain measurement system, and the acquisition frequency was 3 frames/s.
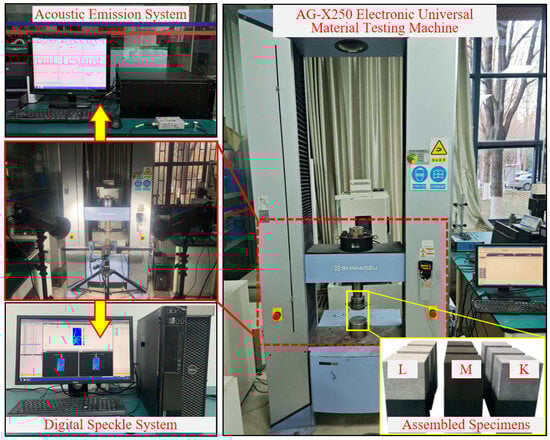
Figure 1.
Test loading system and monitoring system.
3. Co-Bearing Stress–Strain Law of Rock–Coal Combination Under Different Rock Properties
3.1. Stress–Strain Characterization of Synergistic Loading of Combination
Table 1 shows the uniaxial compression and Brazilian splitting test results of limestone, sandstone, oil shale, and coal samples. As shown in Table 1, the upper data in the table represents the range of each parameter obtained from the experiment, while the lower data in the table represents the average value of each parameter obtained from the experiment.

Table 1.
Basic physical and mechanical parameters of rock and coal monomers.
The uniaxial compressive stress–strain curves of the rock–coal combination with different rock properties are given in Figure 2. The upward slope of the stress–strain curves shows that Group K combination (limestone-coal) > Group L combination (sandstone–coal) > Group M combination (oil shale–coal), and the corresponding rising slopes of the average stress–strain curves are 2416, 1807, and 1485. This is because oil shale has relatively low strength and large deformation compared with limestone and sandstone in this test, and the oil shale–coal combination is more susceptible to deformation under axial compressive stress, which leads to a more “gentle” rise in the pre-peak phase of the stress–strain curve.
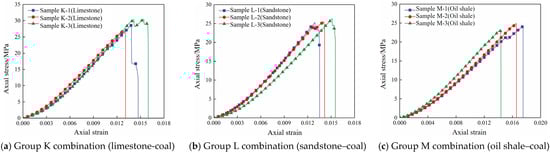
Figure 2.
Uniaxial compressive stress–strain curves of rock–coal combinations with different rock properties.
It can be seen that the uniaxial compressive strength (UCS) and modulus of elasticity (E) of the combinations with different rock properties are quite different, and the rock properties affect the UCS and E of the combinations. The comparison of UCS and E of rock–coal combinations with different rock properties are given in Figure 3. Moreover, Figure 3 shows that the UCS and E of the combination varied significantly by the rock properties. When the rock property is limestone, the UCS of the combination is the largest, with a value of 28.65 MPa. When the rock property is sandstone, the UCS of the combination is 25.69 MPa, which is 10.33% less than that of the limestone–coal combination. When the rock property is oil shale, the UCS of the combination is 24.04 MPa, which is 16.09% less than that of the limestone-coal combination. The overall reduction trend of the E of the combination is approximately the same as that of the UCS, and the E of the combination of sandstone and oil shale are reduced by 12.33% and 27.87%, respectively, compared with the rock–coal combination with rock properties of limestone. Therefore, the rock properties affect the UCS and E of the combination, and as the UCS and E of the rock samples of the combination decrease, the UCS and E of the combination both show a decreasing trend.
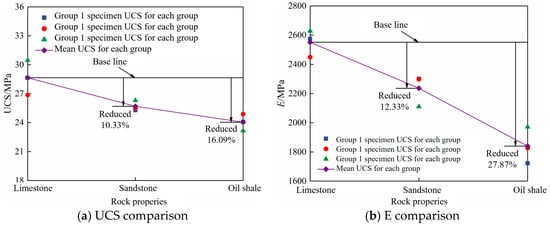
Figure 3.
Comparison of UCS and E of rock–coal combinations with different rock properties.
3.2. Discussion on the Law of the Synergistic Load Bearing Strength of the Combination
The strengths of the rock and coal samples at the interface of the rock–coal combination (σRI, σCI) and the strengths of the rock and coal samples away from the interface σR, σC) were solved for different rock properties.
3.2.1. Limestone–Coal and Sandstone–Coal Combinations
Analysis of mechanical properties of rock under uniaxial compression considering previous research [40,41]. The axial compressive strengths (σR, σC) of the rock and coal samples away from the interface in the rock–coal combinations are obtained from the axial compressive strength of a single standard rock and coal sample (L × W × H = 50 mm × 50 mm × 100 mm) by using the size effect equation, as shown in Equation (1) [42].
In this equation, is a single standard specimen (50 mm × 50 mm × 100 mm) UCS, MPa; is a nonstandard specimen (L × W × H = 50 mm × 50 mm × n mm) UCS, MPa; D is the diameter of the nonstandard specimen, mm; and H is the height of the nonstandard specimen, mm.
Assuming that the rock and coal samples at the rock–coal interface are in limited equilibrium under axial compressive stress, the axial ultimate compressive strengths (σRI, σCI) of the rock and coal samples at the interface in the combination can be obtained according to the Mohr-Coulomb yield criterion as follows [42]:
The variables of this equation are defined as follows:
In this equation, φR and φC are the angles of internal friction of the rock and coal samples, respectively.
According to Equations (1)–(3), σR, σC, σRI, and σCI of the combinations can be obtained for Group K and Group L, respectively, as shown in Table 2 Additionally, σR > σRI and σC < σCI.
Table 2.
Synergistic bearing strength of the combinations of Groups K and L.
3.2.2. Oil Shale–Coal Combinations
Since the large deformation of oil shale changes the force state at the interface of the rock–coal combination, the axial ultimate compressive strength of the rock and coal samples at the interface of the oil shale–coal combination is obtained by deducing Equations (4) and (5) from Equations (2) and (3):
According to Equations (1), (4), and (5), σR, σC, σRI, and σCI can be obtained for the combinations of Group M, as shown in Table 3 and in the oil shale–coal combinations, σR < σRI and σC > σCI.
Table 3.
Synergistic bearing strengths of the combinations of Group M.
The comparison between the average UCS of the combinations and their corresponding different rock properties are given in Figure 4. As shown in Figure 4, the average UCS of the combinations of Groups K, L, and M are closer to σC and much smaller than σR and σRI. This indicates that the strength of the rock–coal combination mainly depends on the strength σC of the coal samples away from the interface, and the coal samples are the main carriers in the uniaxial compression process of the combination. However, in the synergistic load bearing process of the rock–coal combination, the rock and coal samples interact with each other. Thus, the average UCS of each group obtained by the uniaxial compression test of the rock–coal combination with different rock properties is larger than σC obtained by theoretical calculations, and the UCS of the combinations of Groups K, L, and M increased by 8.10 MPa, 5.14 MPa, and 3.49 MPa, respectively, compared with a σC of 20.55 MPa.
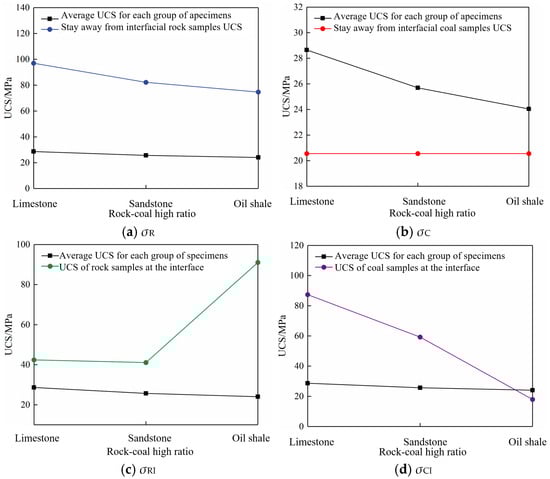
Figure 4.
Comparison between the average UCS of the combinations and their corresponding σR, σC, σRI, and σCI under different rock properties.
The UCS of the combination of Group M has the smallest difference from the theoretical calculation results, and the σCI of the combination of Group M is the smallest. This is due to the different rock properties of the rock samples, and the interaction between the rock and coal samples is also different. Compared with the limestone and sandstone oil shale, the rock samples have a large deformation that is caused by the modulus of elasticity of the rock and coal samples at the rock–coal interface, where the modulus of elasticity of the oil shale is less than that of the coal samples and Poisson’s ratio of the oil shale is greater than that of the coal samples. Furthermore, the coal samples are in the interface in a three-way compression–tension state. Thus, the strength of the coal samples close to the interface decreases, leading to tensile damage under the action of axial stress. At the same time, the strength of oil shale near the interface is improved. In addition, the difference between σC and σCI of the combination of Group M is only 2.62 MPa, which is smaller than the difference between σC and σCI of the combinations of Group K and Group L. When the coal samples at the interface of the combination of Group M are damaged, defects, such as primary cracks and new cracks, are more likely to develop and extend to the whole sample, thus accelerating the destruction of the coal samples. Thus, the interaction between the oil shale and coal samples enhances the strength of the combination least significantly.
4. Study on the Energy and Acoustic Emission Evolution Law of Rock–Coal Combinations with Synergistic Load Bearings Under Different Rock Properties
4.1. Energy Calculation of the Combination Under Synergistic Load Bearing
The energy density conversion relationship of the rock–coal combination is shown in Figure 5.
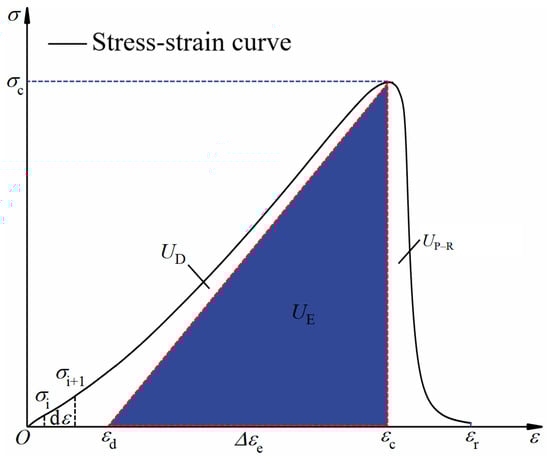
Figure 5.
Energy density conversion relationship of the rock–coal combination.
According to the first law of thermodynamics, assuming that there is no heat exchange between the combination and the outside world when the external force does its work, the input energy density UI resulting from the work performed by the external force on the combination is the sum of the elastic energy density UE and the dissipated energy density UD.
where σi is the stress at any point on the stress–strain curve in MPa, and εc is the strain corresponding to the peak stress.
From the uniaxial compression loading and unloading tests of the combination, it is known that the unloading path before the peak is consistent with the slope of the stress–strain curve. The dissipated energy density UD and the internal stored elastic energy density UE, when the combination is loaded, can be obtained from Equations (6) and (7), respectively.
where σc is the peak stress in MPa and (εc − εd) is the recoverable strain.
The post-peak release energy density UP–R is the area of the stress–strain curve envelope from εc to εr, which is calculated as
where εr is the maximum strain of the stress–strain curve.
After the damage of the combination occurs, part of the pre-peak elastic energy is converted into post-peak release energy, and part of it is converted into residual elastic energy UR–E. The residual elastic energy density UR–E is calculated as
4.2. Energy Evolution Law of the Combinations Under Synergistic Load Bearings
A comparison of the energy density of each energy density of the rock–coal combination with different rock properties is shown in Figure 6. As shown in Figure 6, with increasing axial stress, the external energy is input continuously. The average UI of the combinations of Group K is 0.181965 J × mm−3, that of the combinations of Group L is 0.160144 J × mm−3, and that of the combinations of Group M is 0.188744 J × mm−3. The average UI value of M group > K group > L group. Only when the input energy reaches the energy storage limits of the combination does the combination undergo failure. Thus, the larger the UI, the greater the strength of the corresponding combination. Moreover, the average UI of the combinations of Group K (limestone–coal) is larger than the average UI of the combinations of Group L (sandstone–coal). Based on the aforementioned results, the stress–strain curve of the oil shale coal assemblage is more relaxed. During the uniaxial compression process of the oil shale coal assemblage, according to Hooke’s law and relationship (8), the greater deformation of the oil shale causes it to store more elastic energy. Therefore, the average UI of the combinations of Group M (oil shale–coal) is the largest. The average UE of the combinations of Group M is the largest, with a value of 0.168858 J × mm−3, and the average UE of the combinations of Group L is the smallest, with a value of 0.124605 J × mm−3.
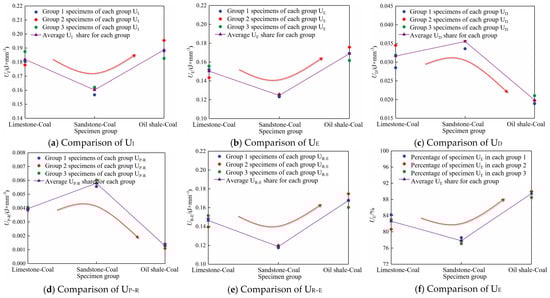
Figure 6.
Comparison of the UI, UE, UD, UP–R, UR-E, and UE proportions of the rock–coal combinations with different height ratios.
In the pre-peak stage, part of the external energy is converted into dissipated energy that is related to the deformation damage inside the combination. The average UD of the combinations of Group L is the largest, with a value of 0.035540 J × mm−3, and that of the combinations of Group M is the smallest, with a value of 0.019886 J × mm−3. This is because the strength of the coal samples is lower than that of the rock samples, and the deformation of the coal samples is larger than that of the rock samples. Thus, the elastic energy stored in the coal samples is much larger than that of rock samples. The deformations of the combinations of Group K and Group L mainly occur in the coal samples. However, the oil shale is affected by its low-strength characteristics, and the crack development of the rock samples before the peak stress of the combinations of Group M reduces the damage of the coal samples. Moreover, the coal samples undergo less plastic deformation before the peak stress. The average UE percentage of the combinations of Group M is the largest, with a value of 89.45%, and that of the combinations of Group L is the smallest, with a value of 77.82%. The average UE value of M group > K group > L group. These results suggest that the rock properties affect the ability of the combinations to convert external energy into elastic energy. Because oil shale has relatively low strength and large deformations, the relatively large deformation rock properties can improve the ability of the combinations to convert external energy into elastic energy.
In the post-peak stage, the elastic energy is converted into post-peak release energy and residual elastic energy. The average UP–R of the combinations of Group L is the largest, with a value of 0.005796 J × mm−3, and that of the combinations of Group M is the smallest, with a value of 0.001279 J × mm−3. The average UR–E of the combinations of Group M is the largest, with a value of 0.167579 J × mm−3, and that of the combinations of Group L is the smallest, with a value of 0.118809 J × mm−3. Therefore, the post-damage macroscopic cracks of the combinations of Group L are the largest and have the smallest degree of power manifestation, which is consistent with that of the combinations of Group M, with a value of 0.118809 J × mm−3. Therefore, the combinations of Group L have the most macroscopic cracks and the smallest degree of dynamic manifestation after damage, and the combinations of Group M have the least macroscopic cracks and the largest degree of dynamic manifestation after damage, which is in accordance with the results of the combination test.
4.3. Acoustic Emission Evolution Law of Combination Under Synergistic Load Bearing
The K-2, L-2, and M-3 combinations were selected to analyze the acoustic emission energy rate and cumulative energy rate in the damage process. Figure 7 shows the uniaxial compressive stress, acoustic emission energy rate, and cumulative energy rate of rock–coal combinations with different rock properties. As shown in Figure 7, the progressive damage process of the combination under uniaxial compression is divided into three stages according to the number of acoustic emission energy rate signals and the magnitude of the peak value: the quiet stage (Stage I), the active stage (Stage II), and the sudden increase stage (Stage III). Meanwhile, the acoustic emission energy rate signal characteristics of the combination during the loading process show good agreement with the stress-time curve.
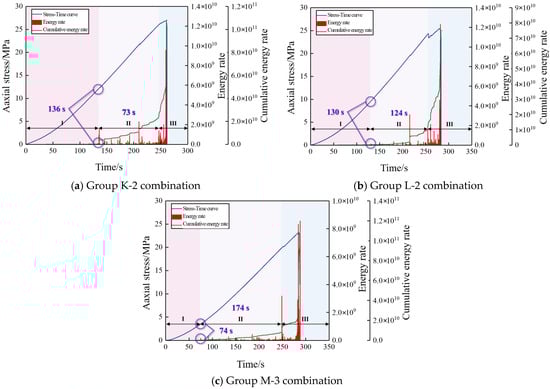
Figure 7.
Uniaxial compressive stress, acoustic emission energy rate, and cumulative energy rate of the rock–coal combinations with different rock properties.
- (1)
- The quiet stage (Stage I)
In the quiet stage, the primary pores and microcracks of the rock–coal combination with different rock properties were gradually closed during uniaxial compression, and the interface between the rock samples and the coal samples was compressed and compacted. Subsequently, the combination enters the linear elasticity stage, in which the whole combination tends to be complete, the acoustic emission energy rate signal fluctuates slightly but there is no large sudden increase, and the acoustic emission energy rate and cumulative energy rate are almost zero.
- (2)
- The active stage (Stage II)
In the active stage, the damage destruction of rock–coal combinations with different rock properties changes qualitatively, and the K-2, L-2, and M-3 combinations enter Stage II at 136 s, 130 s, and 74 s, respectively. The internal cracks of the coal samples in the K-2 and L-2 combinations begin to develop and expand. Additionally, macroscopic destruction features appear, while the internal cracks of oil shale and coal samples in the M-3 combinations both begin to develop and expand. Moreover, macro-destructive features appear. At this time, the acoustic emission energy rate signal fluctuates widely, and the cumulative energy rate increases significantly. However, the fluctuation peak of the energy rate is low. With an increasing axial pressure, Stage II of the K-2, L-2, and M-3 combinations lasted 73 s, 124 s, and 174 s, respectively, and duration K-2 assemblage < L-3 assemblage < M-1 assemblage. This is because the energy input from the outside world of the K-2 combinations and the L-2 combinations is mainly stored in the coal samples. However, the M-3 combinations can store more energy due to the large deformation properties of oil shale. Thus, Stage II of the M-3 combination lasts for the longest period.
- (3)
- The sudden increase stage (Stage III)
During the sudden increase stage, the elastic energy stored in the rock–coal combination with different rock properties is converted into post-peak release energy and residual elastic energy. In this process, the primary cracks and new cracks in the rock and coal samples of the combination continue to expand, intersect, and penetrate, accompanied by the localized ejection damage of the coal samples, which ultimately induces the overall destruction of the combination. The rebound deformation of the rock samples exacerbates the further destruction of the coal samples. Among them, the cracks in the coal samples of the M-3 combinations developed and expanded, and the oil shale cracks penetrated at the interface, causing damage to both the rock and coal samples of the combination. During this process, the acoustic emission energy rate signal and cumulative energy rate increased abruptly, and the cumulative energy rate reached the maximum. Eventually, the corresponding acoustic emission energy rates were 1.18 × 10¹⁰, 1.23 × 10¹⁰, and 8.56 × 10⁹, and the cumulative energy rates were 1.08 × 10¹¹, 7.50 × 10¹⁰, and 1.12 × 10¹¹ for the K-2, L-2, and M-3 combinations, respectively, when the combinations underwent holistic damage. Moreover, the cumulative energy rates were 1.08 × 10¹¹, 7.50 × 10¹⁰, and 1.12 × 10¹¹ for the K-2, L-2, and M-3 combinations, respectively. The acoustic emission energy rate signals of the K-2 and L-2 combinations are of the “lone-shock” type, with only one peak point, while the acoustic emission energy rate signals of the M-3 combinations are of the “Multi-peak” type, with several peak points. This occurs because the combinations are adjusted internally to adapt to the axial stresses after the peak point, and the axial stresses does not drop instantaneously.
5. Deformation Failure Law of the Rock–Coal Combinations with Synergistic Load Bearings Under Different Rock Properties
5.1. Evolution Law of the Deformation Field of the Synergistic Load Bearings of the Combinations
The three samples in each group are the same, so one specimen in each group is selected for the analysis of the deformation field evolution law. Figure 8 shows a schematic diagram of the selection of the characteristic points of the uniaxial compression stress—strain curves of the rock-coal combinations with different rock properties. Five characteristic points are selected for each stress—strain curve to analyze the deformation and damage law of the combination. Among them, the axial stress corresponding to Point a is 0 MPa, the axial stress corresponding to Point b is 50% of the peak stress (before peak), the axial force corresponding to Point c is 90% of the peak stress (before peak), the axial stress corresponding to Point d is the peak stress, and the axial stress corresponding to Point e is 95% of the peak stress (after peak).
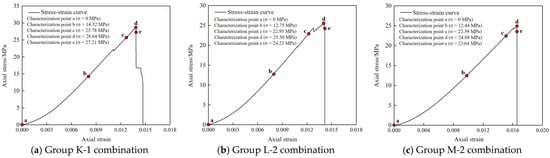
Figure 8.
Selection of the characteristic points of the uniaxial compressive stress–strain curves of the rock-coal combinations with different rock properties.
Figure 9 shows the maximum principal strain field evolution cloud diagram of the rock–coal combination with different rock properties. Select 5 characteristic points for each stress-strain curve to analyze the deformation and failure laws of the combination. Among them, the axial stress corresponding to point a is 0 MPa, the axial stress corresponding to point b is 50% of the peak stress (before the peak), the axial force corresponding to point c is 90% of the peak stress (before the peak), the axial stress corresponding to point d is the peak stress, and the axial stress corresponding to point e is 95% of the peak stress (after the peak). Feature Point a is the corresponding point of the reference image selected by the digital scattering correlation method, Feature Points b–e are the corresponding points of the deformation image selected by the digital scattering correlation method, the blue elliptic circles indicate primary cracks, the red elliptic circles indicate new cracks or new cracks generated by the extension of primary cracks, the yellow arrows indicate crack extension, and σ is the axial stress corresponding to the feature points.
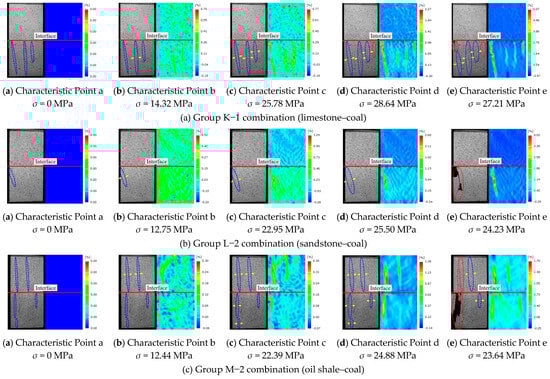
Figure 9.
Evolution of the maximum principal strain field of the rock−coal combination with different rock properties.
The Characteristic Point b is located at the initial stage of the linear elasticity of the stress–strain curve, and the primary cracks are almost not developed. The distribution of the maximum strain field of the combination is relatively uniform, and only some primary cracks show signs of weak deformation localization zones. With the gradual increase in axial stress, the primary crack of the combination at the Characteristic Point c begins to develop, and the deformation localization zone first appears in its region. The deformation localization zone of the combination K-1 and L-2 mainly appears in the coal sample, while the deformation localization zone of the combination m-2 appears in the oil shale and coal sample. The corresponding values of the combination K-1, L-2, and M-2 are 25.78 MPa, 22.95 MPa, and 22.39 MPa, respectively, and the maximum principal strains are 0.0077, 0.0124, and 0.0039, respectively.
Characteristic Point d is located in the plastic-yielding stage of the stress—strain curve. Close to the peak point, the primary cracks continue to expand, intersect, and generate new cracks. At this time, the distribution of the maximum principal strain field is characterized by obvious nonuniformity, and the maximum principal strain value increases. Among them, the lower end of the primary cracks of the coal samples in the K-1 combinations starts cracking and expanding, and new cracks are formed on the right side, corresponding to σ of 28.64 MPa and a maximum principal strain value of 0.0227. The lower end of the primary cracks of the coal samples in the L-2 combinations starts cracking and expanding, corresponding to σ of 25.50 MPa and a maximum principal strain value of 0.0260. The lower end of the primary cracks of the oil shale and coal samples in the M-2 combination starts cracking and expanding, and the left side cracks of the oil shale and coal samples intersect at the interface. The corresponding σ is 24.88 MPa, and the maximum principal strain value is 0.0138. Compared with the maximum principal strain value of Characteristic Point c, the maximum principal strain values of Characteristic Point d of the K-1, L-2, and M-2 combinations increased by 195%, 110%, and 254%, respectively. Therefore, the oil shale–coal combinations have the largest increase in the maximum principal strain value, the limestone–coal combination has the second largest increase, and the sandstone–coal combinations have the smallest increase in the maximum principal strain value. The largest increase in the maximum principal strain value of the M-2 combinations may be due to the large development of macroscopic cracks in both the oil shale and the coal samples. Meanwhile, under the action of axial stress, the tips of primary cracks in the coal samples cracked and expanded, forming macroscopic tension cracks, and the length and width of the deformation localization zone increased.
Characteristic Point e is located in the destructive stage after the peak of the stress–strain curve, and the K-1 and L-2 combinations are accompanied by the convergence and penetration of primary and nascent cracks in the coal samples. The deformation localized zones of the combinations are elongated, intersected, and connected, which ultimately leads to their destruction. However, the deformation localized zones of the M-2 combinations in the oil shale and coal samples evolve drastically and penetrate through the interface between the rock and coal, which ultimately leads to the destruction of the oil shale and the coal samples. The corresponding σ values of the K-1, L-2, and M-2 combinations are 27.21 MPa, 24.23 MPa, and 23.64 MPa, respectively, and the maximum principal strain values are 0.0607, 0.0402, and 0.0170, respectively.
In summary, the deformation localization zone evolution of the rock–coal combinations with different rock properties is not only closely related to the primary crack initiation and expansion within the coal samples, but it is also affected by the rock properties. When the rock samples are relatively low-strength and exhibit highly deformed oil shale, localized deformation zones appear in both the rock and coal samples of the combination, and the localized deformation zones in both the rock and coal samples pass through the rock–coal interface, which ultimately induces the destruction of both the rock and coal samples of the combination.
5.2. Laws of Displacement Evolution in Localized Zones of Assemblage Synergistic Load Bearing
As shown in Figure 10, the maximum principal strain nephogram of K-1, L-2, and M-2 combinations before final failure is marked with identification lines to obtain the deformation localization zone, and the displacement misalignment along the counterclockwise direction is positive, as shown in Figure 10. Figure 11 shows the evolution curves of the displacement in the deformed localized zone of the rock–coal combination with different rock properties. And the displacement misalignment along the counterclockwise direction is positive. From Figure 11, it can be seen that the evolution process of the displacement in the deformed localized zone of the rock–coal combination with different rock properties is greatly influenced by rock properties. At the beginning of the uniaxial compression process, no deformation localization zone occurs in the K-1 combinations (limestone–coal) and L-2 combinations (sandstone–coal), and the displacement misalignment curves of the deformation localization zones A–E show only weak fluctuations, with a displacement misalignment amount of almost 0 mm. The displacement misalignment curves of the deformation localization zones F–I of the M-2 combinations (oil shale–coal) show a slow growth trend.
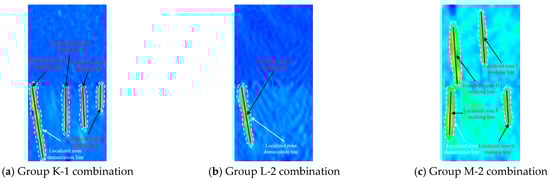
Figure 10.
Identification of the maximum principal strain cloud diagram before final failure of the rock–coal combinations.
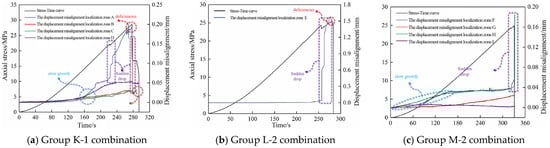
Figure 11.
Evolution curves of the displacement dislocation of the deformation localization zones of the rock-coal combinations.
Among them, the displacement of the deformation localization zones A–D in the K-1 combinations 141 s before loading is almost 0 mm. After 141 s, the displacement began to slowly increase, but the growth rate of the displacement of the deformation localization zone D gradually decreased. During loading up to 223 s, the displacement error of deformation localization zone A appeared to “suddenly increase”. When the loading reaches 223 s, the displacement error momentum of the deformation localization zone A shows a sudden increase, and this state lasts until the peak stress drop stage of the combined body. When the loading reaches 278 s, the displacement error momentum of the deformation localization zone B shows a sudden increase, and at this time, the combined body is in the peak stress drop stage. The maximum displacement misalignment of the deformation localization zones A–D is 0.196, 0.165, 0.023, and 0.046 mm, respectively, and the maximum displacement misalignment of the deformation localization zones A and B is much larger than that of deformation localization zones C and D, which indicates that the deformation localization zones A and B are the main controlling deformation localization zones affecting the damage of the K-1 combinations.
Before loading at 256 s, the displacement of the deformation localization zone E is almost 0 mm. At 256 s, the displacement of the deformation localization zone E increases suddenly. At this time, the combined body does not reach the stage of post-peak stress drop because of the development and expansion of the cracks corresponding to the deformation localization zone E. The corresponding stress–strain curve shows the phenomenon of “stress drop”. The state of “sudden increase” of the displacement of the deformation localization zone E continues until the post-peak stress drop stage of the combined body. At this time, the combination did not reach the post-peak stress drop stage, which was caused by the large development and expansion of the corresponding cracks in the deformed localization zone E, and the corresponding stress–strain curve showed the phenomenon of “stress drop”. The state of “sudden increase” in the displacement of the deformed localization zone E lasted until the post-peak stress drop stage of the combination, and the maximum displacement of the deformed localization zone E was 1.524 mm. However, due to the lack of digital scattering measurement points affected by crack extension, the displacement of the deformation localization zone E is not detected in the post-peak stress drop stage. However, since there is only one main control deformation localization zone E in the L-2 combinations, it can be predicted that its displacement will continue to be in the “sudden increase” state in the post-peak stress drop stage.
After 0 s, the deformation localization zone F–G displacement error momentum of the M-2 combinations begins to grow slowly, and the displacement error momentum growth rates of the deformation localization zones F and H are relatively fast. When loaded to 169 s, the displacement error momentum growth rates of the deformation localization zones F and H gradually slows down, and the displacement error momentum growth rate of the deformation localization zone G increases. When loaded to 322 s, the displacement error momentum of the deformation localization zone F “rapid increase”, and the corresponding stress–strain curve appears to depict a “stress drop” phenomenon. A “sudden increase” occurs, corresponding to the stress–strain curve “stress drop” phenomenon. The deformation of the localization zone F displacement error momentum “sudden increase” state continues until the combination of the peak after the stress is applied. When loaded to 331 s, the displacement of the deformation localization zone H “rapid increase”. At this time, the combined body is in the post-peak stress drop stage. The maximum displacements of the deformation localization zones F-I are 0.160, 0.024, 0.185, and 0.003 mm, respectively, and the maximum displacements of the deformation localization zones F and I are much larger than those of the deformation localization zones G and H, which indicates that the deformation localization zone H is the main controlling deformation localization zone affecting the damage of the M-2 combinations.
5.3. Deformation Evolution of Coal and Rock at the Interface and Rebound Deformation Law of the Rock Samples
To analyze the effect of the deformation and damage of the rock–coal combination with different rock properties at the interface of the rock and coal samples, monitoring points are arranged at the interface, as shown in Figure 12. The evolution curves of the absolute displacement changes at Monitoring Points 1–6 at the interface of rock–coal combinations with different rock properties are given in Figure 13.
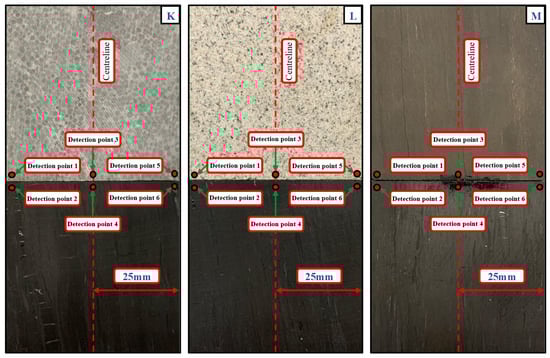
Figure 12.
Layout of the monitoring points for the displacement changes of the rock and coal samples at the interfaces of the rock–coal combinations with different rock properties.
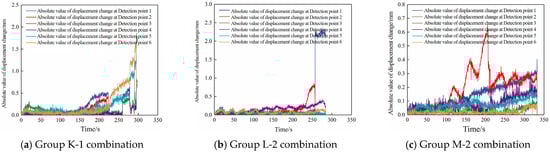
Figure 13.
Displacement variation curves of the rock and coal samples near the interfaces of the rock-coal combinations with different rock properties.
As seen from Figure 13, in the preloading period, the evolution of the absolute displacement changes at Monitoring Points 1–6 are consistent. When the K-1 combinations are loaded to 160 s, the absolute displacement changes of Monitoring Points 1 and 2 increase rapidly. When loaded to 228 s, the absolute displacement changes of Monitoring Points 5 and 6 show a “sudden increase”. When loaded to 260 s, the absolute displacement changes of Monitoring Points 3 and 4 show a “sudden increase”. The changes in the absolute displacement of the monitoring points are mainly affected by the expansion of the deformation localization zone, as well as penetration and displacement misalignment in the combinations. The evolution law of the absolute displacement changes of Monitoring Points 1–6 of the L-2 combination remains consistent at 230 s before loading. During loading at 230 s, the absolute displacement changes of Monitoring Point 2 grow rapidly. During loading at 257 s, the absolute displacement changes of Monitoring Point 1 show a “sudden increase”. During loading at 260 s, the absolute displacement changes of Monitoring Points 3 and 4 show a “sudden increase”. During loading at 257 s, the absolute displacement change of Monitoring Point 1 shows a “sudden increase”. The growth of the absolute displacement changes at Monitoring Points 1 and 2 is mainly affected by the deformation localization zone E. During the loading process, the absolute displacement changes at Monitoring Points 1–5 of the M-2 combinations show a trend of slow growth. During loading at 108 s, the absolute displacement changes at Monitoring Point 2 show large fluctuations, with an overall “sudden increase” followed by a “sudden decrease”. The overall “sudden increase” is followed by a “sudden decrease”. This is mainly due to the uniaxial compression of the oil shale–coal composite, during which the cracks of the oil shale and coal samples penetrate at the interface.
To further reveal the interfacial effects of rock–coal combinations with different rock properties, monitoring points were arranged at the interface of rock and coal samples to monitor the changes in the height Hr of the rock samples and the height Hc of the coal samples, as shown in Figure 14.
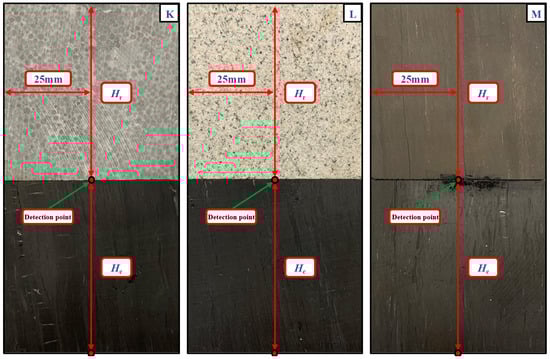
Figure 14.
Layout of the monitoring points of the rock–coal combinations with different rock properties.
The change curves of the axial stress, Hr and Hc of the rock–coal combinations with different rock properties with time are shown in Figure 15. As shown in Figure 15, Hr and Hc show an overall fluctuating and decreasing trend during the damage process of the K-1, L-2, and M-2 rock–coal combinations, in which the fluctuations of Hr and Hc of the combination are mainly affected by the length and number of primary cracks of the rock and coal samples.
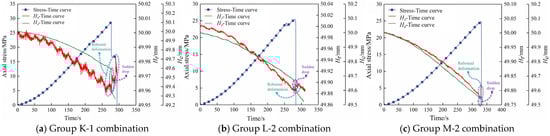
Figure 15.
Time-dependent curves of the axial stress, as well as Hr and Hc of the rock–coal combination with different rock properties.
At the moment of the main rupture of coal samples, the stress–strain curve of the combination has a large drop after the peak, Hr increased to different degrees, and Hc also appeared to have different degrees of reduction characteristics, indicating that the destruction of the coal samples leads to the rebound deformation of the rock samples. Among them, in the K-1 combinations in the stress–strain curve peak after the fall moment, Hc depicted a “sudden drop” phenomenon, and it was reduced by 0.247 mm. At this time, the rock sample rebounded. The rebound deformation amount is 0.025 mm, and the rebound deformation rate is 0.050%. Regarding the L-2 combinations in the stress–strain curve peak after the fall moment, Hc “suddenly dropped”. It was reduced by 0.050 mm. At this time, the rock samples rebounded. The rebound deformation amount is 0.014 mm, and the rebound deformation rate is 0.028%. Regarding the M-2 combinations in the stress–strain curve peaks after the fall moment, Hc “suddenly decreased” by 0.025 mm. The rebound deformation rate is 0.050%. Regarding the L-2 combinations in the stress–strain curve peaks after the fall moment, Hc “suddenly decreased” by 0.049 mm. At this time, the rock samples rebounded. The rebound deformation amount is 0.040 mm, and the rebound deformation rate is 0.080%. Combined with the previous analysis, when the coal sample at the interface of group M combination is damaged, due to the characteristics of large deformation of oil shale, defects such as primary or new cracks are more likely to develop and extend to the whole coal sample when the combination is damaged. And the acoustic emission energy rate signal of M-3 combination shows a “Multi-peak” type, indicating whether the continuous energy release caused by the rapid rebound of oil shale will lead to multiple acoustic emission impacts, thus continuing to damage the coal.
The rock lithology significantly affects the rebound deformation of the rock portion in the combination. Both the magnitude and the rate of rebound deformation follow the order: oil shale > limestone > sandstone. The largest rebound deformation rate of the rock samples of the oil shale–coal combination is mainly affected by the relatively high strength and small deformation of limestone, relatively high strength and large deformation of sandstone, and relatively low strength and large deformation of oil shale. The oil shale–coal combination has the largest compression deformation amount of the original rock samples in uniaxial compression relative to the other two combinations, which leads to the largest rebound deformation rate of the rock samples. It can be seen from Figure 13 and Figure 14 that although the displacement evolution curve of M-2 shows a large number of development and expansion of cracks in the combination before the stress peak, on the one hand, the overall deformation of M-2 is smaller than that of K-1 and M-2, on the other hand, M-2 is mainly realized as the deformation of coal samples in the combination (especially its Monitoring Point 2). Combined with the above analysis, the oil shale–coal combination stores more elastic energy, so its pre-peak dissipation energy is the lowest and its internal damage is the smallest.
6. Conclusions
- (1)
- The rock properties affect the UCS and E of the combination. With the decrease in UCS and E of the rock sample of the combination, the UCS and E of the combination decrease.
- (2)
- The strength of rock coal assemblage mainly depends on the strength of coal sample far from the interface, and the coal sample is the main bearing body in the process of uniaxial compression
- (3)
- Because oil shale has relatively low strength and large deformations, the relatively large deformation rock properties can improve the ability of the combinations to convert external energy into elastic energy.
- (4)
- The acoustic emission energy rate signal of rock coal combination can be divided into three stages: quiet, active, and sudden increase. The acoustic emission energy rate signals of limestone coal and sandstone coal assemblages are of “lone-shock” type, while the acoustic emission energy rate signals of oil shale coal assemblages are of “Multi-peak” type.
- (5)
- When the oil shale has relatively low strength and large deformation occurs, both the rock sample and coal sample of the combination exhibit deformation localization zones, and the deformation localization zones in the rock sample and coal sample run through at the rock coal interface, which eventually leads to the failure of both the rock sample and coal sample of the combination.
Author Contributions
S.S. performed substantial contributions to the conception and design of the work and revised the manuscript. L.H. finished writing the original manuscript. D.Y. and F.L. processed pictures and data of manuscript. F.F. and X.Q. designed the discussion and revised the manuscript. All authors have read and agreed to the published version of the manuscript.
Funding
This research was funded by the National Natural Science Foundation of China (Nos. 52574153, 52274128 and 52404133), and the Taishan Scholars Project Special Fund (NO. tsqn202306199).
Informed Consent Statement
The authors have approved and consented to publish the manuscript.
Data Availability Statement
All data generated or analyzed during this study are included in this published article.
Conflicts of Interest
Author Lei Han was employed by the company Shanxi Coal International Energy Group Co., Ltd. The remaining authors declare that the research was conducted in the absence of any commercial or financial relationships that could be construed as a potential conflict of interest.
References
- Li, P.; Yu, H.Y.; Zhang, J.S.; Du, M.Y.; Xiong, J. Coal Supply Sustainability in China: A New Comprehensive Evaluation Methodology. Front. Energy Res. 2022, 9, 701719. [Google Scholar] [CrossRef]
- Chen, Y.; Sun, X.K.; Zhang, X.F.; Gu, P.; Li, G.Y.; Yang, S.L.; Fan, D.Y.; Liu, C.C.; Liu, X.S. Evaluation Method for Rock Burst Hazards in Strip Filling of Working Faces in Deep Coal Mines. Appl. Sci. 2023, 13, 10452. [Google Scholar] [CrossRef]
- Cheng, J.J.; Liu, Y.; Li, X.W. Coal mine rock burst and coal and gas outburst perception alarm method based on visible light imagery. Sustainability 2023, 15, 13419. [Google Scholar] [CrossRef]
- Sharma, V.; Loginova, J.; Zhang, R.L.; Kemp, D.; Shi, G.Q. How do past global experiences of coal phase-out inform China’s domestic approach to a just transition? Sustain. Sci. 2023, 18, 2059–2076. [Google Scholar] [CrossRef]
- Manouchehrian, A.; Cai, M. Analysis of rockburst in tunnels subjected to static and dynamic loads. J. Rock Mech. Geotech. Eng. 2017, 9, 1031–1040. [Google Scholar] [CrossRef]
- Wang, H.Y.; Li, B.B.; Li, J.H.; Ren, C.H.; Ye, P.P.; Ye, Y.Z. An innovative coal permeability model based on elastoplastic mechanics: Development and verification. Phys. Fluids 2024, 36, 126634. [Google Scholar] [CrossRef]
- Yin, S.F.; Zheng, X.J.; Wang, E.; Kang, Q.T.; Zhang, X.M. Non-uniform failure and differential pressure relief technology of roadway under irregular goafs in deep close-distance coal seams. Sci. Rep. 2023, 13, 18527. [Google Scholar] [CrossRef]
- Meng, H.; Yang, Y.Z.; Guo, H.J.; Hou, W.; Li, X.W.; An, F.H.; Zhang, R.; Chen, L.; Rong, T.L.; Yang, D.M.; et al. Experimental investigation on the gas pressure influence laws and mechanical mechanism of coal and gas outbursts. Phys. Fluids 2024, 36, 096614. [Google Scholar] [CrossRef]
- Duan, J.H.; Mu, W.Q.; Li, L.C.; Han, Y.C.; Zhang, Y.S.; Ren, B. Slurry flow mechanism with time-varying viscosity in regional long-hole grouting for floor reinforcement. Phys. Fluids 2024, 36, 083115. [Google Scholar] [CrossRef]
- Kang, H.P.; Gao, F.Q.; Xu, G.; Ren, H.W. Mechanical behaviors of coal measures and ground control technologies for China’s deep coal mines—A review. J. Rock Mech. Geotech. Eng. 2023, 15, 37–65. [Google Scholar] [CrossRef]
- Sun, Z.H.; Yu, K.; Zhen, Z.; Raza, A.; Lv, J.K. Control mechanism of regional structure on geothermal water chemistry, geothermal field and thermal hazard in a coal mine. Geoenergy Sci. Eng. 2025, 256, 214164. [Google Scholar] [CrossRef]
- Lv, J.K.; Xiong, L.C.; Ma, J.; Yu, K.; Cui, W.X.; Zhang, Z.; Yan, Z.H. Mechanism of Floor Failure During Coordinated and Sustainable Extraction of Coal and Geothermal Resources in Deep Mines: A Case Study. Sustainability 2025, 17, 10341. [Google Scholar] [CrossRef]
- Nie, F.X.; Wang, H.L.; Qiu, M. Research on the Disaster-Inducing Mechanism of Coal-Gas Outburst. Adv. Civ. Eng. 2020, 2020, 1052618. [Google Scholar] [CrossRef]
- Moganedi, K.A.; Stacey, T.R. Value creation as an approach to the management and control of rockburst damage in tunnels. Tunn. Undergr. Space Technol. 2019, 83, 545–551. [Google Scholar] [CrossRef]
- Khan, N.M.; Ahmad, M.; Cao, K.W.; Ali, I.; Liu, W.; Rehman, H.; Hussain, S.; Rehman, F.U.; Ahmed, T. Developing a new bursting liability index based on energy evolution for coal under different loading rates. Sustainability 2022, 14, 1572. [Google Scholar] [CrossRef]
- Bai, J.Z.; Dou, L.M.; Li, X.W.; Ma, X.T.; Lu, F.Z.; Han, Z.P. Evolution Laws of Stress–Energy and Progressive Damage Mechanisms of Surrounding Rock Induced by Mining Disturbance. Appl. Sci. 2023, 13, 7759. [Google Scholar] [CrossRef]
- Mark, C.; Gauna, M. Pillar design and coal burst experience in Utah Book Cliffs longwall operations. Int. J. Min. Sci. Technol. 2019, 31, 33–41. [Google Scholar] [CrossRef]
- Ma, Z.K.; Li, S.; Zhao, X.D. Energy accumulation characteristics and induced rockburst mechanism of roadway surrounding rock under multiple mining disturbances: A case study. Sustainability 2023, 15, 9595. [Google Scholar] [CrossRef]
- Liu, Y.; Ouyang, Z.H.; Yi, H.Y.; Qin, H.Y. Study of the multilevel fuzzy comprehensive evaluation of rock burst risk. Sustainability 2023, 15, 13176. [Google Scholar] [CrossRef]
- Chen, Y.; Zhang, Z.K.; Cao, C.; Bao, S.J.; Wang, S.; Xu, G.Y. Research on the causal mechanism of a rock burst accident in a longwall roadway and its prevention measures. Sci. Rep. 2023, 13, 22312. [Google Scholar] [CrossRef] [PubMed]
- Yang, Y.R.; Guo, Z.G.; Lu, Y.; Zhou, L.J.; Zheng, B.H.; Ye, W.H. Behavior of sodium dodecyl sulfate at the gas-liquid interface based on the coupling of temperature and calcium chloride concentration. Phys. Fluids 2024, 36, 122009. [Google Scholar] [CrossRef]
- Khanal, M.; Zhu, Y.R.; Xie, J.L.; Zhu, W.B.; Hou, T.; Song, S.K. Characterization of Overburden Deformation and Subsidence Behavior in a Kilometer Deep Longwall Mine. Minerals 2022, 12, 543. [Google Scholar] [CrossRef]
- Sengani, F. The use of ground Penetrating Radar to distinguish between seismic and non-seismic hazards in hard rock mining. Tunn. Undergr. Space Technol. 2020, 103, 103470. [Google Scholar] [CrossRef]
- Yuan, H.P.; Ji, S.J.; Liu, G.L.; Xiong, L.J.; Li, H.Z.; Cao, Z.H.; Xia, Z.J. Investigation on Intelligent Early Warning of Rock Burst Disasters Using the PCA-PSO-ELM Model. Appl. Sci. 2023, 13, 8796. [Google Scholar] [CrossRef]
- Huang, X.W.; Guo, J.; Miao, Y.S.; Xie, X.Q.; Li, Y.J.; Wang, H.L.; Huang, F.F. A Study on the Roof-Cutting and Pressure Releasing Technology of Roof Blasting. Appl. Sci. 2023, 13, 9968. [Google Scholar] [CrossRef]
- Shreedharan, S.; Kulatilake, P.H.S.W. Discontinuum-Equivalent Continuum Analysis of the Stability of Tunnels in a Deep Coal Mine Using the Distinct Element Method. Rock Mech. Rock Eng. 2016, 49, 1903–1922. [Google Scholar] [CrossRef]
- Li, C.Y. Fracturing characteristics and instability modes of deep primary coal-rock combinations under triaxial compression. Coal Geol. Explor. 2024, 52, 111−123. [Google Scholar] [CrossRef]
- Yu, Y.J.; Yang, Y.T.; Wang, P.B.; Wang, Z.M.; Song, Z.Y.; Liu, J.M.; Zhao, S.Q. Failure energy evolution of coal–rock combination with different inclinations. Sci. Rep. 2022, 12, 19455. [Google Scholar] [CrossRef] [PubMed]
- Zhang, H.W.; Elsworth, D.; Wan, Z.J. Failure response of composite rock-coal samples. Geomech. Geophys. Geo-Energy Geo-Resour. 2018, 4, 175–192. [Google Scholar] [CrossRef]
- Qi, Q.X.; Li, Y.Z.; Zhao, S.K.; Zhang, N.B.; Zheng, W.Y.; Li, H.T.; Li, H.Y. Seventy years development of coal mine rockburst in China: Establishment and consideration of theory and technology system. Coal Sci. Technol. 2019, 47, 1–40. [Google Scholar] [CrossRef]
- Fan, Y.F.; Xiao, X.C.; Xu, J.; Ding, X.; Wang, A.W.; Wang, B.F.; Lei, Y. Failure characteristics and conditions of rock-coal combination structure with weak layer under dynamic and static stresses. Sci. Rep. 2023, 13, 12410. [Google Scholar] [CrossRef]
- Wang, H.; Chang, J.; Wang, T.; Zhang, H.; Guo, Y. Mechanical Properties and Strength Characteristics of Rock–Coal–Rock Assemblages under Different Peripheral Pressures. Sustainability 2023, 15, 12463. [Google Scholar] [CrossRef]
- Zuo, J.P.; Wang, Z.F.; Zhou, H.W.; Pei, J.L.; Liu, J.F. Failure behavior of a rock-coal-rock combined body with a weak coal interlayer. Int. J. Min. Sci. Technol. 2013, 23, 907–912. [Google Scholar] [CrossRef]
- Liu, X.S.; Tan, Y.L.; Ning, J.G.; Lu, Y.W.; Gu, Q.H. Mechanical properties and damage constitutive model of coal in coal-rock combined body. Int. J. Rock Mech. Min. Sci. 2018, 110, 140–150. [Google Scholar] [CrossRef]
- Yang, L.; Gao, F.Q.; Wang, X.Q. Mechanical response and energy partition evolution of coal-rock combinations with different strength ratios. Chin. J. Rock Mech. Eng. 2020, 39, 3297–3305. [Google Scholar] [CrossRef]
- Xu, J.H.; Zhang, X.W.; Liu, Z.B.; Sun, L.; Hou, S.J. Mechanical Response and Energy Evolution Law of Coal-Rock Combined Specimen under Cyclic Loading and Unloading Conditions. J. Yangtze River Sci. Res. Inst. 2022, 39, 89–94. [Google Scholar] [CrossRef]
- Li, C.J.; Xu, Y.; Ye, Z.Y. Energy dissipation and crushing characteristics of coal-rock-like combined body under impact loading. Chin. J. Geotech. Eng. 2020, 42, 981–988. [Google Scholar] [CrossRef]
- Yu, W.J.; Pan, B.; Li, K.; Shen, W.B. Mechanical properties and fracture evolution law of rock-coal-rock combination. J. China Coal Soc. 2022, 47, 1155–1167. [Google Scholar] [CrossRef]
- Chen, S.J.; Li, F.X.; Yin, D.W.; Zhang, J.C. Experimental study on deformation failure characteristics of limestone − coal composite with different rock-coal height ratios. J. Cent. South Univ. Sci. Technol. 2023, 54, 2459–2472. [Google Scholar] [CrossRef]
- Vasyliev, L.; Malich, M.; Vasyliev, D.; Katan, V.; Rizo, Z. Improving a technique to calculate strength of cylindrical rock samples in terms of uniaxial compression. Min. Miner. Depos. 2023, 17, 43–50. [Google Scholar] [CrossRef]
- Winkler, M.B.; Fruhwirt, T.; Marcher, T. Elastic Behavior of Transversely Isotropic Cylindrical Rock Samples under Uniaxial Compression Considering Ideal and Frictional Boundary Conditions. Appl. Sci. 2023, 14, 17. [Google Scholar] [CrossRef]
- Yin, D.W. Experimental Study on Stabilities of Roof-Coal Pillar Structural body. Case Stud. Constr. Mater. 2018, 18, e02147. [Google Scholar] [CrossRef]
Disclaimer/Publisher’s Note: The statements, opinions and data contained in all publications are solely those of the individual author(s) and contributor(s) and not of MDPI and/or the editor(s). MDPI and/or the editor(s) disclaim responsibility for any injury to people or property resulting from any ideas, methods, instructions or products referred to in the content. |
© 2025 by the authors. Licensee MDPI, Basel, Switzerland. This article is an open access article distributed under the terms and conditions of the Creative Commons Attribution (CC BY) license.