Abstract
Numerical modelling of airflow in underground mines is gaining importance in modern ventilation system design and safety assessment. Computational Fluid Dynamics (CFD) simulations enable detailed analyses of air movement, contaminant dispersion, and heat transfer, yet their reliability depends strongly on the accuracy of the geometric representation of excavations. Raw point cloud data obtained from laser scanning of underground workings are typically irregular, noisy, and contain discontinuities that must be processed before being used for CFD meshing. This study presents a methodology for automatic segmentation and regularization of large-scale point cloud data of underground excavation systems. The proposed approach is based on skeleton extraction and trajectory analysis, which enable the separation of excavation networks into individual tunnel segments and crossings. The workflow includes outlier removal, alpha-shape generation, voxelization, medial-axis skeletonization, and topology-based segmentation using neighbor relationships within the voxel grid. A proximity-based correction step is introduced to handle doubled crossings produced by the skeletonization process. The segmented sections are subsequently regularized through radial analysis and surface reconstruction to produce uniform and watertight models suitable for mesh generation in CFD software (Ansys 2024 R1). The methodology was tested on both synthetic datasets and real-world laser scans acquired in underground mine conditions. The results demonstrate that the proposed segmentation approach effectively isolates single-line drifts and crossings, ensuring continuous and smooth geometry while preserving the overall excavation topology. The developed method provides a robust preprocessing framework that bridges the gap between point cloud acquisition and numerical modelling, enabling automated transformation of raw data into CFD-ready geometric models for ventilation and safety analysis of complex underground excavation systems.
1. Introduction
Accurate simulation of airflow in underground mines becomes essential for ventilation design, control of hazardous gases and dust, emergency planning, and energy-efficient operation. Computational Fluid Dynamics (CFD) provides detailed airflow prediction even in complex mine networks, providing high detail that simpler models used in different tools cannot capture [1]. However, the fidelity of CFD results in the case under consideration depends on the geometric representation of the mine workings, which will affect the credibility of obtained flow fields and ultimately engineering conclusions. Workflows, therefore, should place a premium on robust preprocessing that converts raw survey data into watertight, regularized geometries suitable for meshing. Although traditional approaches allow for an estimation of surface roughness, in the terms of simulation it has minimal impact on airflow. The level of ditail that generate meaningful, perceivable turbulences, the most important factors come from large direction changes (turns, crossroads) and geometry deformations on the level of at least several centimeters. Terrestrial Laser Scanning (TLS) and mobile LiDAR systems provide dense point clouds that capture the true, often very irregular, morphology of shafts, drifts, and crosscuts [2]. However, raw point clouds are not immediately usable for CFD because of noise, outliers, non-uniform sampling density, occlusions, and localized data scarcity [3].
Moreover, the complex topology of an excavation network-long single-line drifts intersecting at crossroads and bifurcations produces point sets with strong local curvature and abrupt topology changes that complicate direct surface reconstruction. If left unprocessed, these issues lead to poor mesh grading, large aspect-ratio elements, non-manifold surfaces, and expensive or unstable numerical simulations. Effective preprocessing must therefore regularize both the sampling to control element size and quality, and the topology to ensure consistent connectivity and watertightness before mesh generation.
In this article, we expand on the methodology presented in the previous work [4] by proposing a segmentation algorithm for large excavation networks that allows separate processing of single-line excavations and crossings. The previous article presented the methodology for processing of a single-line excavations based on radial processing of cross-sections, where eventual crossings were closed (filled at a set distance from the tunnel, by treating them as a holes in data). This approach was useful for the fast scanning and simulation of the main ventilation arteries and to examine influence of the local geometry on the general airflow distribution. To get a better understanding of the airflow complexity, the model of a whole excavation system is necessary, as it usually contains a multiple input and output points of the ventilation that might interact with each other. As the crossroads are necessary for such representation, previous methodology has been expanded with the:
- segmentation of the whole excavation network through a trajectory processing and analysis, separating the crossroads (where the previous algorithm had to be modified to address the closing of the one pair of outgoing tunnels) and single line excavation sections (where the previous algorithm can be used without any changes). This also allows for parallelization of the processing.
- pipeline for the crossroads processing.
- merging of the previously separated sections of the network.
For the results we present two cases: processing of the large fragment of excavation network scanned with the use of remote scanner, and a processing of more complex excavation network synthetically generated from fragments of real scanned data.
2. State of the Art
Laser scanning technologies are being adopted more widely in the mining sector, across both surface and underground operations. The primary systems in use include Terrestrial Laser Scanning (TLS) [2,5] and Mobile Mapping Systems (MMS) [6,7]. TLS is an active remote sensing method that captures object data with high point density and precision. While it is commonly applied to map mining areas, it is generally best suited for relatively small zones. For surveying larger areas, MMS offers a more appropriate solution, enabling rapid data collection with accuracy on the order of a few centimeters [3]. Moreover, the compact design of MMS sensors enhances their usability in demanding mining environments [8]. Mobile mapping supports applications similar to TLS, such as reconstructing excavation geometries [9], identifying machine wear or damage [10], and performing geotechnical assessments [11].
The problem of point cloud segmentation became increasingly relevant with the improvement of the scanning technologies and rapidly growing availability of large scan data collected on a massive scale. As a result, a wide range of methods have been developed to deal with this problem. This includes, among others, edge based segmentation, region growing, model fitting and machine learning approaches [12].
In edge based segmentation, the algorithm outlines boundaries of separate regions, often reminiscent of image detection, such as in [13]. The segments are then derived from the point cloud by grouping points in the separated areas. Surface based or region growing segmentation use local similarities of neighboring points to collect sets of data around starting points (one or more). Similarity criteria can include geometrical properties (such as proximity, curvature, and planarity of surfaces) or color properties [14]. Scanline based segmentation uses scanlines (the ordered sequences of points produced by each laser beam of the scanner) to create separate surfaces based on the line similarities [15]. In [16] the authors proposed a new method using the smoothness constraint, which improved over previous approaches that often lead to over segmentation.
Another branch of methodology that addresses the problem of point cloud segmentation revolves around machine learning. Early heuristic approaches included algorithms such as Maximum Likelihood classifiers based on Gaussian Mixture Models, Support Vector Machines, Conditional Random fields, and Markov Random Fields [17]. The later development of neural networks (convolutional, reccurent, deep belief) have greatly developed the accuracy of automatic segmentation results. PointNet is one of the first architectures applied to such tasks [18], with many different approaches created later. Some examples are voxel featured encoding [19], self organizing map [20] or pointwise convolution [21].
Noticeably, the problem of cloud processing of underground excavation points has been previously discussed in [22] where the authors presented a solution with a similar idea of processing separate cross-sections parallel to skeleton obtained through cylindrical shape decomposition [23] and maximal inscribed spheres centered at every point belonging to the Voronoi diagram [24]. The spatial segmentation obtained through the Vascular Modeling Toolkit (VMTK) (a python library for the analysis of tubular structures in medical images, which is a structure roughly similar to the excavation network [25]) presented in the article provides very simple results that do not exhibit a logical separation between crossings (excavation intersections) and single line excavations.
In this article, we present a more narrow approach of point cloud segmentation suited directly for the purpose of underground excavation point cloud processing. As it makes direct use of the scanned point cloud structure (long “tunnel-like” structures intersecting with each other in simple crossing sections), this methodology can be applied only to data with similar properties. For a complete understanding of the methodology intricacies, previous work [4] is necessary, as it explains in detail the idea behind the single-line excavation processing utilized further in the article.
3. Data Acquisition
The surveyed sections were recorded within a copper mining operation in Poland. Data acquisition was performed using the PoLiMap system, which was developed as part of the VOT3D project (Ventilation Optimization Technology based on 3D scanning) [26] (Figure 1). This solution incorporates the Livox Avia laser scanner [27], mounted on a gimbal stabilizer to maintain steady measurements, particularly when the device operates while in motion on a vehicle. The system also includes an NVIDIA Jetson Xavier module running the Robot Operating System (ROS), along with power units, a Livox Converter 2.0, an external storage drive, and a tablet interface. Data processing relies on FAST-LIO-SLAM, an open-source LiDAR-based SLAM framework [28]. According to the results presented in [26], the median absolute deviation relative to reference data reached an accuracy of approximately 2.5 cm. This accuracy level verifies the system’s reliability in producing high-quality 3D measurements.
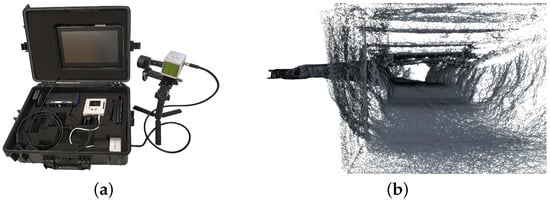
Figure 1.
Data acquisition: (a) PoLiMap system with its equipment [26] and (b) view of 3D data acquired from measurement.
Data obtained from the scanning is limited, as a more extensive measurement operation would disturb the facility workflow. Therefore, for a good example of the algorithm performance in larger sections of excavation, a synthetic data have been prepared by combining copied parts of small scanned sections into a realistic large section. The potentially problematic places of connection have been smoothed by applying a simple mesh and extracting the points from its end result. The meshing process was focused on maintaining the geometric properties of the real data rather than the mesh quality, to better simulate the realistic point cloud scan.
4. Methodology
The flowchart of proposed methodology can be seen in Figure 2. The main focus of this article is on the segmentation part of the algorithm and the processing of crossings, as these are the sections not discussed in previous work [4]. The general methodology can be dissected into the following stages:
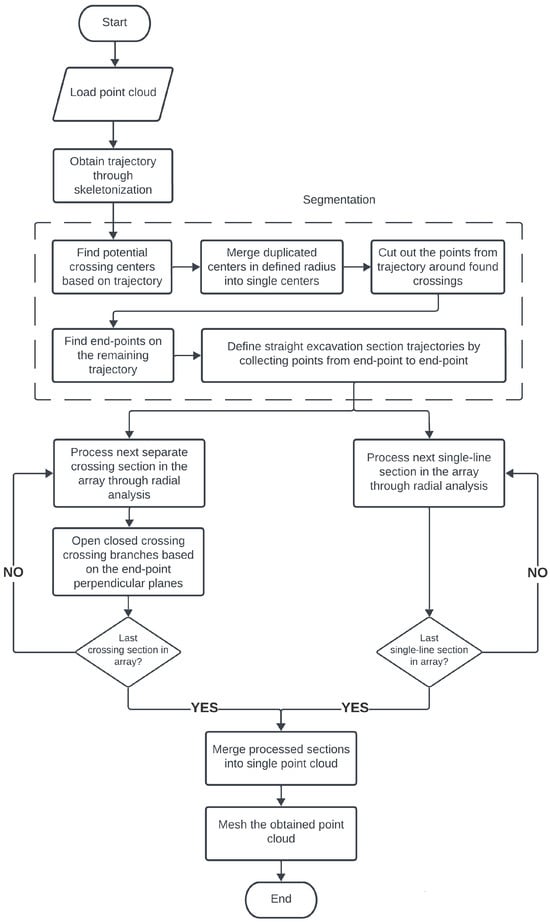
Figure 2.
Flowchart of the methodology for creating regularized models from large excavation sections.
- Point cloud preprocessing, this includes cases such as the removal of parts of the scanned excavation with very scarce data that could not be reconstructed due to missing the necessary pattern (this might be related to the directional scanning where sudden changes in elevation would result in lack of measurement of, as example, the opposing walls of the excavation), and other improper data acquisition problems, either related to the drift or improper merging of separate measurement sessions. Such situations must be manually found and either removed (in this case, letting the algorithm to fill the created hole in data) or corrected (by supplementary measurements as an example).
- Skeletonization—this step provides the basis for the segmentation. It generates a trajectory of the excavation, understood as a simplified 3D representation of the general shape.
- Segmentation—At this step, the excavation is separated into different sections based on the obtained trajectory. The main elements separating the trajectory are the crossings that can be removed (while saving as separate trajectories) in a set area around their center. After that the remaining points in the trajectory can be easily categorized into different single-line parts of excavation.
- Processing of separated sections—each separated section is then processed along methodology described in detail in the previous work [4] with important information incorporated into methodology section of this article. The one distinction important for the processing of crossing is that they need an additional step of opening the entry points closed during the processing.
- Merging of the processed, segmented sections of the excavation network (crossroads and single line excavations) into a single point cloud.
4.1. Skeletonization
The general skeletonization flowchart remains identical to that in the previous work. Its part related to general trajectory generation, important at this stage of methodology, can be seen in Figure 3. For the skeletonization algorithms to be applied, the point cloud has to be first processed in a way that would enable use of the popular algorithms. The simplified procedure (described in detail in the previous paper) is as follows:
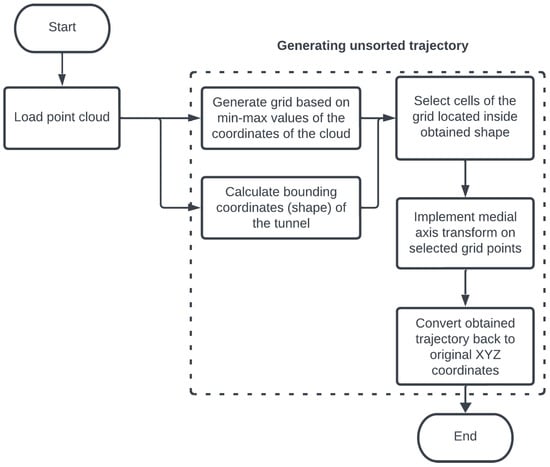
Figure 3.
First part of the skeletonization flowchart - obtaining initial trajectory [4].
- Obtain the alpha shape [29] of excavation.
- Define a grid of voxels limited by the maximum excavation dimensions.
- Find and separate voxels within the obtained shape.
- Perform skeletonization algorithm (medial axis transform as example [30]) on the separated set of voxels.
The procedure up to this point is shown on the flowchart in Figure 3. The end result is a trajectory that requires further processing, although it will be different between single-line sections of the excavation and its crossroads. For that, a segmentation of the excavation network is necessary.
4.2. Segmentation
As the excavation geometry is processed through radial analysis, the trajectory must first be segmented. This can be accomplished using the properties of the obtained skeleton (trajectory), namely:
- Each point in the trajectory is part of the previously created voxel grid and therefore has possible neighbors through the wall, edges, and corners of the square voxel as in Figure 4.
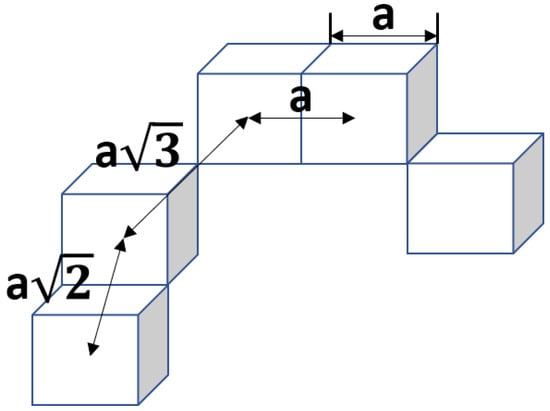 Figure 4. Possible neighboring voxels position combinations, where a is the declared edge size of a single square voxel [4].
 - Since skeletonization algorithms prevent redundant voxels, an end of the trajectory will have a single neighbor (understood as another point from the skeleton in the distance of a, or ).
- Points in the trajectory that have two neighbors represent the single-line continuous parts of the excavation.
- Points on the trajectory with at least three neighbors represent the potential centers of crossings.
Due to the nature of skeletonization (medial axis transform in this case), the skeleton obtained at the crossroads can result in generation of two near crossings on the trajectory. Without additional processing, this would split the crossing into two parts, usually in half. Such cases can be seen in Figure 5.
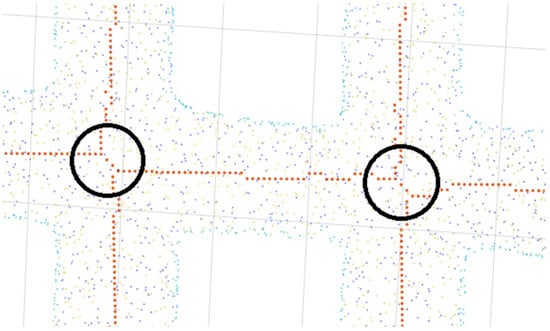
Figure 5.
Example of doubled crossings. Orange points—points obtained from skeletonization. Other point colors—original point cloud data. Black circles highlight exact areas with doubled crossings.
The very simple solution is to add the proximity parameter that, for convenience, can be tied to the parameter set by the user, such as the expected size (diameter) of the tunnel. If the two or more detected crossings are closer than said parameter, the crossings are merged. This is a two step operation: first, a new center of the crossing is defined by calculating the average of their coordinates. Then, all the points on the trajectory in a set radius (that can be tied to the same parameters as the proximity parameter) are removed from the set and saved as separate segments for later processing. This procedure is repeated for each detected cluster of crossings.
In the end, what remains of the original trajectory is a set of separate lines each representing separate sections of a single line excavation. They can be further segmented by a simple algorithm that finds a random starting point on the trajectory with just a single neighboring point (according to the voxel principle presented at the beginning of this section). The points are then collected by adding the neighboring point to the newly created line and removing it from the remaining set of trajectory points. This is repeated until the new point does not have any neighbors left; therefore, it is considered the end of line. The whole procedure (finding the starting point and adding neighboring points until no more can be found) is repeated until the main trajectory is empty.
The end result of segmentation is a set of separate trajectories representing either single lines or crossings with a newly defined center.
4.3. Single-Line Excavation Processing
The methodology of a straight excavation processing remained mostly unchanged from the methodology presented by the authors in [4], which can also be seen in the Figure 6.
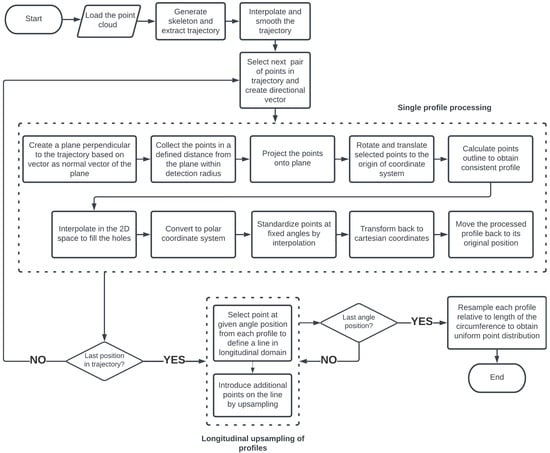
Figure 6.
Algorithm for a single line excavation processing [4].
The general idea is to properly extract consecutive profiles from the scanned point cloud by radial processing of point sets selected along the obtained trajectory. In this case, this will apply directly to the single-line trajectory segments obtained during segmentation. This consists of the following steps:
- Orthogonal sampling and flattening—a set of consecutive excavation profiles is constructed along the trajectory by creating planes perpendicular to lines created between two selected points (on said trajectory) and then projecting points from the original point cloud in a selected distance. To simplify the next step of the methodology, planes are then transformed to the origin of a Cartesian coordinate system. The stored transformation parameters (translation and rotation of each separate plane) are used at the end of the angular resampling to restore the original position of the points.
- Boundary calculation—to define the general geometry of excavation and remove objects scanned inside of excavation, the outside boundary is calculated. It consists of an outermost point on the profile, selected through implementation of the alpha shape algorithm.
- Correctional interpolation—step necessary to obtain uniform point distribution along the profile and patch holes (understood as areas without scanned points) that could have occurred during measurements. The interpolation is applied using the Modified Akima Cubic Hermite algorithm [31].
- Angular resampling—The goal of this step is to ensure that the profiles contain an equal number of points that occupy the same angular position relative to the center of the profile. This is done in the polar coordinate system as that allows point distribution along 0 to 2 through a linear interpolation. Thanks to this approach, all of the separate profiles consist of points on the same angles calculated from the center of the profile (understood as the relative point on trajectory).
- Longitudinal upsampling—using the unform angular distribution of points between separate profiles, the number of points along each angle of the processed excavation can be controlled. This in conjunction with applied angle step allows for full control of point density in the point cloud.
- Circumference resampling—as the number of points in the profile should be linearly proportional to its circumference, an additional interpolation similar to one used in the correctional interpolation step is used as a final step of profile processing.
The complete explanation of each step in this part of the methodology can be found in [4].
4.4. Crossroads Processing
Crossroads use the mainly same algorithm as the one presented in Section 4.3, although there are few significant differences. First, the obtained trajectory has to be additionally processed, since it consists of two crossing lines, of which one has to be selected and smoothed. The general idea can be seen in Figure 7. From the previous segmentation, the crossroad is defined by points on the trajectory that connect with the outside single-line excavation sections.
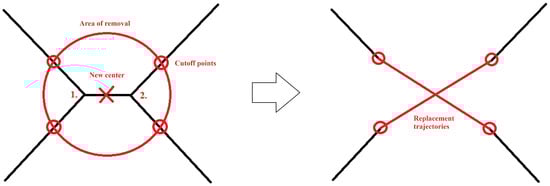
Figure 7.
Example of crossing trajectory processing from 2D perspective. Left side—calculation of unified ne crossroad center based on detected, close crossroad centers (1 and 2) and removal of points inside specified radius (area of removal). Right side—generating new crossroad trajectories connecting previous cutoff points (that are defined as points intersected by the circle).
Between opposite points (pair) new trajectory is interpolated. Then, one of the trajectories is selected, a random one in case of the X-type crossing. In the case of T-type crossing, only one connecting pair exists.
After a new trajectory is obtained, the algorithm from the previous subsection is applied. It runs along the one selected trajectory (from two intersecting ones in the X-type crossing) or the one that consists of two opposite crossing entries in case of the T-type crossing. This will result in closing of the crossing exits opposite to the selected trajectory, which have to be opened again.
This is realized by generating planes perpendicular to the trajectory that cut off points in the directions opposite to the center of the crossing. The general algorithm of perpendicular plane is similar to one in the sampling part of the single line-excavation processing and is repeated for each closed entry of the crossing (two in case of X-type and one in case of T-type crossing):
- obtain normal vector from the two last points on the trajectory,
- generate perpendicular plane perpendicular to the trajectory, based on the obtained normal vector,
- find and remove all the points on the side of the plane facing in the opposite direction to the center of the crossing.
This step ensures that at the merging stage of algorithm there are no additional points inside the excavation.
4.5. Processing of Profiles with High Point Scarcity
Using the radial analysis approach can rarely (large area of missing data) result in cross-sections that are not feasible for the proposed processing methods. Additionally, excavation dead ends can become tricky for the boundary or interpolation algorithms at few profiles sampled near the end. Both problems can be solved by a simple quality control applied after the sampling steps of the algorithm. From a set of cross-sections in currently processed excavation section a median number of points per profile can be calculated. Then, any profile with significantly fewer points (0–30% median value) can be discarded from further processing.
This approach is possible due to the longitudinal interpolation part of the methodology which will ensure continuity of points even through missing parts of data. The only negative impact on the results will be the flattening of the surface of affected areas, especially noticeable in large spaces of missing data. In such cases, this is completely acceptable, as no geometrical information can be derived unless supplementary measurements are provided. This information can be presented to the end user through colored data points in the sections where multiple consecutive profiles had to be removed.
4.6. Sections Merging
To merge the separated sections, they simply have to be put into the same space, which is a simple additive operation, since profiles after processing are returned to their original coordinates. Some inadequacies along the connecting areas between the separate sections can be expected - overlapping points or small disconnected areas. This is a result of the separate processing, where some profiles can be removed, which is counteracted with a slight overlap. The mesh generated in the affected areas provides acceptable quality (understood as preserving the original geometry and usability in airflow simulations), therefore, no further processing is necessary.
5. Results
The results have been divided into two separate sections. The first section focuses on processing the smaller part of the excavation based on a real scan from the PoLiMap system. The second section is based on the semi-artificial model described in the Data Acquisition section.
5.1. Processing of Real Data Example
The complete scanned point cloud can be seen in Figure 8. Changing colors of the point cloud represent a change in elevation. As can be seen, the data consist mostly of a single long excavation line with a series of protruding branches. Although some of the branches were dead ends, most of them are a part of further expanding branches that were not fully scanned.
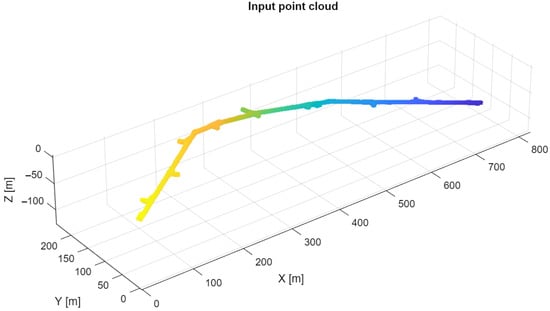
Figure 8.
Raw point cloud scanned with PoLiMap system.
The effect of point cloud skeletonization can be seen in Figure 9. This is a raw trajectory that goes through the middle of the excavation shape. At this point of the processing it has a stepped shape, since the skleletonization has been run on the voxel grid with a size of 20 cm. This will be corrected for segmented long-line sections of the network by smoothing (linear interpolation). This approach is much better than setting a smaller grid cell size, as it has a large impact on the skeletonization processing time while providing almost identical results. The trajectory intersections visible on the crossing will be segmented in a circle of 5 m from the center of the crossing. This parameter has to be individually set for the excavation networks according to the expected size of the crossings (which is usually relative to the diameter of the cross-section).
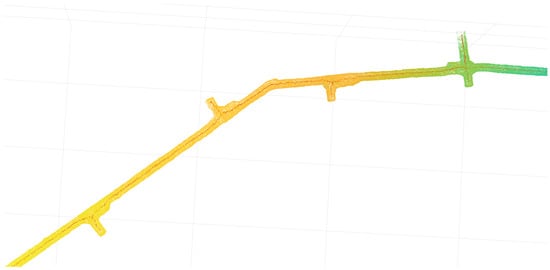
Figure 9.
Part of the excavation network raw trajectory obtained through skeletonization (red points).
The result of segmentation can be seen in Figure 10. The algorithm properly segmented the obtained trajectory. The recesses that can be seen on the original point cloud Figure 8 between crossings 2 and 7 have not been detected as separate sections, as the skeletonization algorithm automatically removes branches below the set threshold. This means that these recesses will be processed through a single-line processing part of the algorithm.
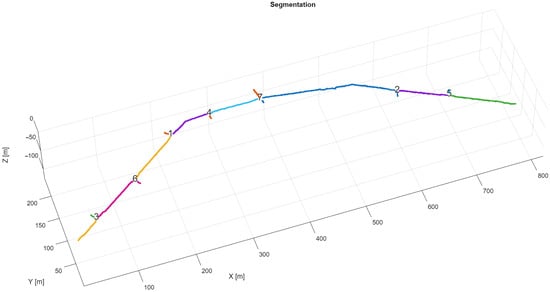
Figure 10.
Result of the trajectory segmentation. Identified crossroads (numbers) and raw trajectories of tunnels between them.
The final results of the processing (point clouds with uniform point distribution) can be seen in Figure 11. All mining equipment and elements, such as pipes and cables, were removed during the boundary detection part of the algorithm. This leaves only the geometrical shape of the excavation, which can then be properly utilized in airflow simulations.
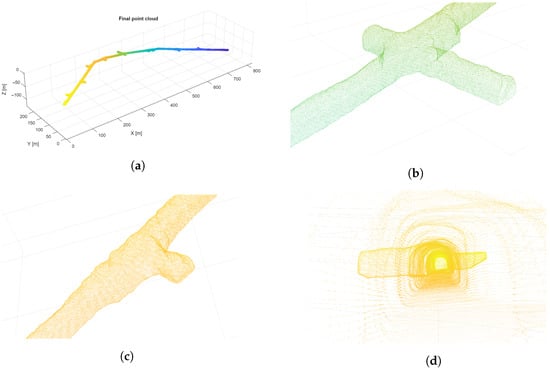
Figure 11.
Examples of the full processed excavation (a) and zoomed areas (b–d).
In Figure 12 a case of separate sections with missing profiles (crossing number 4 from Figure 10). This is a result of using separate trajectories that at the connecting areas can have a different angle of their perpendicular planes. The missing points and generated overlap can be easily fixed through a process of generating an auxiliary mesh constrained to preserve the original points. The result can be seen in Figure 13. The geometry in the filled areas can be flattened, which is an acceptable concession for the fast and automatic processing of large point clouds.
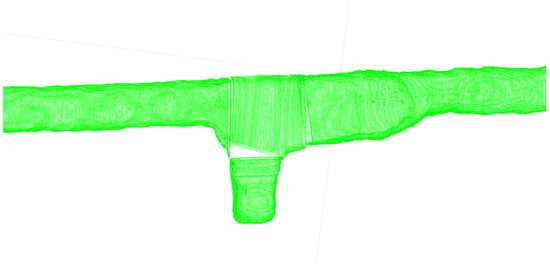
Figure 12.
Example of the missing data generated on the connecting areas before merging.
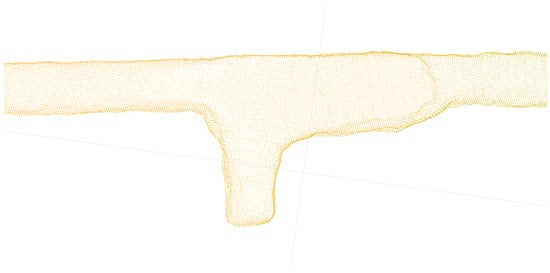
Figure 13.
Example result of the successful merging in the connected areas.
The point to point comparison (estimated distance) between the original point cloud and the processed point cloud can be seen in Figure 14 and Figure 15. This is calculated as a minimum distance of each point generated through proposed algorithm to the closest point of the original trajectory. The distance median is below 5 cm with a mean of slightly above 7 cm, which are perfectly acceptable for the intended purposes of airflow simulation. Results will vary depending on the quality of the original point cloud, as one of its tasks is to fill holes in the data (areas not scanned properly), which will then be detected as a large distance from the original point cloud. Additionally, with a point cloud of better quality and points density, a processing parameters can be set to be more strict, which would turn in a better final results.
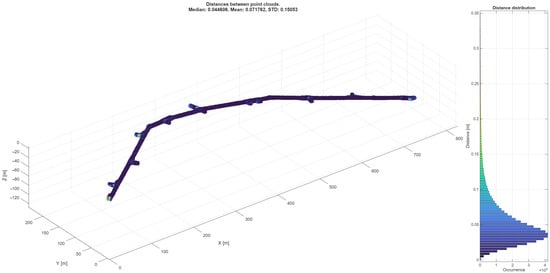
Figure 14.
Point to point distance comparison between original point cloud and processed point cloud.
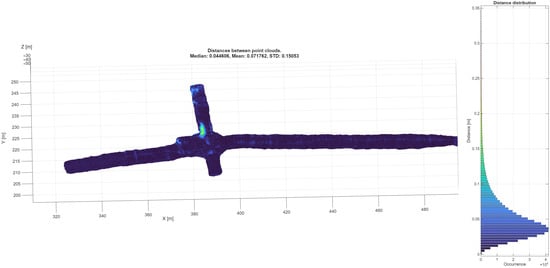
Figure 15.
Zoomed view of one of the crossings in point to point comparison.
5.2. Processing of Exemplary Synthetic Point Cloud
To show that the algorithm can handle larger excavation sections, a synthetic point cloud has been generated as described in the data acquisition part of the article. It consist of multiple X-type and T-type crossings together with an area with close crossing proximity. The effect of its skeletonization can be seen in Figure 16.
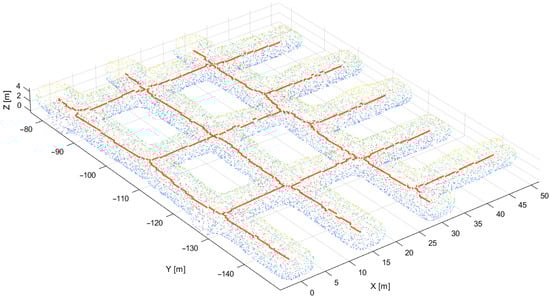
Figure 16.
Raw trajectory (orange points) obtained from skeletonization.
The effect of segmentation can be seen in Figure 17. As can be seen, even in areas with high crossing density (crossings number 1, 2, 8) the segmentation worked properly. The quality of this segmentation and later processing is directly tied to the parameter of expected crossing size. If the parameter is too small, the crossing would not be processed correctly as the cut point cloud would only consist of excavation floor and ceiling. If the parameter is too high, the cut point clouds would overlap “stealing” points depending on which crossing has been segmented at first.
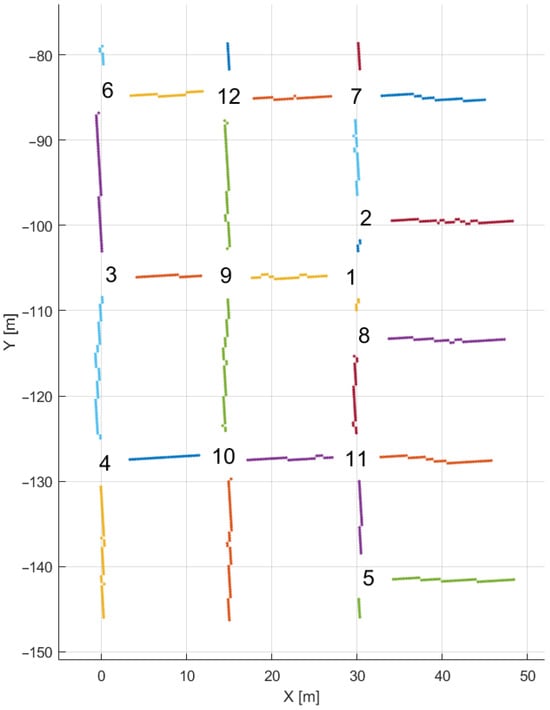
Figure 17.
Result of the trajectory segmentation from top view—identified crossroads and raw trajectories of tunnels between them.
Final point cloud with unified point spacing can be seen in Figure 18. A final mesh applicable for the airflow simulations can be seen in Figure 19.
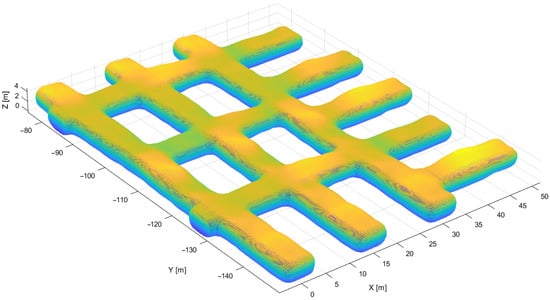
Figure 18.
Uniform point cloud obtained from the algorithm.
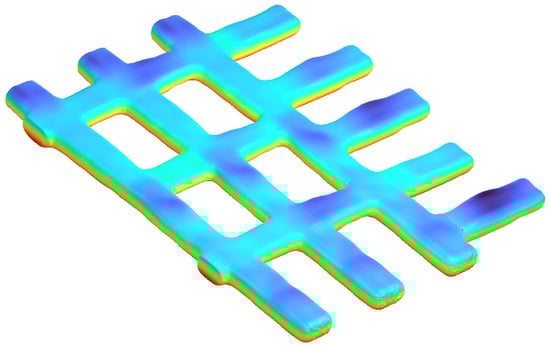
Figure 19.
Final mesh obtained from the algorithm.
6. Summary and Conclusions
Accurate Computational Fluid Dynamics (CFD) simulations are essential for underground mine ventilation and safety, but require robust geometric models; raw laser scan point clouds are inherently irregular, noisy, and unsuitable for direct meshing. This study introduced a methodology for the automatic segmentation and regularization of large-scale underground point cloud data. The core strategy involves skeleton extraction (medial-axis transform via voxelization) and topology-based trajectory analysis to separate the excavation network into distinct single-line segments and crossings.
The segmented sections are subsequently processed through radial analysis and surface reconstruction to produce uniform and watertight models. This regularization procedure incorporates orthogonal sampling, boundary calculation (effectively removing internal non-geometrical elements like pipes and cables), and interpolation steps (e.g., angular and longitudinal upsampling) to ensure consistent point distribution and fill data holes. Crossroads require specialized processing (with the methodology utilized for single-line excavation processing), including trajectory interpolation and “opening” entry points closed during radial analysis.
The methodology was successfully validated using both synthetic datasets and real-world laser scans obtained in underground mine conditions. The results demonstrate that the proposed segmentation method effectively isolates single-line drifts and crossings, ensuring continuous and smooth geometry while preserving the overall excavation topology. Testing on real data acquired using the PoLiMap system from a copper mining facility confirmed its usability, yielding a point-to-point comparison between the original and processed point clouds with a distance median of below 4.8 cm and a mean of 7.2 cm. This level of accuracy is deemed perfectly acceptable for the intended purpose of airflow simulation. Furthermore, the method successfully processed a large synthetic point cloud that features multiple complex X-type and T-type crossings in close proximity, confirming its ability to handle complex network topologies.
In terms of required algorithm accuracy, very fine detail changes in geometry have very small impact on the overall airflow. The general requirement could be taken from the industry point of view, as the result could be used to obtain economical gains—as a mean to find the spots in geometry, where fixing the surface geometry will optimize the airflow enough to be considered a good investment. Such calculation would consider materials/work cost to potential ventilation cost reduction ratio, although this topic can be considered as future work. The fine line between the uncertainties of processing (and the measurement error of the scanning device) and at what point it becomes unnecessary to provide better results—this is hard to strictly define. Better density of measured points (such as Riegl Vz-400i that was used in the previous article) allow the proposed algorithm to go below 100 µm of median accuracy and below 1cm of standard deviation of accuracy, which in the case of airflow simulation might be unnecessary and it would be better to apply faster scanning method rather than obtaining such precision.
The main advantages of the presented methodology remained the same as in previous work: robustness and full control over the processing parameters that can be adapted to the varying quality and shape of the excavation point clouds. It allows for a complex processing of the excavation point clouds, which includes removal of objects scanned inside the excavation (pipes, humans, mining machines) that are not naturally part of the ventilation system or have insignificant impact while heavily increasing computational complexity for the simulations; and filling even large holes in data while preserving the original geometric characteristic of the surfaces. Segmentation allows for separate processing of the excavation system based on very logical criteria, which in turn allows for parallel processing. Although the parallelization significantly speeds up processing of a large point clouds, the RAM memory required for the processing remained unchanged, as the initial step of the processing—generation of trajectory—still operates on the full point cloud. Additionally, as the proposed processing is highly parametrized through simple parameters (excavation diameter, size of crossings, required density, parameters that influence speed of the algorithm, such as the voxel size for skeletonization), the algorithm can be easily adapted to many different excavation systems, that can vary in size, shape and quality required from the end result.
The main drawback of the proposed methodology lies in the merging of the processed sections, which might result in missing cross-section profiles in the connecting areas, which is related to the generation of a perpendicular plane step of processing. These cases require additional mesh operation that can flatten these surfaces. This can likely be fixed by additional processing steps and is considered a future work.
In conclusion, the developed framework provides a robust and automated solution that bridges the gap between raw point cloud acquisition and numerical modeling, facilitating the necessary geometric representation for detailed CFD-based ventilation and safety analysis of complex underground excavation systems.
Author Contributions
Conceptualisation, P.D. and J.W.; methodology, P.D. and J.W.; software, P.D.; validation, A.W. and S.G.; formal analysis, J.W.; investigation, S.G., P.D. and A.W.; resources, S.G.; data curation, P.D.; writing—original draft preparation, P.D., J.W. and A.W.; writing—review and editing, S.G.; visualisation, P.D.; supervision, A.W.; project administration, A.W.; funding acquisition, A.W. All authors have read and agreed to the published version of the manuscript.
Funding
This activity has received funding from the European Institute of Inno- vation and Technology (EIT), a body of the European Union, under the Horizon 2020, the EU Framework Programme for Research and Innovation. This work is supported by EIT RawMaterials GmbH under Framework Part- nership Agreement No. 21119 (V0T3D: Ventilation Optimizing Technology based on 3D-scanning). The project is co-financed by the Polish Ministry of Education and Science within the framework of the program titled Interna- tional Co-financed Projects.
Data Availability Statement
The measurement data presented in this study are not publicly available due to restrictions of privacy.
Conflicts of Interest
The authors declare no conflicts of interest.
References
- Yi, H.; Kim, M.; Lee, D.; Park, J. Applications of computational fluid dynamics for mine ventilation in mineral development. Energies 2022, 15, 8405. [Google Scholar] [CrossRef]
- Janus, J.; Ostrogórski, P. Underground mine tunnel modelling using laser scan data in relation to manual geometry measurements. Energies 2022, 15, 2537. [Google Scholar] [CrossRef]
- Szrek, A.; Romańczukiewicz, K.; Kujawa, P.; Trybała, P. Comparison of TLS and SLAM technologies for 3D reconstruction of objects with different geometries. IOP Conf. Ser. Earth Environ. Sci. 2024, 1295, 012012. [Google Scholar] [CrossRef]
- Dąbek, P.; Wodecki, J.; Kujawa, P.; Wroblewski, A.; Macek, A.; Zimroz, R. 3D point cloud regularization method for uniform mesh generation of mining excavations. ISPRS J. Photogramm. Remote Sens. 2024, 218, 324–343. [Google Scholar] [CrossRef]
- Kukutsch, R.; Kajzar, V.; Konicek, P.; Waclawik, P.; Ptacek, J. Possibility of convergence measurement of gates in coal mining using terrestrial 3D laser scanner. J. Sustain. Min. 2021, 14. [Google Scholar] [CrossRef]
- Baek, J.; Park, J.; Cho, S.; Lee, C. 3D Global Localization in the Underground Mine Environment Using Mobile LiDAR Mapping and Point Cloud Registration. Sensors 2022, 22, 2873. [Google Scholar] [CrossRef]
- Trybała, P.; Kasza, D.; Wajs, J.; Remondino, F. COMPARISON OF LOW-COST HANDHELD LIDAR-BASED SLAM SYSTEMS FOR MAPPING UNDERGROUND TUNNELS. Int. Arch. Photogramm. Remote Sens. Spat. Inf. Sci. 2023, XLVIII-1/W1-2023, 517–524. [Google Scholar] [CrossRef]
- Wróblewski, A.; Wodecki, J.; Trybała, P.; Zimroz, R. A method for large underground structures geometry evaluation based on multivariate parameterization and multidimensional analysis of point cloud data. Energies 2022, 15, 6302. [Google Scholar] [CrossRef]
- Zlot, R.; Bosse, M. Efficient Large-Scale 3D Mobile Mapping and Surface Reconstruction of an Underground Mine. In Springer Tracts in Advanced Robotics; Springer: Berlin/Heidelberg, Germany, 2013; pp. 479–493. [Google Scholar] [CrossRef]
- Szrek, J.; Jakubiak, J.; Zimroz, R. A Mobile Robot-Based System for Automatic Inspection of Belt Conveyors in Mining Industry. Energies 2022, 15, 327. [Google Scholar] [CrossRef]
- Fahle, L.; Holley, E.A.; Walton, G.; Petruska, A.J.; Brune, J.F. Analysis of SLAM-Based Lidar Data Quality Metrics for Geotechnical Underground Monitoring. Mining, Metall. Explor. 2022, 39, 1939–1960. [Google Scholar] [CrossRef]
- Grilli, E.; Menna, F.; Remondino, F. A review of point clouds segmentation and classification algorithms. Int. Arch. Photogramm. Remote Sens. Spat. Inf. Sci. 2017, 42, 339–344. [Google Scholar] [CrossRef]
- Wani, M.A.; Arabnia, H.R. Parallel edge-region-based segmentation algorithm targeted at reconfigurable multiring network. J. Supercomput. 2003, 25, 43–62. [Google Scholar] [CrossRef]
- Vosselman, G.; Gorte, B.G.; Sithole, G.; Rabbani, T. Recognising structure in laser scanner point clouds. Int. Arch. Photogramm. Remote Sens. Spat. Inf. Sci. 2004, 46, 33–38. [Google Scholar]
- Khalifa, I.; Moussa, M.; Kamel, M. Range image segmentation using local approximation of scan lines with application to CAD model acquisition. Mach. Vis. Appl. 2003, 13, 263–274. [Google Scholar] [CrossRef]
- Rabbani, T.; Van Den Heuvel, F.; Vosselmann, G. Segmentation of point clouds using smoothness constraint. Int. Arch. Photogramm. Remote Sens. Spat. Inf. Sci. 2006, 36, 248–253. [Google Scholar]
- Zhang, J.; Zhao, X.; Chen, Z.; Lu, Z. A review of deep learning-based semantic segmentation for point cloud. IEEE Access 2019, 7, 179118–179133. [Google Scholar] [CrossRef]
- Bello, S.A.; Yu, S.; Wang, C.; Adam, J.M.; Li, J. Deep learning on 3D point clouds. Remote Sens. 2020, 12, 1729. [Google Scholar] [CrossRef]
- Zhou, Y.; Tuzel, O. Voxelnet: End-to-end learning for point cloud based 3d object detection. In Proceedings of the IEEE Conference on Computer Vision and Pattern Recognition, Salt Lake City, UT, USA, 18–23 June 2018; pp. 4490–4499. [Google Scholar]
- Li, J.; Chen, B.M.; Lee, G.H. So-net: Self-organizing network for point cloud analysis. In Proceedings of the IEEE Conference on Computer Vision and Pattern Recognition, Salt Lake City, UT, USA, 18–23 June 2018; pp. 9397–9406. [Google Scholar]
- Hua, B.S.; Tran, M.K.; Yeung, S.K. Pointwise convolutional neural networks. In Proceedings of the IEEE Conference on Computer Vision and Pattern Recognition, Salt Lake City, UT, USA, 18–23 June 2018; pp. 984–993. [Google Scholar]
- Perfetti, L.; Elalailyi, A.; Fassi, F. Portable Multi-Camera System: From Fast Tunnel Mapping to Semi-Automatic Space Decomposition and Cross-Section Extraction. Int. Arch. Photogramm. Remote Sens. Spat. Inf. Sci. 2022, 43, 259–266. [Google Scholar] [CrossRef]
- Abdollahzadeh, A.; Sierra, A.; Tohka, J. Cylindrical shape decomposition for 3D segmentation of tubular objects. IEEE Access 2021, 9, 23979–23995. [Google Scholar] [CrossRef]
- Antiga, L. Patient-Specific Modeling of Geometry and Blood Flow in Large Arteries; Politecnico di Milano: Milan, Italy, 2002. [Google Scholar]
- Izzo, R.; Steinman, D.; Manini, S.; Antiga, L. The vascular modeling toolkit: A python library for the analysis of tubular structures in medical images. J. Open Source Softw. 2018, 3, 745. [Google Scholar] [CrossRef]
- Trybała, P.; Kujawa, P.; Romańczukiewicz, K.; Szrek, A.; Remondino, F. DESIGNING AND EVALUATING A PORTABLE LIDAR-BASED SLAM SYSTEM. Int Arch. Photogramm. Remote Sens. Spat. Inf. Sci. 2023, XLVIII-1/W3-2023, 191–198. [Google Scholar] [CrossRef]
- Livox Avia Quick Start Guide 2021. Available online: https://terra-1-g.djicdn.com/65c028cd298f4669a7f0e40e50ba1131/Download/Avia/Livox%20Avia_Quick%20Start%20Guide_V1.4.pdf (accessed on 26 December 2025).
- Kim, G.; Yun, S.; Kim, J.; Kim, A. SC-LiDAR-SLAM: A Front-end Agnostic Versatile LiDAR SLAM System. In Proceedings of the 2022 International Conference on Electronics, Information, and Communication (ICEIC), Jeju, Republic of Korea, 6–9 February 2022; pp. 1–6. [Google Scholar] [CrossRef]
- Edelsbrunner, H.; Mücke, E.P. Three-dimensional alpha shapes. ACM Trans. Graph. (TOG) 1994, 13, 43–72. [Google Scholar] [CrossRef]
- Lee, T.C.; Kashyap, R.L.; Chu, C.N. Building skeleton models via 3-D medial surface axis thinning algorithms. CVGIP Graph. Model. Image Process. 1994, 56, 462–478. [Google Scholar] [CrossRef]
- Akima, H. A new method of interpolation and smooth curve fitting based on local procedures. J. ACM (JACM) 1970, 17, 589–602. [Google Scholar] [CrossRef]
Disclaimer/Publisher’s Note: The statements, opinions and data contained in all publications are solely those of the individual author(s) and contributor(s) and not of MDPI and/or the editor(s). MDPI and/or the editor(s) disclaim responsibility for any injury to people or property resulting from any ideas, methods, instructions or products referred to in the content. |
© 2025 by the authors. Licensee MDPI, Basel, Switzerland. This article is an open access article distributed under the terms and conditions of the Creative Commons Attribution (CC BY) license.