Abstract
This study aims to fill the existing gap in laser detection research, particularly regarding how the waveform of outgoing laser pulses affects detection performance. Based on the mechanism of light cone beam expansion, this study emits three different laser pulse signals to detect short-range targets. A theoretical model for short-range ranging of these lasers is established, and the effects of emission power, divergence angle, and equivalent root mean square noise voltage on circumferential detection accuracy are simulated and experimentally measured. As emission power decreases, both echo amplitude and detection accuracy decline for all three pulsed lasers. Additionally, except for the inverted parabolic function, both echo amplitude and detection accuracy decrease with reduced divergence angle. An increase in equivalent root mean square noise voltage broadens the half-width of the probability density distribution for pulsed laser detection. The mean central position deviation between the ideal and measured detection probability density distributions of the heavy-tailed function laser pulses shows the best performance and the highest fidelity, which are +0.01 m, +0.05 m, and +0.02 m, respectively, which is of great significance for the development of laser detection technology.
1. Introduction
At the forefront of scientific and technological development, laser technology, with its unique attributes, occupies a crucial position in many scientific and engineering fields. Particularly in the field of proximity target detection technology, the high accuracy and strong anti-interference capability of lasers have made them a hotspot for research and application [1]. In recent years, many studies have confirmed the potential of laser technology to enhance detection efficiency in various fields. For example, Yang et al. used laser scanning technology to perform optical imaging. They screened and counted circulating tumor cells in darkfield images through clustering algorithms, which has great application prospects for early diagnosis and prognosis prediction of cancer patients [2]. Bahmeh and Zangeneh discussed the performance of pulsed LiDAR and its influencing factors in a dense cloud-cluttered environment in depth through multiple scattering Monte Carlo simulation [3]. In addition, in the military field, laser fuze, with its excellent anti-jamming capability and precise ranging performance, has become a key component in missile systems [4], especially in near-bomb fuze, where pulsed laser proximity detection technology is often used to give the weapon proximity sensing and detection capabilities. This technology is now widely used in missiles, such as the United States-Swiss ADATS anti-tank missile, the Israeli Python 5 air-to-air missile and the United States AIM-9X missile [5]. However, in the face of the complexity and variability of the modern war environment, laser detection technology’s performance optimization and adaptability enhancement have become an urgent problem.
Many factors influence the performance and adaptability of laser detection technology. These factors not only determine the effectiveness and reliability of laser detection systems but also limit their range of application in different environments and conditions. To reduce the effect of ambient light changes on the detection performance, Li and Zhang designed a laser detection screen with a wide-angle receiving optical path [6], which significantly increased the field of view of the laser optoelectronic detection target and achieved all-weather detection; in addition, Steinvall et al. simulated the effect of the laser pulse shape, detector noise, target shape and reflectance, as well as the turbulence on the waveform processing accuracy and distance resolution limitations [7,8]. To study the influence mechanism of the echo characteristics of the outgoing laser pulse on the ranging, Xie et al. deeply analyzed the echo characteristics of complex three-dimensional flying targets [9]. You and Gan investigated the mechanism by which some common factors influence the target echo characteristics based on the laser dynamic scanning mechanism [10]. Jiang established a digital simulation model of LiDAR time-of-flight ranging based on the principle of time-of-flight ranging and established the dependence of the probability density distribution of the ranging data on the echo waveform of the pulse and the noise distribution [11]. Xie et al. used the principle of laser fuze detection to distinguish sea surface targets and proposed a dual-color fuze laser scheme to resist wave interference and target differentiation [12]. In the field of laser detection technology, current research is mainly about the influence of ambient light, system parameters, target parameters, pulse-echo characteristics, and anti-jamming on the performance of laser detection. Very few studies have examined the influence of the outgoing laser pulse waveform on the performance of laser detection technology. The present study aims to fill the gap in this regard.
The quality of the output laser pulse waveform is very important to the study of the system detection performance. This study develops and establishes theoretical models for the echo time distribution profile and the short-range circumferential detection probability density distribution of various output laser pulse waveforms. These models are based on the short-range circumferential detection technology of pulsed lasers, utilizing the light cone expansion mechanism [13]. This research provides a quantitative analysis tool for evaluating the performance of the laser detection system presented in this study. This research also explores how some factors affect the characteristics of pulse laser echoes. In addition, it evaluates the ranging results through both theoretical simulations and experimental tests. The findings provide essential guidance for developing short-range circumferential detection systems and play a crucial role in enhancing their performance.
2. Short-Range Static Circumferential Detection of Pulsed Laser Based on the Mechanism of Cone Beam Expansion
This study is based on a single-pulse laser proximity static circumferential detection system using a light cone beam-expanding mechanism. The main components are the beam-expanding light cone and the laser proximity detection unit, the principle of which is illustrated in Figure 1. At the beginning of the detection process, a drive circuit triggers the laser transmitter and emits a laser pulse, which marks the starting moment of the distance measurement. The pulsed laser emitted passes through the hollow total reflection mirror after lens shaping and forms a static circumferential detection field through the beam expansion of the light cone. The laser signal that detects the target is reflected. Moreover, the echo signal will be collected by the inverted reflection light cone. Next, it is reflected by the hollow total reflection mirror and finally focused by the receiving lens to the highly sensitive photosensitive detector, represented by APD (Avalanche Photo Diode). The received echo signal realizes the static circumferential detection of the target through processing and calculation [13].
Figure 1.
Schematic diagram of extended proximity static circumferential detection of echo laser signals based on the light cone beam mechanism.
The static circumferential detection technique relies on precisely measuring a pulsed laser’s round-trip time. The high accuracy of this measurement process depends not only on the accuracy of the timing circuitry but also on the accurate identification of the laser echo signal. Therefore, the echo characteristics of the pulsed laser and the method of identifying the echo signal are critical to the high-precision timing process, and they directly determine the ranging performance of this laser proximity detection system.
3. Analysis of Echo Characteristics of Pulsed Laser Short-Range Circumferential Detection
3.1. Pulsed Laser Emission Waveform Mathematical Modeling Theoretical Models
For a laser detection system, the outgoing laser signal is a one-dimensional time signal whose intensity varies with time. The detection system’s ranging accuracy and statistical properties are directly dependent on the temporal characteristics of the pulsed laser echo signal [14]. Therefore, the time distribution characteristics of the pulsed laser signal are the basis for studying the performance of the laser detection system. There are several ways to describe the time distribution function of pulsed lasers. The Gaussian function can explain the time distribution characteristics of the pulse-echo well and the trailing phenomenon of the laser pulse emission. However, it cannot reflect the characteristics of the laser pulse’s sharp rising edge and slow falling edge [15]; Cain S modeled the temporal waveform of a laser pulse as an inverted parabolic function. This numerical model accurately reflects the laser pulse characteristics at high signal-to-noise ratios but does not reflect the laser pulse’s trailing characteristics [16]. In addition, the heavy-tailed function is also commonly used to describe the time distribution characteristics of pulsed laser light [8,17], which can accurately describe the characteristics of the laser pulse with a steep rise and a relatively slow fall. However, the fluctuation amplitude of the heavy-tailed function is significant. The tail decays slowly, often challenging to obtain closed mathematical expressions or precise analytical properties. The heavy-tailed function can only be used in some specific cases. In this study, the above three-time distribution functions are mainly investigated. The expressions and corresponding waveform curves are shown in Equations (1)–(3) and Figure 2.
where A is the peak power of the laser pulse and τ is the pulse half-width (Gaussian pulse is 1/e pulse width).

Figure 2.
Characteristic plots of the time distribution of three laser pulse waveforms.
As the three functions have different characteristics in time distribution, to facilitate the analysis of the experimental results, the three outgoing pulse signals need to peak at the same time (t = 20 ns) so that the pulse-echo signal accepted by the photosensitive sensor (APD) can also peak at the same time, which can be more intuitive to see the impact of various factors on the pulsed laser echo signal and the performance of the detection system.
By analyzing the waveforms of the three laser pulse echo signals given in Figure 2, it can be seen that from the starting point of the rising edge of the laser pulse to the vicinity of the threshold point, the waveforms of the parabolic function and the heavy-tailed function are very close, while the Gaussian function obviously deviates from the other two waveforms, especially the rising edge below the threshold.
3.2. Impulse Response and Echo Waveform Equation of Pulsed Laser Short-Range Detection
The echo waveform is determined by the emission pulse and the pulse impulse response [8]. After the time distribution characteristics of the laser pulse are clarified, the pulse impulse response function [18] is expressed as:
where P is the total laser power, and the laser beam divergence angle will directly affect the pulse laser echo signal. represents the function of the laser beam emission angle, which is expressed as:
where lambda is the laser wavelength; gamma is the laser exit angle; is the distance between the target and the center of the outgoing laser beam. is the bidirectional reflectance distribution function of the unit bin of the detected target, which is expressed as:
where the first term on the right side of the medium sign is the specular reflection part, the second term is the diffuse reflection part, and correspond to the reflection amplitude of the two parts, respectively, β is the incident angle, ξ is the surface slope, and m is the diffuse reflection coefficient.
By setting different pulse laser divergence angles and laser exit angles, the response characteristics of pulse laser shock under different conditions are studied. After establishing the function expression of the transmitted pulse signal and the function expression of the pulse impulse response, the pulse laser echo can be expressed as:
The time distribution functions of the echo signals of the three outgoing laser pulse signals are:
- (1)
- Gaussian function:
- (2)
- Parabolic function:
- (3)
- Heavy-tailed function:
This study employs the laser circumferential detection technique. Light reflection and refraction occur at media interfaces with varying refractive indices, leading to energy loss. The transmittance enhancement process can boost the transmittance rate. However, it cannot achieve complete transmission. The detection system in this study relies on multiple refractions and reflections, which are inevitably accompanied by energy loss. When the inverted cone reflects the outgoing laser to detect the target, the reflected light also loses energy. In order to quantify the effect of this loss on the ranging accuracy, this study denotes the residual coefficient of energy before and after the laser passes through a certain device by , and the residual coefficient of energy of the laser from the outgoing to the received by k. The relationship is as follows:
where and represent the energy residual coefficients before and after the pulsed laser light is refracted by the transmitting and receiving lenses in the detection system. and represent the energy residual coefficients before and after the pulsed laser light is reflected by the light cone mirrors and the hollow mirror. represents the energy residual coefficients before and after the pulsed laser light is reflected when the target is detected.
After considering the influence of reflection and refraction on laser detection, this study is suitable for short-range laser detection, so the influence of spots and atmospheric turbulence can be ignored in the process of laser active detection. In the process of laser active detection, the influence of speckle and atmospheric turbulence can be ignored. The laser signal is reflected and refracted by the detection system and the detection target, and then received by a detector of the detection receiving device. The target echo power equation can be obtained as follows [7]:
where k represents the transmittance of the laser signal. It measures the signal before and after it reflects and refracts off the optical system and the detection target; r is the distance between the detection system and the target; D is the aperture of the fuze optical receiving system; η is the atmospheric transmission coefficient, , where is the atmospheric attenuation coefficient.
The pulse-echo power signal is detected by the photodetector and amplified by the receiving detection circuit. The pulse-echo signal is expressed as:
where is the responsivity of the detector, and is the magnification of the receiving detection signal circuit.
4. Probability Density Distribution Analysis of Pulsed Laser Short-Range Circumferential Ranging
4.1. Probability Distribution Model of Pulse Laser Ranging
The laser ranging process is an active photodetection process. At the same time, some studies clearly indicate that although the temporal profiles of the emitted laser pulses (particularly the heavy-tailed function) are inherently non-Gaussian, the statistical distribution of the ranging error is governed by the stochastic nature of the detection process [19]. The total receiver noise is a superposition of independent random processes, such as background radiation, shot noise and detector shot noise. According to the Central Limit Theorem, the aggregate noise probability density function approximates a Gaussian distribution [20].
In the threshold detection scheme, the timing jitter is linearly related to the slope of the signal at the threshold, and thus is affected by noise voltage. Consequently, Gaussian voltage noise leads to ranging errors that follow a Gaussian distribution. This modeling approach is consistent with the current mainstream theoretical analyses of LiDAR accuracy, such as the work of Zhang et al. [21], where they successfully used this Gaussian assumption to derive the accuracy limits of ToF LiDAR systems. This subsection derives a statistical theoretical model for pulsed laser ranging based on the above theory.
The receiver noise of the detection system in this study consists of background noise and circuit noise. The probability distribution of the noise of this system can be expressed by a Gaussian distribution [22]:
Among them, represents the equivalent root mean square noise voltage of the circuit, and N is the noise voltage of the signal receiving circuit of the detection system. The probability distribution of the detection signal can be expressed by the superposition of the noise voltage signal of the detection system and the ideal voltage signal L(t) corresponding to the echo signal:
In this paper, the threshold detection method is used as the laser echo signal processing method, so the target detection probability before time t can be expressed as:
where is the threshold voltage of the echo signal. Equation (16) can be derived as:
By replacing time t with the distance r between the detection system and the target by, the probability density distribution of the distance detection of the system can be obtained [22]:
Taking the Gaussian function as an example to describe the pulse laser waveform, the detection probability density distribution function is [4]:
where and .
Equation (16) is derivable and shows the ranging probability density function’s connection to three factors: peak laser emission power, beam divergence angle, and noise voltage. This study investigates how these factors impact the detection system’s performance. Table 1 details the values of specific parameters from Equations (8)–(10) and (19).

Table 1.
Theoretical simulation and experimental parameters.
4.2. The Influence of Pulse Laser Emission Power on Ranging Probability Density Distribution
The emission power of the pulsed laser directly affects the slope of the echo threshold resolution point. This section explores the influence of emission power on the ranging probability distribution for three types of laser pulse waveforms. It does so by altering only the emission power of the laser pulse signals. The threshold detection voltage is set to 600 mV, the laser emission pulse width is 7.8 ns, the equivalent rms noise voltage is set to 70 mV, the outgoing angle is 30°, and the emitted power is varied between 10 W and 30 W in 5 W steps.
Figure 3 shows the effect of transmit power on the echo time distribution of the three pulsed signal waveforms; Figure 4 shows the effect of transmit power on the detection probability density distribution of the three pulsed signal waveforms. With the increase in transmit power, the slope and amplitude of the threshold discrimination point of the echo signals increase, the symmetry of the circumferential probability distribution of the detection remains unchanged, the probability distribution half-width decreases, and the peak points are all gradually away from the actual value of the distance. The outgoing laser pulse waveform described by the heavy-tailed function has the highest detection probability.

Figure 3.
The Effect of Emission Power on the Waveform of Pulsed Laser Echo Signals.

Figure 4.
Circumferential detection probability density distribution of different pulse laser signal transmission power.
4.3. The Influence of Pulse Laser Divergence Angle on Ranging Probability Density Distribution
The pulse laser divergence angle affects the pulse laser impulse response and, thus, the pulse laser echo signal. Therefore, under the condition that only the pulsed laser outgoing divergence angle is changed, this section investigates the effect of the divergence angle on the ranging probability distribution of the three emitted laser pulse waveforms. The pulsed laser emission power is set to 20 W. The laser emission pulse width is constant at 7.8 ns, the equivalent rms noise voltage is set to 70 mV, the outgoing angle is 30°, and the pulsed laser dispersion angle is increased from 10 mrad to 50 mrad in steps of 10 rad.
Figure 5 demonstrates the effect of the laser pulse divergence angle on the echo time profile of the three pulsed signal waveforms. As shown in Figure 5, the pulse width of the ranging laser echo signal changes with the divergence angle of the beam. This is because the laser reflected from the center and the edges of the spot travel different paths back to the detector, causing photons from different parts of the same emitted pulse to arrive at the detector at different times, thereby temporally broadening the received echo pulse; Figure 6 shows the effect of the laser pulse divergence angle on the circumferential detection probability density distributions of the three pulsed signal waveforms. With the laser pulse’s divergence angle increases, the slopes of its threshold discrimination points become smaller, the amplitude of the echo signals of the Gaussian and heavy-tailed function pulses decreases, and the amplitude of the echo signals of the inverted parabolic function pulses remains basically unchanged. Their probability density distribution is gradually shifted to the left, and the peak half-pulse width is increased, i.e., the ranging accuracy decreases with the increase in the dispersion angle. In comparison, the outgoing laser pulse signal of the inverted parabolic function has the highest probability of detection when the pulse laser emission angles are the same.
Figure 5.
The Effect of Pulse Laser Divergence Angle on the Waveform of Pulse Laser Echo Signals.
Figure 6.
Circumferential detection probability density distribution of different pulse laser signal divergence angles.
4.4. Influence of Equivalent Root Mean Square Noise Voltage on Ranging Probability Density Distribution
According to the analysis of the derivation of Equation (19), it can be seen that the probability density distribution of the ranging data of the pulsed laser detection system in this paper is closely related to the equivalent rms noise voltage. Therefore, under changing only the equivalent rms noise voltage, this section investigates the effect of the equivalent rms noise voltage () on the probability distribution of the distance measurement of the three emitted laser pulse waveforms. The pulsed laser emission power is set to 20 W, the laser emission pulse width is constant at 7.8 ns, the pulsed laser divergence angle is 30 mrad, the outgoing angle is 30°, and the equivalent rms noise voltage is increased from 50 mV to 90 mV in 10 mV steps.
Figure 7 shows the effect of the equivalent rms noise voltage on the echo time contours of the three pulsed signal waveforms. Figure 8 shows the effect of the equivalent rms noise voltage on the circumferential detection probability density distributions of the three pulsed signal waveforms. With the increase in the equivalent rms noise voltage, the amplitude of the pulsed laser echo signals decreases. The peak half-widths of the probability density distributions of the probability of ranging are all increased. The curves do not shift from side to side. Therefore, the detection probability of the laser pulse decreases with the increase in the equivalent rms noise voltage, and the outgoing laser pulse signal described by the heavy-tailed function has the highest detection probability
Figure 7.
Circumferential detection probability density distribution of pulsed laser with different equivalent root mean square noise voltages.

Figure 8.
The diagram of Single pulse laser static short-range circumferential detection experimental platform.
5. Experiment and Analysis
Considering the limitations of theoretical analysis and simulation analysis, this study established a laser static circumferential detection experimental platform based on the light cone beam expansion mechanism (Figure 8), based on the working principle diagram of the laser circumferential detection system (Figure 1). This section further investigates the probability distribution and fidelity of detection of each outgoing laser pulse waveform in a simulated experimental setting. It is important to note that the probability density distributions presented in Section 4.2, Section 4.3 and Section 4.4 are derived from theoretical models, representing ideal statistical distributions (equivalent to an infinite sample size). In the subsequent experimental verification (Section 5), the sample size is constrained to 100 measurements per condition. Although the experimental curves presented later exhibit smooth profiles due to data fitting and smoothing techniques, they are fundamentally derived from this finite dataset (N = 100). Therefore, the statistical robustness of these comparisons should be evaluated in the context of this limited sample size. What is more, in this research, ‘fidelity’ refers to the proximity of the simulation results to the measured data. A high fidelity physically indicates that the theoretical model accurately describes the asymmetric temporal characteristics of the actual laser pulse, rather than assuming an ideal symmetric shape.
The experimental platform consists of a static circumferential scanning system and a pulsed laser transceiver system. Figure 9 shows the circumferential detection and scanning system designed based on the optical path of Figure 1. The laser transmitter model FU905AD100-GD1670 (Hangzhou Sumlo Industrial Co., Ltd., Hangzhou, China), and the oscilloscope is manufactured by UNI-T (Chengdu, China), model UTD2102CEX. In order to achieve efficient reception of conventional ammunition laser fuze echo energy, both the transmitting and receiving lenses of the laser detection system in this study apply an aspherical focusing lens designed by ZEMAX optical design software (Version: 2024 R2.02). The physical parameters of this experimental platform are consistent with the simulation. Initially, under the action of a laser transmitter circuit, a pulsed laser beam with a wavelength of 905 nm and a pulse width of 7.8 ns is emitted from a laser transmitter with a specific power and outgoing angle. The outgoing laser pulse signal is refracted by the transmitting lens, passes through a hollow mirror, and is reflected on the inverted reflective cone with a 45° cone angle. Then, the signal is irradiated into the target at a distance of 20 m from the detection system and the projection area of 30 cm × 30 cm (hemisphere reflectivity of about 90% of the whiteboard). The laser echo will be reflected in the reflective cone and the hollow mirror, and finally, through the single-stage aspherical focusing shaping of the receiving lens, it is received by the photosensitive detector (APD) and processed. The threshold detection voltage of the echo signal is set to 600 mV; the experiments are carried out at night when the ambient light in the 905 nm wavelength band is unavailable. This experiment was conducted at night when the ambient light intensity in the 905 nm band is basically 0.

Figure 9.
The diagram of pulsed laser short-range circumferential detection device.
Firstly, the influence of three waveforms of a pulsed laser with different transmission power on the performance of the detection system in this paper is measured. The equivalent root mean square noise voltage is set to 70 mV, the laser divergence angle is 30 mrad, the transmission power is gradually reduced from 30 W to 10 W, and the decreasing step is 5 W. The laser emission pulses of the three waveforms are subjected to static detection experiments 100 times under different transmission powers. The probability density distribution of the measured detection results is shown in Figure 10. The probability density distribution of the experimental results and the theoretical derivation show a Gaussian distribution. The decrease in the transmission power will lead to an increase in the half-width of the distribution, a decrease in the peak value and a decrease in the target detection probability. Table 2 summarizes the deviations in the center position and peak value between the ideal and the actual distributions of three types of pulsed lasers at different emission powers (data are rounded to two decimal places).
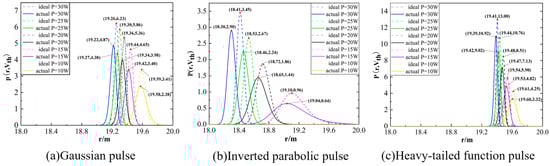
Figure 10.
The simulation and experimental comparison of the probability density distribution of different pulse laser signal transmission power detection.
Table 2.
The center position deviation and peak deviation of the ideal and actual detection probability density distribution of the three waveforms of pulsed laser at different transmit powers.
Under different transmit powers, the mean value of the center position deviation, the mean value of the peak deviation of the theoretical distribution and the measured distribution of the three function pulses are 0.04 m and 1.06, respectively. Among them, the mean values of the theoretical and measured center position deviations of the Gaussian function pulse and the heavy-tailed function pulse are low, which are 0.02 m and 0.01 m, respectively, and the parabolic function pulse is higher, which is 0.08 m. The mean values of the peak deviations between the theoretical and measured distributions of the Gaussian function pulse and the heavy-tailed function pulse are higher, which are 1.32 and 1.43, respectively, and the deviation value of the parabolic function pulse is lower, only 0.43. The analysis shows that the theoretical distribution of the detection probability of the Gaussian function pulse and the heavy-tailed function pulse is less shifted to the right than the measured distribution. The mean value of the theoretical probability density distribution is higher than the measured mean value because of the small experimental sample size and the signal difference between the measured laser echo and the theoretical echo. However, the theoretical and actual proper offsets of these three pulses steadily decrease with decreasing transmission power, with the parabolic function pulse offset being the highest and the heavy-tailed function pulse offset being the least.
Secondly, the influence of three waveforms of a pulsed laser with different laser divergence angles on the performance of the detection system in this paper is verified. The equivalent root mean square noise voltage is set to 70 mV, the pulse laser emission power is controlled at 20 W, the pulse laser divergence angle is gradually reduced from 50 mrad to 10 mrad, and the decreasing step is 10 mrad. The laser emission pulses of the three waveforms are detected 100 times under different pulse laser divergence angles. The probability density distribution of the measured detection results is shown in Figure 11. The probability density distribution of the experimental results and the theoretical derivation shows a Gaussian distribution. The decrease in the pulse laser divergence angle will lead to an increase in the distribution half-width, a decrease in the peak value and a decrease in the target detection probability. The center position deviation and peak deviation between the ideal distribution and the actual distribution of the pulse laser of the three waveforms at different divergence angles are counted, as shown in Table 3 (the data are retained in two decimal places).
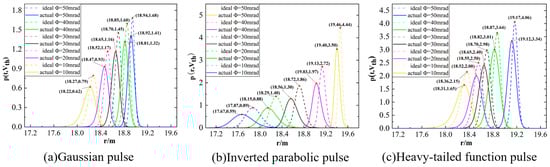
Figure 11.
Simulation and experimental comparison of voltage detection probability density distribution of different equivalent root mean square noise.
Table 3.
The theoretical simulation and actual numerical deviation table of the detection probability density distribution of three waveform pulsed lasers at different laser divergence angles.
Under different divergence angles, the mean value of the center position deviation, the mean value of the peak deviation of the theoretical distribution and the measured distribution of the three function pulses are 0.07 m and 0.48, respectively. Among them, the mean values of the theoretical and measured center position deviations of the Gaussian function pulse and the heavy-tailed function pulse are lower, which are 0.04 m and 0.05 m, respectively, and the parabolic function pulse is higher, which is 0.13 m. The mean values of the peak deviations between the theoretical and measured distributions of the parabolic function pulse and the heavy-tailed function pulse are higher, which are 0.60 and 0.59, respectively, and the deviation value of the Gaussian function pulse is lower, which is 0.25. The analysis shows that the theoretical distribution of the detection probability of the Gaussian function pulse and the heavy-tailed function pulse is less shifted to the right than the measured distribution. The mean value of the theoretical probability density distribution is higher than the measured mean value because of the small experimental sample size and the signal difference between the measured laser echo and the theoretical echo. The correct offset of the theoretical distribution and the measured distribution of these three pulses, of which the parabolic function pulse offset is the greatest and the Gaussian function pulse offset is the least, progressively rises as the divergence angle decreases.
Finally, the influence of three waveforms of a pulsed laser with different equivalent root mean square noise voltage on the performance of the detection system in this paper is verified. The laser divergence angle is 30 mrad, the pulse laser emission power is controlled at 20 W, the equivalent root mean square noise voltage is gradually increased from 50 mV to 90 mV, and the increasing step is 10 mV. The laser emission pulses of three waveforms are detected under different equivalent root mean square noise voltages 100 times. The probability density distribution function of the measured detection results is shown in Figure 12.

Figure 12.
Simulation and experimental comparison of probability density distribution of divergence angle detection of different pulse laser signals.
Both the experimental results and the theoretical probability density distribution still show Gaussian distribution. The increase in the equivalent root mean square noise voltage will lead to the increase in the distribution half-width, the decrease in the peak value and the decrease in the target detection probability. The center position deviation and peak deviation between the ideal distribution and the actual distribution of the pulse laser of the three waveforms under different equivalent root mean square noise voltages are counted, as shown in Table 4 (the data are retained in two decimal places).
Table 4.
The theoretical simulation and actual numerical deviation table of the detection probability density distribution of three waveform pulsed lasers under different ENVs.
Under different equivalent root mean square noise voltages, the mean value of the center position deviation, the mean value of the peak deviation of the theoretical distribution and the measured distribution of the three function pulses are 0.06 m and 1.17, respectively. Among them, the mean values of the center position deviation between the theory and the measured distribution of the Gaussian function pulse and the heavy-tailed function pulse are low, which are 0.03 m and 0.02 m, respectively, and the parabolic function pulse is higher, which is 0.13 m. The mean values of the peak deviations between the theoretical and measured distributions of the Gaussian function pulse and the heavy-tailed function pulse are higher, which are 1.32 and 2.00, respectively, and the deviation value of the parabolic function pulse is lower, which is 0.20.
The analysis shows that due to the small experimental sample size and the signal difference between the measured laser echo and the theoretical echo, the mean value of the theoretical probability density distribution is higher than the measured average. The theoretical distribution of the detection probability of Gaussian function pulses and heavy-tailed function pulses are less offset to the right than that of the measured distribution. However, with the increase in the equivalent rms noise voltage, the correct offset of the theoretical and measured distribution of these three pulses increases gradually, with the pulse shift of the heavy-tailed function being the least and the pulse shift of the parabolic function being the largest.
6. Discussion
This paper investigates the effects of transmit power, pulse laser divergence angle, and equivalent rms noise voltage on the echo characteristics and detection probability distribution of three outgoing pulse signal waveforms. It finds that the echo amplitude and detection probability of the three pulsed signals decreases as the transmit power decreases. Except for the inverted parabolic function pulse laser, the amplitude of the pulse laser echo and the detection probability will decrease with the decrease in the divergence angle. The increase in the equivalent root means square noise voltage will increase the half-width of the probability density distribution of pulsed laser detection. The mean deviation of the center position between the ideal distribution and the measured distribution of the Gaussian function pulse laser and the heavy-tailed function pulse laser detection is less than the total mean, and the total mean is +0.04 m, +0.07 m and +0.06 m, respectively. The mean deviation of the heavy-tailed function is +0.01 m, +0.05 m, and +0.02 m, respectively, and the fidelity is the highest, which is more suitable for the laser short-range static circumferential detection in this paper.
In fact, the high fidelity of the heavy-tailed function indicates that it accurately simulates the inherent asymmetry of actual semiconductor laser pulses (steep rise and slow decay). Unlike the symmetric Gaussian model, which leads to system biases (+0.02–0.08 m), the heavy-tailed function captures these fundamental dynamics, reducing prediction errors to +0.01 m. In practice, using this more accurate model can better eliminate system bias without complex hardware calibration. This ensures the centimeter-level ranging accuracy required for optimal missile fuze detonation height control, significantly enhancing the system’s lethality.
However, from the data of the ideal distribution and the measured distribution in this paper, the mean difference in the center position deviation between the Gaussian function pulse laser and the heavy-tailed function pulse laser under the influence of the three factors in this paper is +0.01 m, −0.01 m and +0.01 m, respectively, which is relatively close. In order to improve the detection accuracy, anti-interference, and fidelity of the laser technology, the detection performance of Gaussian function pulsed lasers and heavy-tailed function pulsed lasers will need to be studied and analyzed in depth in the future from various aspects. Whether the data analyzed in the study meet the actual values of detecting missiles in real environments will be verified.
Author Contributions
Conceptualization: L.G.; Methodology: C.K.; Formal analysis and investigation: C.K. and M.C.; Writing—original draft preparation: C.K.; Writing—review and editing: C.K.; Funding acquisition: L.G. and H.Z.; Resources: L.G. and H.Z.; Supervision: L.G. All authors have read and agreed to the published version of the manuscript.
Funding
This research was funded by the National Natural Science Foundation of China, grant number 51605227. This research was supported by the Fundamental Research Funds for the Central Universities, No. 30925020201.
Institutional Review Board Statement
Not applicable.
Informed Consent Statement
Not applicable.
Data Availability Statement
The data available to the Institute are presented in the form of figures or tables in the manuscript, and the rest of the data are available from the corresponding author upon reasonable request.
Acknowledgments
Thanks to Lin Gan for guidance on research design and data analysis.
Conflicts of Interest
The authors declare no conflict of interest.
References
- Chen, H.; Zha, B.; Zheng, Z.; Zhang, H. Static short-range laser circumferential detection using a transmissive-reflective optical architecture. Sci. Rep. 2025, 15, 24225. [Google Scholar] [CrossRef] [PubMed]
- Yang, C.; Jiang, Z.; Guo, S.; Wang, L. A potential way of detecting circulating tumor cells via laser scanning. J. Mod. Opt. 2022, 69, 462–466. [Google Scholar] [CrossRef]
- Bahmeh, Z.; Zangeneh, H.R. Detection of a target hidden in dense cloud clutter using an echo pattern of pulsed laser radar systems. Laser Phys. 2023, 33, 086203. [Google Scholar] [CrossRef]
- Xu, X.; Zhang, H.; Zhang, X.; Chen, S.; Zhang, W. The influence of pulse laser detection plane target characteristics on ranging distribution. Acta Phys. Sin. 2016, 21, 10. [Google Scholar]
- Wu, Y.; Huang, Z.; Guo, K.; Zhao, F. Research on development and application of laser fuze passive jamming technology. Electro-Opt. Technol. Appl. 2021, 36, 5–7. [Google Scholar]
- Li, H.; Zhang, X. Laser reflection characteristics calculation and detection ability analysis of active laser detection screen instrument. IEEE Trans. Instrum. Meas. 2022, 71, 7000111. [Google Scholar] [CrossRef]
- Steinvall, O. Influence of laser radar sensor parameters on range-measurement and shape-fitting uncertainties. Opt. Eng. 2007, 46, 106201. [Google Scholar] [CrossRef]
- Steinvall, O.; Chevalier, T. Range accuracy and resolution for laser radars. Electro-Opt. Remote Sens. 2005, 5988, 73–88. [Google Scholar]
- Xie, G.; Ye, Y.; Li, J.; Yuan, X. Echo characteristics and range error for pulse laser ranging. Chin. J. Lasers 2018, 45, 0610001. [Google Scholar] [CrossRef]
- You, A.; Gan, L. Target echo characteristics based on laser dynamic detection mechanism. Infrared Laser Eng. 2023, 53, 1828–1833. [Google Scholar]
- Jiang, H. Statistical Properties of High Repetition Rate Pulse Laser Radar Range and Its Image Quality Evaluation. Doctoral Dissertation, Nanjing University of Science and Technology, Nanjing, China, 2024. [Google Scholar]
- Xie, S.; Zhao, Y.; Wang, J.; Jia, X. Laser fuze anti-surf based on two-wavelength detection. Infrared Laser Eng. 2017, 46, 42–46. [Google Scholar]
- Gan, L.; Zhang, H. Short-range static detection method of single pulse laser based on light cone beam expansion mechanism. Chin. J. Sci. Instrum. 2023, 44, 150–159. [Google Scholar]
- Brahim, M.; Salah, R.; Issam, T. Recent Advances in Wavelet Transforms and Their Applications; IntechOpen: London, UK, 2022; pp. 23–27. [Google Scholar]
- Johnson, S.E.; Nichols, T.L.; Gatt, P.; Klausutis, T. Range precision of direct-detection laser radar systems. Proc. SPIE 2004, 5412, 72–86. [Google Scholar]
- Cain, S.; Richmond, R.; Armstrong, E. Flash light detection and ranging range accuracy limits for returns from single opaque surfaces via Cramer-Rao bounds. Appl. Opt. 2024, 45, 6154–6162. [Google Scholar] [CrossRef] [PubMed]
- Gronwall, C.; Carlsson, T.; Gustafsson, F. Performance analysis of measurement error regression in direct-detection laser radar imaging. In Proceedings of the IEEE International Conference on Acoustics, Speech, and Signal Processing (ICASSP ‘03), Hong Kong, China, 6–10 April 2003; Volume 6, pp. 542–545. [Google Scholar]
- Zha, B.; Yuan, H.; Ma, S.; Chen, G. The influence of the parameters of single-beam scanning laser panoramic detection system on the detection ability. Acta Phys. Sin. 2019, 68, 73–82. [Google Scholar] [CrossRef]
- Jiang, H.; Lai, J.; Wang, C.; Li, J. Study on the ranging characteristics of LiDAR and its ranging accuracy. Infrared Laser Eng. 2011, 38, 229–235. [Google Scholar]
- Papoulis, A.; Pillai, S.U. Probability, Random Variables and Stochastic Processes, 4th ed.; McGraw-Hill: New York, NY, USA, 2002. [Google Scholar]
- Zhang, Y.; Cheng, Y.; Li, X.; Chen, Y. Precision analysis of ToF LiDAR in atmospheric turbulence channels. Opt. Lett. 2025, 50, 2077–2080. [Google Scholar] [CrossRef] [PubMed]
- Jiang, H.; Lai, J.; Wei, Y.; Wang, C.; Li, Z. Theoretical distribution of range data obtained by laser radar and its applications. Opt. Laser Technol. 2013, 45, 278–284. [Google Scholar] [CrossRef]
Disclaimer/Publisher’s Note: The statements, opinions and data contained in all publications are solely those of the individual author(s) and contributor(s) and not of MDPI and/or the editor(s). MDPI and/or the editor(s) disclaim responsibility for any injury to people or property resulting from any ideas, methods, instructions or products referred to in the content. |
© 2025 by the authors. Licensee MDPI, Basel, Switzerland. This article is an open access article distributed under the terms and conditions of the Creative Commons Attribution (CC BY) license.