Abstract
This study quantitatively verified the impact of applying accumulated data on the model’s prediction accuracy, overfitting, and adaptive learning ability by using a method that accumulates and retrains machine data of a TBM generated whenever excavation progresses at regular intervals. To achieve this, the performance of five machine learning algorithms was evaluated on two field datasets. The best-performing gradient boosting model was selected as the preliminary model. The performance results of the preliminary model and the cumulative model were then compared using another field dataset. The field data for the performance comparison were divided into 14 steps based on ground information, and the performance of the two models was compared sequentially at each step. The results showed that the preliminary and cumulative models exhibited similar predictive performance in the initial intervals. However, the cumulative model more closely matched actual measurements as new data was added than the preliminary model. Consequently, the preliminary model, based on past data, has clear limitations in adapting to the diverse variables encountered in real-world situations. On the other hand, cumulative models are essential for improving real-time prediction performance of processes with constantly changing environments, such as TBM, by continuously increasing relevant field data.
1. Introduction
The importance of predicting and controlling the advance rate of TBMs (Tunnel Boring Machines) affecting TBM operation efficiency and project schedule and cost is constantly being highlighted because urban densification leads to saturation of surface space and increases demand for underground expansion [1,2,3]. Previous studies on predicting TBM advance rate primarily relied on statistical regression analysis or empirical models. Existing empirical/statistical models rely on mathematical functions or assumptions to explain the relationships between the variables of the models. They have limitations, such as failing to accurately capture nonlinear and high-dimensional relationships or degrading performance when faced with outliers or extreme geological events [4,5,6]. Therefore, empirical approaches cannot sufficiently reflect the diversity and nonlinearity of field data. Recently, data-driven approaches based on machine learning (ML) have been actively attempted in the field of predicting TBM excavation performance to address these issues, and research is being conducted to overcome the limitations of existing models through nonlinear relationship learning [7,8,9,10].
Machine learning models have the advantage of quantitatively predicting tunneling speed by learning patterns from large-scale TBM operation data [11]. However, most existing studies take a one-time approach, training models based on fixed datasets acquired at a specific point in time. In actual TBM sites, machine data continuously accumulates through sensors and logging systems as tunneling progresses. Therefore, gradually incorporating this accumulated data into the model is likely to improve prediction accuracy and generalization performance [5].
As such, Huang et al. (2022) proposed a Bidirectional Long Short-Term Memory (BLSTM) network-based model for TBM cutterhead torque prediction and additionally proposed an incremental learning model to improve the model’s generalization ability. In other words, they demonstrated that cumulative data accumulation, as the model learns new ground conditions or operating environments, can lead to improved adaptive performance. However, this model was trained using only machine data, excluding the geotechnical information from TBM tunneling data [8]. Katuwal and Panthi (2005) quantitatively demonstrated that tunneling speed is influenced by both geological conditions and TBM parameters. They noted that geological conditions are particularly important when ground conditions change significantly [6]. In addition, Wang et al. (2022) proposed a new framework (AL-iGAN) that combines active learning and incremental learning, and presented a data-based methodology to restore geological information (rock and soil distribution) by gradually updating only the weights of the network with new samples while maintaining the existing weights, rather than retraining the entire model from scratch whenever new data is added [12].
Recently, active efforts have been made to improve ground condition recognition and prediction accuracy by leveraging continuous and cumulative data generated during TBM excavation. Yang et al. (2026) proposed a real-time rock quality assessment model combining online data stream processing and transfer learning techniques. Yang et al. (2025) reported that the additional utilization of cumulative data contributed to improved prediction performance through a machine learning-based classification model that integrated operational and cutter wear data. These studies demonstrate that the incorporation of cumulative data can potentially lead to performance improvements in TBM excavation speed prediction models [13,14].
Until now, most TBM-related predictive models have been offline models trained on statically collected datasets after the completion of field excavation [15,16]. However, these static models have a fundamental limitation: they fail to reflect dynamic, evolving information that accumulates and updates over time, such as ground changes, equipment condition changes, wear progression, and changes in operating conditions during the excavation process [17,18,19]. In contrast, approaches that utilize cyclic, cumulative data accumulated during TBM operation have the advantage of enabling models to adapt to new ground conditions, continuously improve performance by reflecting recent patterns, and immediately self-correct when prediction errors increase [20,21]. In particular, since TBM excavation is a non-stationary system in which data distribution changes over time due to ground heterogeneity, rock strength changes, and cutter wear accumulation, models based on accumulated data offer superior potential than offline models in terms of predictions that reflect the latest field conditions, real-time decision support, early detection of ground hazards, and enhanced generalization performance of predictions [15,19,20].
In this study, we developed a machine learning model for predicting TBM excavation speed and compared and analyzed model performance changes step-by-step based on the cumulative application of actual field tunneling data. The preliminary model was derived based on tunneling data from two similar-diameter TBM sites that had already been constructed. The results of applying the preliminary model to a new site were compared step-by-step with the results of retraining the model using accumulated machine data as excavation progressed in a new site. Through this approach, we quantitatively verified the impact of cumulative data application on the model’s predictive accuracy, overfitting prevention, and adaptive learning capabilities.
2. Dataset
2.1. Project Description
In this study, tunneling data from two slurry shield TBM tunnels (TBM sites 1 and 2) were collected to develop a preliminary model. The collected data consisted of machine data stored on the TBM equipment and ground (geological and geotechnical) data extracted from ground investigation reports and longitudinal cross-sections prepared during the tunnel design process.
The geological conditions of TBM site 1 reveal a colluvium composed of silty sand and silty clay on the upper portion of the tunnel, and the bedrock composition of the tunnel passage section is 95% soft rock and 5% hard rock. Regarding geotechnical conditions, the Residual Quantity Displacement (RQD) was 25% or less in 57.9% of the section, and 25% or more in 42.1% of the section. The uniaxial compressive strength (UCS) ranged from 7.9 to 101.9 MPa, indicating a site with weak rock quality (Figure 1a).
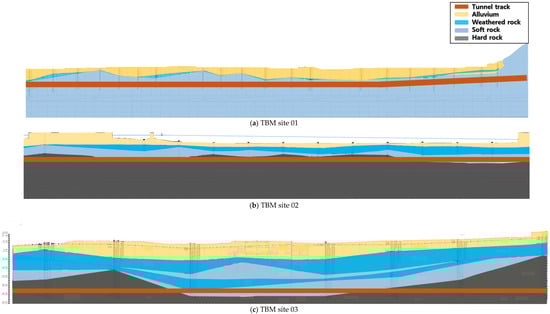
Figure 1.
Geological profiles of the studied TBM tunnel.
Geological conditions at TBM site 2 include a shallow sedimentary layer composed of clay and sandy soils and weathered soils in the upper portion of the tunnel. The bedrock composition of the tunnel passage section is 64.3% soft rock and 35.7% hard rock. The on-site bedrock has a UCS ranging from 9.08 to 67.13 MPa, and some sections with poor rock conditions due to advanced weathering were also investigated (Figure 1b).
The geological conditions of TBM site 3, which were used to verify the performance of the initial model and the cumulative learning effect, include sandy silt or silty sand distributed in the upper part of the tunnel with a layer thickness of 0.5 to 12.0 m, and the bedrock in the tunnel passage section is composed of 8% soft rock fracture zone, 25% soft rock, and 66% hard rock. The rock mass RQD was 24% below 25, 12% between 25 and 50, and 60% above 50, and the UCS was 27.7 to 106.4 MPa, indicating good rock quality (Figure 1c).
In this study, three TBMs with identical type, diameters, and specifications were selected to minimize differences in equipment specifications (Figure 2 and Table 1). The TBM diameters at TBM sites 1 and 3 are 3.59 m, and those at TBM site 2 are 3.5 m. Their maximum thrust is 12,000 kN, maximum torque is 1410 kN·m, and maximum RPM is 4.6.
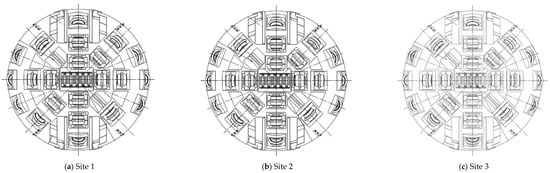
Figure 2.
Front view of the cutterhead.

Table 1.
Summary of Slurry TBM machine specification.
2.2. Feature Selection
For the application of machine learning, tunneling data from three sites were collected and analyzed. Machine data collected at each site amounted to 76,800 (site 1), 73,700 (site 2), and 73,600 (site 3). To utilize both machine data and ground data together, machine data was used at the segment locations where the ground information was available, as well as the segments preceding and following that segment. In this way, 4300 data points were used for the preliminary model (sites 1 and 2), and 2645 data points were used for the cumulative model (site 3).
The average total thrust force was 5876.08 kN, representing approximately 49% of the machine’s maximum capacity (ca. 12,000 kN). The values ranged widely from a minimum of 406 kN to a maximum of 12,896.90 kN, indicating that the thrust force was actively adjusted to adapt to varying ground conditions. Notably, Site 3, characterized by great depth and hard rock conditions, required the highest average thrust force of 7239.20 kN. This is more than 40% higher than that of Site 2 (5070.21 kN), suggesting that significant energy input was necessary for excavating challenging ground.
The cutterhead torque recorded a mean of 213.52 kN·m, representing approximately 15.1% of the machine’s maximum torque capacity. While Site 2 (258.52 kN·m) and Site 3 (254.03 kN·m) maintained similarly high levels of torque, Site 1 operated with a significantly lower average of 96.79 kN·m. This is presumed to be one of the primary factors contributing to the low advance rate at Site 1 relative to the ground strength.
While the overall average feeding and discharge rates were similar at 4.51 m3 and 4.88 m3, respectively, Site 3 exhibited the highest volumes (feeding: 5.54 m3, discharge: 5.65 m3). This suggests that a higher volume of slurry circulation was necessary to ensure face stability and optimize discharge efficiency, given the deep depth and high pressure.
The Rock Quality Designation (RQD) recorded a mean of 48.76%, but with a standard deviation of 31.67%, it exhibited the highest variability among all variables. The data encompasses the full spectrum from a minimum of 0% to a maximum of 100%, indicating that the training dataset reflects diverse geological conditions ranging from severely fractured zones to fresh, intact rock. Specifically, Site 1 (mean 44.37%) is characterized by high variability and unstable rock conditions, while Site 2, with the lowest average of 36.85%, appears to consist largely of the most highly fractured rock. In contrast, Site 3 (mean 65.96%) is identified as relatively favorable and sound rock.
The Uniaxial Compressive Strength (UCS) showed a mean of 46.28 MPa and a standard deviation of 25.92 MPa, exhibiting a distribution ranging from soft to hard rock. Site 1 is identified as the weakest ground with an average of 31.93 MPa, while Site 2 (mean 41.45 MPa) likely represents intermediate strength conditions with localized hard rock occurrences. In contrast, Site 3 recorded a substantially higher average strength of 63.20 MPa; this is considered the primary factor necessitating high thrust and torque during excavation. Based on the RQD and UCS data, Site 1 is characterized by soft and irregular ground conditions. For Site 2, while the strength is at an intermediate level, the RQD is the lowest; this implies a high probability of a fractured zone with highly developed joints, where the rock material itself is relatively hard. In contrast, Site 3 exhibited the highest values for both RQD and UCS, indicating that it is a deep, hard, and sound rock zone.
The statistical characteristics of the data and the distribution characteristics by data item are shown in Figure 3 and Table 2.
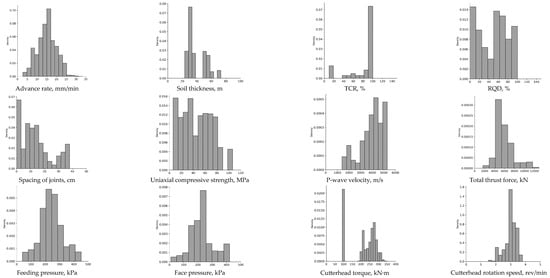
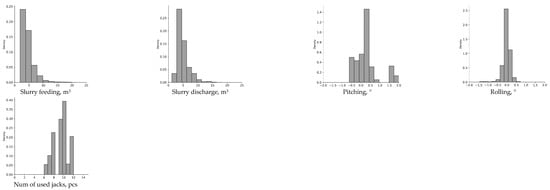
Figure 3.
Distribution of data for feature selection.
Table 2.
Statistical description of the database.
At a TBM excavation site, hundreds to thousands of machine data items can be generated, including pressure, velocity, temperature, position/direction, and excavation time history variables. Approximately 1000 of these variables were recorded at this study sites. For accurate and effective machine learning predictions based on TBM construction data, selecting the appropriate characteristic variables and properly processing the selected data are paramount.
To select feature variables, we first excluded from the analysis various items that did not contribute to predicting the TBM’s tunneling speed, such as various voltage measurements, measured temperatures, and position and attitude information. In a statistical analysis of the data items, the data for each feature variable can be divided into 25% units and expressed as Q1 (1st quartile), Q2 (2nd quartile), and Q3 (3rd quartile), and the results can be used to determine the data distribution characteristics and outliers. As shown in Figure 4, the statistical distribution form of the feature variables was first confirmed, and then a correlation analysis between the variables was performed, as shown in Figure 5.
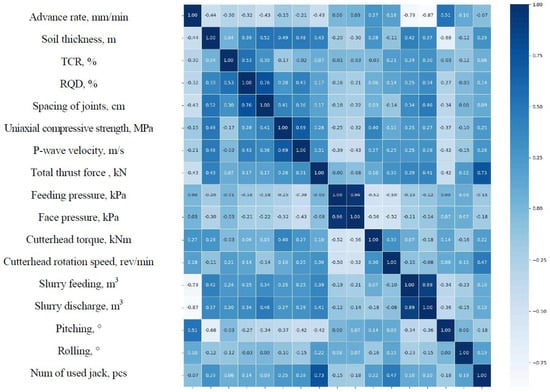
Figure 4.
Pair-wise correlation between TBM data features.
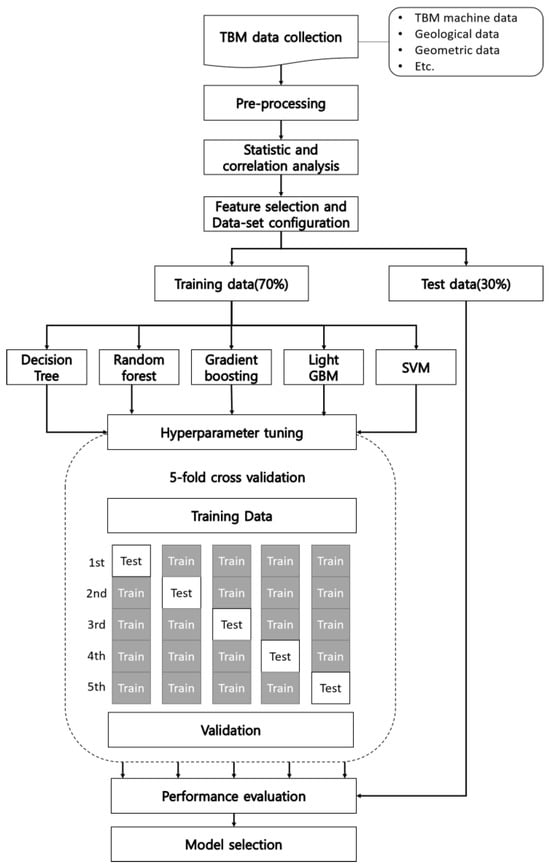
Figure 5.
Framework for the evaluation and selection of regression algorithms for preliminary model.
Analysis of the correlation between slurry discharge (−0.87) and slurry feeding (−0.79) and advance rate revealed strong negative correlations. This indicates that the greater the slurry input and discharge, the lower the advance rate. Similar negative correlations were also observed with soil thickness (−0.44) and joint spacing (−0.43), indicating that thicker soil cover or more challenging rock conditions tend to reduce the advance rate. Notably, a negative correlation of −0.43 was observed between total thrust force and advance rate. While it is generally expected that increasing thrust will increase the advance rate, this result reflects the physical characteristics of TBM excavation: harder rock or more difficult excavation conditions require higher thrust, while simultaneously reducing the advance rate.
The selection of characteristic variables for the prediction model of TBM advance rate comprehensively considered factors related to TBM equipment operation and geotechnical factors. Ten key equipment operation factors (total thrust, cutterhead torque, face pressure, cutterhead RPM, feeding pressure, slurry feeding, slurry discharge, pitching, rolling, and number of jacks) were identified, while six key ground factors (soil thickness, TCR, RQD, spacing of joints, UCS, and P-wave velocity) were finalized as characteristic variables.
3. Preliminary Model for Prediction of Advance Rate
3.1. Performance Evaluation Method and Hyperparameters
A preliminary model predicting advance rate was developed based on data from two completed TBM sites (TBM sites 1 and 2). The preliminary model applied supervised learning-based regression algorithms and compared the results. The applied machine learning algorithms included single models such as decision trees and support vector regression, as well as ensemble algorithms such as random forests and gradient boosting. Light GBM, known to address the slow learning rate and overfitting issues of gradient boosting, was also applied.
To enhance model accuracy and reliability, training and test data were split at a 7:3 ratio. To evaluate the predictive performance of the regression model, we used the Root Mean Squared Error (RMSE), which measures the difference between the observed value and the actual value by taking the root of the mean squared error, and the coefficient of determination (R2), which measures how well the predictive model fits the given data. A coefficient of determination closer to 1 indicates a higher explanatory power of the regression model, while a lower RMSE indicates better predictive performance (Table 3).
Table 3.
Performance measures of regression prediction.
In machine learning, hyperparameters are variables set directly before training and are used to determine the optimal training model. During data training, hyperparameter tuning is performed to find the optimal parameter combination for the model.
To prevent overfitting of the training results for TBM advance rate prediction to certain data, k-fold cross-validation was applied. K-fold cross-validation involves dividing the previously split 7:3 training data into k sets, creating k sets of training and test data. This training is repeated k times, and the results of these k sets are averaged to obtain unbiased final performance (Figure 5). GridSearchCV, a tuning method that finds the best-performing hyperparameter combination through performance comparison of five-fold cross-validation runs, was used to determine appropriate target variable parameters for the regression learning models (Table 4).
Table 4.
Summary of hyperparameter for preliminary model.
3.2. Selection of Preliminary Model
The machine learning training results for predicting the TBM advance rate are shown in Table 5 and Figure 6. The decision tree model showed a coefficient of determination of 0.899 in the training set (70%) and 0.894 in the test set (30%). The scatter plot in Figure 6a shows that the points around the regression line are relatively more spread out compared to other models, indicating a large prediction error. The random forest model showed excellent performance, with a coefficient of determination of 0.938 in the training set (70%) and 0.933 in the test set (30%). The gradient boosting model showed the best predictive performance, with points densely clustered around the regression line in the scatter plot in Figure 6c, a high coefficient of determination of 0.958 in both the training and test sets, and the lowest RMSE of 0.943. The Light GBM model and the SVR model also showed high explanatory power, with a coefficient of determination of over 0.95 in the test set. As a result, it was found that gradient boosting, Light GBM, and SVR models are suitable algorithms for predicting TBM advance rate.
Table 5.
Evaluating the performance of regression models for Shield TBM Datasets.
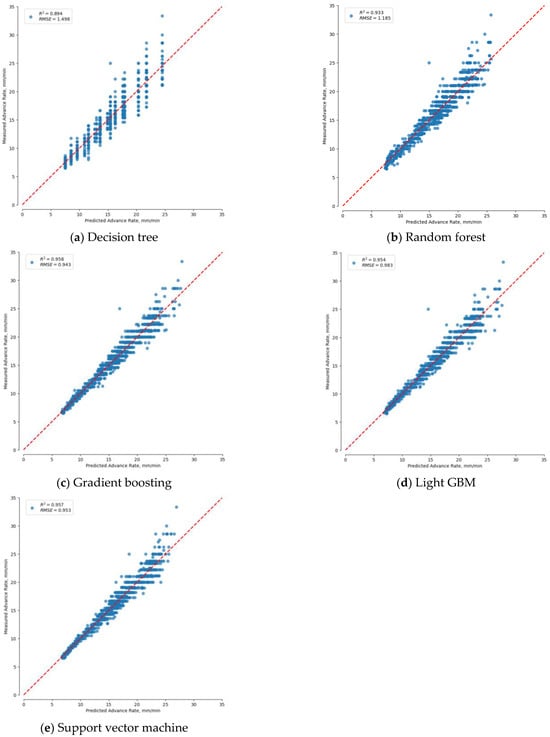
Figure 6.
Prediction result of regression modelling based on Shield TBM excavation data.
Consequently, the machine learning training results based on data from TBM sites 1 and 2 confirmed that ensemble techniques (Gradient Boosting, Light GBM) and kernel-based support vector regression (SVR) effectively learned the corresponding TBM data, enabling highly accurate prediction of advance rate. In particular, the gradient boosting model showed the best performance across all evaluation indices, and was selected as the preliminary model for predicting TBM advance rate in this study.
4. Prediction Results of Advance Rate in TBM Site 3
In Section 3.2, we performed machine learning using tunneling data from two completed TBM sites, and selected a preliminary model based on the training results. The selected preliminary model’s algorithm was gradient boosting. In this Section 4, we used gradient boosting as the base algorithm to train the tunneling data from TBM Site 3 step-by-step, and compared the performance of the preliminary model with the results from each step model.
4.1. Preliminary Model vs. Cumulative Model
As described in Section 2.2, this study included ground information as feature variables of the machine learning model. Therefore, we selected a construction section where ground information could be matched and compared the results of the initial model with cumulative model using accumulated data. Unlike machine data, ground information is investigated irregularly and discontinuously. To match the continuously generated machine data with ground information, we used machine data corresponding to the segments where ground information is available, as well as the segments preceding and following that segment. We divided the model into 14 steps, based on the segment positions where ground information was available, and trained the model using tunneling data for each step. The tunneling data at each step was applied sequentially and cumulatively to each step model. For example, in step 2 model, a dataset was applied that combined the preliminary model data (TBM site 1 and 2), step 1 data, and step 2 data. Table 6 summarizes the construction locations where step-based training was performed for TBM Site 3.
Table 6.
Construction location of TBM site 3 for learning.
Figure 7 shows the results of predicting advance rate using a Gradient Boosting model (R2: 0.970, RMSE: 0.867) with the entire tunneling data (step 13) collected from TBM sites 1, 2, and TBM site 3. This result is similar to the results (R2: 0.958, RMSE: 0.943) obtained using the Gradient Boosting model selected as the preliminary model in Section 3.2. Table 7 summarizes the learning results using the accumulated data at each step.
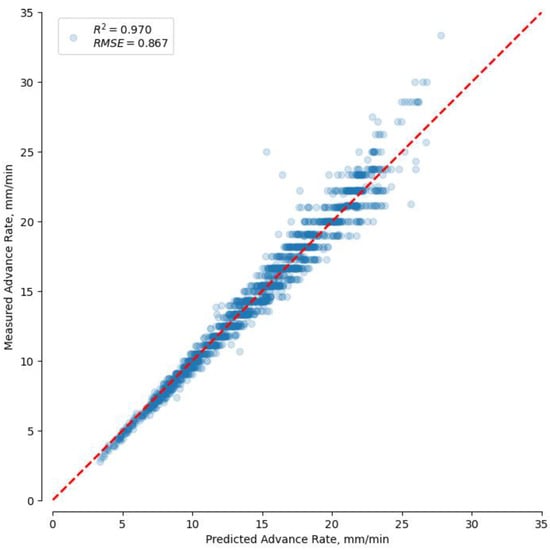
Figure 7.
Prediction result of Gradient boosting model based on cumulative data in TBM site 3 (Step 13).
Table 7.
Results of Gradient boosting model with step.
The results in Table 8 are obtained when all data were included in the learning model. As is well known, when a machine learning model performs predictions on data not used for training, the prediction accuracy for the target often decreases. This phenomenon is commonly observed when evaluating the performance of machine learning (ML) models, and can lead to poor generalization ability or overfitting, where the model is overfitted to the training data and thus has poor predictive ability on new data [7,11,22].
Table 8.
Summary of prediction results from preliminary model and cumulative model.
The cumulative learning method employed in this study iteratively retrains the model by gradually incorporating all accumulated field data. At each point, not only newly acquired data but also the entire previously collected data set is reused, thereby more faithfully reflecting changes in the TBM operating environment and ground characteristics. The fundamental mechanism of this method is based on the idea that as data accumulates, the diversity and representativeness of the training sample increase. At each learning stage, the model re-estimates its parameters using the entire accumulated data, thereby mitigating the problems of overreliance on initial data bias or local patterns. While this iterative retraining increases computational costs, utilizing the entire accumulated data provides advantages such as continuous prediction stability, enhanced model generalization performance, and enhanced adaptability to changing ground conditions. Therefore, it is effective in gradually improving the accuracy of field-based TBM time-series prediction models.
Figure 8 shows the results of predicting the advance rate for the next step using the learning model constructed for each step. For example, Figure 8a shows the prediction of the advance rate for the step 2 data using a model that includes only data up to step 1 (chainage 93.6 to 97.3) and excludes data for the next step (step 2, chainage 194.0 to 197.6).
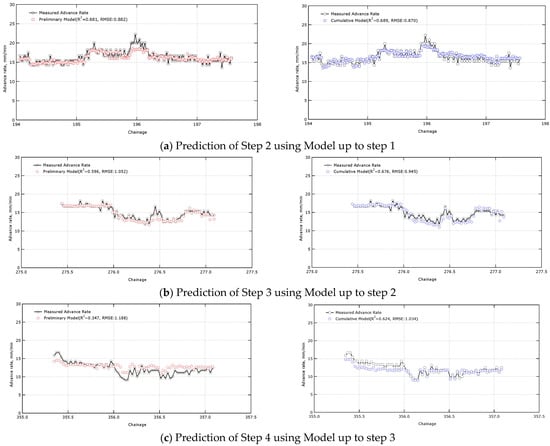
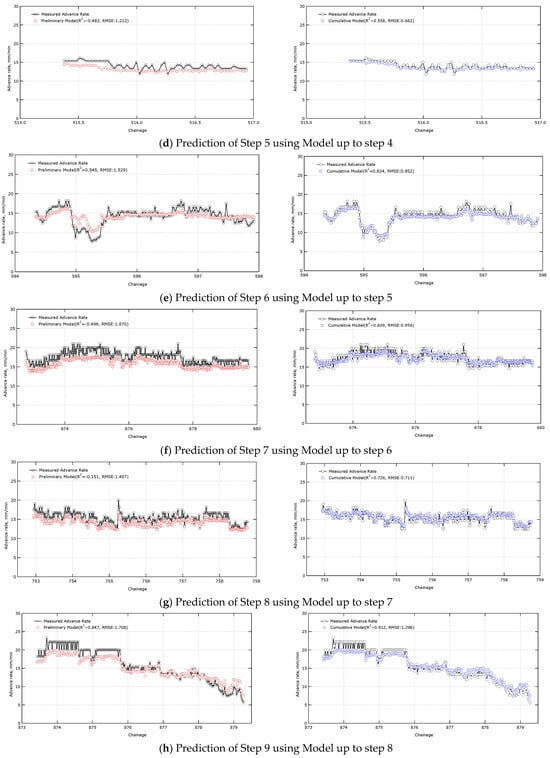
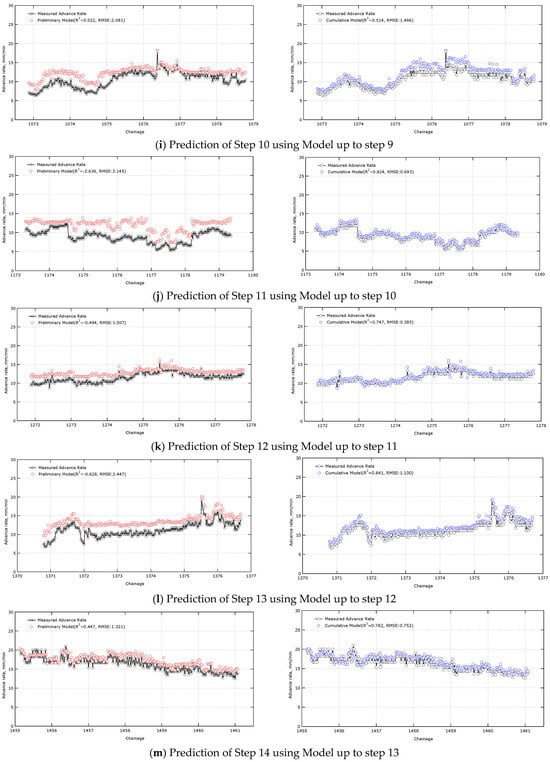
Figure 8.
Comparison of prediction results between preliminary model and cumulative model.
In the front step prediction, the preliminary model and the cumulative model showed similar prediction performance. However, as new data were added, the cumulative model predicted values more closely matching the actual measurements. In step 2, the R2, which represents the model’s prediction accuracy, was 0.681 for the preliminary model and 0.689 for the cumulative model. However, in step 14, the cumulative model’s R2 improved to 0.762, while the preliminary model’s remained at 0.447. The RMSE, an indicator of the difference from the actual measurements, also increased from 0.882 for the preliminary model in step 2 to 1.321 in step 14. In contrast, the cumulative model’s RMSE decreased from 0.870 in step 2 to 0.752 in step 14. In particular, the difference between the two models became significant from step 4 onward, and the preliminary model’s R2 value was negative in some steps, resulting in predictions worse than those based on the average of the data. In step 9, the preliminary and cumulative model results were similar, but this result appears to be partially due to the availability of data suitable for the learning model. These results demonstrate that as excavation progresses and data accumulates, the cumulative model becomes optimized to suit the site’s characteristics, significantly increasing the performance gap with the preliminary model (Table 8, Figure 9).
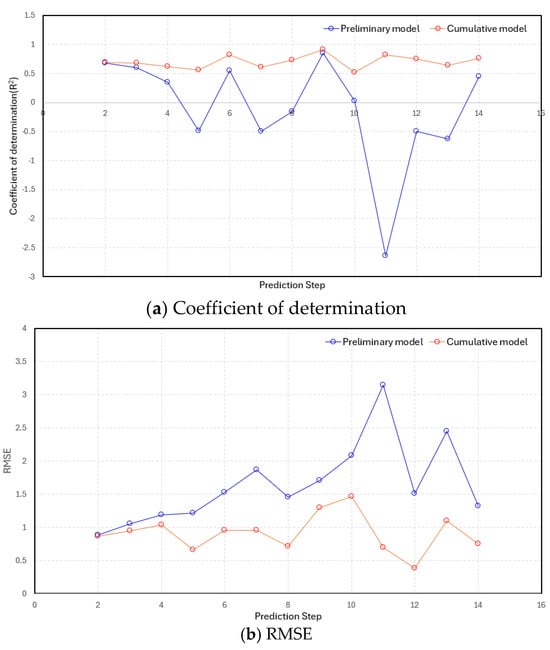
Figure 9.
Variations in the prediction results of preliminary model and cumulative model with each step.
4.2. Prediction Results for Total Data of TBM Site 3
In this section, we combined the 14 step results of TBM site 3 derived in Section 4.1 and compared the prediction results for the entire TBM site 3 section. While the preliminary model was applied as a single model to the entire section (steps 1–14), the cumulative model applied a model based on accumulated data for each step. Therefore, the predicted values, which are the results of the models for each step, were sequentially combined, as shown in Figure 10, to calculate the coefficient of determination and RMSE between the actual and predicted values.
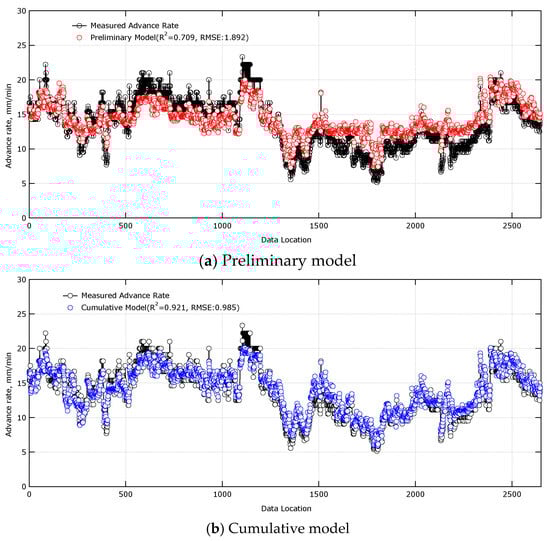
Figure 10.
Comparison of prediction results between preliminary model and cumulative model for total data.
The coefficient of determination of the preliminary model was 0.709, while that of the cumulative model was 0.921, confirming the superior explanatory power of the cumulative model. Furthermore, the RMSE, which represents the average magnitude of the prediction error, was 0.985 for the cumulative model, representing a decrease of approximately 48% from 1.892 for the preliminary model. Thus, the cumulative model, which employs a continuous and dynamic learning approach, adapts to the specific geological conditions and operational situations of the current work site, enabling more reliable and accurate predictions of TBM advance rate (Figure 10).
Preliminary models, based on historical data, clearly have limitations in responding to the diverse variables encountered in actual field conditions. Conversely, cumulative models, by continuously evolving with relevant field data, can dramatically improve predictive reliability. This suggests the potential for more accurate process management and risk prediction during TBM excavation, and could contribute to data-driven smart tunneling technology.
5. Conclusions
This study developed a machine learning preliminary model using data from two TBM sites and compared the performance of the preliminary model with the cumulative model using data from another TBM site. By accumulating and retraining newly generated machine data as excavation progressed, we quantitatively verified the impact of cumulative data application on the model’s predictive accuracy, overfitting, and adaptive learning ability. The following main conclusions can be drawn from the study.
- Machine learning regression models are suitable for predicting continuous numerical values and are effective for tunneling data, which is time-series continuous data. In the preliminary model selection, five supervised learning-based regression algorithms were used to predict the advance rate of a TBM. Among the machine learning techniques, the gradient boosting model showed the best performance, with a coefficient of determination (0.958) and root mean square error (0.943).
- Tunneling data from TBM Site 3 were trained step-by-step, and the performance of the preliminary model was compared with the results of cumulative model obtained at each step. The steps were divided into 14 steps based on construction locations with available geotechnical information. Using data from each step, the performance of the preliminary model (static) and the cumulative model (dynamic model utilizing accumulated data) were evaluated. This performance review aimed to assess not only predictive ability but also generalization capabilities.
- The preliminary model’s predicted values showed a tendency toward unstable and significantly degraded prediction performance as excavation progressed, with increasing discrepancies from actual field values. In particular, there were many instances where the R2 value was negative, indicating a loss of reliability as a predictive model. In contrast, the cumulative model consistently learned data from the beginning of the prediction process, demonstrating stable and improved predictive accuracy over time. This proves the importance of the ability to dynamically adapt to changes in actual field conditions. Therefore, it can be concluded that a dynamic model, continuously updated with real-time data, is far more effective than a static model that relies solely on historical data when predicting TBM advance rate.
- The above results demonstrate the effectiveness of the cumulative model. Building a cumulative model for a wider range of ground conditions could improve the model’s generalization performance. Finally, this study excluded a significant amount of machine data in order to utilize ground data. Ground investigations, aside from those typically performed during the design phase, are rarely performed during TBM construction. Therefore, a data processing method capable of broadly utilizing machine data is needed in AI models for TBM performance prediction.
Author Contributions
Conceptualization, T.-H.K. and S.-W.C.; methodology, S.-W.C.; software, T.-H.K.; validation, T.-H.K. and S.-W.C.; formal analysis, S.-H.C.; investigation, T.-H.K., S.-W.C. and S.-H.C.; data curation, T.-H.K. and S.-W.C.; writing—original draft preparation, T.-H.K.; writing—review and editing, S.-W.C.; visualization, S.-H.C.; supervision, S.-W.C.; project administration, S.-W.C.; funding acquisition, S.-W.C. All authors have read and agreed to the published version of the manuscript.
Funding
This research was conducted with the support of the National R&D Project for Smart Construction Technology (No. RS-2020-KA157074) funded by the Korea Agency for Infrastructure Technology Advancement under the Ministry of Land, Infrastructure, and Transport, and managed by the Korea Expressway Corporation.
Institutional Review Board Statement
Not applicable.
Informed Consent Statement
Not applicable.
Data Availability Statement
The raw data supporting the conclusions of this article will be made available by the authors on request.
Acknowledgments
The authors appreciate the support of the Korea Agency for Infrastructure Technology Advancement under the Ministry of Land, Infrastructure, and Transport, and managed by the Korea Expressway Corporation.
Conflicts of Interest
The authors declare no conflict of interest.
References
- Rostami, J.; Ozdemir, L. A new model for performance prediction of hard rock TBMs. In Proceedings of the Rapid Excavation Tunnel Conference, Boston, MA, USA, 13–17 June 1993; pp. 793–809. [Google Scholar]
- Gong, Q.M.; Zhao, J. Influence of rock brittleness on TBM penetration rate in Singapore granite. Tunn. Undergr. Space Technol. 2007, 22, 317–324. [Google Scholar] [CrossRef]
- Zhou, J.; Qiu, Y.; Zhu, S.; Armaghani, D.J.; Li, C.; Nguyen, H.; Yagiz, S. Optimization of SVM with metaheuristics for TBM rate prediction. Eng. Appl. Artif. Intell. 2021, 97, 104015. [Google Scholar] [CrossRef]
- Xu, H.; Zhou, J.; Asteris, P.G.; Armaghani, D.J.; Tahir, M.M. SML techniques for TBM penetration rate. Appl. Sci. 2019, 9, 3715. [Google Scholar] [CrossRef]
- Kilic, K.; Ikeda, H.; Adachi, T.; Kawamura, Y. Soft ground micro-TBM jack speed and torque prediction using ML. Sci. Rep. 2024, 14, 11243. [Google Scholar] [CrossRef] [PubMed]
- Katuwal, T.B.; Panthi, K.K. TBM penetration rate prediction in Himalayan geology using machine learning. Rock Mech. Rock Eng. 2025, 1–33. [Google Scholar] [CrossRef]
- Mahdevari, S.; Shahriar, K.; Yagiz, S.; Shirazi, M.A. A support vector regression model for predicting TBM penetration rates. Int. J. Rock Mech. Min. Sci. 2014, 72, 214–229. [Google Scholar] [CrossRef]
- Huang, X.; Zhang, Q.; Liu, Q.; Liu, X.; Liu, B.; Wang, J.; Yin, X. Real-time prediction of TBM cutterhead torque using BiLSTM. J. Rock Mech. Geotech. Eng. 2022, 14, 798–812. [Google Scholar] [CrossRef]
- Zhang, Y.; Chen, J.; Han, S.; Li, B. Big data-based performance analysis of tunnel boring machine tunneling using deep learning. Buildings 2022, 12, 1567. [Google Scholar] [CrossRef]
- Yu, S.; Zhang, Z.; Wang, S.; Huang, X.; Lei, Q. Hybrid deep learning model for TBM advance rate prediction. J. Rock Mech. Geotech. Eng. 2024, 16, 65–80. [Google Scholar] [CrossRef]
- Liu, Z.; Wang, Y.; Li, L.; Fang, X.; Wang, J. Real-time prediction of hard-rock TBM advance rate using TCN. Front. Struct. Civ. Eng. 2022, 16, 401–413. [Google Scholar] [CrossRef]
- Wang, H.; Liu, L.; Song, X.; Zhang, C.; Tao, D. AL-iGAN: Active learning framework for geology reconstruction. Comput. Geotech. 2022, 147, 104676. [Google Scholar]
- Yang, W.; Chen, Z.; Zhao, H.; Li, J.; Chen, S.; Shi, C. Physical feature shared online transfer learning framework for cross-engineering rock mass quality perception during TBM excavation. Tunn. Undergr. Space Technol. 2026, 168, 107111. [Google Scholar] [CrossRef]
- Yang, W.; Chen, Z.; Zhao, H.; Chen, S.; Shi, C. Feature fusion method for rock mass classification prediction and interpretable analysis based on TBM operating and cutter wear data. Tunn. Undergr. Space Technol. 2025, 157, 106351. [Google Scholar] [CrossRef]
- Latif, K.; Sharafat, A.; Seo, J. Digital twin-driven framework for TBM performance prediction, visualization, and monitoring through machine learning. Appl. Sci. 2023, 13, 11435. [Google Scholar] [CrossRef]
- Loy-Benitez, J.; Lee, H.K.; Song, M.K.; Lee, J.K.; Lee, S.S. Real-time unsupervised monitoring of earth pressure balance shield-induced sinkholes in mixed-face ground conditions via convolutional variational autoencoders. Tunn. Undergr. Space Technol. 2024, 152, 105908. [Google Scholar] [CrossRef]
- Gao, X.; Song, X.; Shi, M.; Zhang, C.; Zhang, H. Real-time forecast models for TBM load parameters based on machine learning methods. arXiv 2021, arXiv:2104.06353. [Google Scholar] [CrossRef]
- Liu, F.; Yang, M.; Ke, J. Prediction method of TBM tunnel surrounding rock classification based on LSTM-SVM. Adv. Mech. Eng. 2024, 16, 16878132241255209. [Google Scholar] [CrossRef]
- Zhang, M.; Ji, A.; Zhou, C.; Ding, Y.; Wang, L. Real-time prediction of TBM penetration rates using a transformer-based ensemble deep learning model. Autom. Constr. 2024, 168, 105793. [Google Scholar] [CrossRef]
- Fu, X.; Ponnarasu, S.; Zhang, L.; Tiong, R.L.K. Online multi-objective optimization for real-time TBM attitude control with spatio-temporal deep learning model. Autom. Constr. 2024, 158, 105220. [Google Scholar] [CrossRef]
- Shen, X.; Chen, X.; Fu, Y.; Cao, C.; Yuan, D.; Li, X.; Xiao, Y. Prediction and analysis of slurry shield TBM disc cutter wear and its application in cutter change time. Wear 2022, 498, 204314. [Google Scholar] [CrossRef]
- Chen, R.; Zhang, P.; Wu, H.; Wang, Z.; Zhong, Z. Prediction of shield tunneling-induced ground settlement using machine learning techniques. Front. Struct. Civ. Eng. 2019, 13, 1363–1378. [Google Scholar] [CrossRef]
Disclaimer/Publisher’s Note: The statements, opinions and data contained in all publications are solely those of the individual author(s) and contributor(s) and not of MDPI and/or the editor(s). MDPI and/or the editor(s) disclaim responsibility for any injury to people or property resulting from any ideas, methods, instructions or products referred to in the content. |
© 2025 by the authors. Licensee MDPI, Basel, Switzerland. This article is an open access article distributed under the terms and conditions of the Creative Commons Attribution (CC BY) license.