Abstract
This study develops a machine-learning-based framework for multiclass soil classification using Cone Penetration Test (CPT) data, aiming to overcome the limitations of traditional empirical Soil Behavior Type (SBT) charts and improve the automation, continuity, robustness, and reliability of stratigraphic interpretation. A dataset of 340 CPT soundings from 26 sites in Shanghai is compiled, and a sliding-window feature engineering strategy is introduced to transform point measurements into local pattern descriptors. An XGBoost-based multiclass classifier is then constructed using fifteen engineered features, integrating second-order optimization, regularized tree structures, and probability-based decision functions. Results demonstrate that the proposed method achieves strong classification performance across nine soil categories, with an overall classification accuracy of approximately 92.6%, an average F1-score exceeding 0.905, and a mean Average Precision (mAP) of 0.954. The confusion matrix, P–R curves, and prediction probabilities show that soil types with distinctive CPT signatures are classified with near-perfect confidence, whereas transitional clay–silt facies exhibit moderate but geologically consistent misclassification. To evaluate depth-wise prediction reliability, an Accuracy Coverage Rate (ACR) metric is proposed. Analysis of all CPTs reveals a mean ACR of 0.924, and the ACR follows a Weibull distribution. Feature importance analysis indicates that depth-dependent variables and smoothed ps statistics are the dominant predictors governing soil behavior differentiation. The proposed XGBoost-based framework effectively captures nonlinear CPT–soil relationships, offering a practical and interpretable tool for high-resolution soil classification in subsurface investigations.
1. Introduction
In geotechnical engineering applications such as tunnel excavation, foundation pit support, and slope stabilization, accurate soil classification is essential for ensuring construction safety and achieving economic efficiency. Correct identification of soil types, properties, and stratigraphic distribution provides reliable geotechnical parameters for design and analysis, thereby reducing the risks of collapse, excessive settlement, and structural failure. Traditionally, soil classification relies primarily on borehole sampling followed by laboratory testing, which can yield detailed information on soil layers. However, this approach is time-consuming, costly, and spatially limited. The typically wide spacing of boreholes results in discrete data points that fail to capture the continuous variability of subsurface conditions. In addition, drilling may disturb the ground and potentially influence subsequent construction processes.
To overcome these limitations, the Cone Penetration Test (CPT) has emerged as an advanced and widely used in situ investigation technique. CPT involves pushing a cone penetrometer into the ground at a constant rate while continuously recording cone tip resistance, sleeve friction, and pore water pressure. These measurements provide high-resolution mechanical and hydrogeological profiles of the soil. Compared with traditional borehole-based methods, CPT offers several notable advantages: (a) it is minimally intrusive and avoids the disturbances associated with sampling; (b) it enables rapid testing, with each sounding completed within a relatively short period; (c) it produces continuous, high-density data capable of capturing subtle stratigraphic changes and improving soil classification accuracy; and (d) its equipment is relatively simple, portable, and cost-effective, making it suitable for use in a variety of geological settings. Owing to these advantages, CPT has become an efficient and reliable tool for soil classification in modern geotechnical investigation.
Accurate CPT-based soil classification provides a fundamental basis for a wide range of geotechnical engineering applications. Reliable stratigraphic delineation derived from CPT data is essential for three-dimensional geological modelling and uncertainty characterization [1,2,3,4,5,6], where soil type boundaries strongly influence model realism. Moreover, CPT-based soil classification is routinely used to support foundation design by informing the selection of design parameters and identifying weak or heterogeneous layers [7]. It also plays an important role in geohazard assessment, such as evaluating settlement potential, bearing capacity variability, and the susceptibility of soft or loose soil layers to deformation-related hazards [8,9].
Research on soil classification based on CPT data has a long history. Early studies mainly relied on empirical formulas and chart-based approaches to identify Soil Behavior Types (SBT). Many researchers developed empirical charts using cone tip resistance (qt), specific penetration resistance (ps), sleeve friction (fs), and pore water pressure (u2) to classify soil types and evaluate soil behavior [10,11,12,13]. These methods commonly adopt normalized parameters, such as normalized cone resistance (Psn) and friction ratio (Fr), and use SBT charts to distinguish sand, silt, and clay [14,15,16,17]. In addition, some studies introduced probabilistic or fuzzy approaches to address uncertainties in CPT data, optimizing classification boundaries through statistical analysis or fuzzy subsets to reduce misclassification [14,18]. For specific soil types such as sensitive soils, organic soils, hydrocarbon-contaminated soils, over-consolidation soils, and even lunar soils, researchers proposed modified empirical formulas that incorporate factors like partial drainage conditions or pore-pressure gradients to assess shear strength and improve classification [12,19,20,21,22,23]. In the study of fine-grained soils, some work integrated cone penetration indices or plasticity parameters from fall-cone tests with CPT data to enhance classification accuracy [24]. Moreover, using field datasets and empirical regression, several studies established relationships between CPT parameters and shear wave velocity or pre-consolidation stress, providing indirect soil classification methods [25,26]. In addition to in situ CPT interpretation, several studies have explored alternative or complementary approaches for laboratory-based cone penetration tests, particularly the fall-cone test [27,28,29], which is widely used to characterize the consistency and undrained shear strength of fine-grained soils. Recent research has investigated the replacement or enhancement of fall-cone testing through data-driven and physics-informed methods, including machine learning models trained on laboratory measurements [30], electrical-conductivity-based characterization [31], and digital laboratory development (DDL) frameworks. These approaches aim to reduce experimental uncertainty, improve repeatability, and enable rapid estimation of soil mechanical properties without relying solely on traditional cone penetration procedures. Such developments highlight a broader trend toward integrating advanced data analytics and sensing techniques to support both in situ and laboratory-scale cone penetration–based soil characterization. Although these traditional methods are widely used in engineering practice, they remain dependent on empirical SBT charts and subjective boundary definitions. As a result, they exhibit limitations such as ambiguous classification boundaries, insufficient consideration of soil microstructure effects (e.g., sensitivity and organic content), and inadequate handling of data uncertainties. These drawbacks lead to reduced accuracy in complex or heterogeneous soil conditions and make it difficult to quantify classification probabilities [10,17]. Therefore, improving the reliability and automation of CPT-based soil classification is not only a methodological issue, but also a prerequisite for enhancing stratigraphic modelling, foundation design, and geohazard-related decision-making in complex geological settings.
With the rapid development of machine learning technologies, many researchers have integrated CPT data with machine learning algorithms to significantly improve the automation and accuracy of soil classification. These approaches overcome the limitations of traditional empirical methods in handling complex subsurface uncertainties and regional variability [32,33]. Several studies have employed algorithms such as artificial neural networks (ANN) and support vector machines (SVM) to achieve high-accuracy classification of fine-grained soils, sensitive soils, and organic soils, often exceeding 90% accuracy. These methods have also been extended to 3D subsurface modeling and liquefaction potential assessment [34,35,36,37,38]. Ensemble learning methods, such as Random Forest (RF), and gradient boosting techniques, including XGBoost, have also been widely applied to handle noise and nonlinear relationships in CPT data. These approaches demonstrate strong performance in multi-source data fusion, achieving classification accuracies above 95% in regions such as New Zealand and Turkey [39,40,41,42,43,44]. Furthermore, deep learning models—such as convolutional neural networks (CNN) and long short-term memory networks (LSTM)—have advanced end-to-end automated classification by directly extracting features from raw CPT signals. They have enabled precise identification of organic and sensitive soils, while techniques such as transfer learning and attention mechanisms have improved model generalization [45,46,47]. Semi-supervised clustering and Bayesian methods have also been applied by integrating CPT with borehole data, enhancing the robustness of stratigraphic interpretation and achieving high-accuracy SBT classification in regions such as Norway and Greece [48,49,50]. Although these machine-learning-based approaches have achieved substantial progress, they still face notable challenges, including dependence on labeled data, limited interpretability, and reduced generalization under regionally biased or noisy conditions [51]. In contrast, XGBoost offers several practical advantages for CPT-based soil classification. Its second-order optimization and regularized tree ensemble enhance both accuracy and robustness in heterogeneous soils, while its interpretable feature importance and well-calibrated probability outputs provide clearer geotechnical insights than typical deep-learning models. These characteristics make XGBoost a reliable and effective choice for constructing high-quality CPT soil classification models.
To capture the soil classification information embedded in CPT profiles and enhance the generalization capability of soil classification models, this study develops a multiclass soil classification models based on XGBoost with a sliding window approach using a dataset of 340 CPT soundings collected from Shanghai, China. This paper is structured as follows. Section 2 outlines the CPT dataset, preprocessing steps, and the sliding-window strategy for feature engineering. Section 3 introduces the proposed XGBoost-based multiclass classification framework. Section 4 presents the model evaluation results. Finally, Section 5 summarizes the key findings.
2. CPT-Based Data Preparation and Feature Engineering
2.1. Data Acquisition and Preprocessing
A total of 340 Cone Penetration Test (CPT) soundings were collected from geotechnical investigation reports in Shanghai, China, as shown in Figure 1. It can be seen that the CPT soundings were mainly collected from the construction sites (e.g., metro tunnel, deep excavation) in the urban area of Shanghai, such as the Xuhui, Huangpu, and Hongkou Districts. All CPT data were extracted using Getdata V2.24 software, with measurements recorded at intervals of 0.1 m. The soil profiles encompass nine major soil types, including fill, clay, silt, and sand. In this study, these are uniformly labeled as soil Type 1 to soil Type 9. Although some soil layers contain sub-layers, they are not differentiated in this study, with all soils being classified into the nine main types.
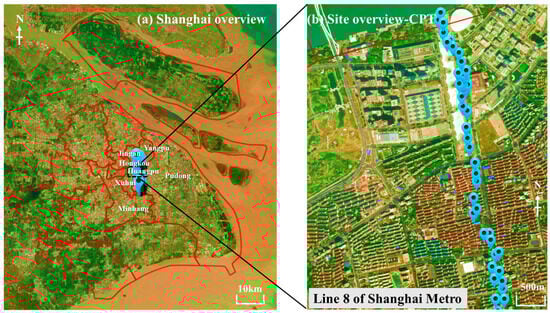
Figure 1.
Location map of the collected CPT soundings.
The CPT system used in Shanghai is of the single-bridge type, which provides only one parameter, the specific penetration resistance (ps). The limitation of having only ps values restricts the application of traditional soil classification charts, such as the Robertson chart. Moreover, using only depth and ps as input features provides limited information for machine learning methods, which may lead to inadequate characterization of CPT variations. To address this issue, a sliding window approach is proposed to extract more informative features from the CPT data.
2.2. Sliding Window Approach and Feature Extraction
To overcome the limitation of the low-dimensional single-bridge CPT data (i.e., only ps profile), the sliding window approach was employed as a feature engineering strategy to shift the modeling paradigm from “point-based prediction” to “local pattern recognition.” While conventional methods predict soil type based on the ps value at a single depth, the proposed approach utilizes the pattern of ps values within a 0.5 m depth interval to predict the soil type. This allows the model to leverage statistical characteristics of local ps trends rather than relying solely on individual point measurements. The window parameters include window size and step size. In this study, the window size is set as 0.5 m, which means it contains 5 consecutive data points. The 0.5 m window size was chosen primarily based on engineering judgment. In the context of the studied site, 0.5 m represents the approximate minimum thickness of identifiable soil layers. The step size is 0.2 m, which means the window moves by 2 data points each time. It was determined through a systematic trial-and-error approach aimed at optimizing model performance.
After applying the sliding window, multiple features are extracted from each window. These features are categorized into five groups as follows:
- (1)
- Raw ps features: These describe the basic statistical properties of the original ps values within each window. It mainly includes mean of raw ps values (ps_raw_mean); standard deviation of raw ps values (ps_raw_std); maximum ps value (ps_raw_max); minimum ps value (ps_raw_min); median ps value (ps_raw_median); range (max-min) of ps values (ps_raw_range); and coefficient of variation (ps_raw_cov).
- (2)
- Smooth ps features: This set comprises statistical metrics derived from the denoised ps signal, which is obtained using a Savitzky–Golay filter to elucidate the underlying trend. The polynomial order for the local least-squares fit was set to 2. The extracted features are mean of smoothed ps values (ps_smooth_mean); standard deviation of smoothed ps values (ps_smooth_std); and the range of smoothed ps values (ps_smooth_range).
- (3)
- Comparison features: This category encompasses metrics designed to quantify the discrepancies between the raw and smoothed ps sequences. The following features are extracted: smoothing effect on variability, defined as ps_raw_std minus ps_smooth_std (smooth_effect_std); smoothing effect on range, defined as ps_raw_range minus ps_smooth_range (smooth_effect_range); and the ratio of raw to smoothed mean (raw_smooth_ratio).
- (4)
- Difference features: To capture the local variation rate and trend instability of the ps profile, first-order differences are computed. The following statistical measures are then calculated from these differences: their mean (ps_diff_mean) and their standard deviation (ps_diff_std).
- (5)
- Depth features: These features provide essential contextual depth information for each window. This group includes the central depth of the window (depth_center) and the relative depth position, calculated as the depth_center divided by the total profile depth (depth_relative).
2.3. Characterization of Engineered Features
Table 1 provides a statistical analysis of CPT-specific penetration resistance ps for nine soil types identified in Shanghai. The soil profile in Shanghai, as classified from CPT data, generally follows a depositional sequence from soft near-surface layers to deeper, denser strata. The stratum classification follows Shanghai engineering codes, where soils are grouped into numbered types (Type 1, Type 2, etc.) based on similar engineering properties. Subclasses within each main soil type were merged to create composite categories, reflecting common engineering practice in Shanghai, where geotechnical engineers typically refer to these main types in preliminary design stages. It begins with Fill (Type 1), underlain by soft soils including Silty Clay and Muddy Silty Clay (Types 2, 3), and very soft Muddy Clay (Type 4). A transition occurs with Type 5, which comprises interbedded Clay, Silty Clay, and Sandy Silt. Deeper layers consist of Silty Clay (Type 6), followed by a notable shift to coarser Silt Sand and Fine Sand (Type 7). The profile continues with another Silty Clay layer (Type 8) and concludes with dense, deep Silt with Silty Sand (Type 9). It should be noted that the soil type names adopted in this study follow the conventional CPT-based classification practice used in Shanghai site investigations, where soil types are identified according to characteristic CPT response ranges and engineering judgment rather than explicit grain-size proportions. Overall, the ps increases with depth while the soil variability decreases, reflecting a progression from heterogeneous, soft sediments to more uniform and competent soils. The analysis mainly focuses on two key features: the mean ps value (in MPa) and the central depth of the sliding window (in meters), each described by its mean, coefficient of variation (COV), range, and median.

Table 1.
Statistics analysis of ps features for in Shanghai.
Type 1 (Fill) is characterized by a low mean ps of 1.984 MPa with high variability (COV = 1.039), reflecting its loose and heterogeneous nature at shallow depths (~1.45 m). Type 2 and Type 3, corresponding to Silty Clay and Sandy Silt, show moderate ps values (2.870 MPa and 0.739 MPa) with considerable variability (COV ~0.6–0.7) at depths of about 6.7 m and 5.7 m, respectively.
Type 4 (Muddy Clay) exhibits the lowest mean ps (0.683 MPa) and reduced variability (COV = 0.452) at around 13.4 m depth. Type 5, comprising interbedded Clay and Silty Clay, shows a slightly higher ps (1.461 MPa) but with high scatter (COV = 0.762) near 25.3 m depth. A noticeable shift occurs from Type 6 (Silty Clay) onward, where ps increases significantly and variability drops—Type 6 has a mean ps of 2.756 MPa with low COV (0.281) at ~29.5 m.
Type 7 (Silt Sand/Fine Sand) displays a sharp rise in ps to 14.243 MPa with moderate variability (COV = 0.428) at ~38 m depth. Type 8 (Silty Clay) shows a moderate ps of 3.153 MPa but very low depth variability (COV = 0.140) around 52 m. Finally, Type 9 (Silt with Silty Sand) presents the highest mean ps (19.500 MPa) and the greatest depth (~74.6 m), with both ps and depth showing low variability (COV ~0.4 and 0.075), indicating a deep, dense, and uniform stratum.
In summary, the profile evolves from highly variable, soft superficial soils to deeper, more consistent, and stiffer layers, with ps generally increasing and COV decreasing with depth, consistent with the geological stratification of Shanghai’s deposits.
Figure 2 compares six key features—ps mean, minimum, maximum, standard deviation, median, and depth center—across nine soil types. Overall, the distributions show a clear mechanical and stratigraphic gradient among the soil categories. Soil Types 1~3 generally exhibit low to moderate strength values, with relatively wide dispersion, indicating heterogeneous but comparatively weak materials. Soil Types 4 and 5 present the lowest strength levels across all metrics and limited variability, suggesting uniform soft soils. In contrast, Soil Types 6~9 display substantially higher strength characteristics, with Types 7 and 9 reaching the highest ranges in both central tendency and extrema. These stronger soils also occur at greater depths, as reflected by the depth-center patterns, which increase progressively from Type 1 to Type 9. Together, the six features consistently differentiate the upper, weaker soils from the deeper, stronger units, highlighting a coherent transition in mechanical behavior across the nine soil types. The wide and overlapping depth ranges of different soil types indicate strong stratigraphic undulation among the CPT soundings, highlighting the necessity of incorporating depth-related features to account for variations in layer thickness and topographical conditions.
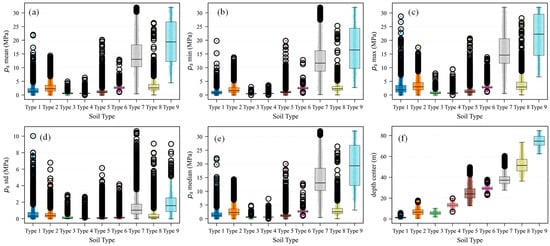
Figure 2.
The comparison of key features for different soil types: (a) ps mean; (b) ps min; (c) ps max; (d) ps std; (e) ps median; (f) depth center.
3. Methodology
3.1. Proposed Framework Based on the XGboost Model
The proposed framework consists of three main stages, as illustrated in Figure 3. Step 1 involves data acquisition and preprocessing, where site investigation reports are collected and relevant information—such as soil classification records and cone penetration test (CPT) data—is extracted and standardized. This step ensures that all raw engineering data are converted into a consistent and structured format suitable for subsequent analysis.
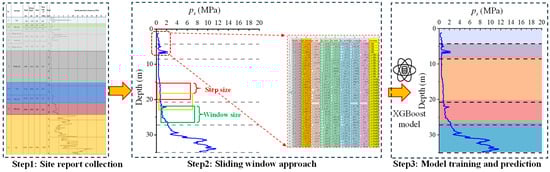
Figure 3.
Proposed framework of soil classification.
Step 2 implements the proposed sliding-window approach for feature extraction. A fixed-size window is applied to the CPT profiles and systematically moved from the ground surface downward along depth using a predefined step size. For each window position (e.g., the red, yellow and green box in figure), statistical descriptors of the CPT resistance—such as mean, median, minimum, maximum, and standard deviation—are computed. As the window slides through the full depth of the sounding, these statistics are aggregated to form a comprehensive feature matrix, as exemplified by the tabulated data in the figure. This procedure enables the conversion of continuous CPT measurements into depth-resolved feature sets that capture local soil behavior.
Finally, Step 3 comprises model training and prediction, in which the extracted feature matrix is used as input to train an XGBoost classifier for soil-type identification. After model calibration and validation, the trained model is applied to new CPT profiles to predict soil stratigraphy along depth. This step yields continuous soil-type predictions that align with the physical stratigraphic structure of the subsurface and can support geotechnical interpretation and engineering design.
3.2. XGBoost-Based Multiclass Classification Model
XGBoost (Extreme Gradient Boosting) is a scalable and regularized gradient boosting framework widely used for structured data classification problems. In this study, XGBoost is adopted to construct a multiclass soil classification model based on CPT measurements. As shown in Figure 4, the algorithm optimizes an ensemble of decision trees by iteratively minimizing a differentiable loss function using second-order gradient information, thereby allowing for accurate modeling of nonlinear soil behavior patterns.
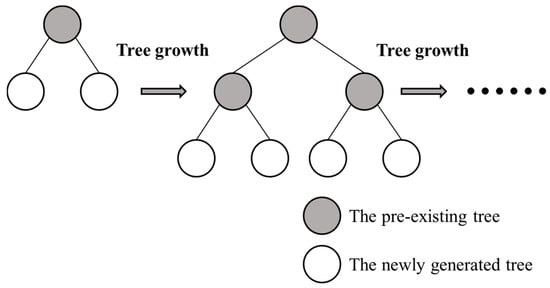
Figure 4.
XGBoost architecture.
3.2.1. Model Principle and Optimization Objective
For a dataset containing n samples and K soil classes, XGBoost models the output as the sum of T regression trees:
where is the space of regression trees.
The objective function for multiclass classification consists of the loss term and a regularization term:
where l(·) is the softmax cross-entropy loss, and Ω(ft) regularizes tree complexity:
Here, T is the number of trees, J is the number of leaves and wj is the weight of leaf j.
The regularization term improves generalization, preventing overfitting—an important consideration for CPT-based soil classification, where layer transitions may produce noisy patterns.
3.2.2. Multiclass Softmax Loss and Second-Order Approximation
XGBoost optimizes the softmax-based multinomial logistic loss:
For efficient optimization, XGBoost uses a second-order Taylor expansion:
where is the first derivative, is the second derivative. This second-order optimization leads to more stable and accurate updates than traditional first-order boosting methods.
3.2.3. Tree Structure, Gain, and Leaf Weight Calculation
Each tree is grown by selecting splits that maximize the gain:
where G and H are summed first- and second-order gradients for the left and right child nodes. A split occurs only if the gain is positive, thus controlling tree complexity.
Leaf weights are computed analytically:
This closed-form solution provides an efficient update rule and contributes to XGBoost’s computational speed.
3.2.4. Model Parameters
To avoid information leakage and ensure a reliable evaluation of model generalization, a grouped data-splitting strategy at the CPT sounding level was adopted. The dataset comprises 340 CPT soundings collected from 26 different sites. Each CPT sounding was treated as an independent sample, with all engineered features encapsulated within the same sounding.
The CPT soundings were randomly divided into training and testing sets at a ratio of 70% to 30%. Importantly, all data derived from a given CPT sounding were assigned exclusively to either the training set or the testing set, ensuring that no information from the same sounding was shared across datasets. The splitting process was further constrained to maintain comparable proportions of sites and soil types in both sets. This protocol guarantees a leakage-safe evaluation and reflects the realistic scenario of applying the trained model to unseen CPT soundings.
Regularization plays a key role in stabilizing predictions in geotechnical applications. Previous studies on XGBoost-based classification have shown that parameters such as max_depth, learning_rate, subsample, colsample_bytree, and regularization terms typically fall within moderate ranges to balance model expressiveness and generalization [52,53,54,55,56]. Based on these recommendations, reasonable parameter intervals were first identified. Within these intervals, a trial-and-error tuning process was performed using the mean Average Precision (mAP) as the primary evaluation metric. The final parameter configuration was selected as it consistently yielded the highest mAP on the validation dataset.
In this study, reg_alpha = 0.2 introduces L1 sparsity, encouraging simpler trees; reg_lambda = 0.2 applies L2 shrinkage, smoothing leaf weights; max_depth = 10 allows the model to capture complex nonlinear soil behavior while preventing overly deep trees; and subsample = 0.8 with colsample_bytree = 0.8 reduce variance by introducing randomness.
These configurations balance model expressiveness with generalization ability, which is crucial for CPT data where measurement noise and transitional strata may otherwise degrade model robustness.
The model uses learning_rate = 0.05 with 500 trees, which is a small learning rate that ensures conservative updates and prevents overfitting. A larger number of estimators allows the ensemble to gradually learn complex soil stratigraphy patterns. This combination is especially effective for heterogeneous CPT datasets containing gradual soil transitions.
The model is configured with n_jobs = −1 to utilize all CPU cores, allowing efficient training on large-scale CPT datasets. The deterministic random_state = 42 ensures reproducibility.
The XGBoost multiclass framework integrates second-order optimization, regularized tree structures, softmax-based multiclass probability modeling, and variance-reduction strategies, making it highly suitable for CPT-based soil classification. Its ability to capture nonlinear patterns while maintaining strong generalization ensures accurate identification of soil behavior types across diverse subsurface conditions.
3.3. Performance Evaluation Metrics
To quantitatively assess the performance of the proposed XGBoost-based multiclass soil classification model, several commonly used classification metrics are adopted, including Loss function, Accuracy, Precision, Recall, F1-score, and mean Average Precision (mAP). In addition, a depthwise evaluation metric termed Accuracy Coverage Rate (ACR) is introduced to characterize the continuity and reliability of soil classification along individual CPT soundings. These metrics jointly provide a comprehensive evaluation of both pointwise classification accuracy and depthwise stratigraphic consistency.
It should be noted that the soil-type distribution in this study is inherently imbalanced, reflecting realistic geological conditions rather than curated datasets. Instead of applying explicit resampling or synthetic data generation, this study adopts a metric-driven and model-based strategy to address imbalance. Class-wise Precision, Recall, F1-score, AP, and P-R curves are used to explicitly evaluate minority-class performance, while the regularized tree-ensemble structure of XGBoost mitigates majority-class dominance during training. This design ensures that the classification results remain both statistically robust and geologically representative.
To address the pronounced class imbalance inherent in the CPT dataset, we adopted Random Oversampling—a straightforward yet effective resampling technique that randomly duplicates instances from minority classes until a balanced class distribution is achieved within the training set. This approach was applied exclusively during the training phase to avoid any distortion of the true, naturally imbalanced distribution in the test set, thereby ensuring that the model evaluation reflects realistic field conditions. The implementation was carried out using the RandomOverSampler from the imbalanced-learn library, with the sampling strategy set to “auto” so that all minority classes were resampled to match the size of the majority class. This intervention led to marked improvements in model performance, particularly for minority classes.
3.3.1. Loss Function
The loss function quantifies the discrepancy between the predicted and true soil labels and serves as the primary optimization target of the model. For a multiclass classification problem with K soil categories, the loss is defined by the cross-entropy expression:
where yik is the true class indicator and pik is the predicted probability for class k. A lower loss reflects stronger agreement between predictions and ground truth.
3.3.2. Accuracy
Accuracy measures the overall proportion of correctly classified samples among all predictions and is defined as
where TP, TN, FP, and FN denote true positives, true negatives, false positives, and false negatives, respectively. Accuracy reflects the global correctness of the classification model but may be influenced by class imbalance, which is common in CPT-based soil datasets. For the multiclass classification problem considered in this study, Accuracy is computed in a micro-averaged manner, i.e., as the ratio of correctly classified samples to the total number of samples across all classes. In this case, true negatives are implicitly included as samples that are neither predicted nor labeled as the target class, and Accuracy can be equivalently interpreted as overall classification correctness.
3.3.3. Precision, Recall, and F1-Score
To evaluate the classification performance for individual soil categories, Precision and Recall are employed. Precision quantifies the proportion of correctly predicted samples among all samples assigned to a given class:
Recall represents the proportion of correctly identified samples among all true samples of a given class:
The F1-score, defined as the harmonic mean of Precision and Recall, provides a balanced measure of classification performance:
These metrics are particularly relevant for multiclass soil classification, where misclassification of specific soil types—especially weak or transitional layers—may have significant engineering implications.
3.3.4. Mean Average Precision (mAP)
Mean Average Precision (mAP) evaluates the ranking quality of probabilistic predictions across all soil categories. For a multiclass classification problem with K classes, mAP is defined as:
where APk is the area under the Precision–Recall curve for class k. Unlike Accuracy or F1-score, mAP considers the full range of decision thresholds and assesses the quality of probability-based discrimination. This characteristic is particularly suitable for CPT-based soil classification, where transitions between soil layers are often gradual rather than abrupt.
3.3.5. Accuracy Coverage Rate (ACR)
To further quantify the model’s prediction reliability along the depth profile of each CPT sounding, a metric termed Accuracy Coverage Rate (ACR) was introduced. For a given CPT containing K soil layers, the ACR is defined as
where nk is the number of data points belonging to the k-th soil type, is the predicted label, and is the indicator function that equals 1 for correct predictions and 0 otherwise. Accordingly, the ACR quantifies the degree of agreement between the model predictions and the true stratigraphic units along a given CPT sounding, reflecting how well the inferred soil types match the actual subsurface layering. Unlike global accuracy metrics, ACR captures local prediction continuity, making it suitable for evaluating how well the model preserves stratigraphic consistency.
A schematic example is shown in Figure 5, where the specific penetration resistance ps is plotted against depth along with the predicted correctness. The black segments denote depths where the soil type is correctly classified, whereas red segments indicate misclassification. And each type of soil’s actual label corresponds to a specific color. The different ranges of penetration resistance observed in Figure 5 reflect the strong heterogeneity of subsurface stratigraphy, where sand-dominated layers may locally intrude into fine-grained deposits, resulting in large variations in CPT resistance. In this example, correct predictions dominate across all major layers, and most misclassifications occur near inter-layer transitions, where CPT responses typically exhibit gradual changes or mixed soil behavior. This observation is consistent with both geological expectations and the model’s confusion patterns described previously.
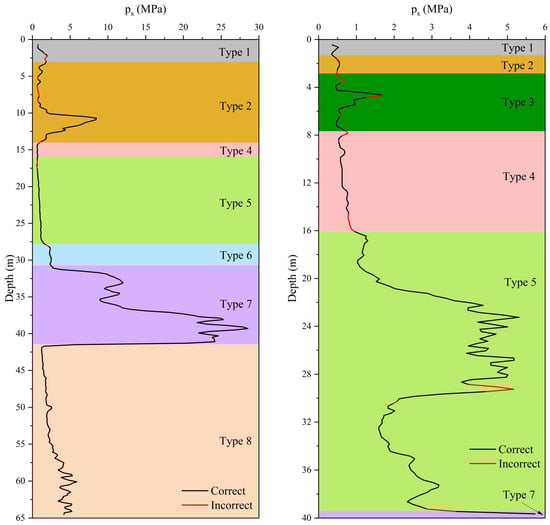
Figure 5.
Schematic diagram of prediction accuracy coverage rate. Note that the x-axis ranges differ between the two CPT soundings due to variations in soil composition and penetration resistance levels.
4. Analysis of Results
4.1. Model Evaluation
After 500 training iterations, all evaluation metrics for the XGBoost-based soil classification model converged to stable values, indicating that the model successfully reached an optimal learning state without further oscillation or divergence. As shown in Figure 6, the training and testing curves consistently demonstrate smooth convergence trends across all metrics, confirming the robustness and reliability of the proposed soil classification model.
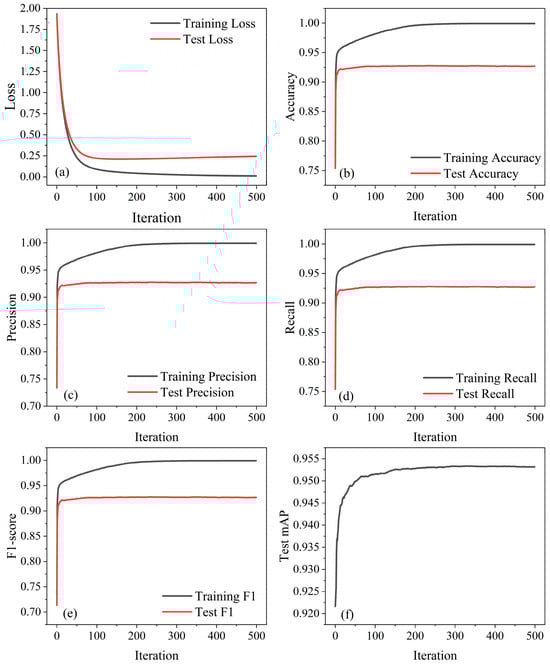
Figure 6.
Convergence curves of the XGBoost soil classification model during 500 training iterations: (a) Loss; (b) Accuracy; (c) Precision; (d) Recall; (e) F1; (f) Test mAP.
In Figure 6a, the training loss decreases rapidly during the first 50 iterations and gradually converges to approximately 0.011, indicating efficient feature learning from the CPT data. The test loss decreases similarly but stabilizes at 0.244, a slightly higher value, which is expected due to generalization constraints. The small and stable gap between training and testing loss suggests that the model does not suffer from significant overfitting. For the CPT soil classification task, the converged loss demonstrates that the XGBoost-based model is capable of extracting the nonlinear relationships between tip resistance, sleeve friction, pore pressure, and soil behavior type in a numerically stable manner.
Figure 6b shows that training accuracy increases rapidly and approaches 1.0, while test accuracy stabilizes around 0.926. This indicates that the model captures most of the discriminative patterns in the CPT dataset. In soil classification, accuracy reflects the overall predictive reliability of the model in predicting soil behavior type (SBT). The high accuracy level verifies that the XGBoost-based model effectively distinguishes between sands, silts, and clays across varying CPT profiles.
As shown in Figure 6c, precision for both training and testing sets increases during the early iterations and stabilizes at approximately 0.926 for the testing set. A high precision indicates that the model produces few false-positive predictions. In the context of CPT-based soil classification, this means that when the model predicts a certain soil type (e.g., sand), there is a high likelihood that the classification is correct. This characteristic is particularly important in geotechnical engineering, where misclassifying weaker soils as stronger ones (e.g., soft clay misclassified as silt) may lead to unsafe design decisions.
The curves in Figure 6d show recall steadily increasing and converging around 0.926 for the test dataset. High recall indicates that the model is effective at minimizing false negatives. For CPT soil interpretation, this is crucial for ensuring that special soils such as sensitive clays or organic layers are not overlooked, as under-identification of weak layers may compromise excavation stability and foundation safety.
Figure 6e illustrates that the training F1-score approaches 1.0, while the test F1-score stabilizes around 0.926, consistent with the trends of precision and recall. In CPT-based soil classification, the F1-score is an effective indicator of model robustness across imbalanced soil categories and confirms the model’s stable performance across different soil behavior types.
As shown in Figure 6f, the mAP increases rapidly and stabilizes around 0.954 after 150 iterations. A high mAP indicates that the model performs well in probability-based discrimination, not just hard classification. This is particularly valuable in CPT interpretation, where soil behavior transitions are often gradual rather than discrete. A high mAP demonstrates that the model can accurately reflect the probabilistic nature of soil mixing zones and transition layers.
4.2. Metrics for 9 Soil Categories
4.2.1. Result of Confusion Matrix
The confusion matrix of the XGBoost-based soil classification model for the nine soil categories is presented in Figure 7. Overall, the model exhibits strong diagonal concentration, indicating a high level of correct identification across all soil categories. The row-normalized confusion matrix allows for clear comparison despite the large imbalance in sample counts among soil types, which range from 333 samples for Soil 9 to 8005 samples for Soil 5. The high values along the diagonal (0.800–0.970) demonstrate that the model effectively captures the distinct CPT signatures associated with different soil behaviors.
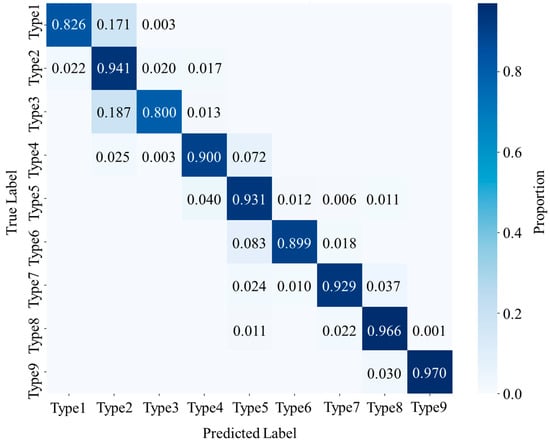
Figure 7.
Confusion matrix for the nine soil categories.
Soils 2, 5, 7, 8, and 9 exhibit the highest class-wise accuracy, with diagonal values ranging from 0.929 to 0.970. These soil types often show clear contrasts in CPT parameters—particularly ps—resulting in well-separated feature distributions. For instance, sandy and silty-sand layers (Soils 7 and 9) typically exhibit higher resistance and lower friction ratios, which the model learns effectively. Clay-rich mixtures (Soils 2, 5, and 8) also demonstrate stable CPT responses that enhance model discriminability. The confusion between Type 2 and Type 3 reflects the natural overlap of depositional facies and CPT response domains. The relatively low off-diagonal values indicate that these categories are rarely confused with others, confirming the robustness of the model in identifying both coarse-grained and fine-grained transition soils.
Soils 4 and 6 show strong classification performance with diagonal accuracies of 0.900 and 0.899, respectively. These soils share similar clay-dominant compositions and CPT behavior, which explains the moderate misclassification observed between them. The gradual transition between muddy clay and silty clay layers in natural deposits also leads to overlapping CPT signatures, especially in terms of pore pressure response and friction ratio. These patterns are consistent with the expected geological conditions and demonstrate that the remaining misclassification mostly occurs within geotechnically reasonable soil boundaries.
Soil 1 exhibits a diagonal accuracy of 0.826, which is lower than that of most other categories. Fill materials typically consist of highly heterogeneous mixtures with variable origins, resulting in inconsistent CPT resistance and friction signals. The matrix shows notable misclassification into Soil 2 (0.171), suggesting that portions of the fill share similar mechanical responses to silty-clay or sandy-silt deposits. This behavior is expected, as engineered fill or reclaimed materials may partially mimic natural soft soil properties depending on compaction and composition.
Soil 3 displays the lowest diagonal accuracy among all categories, which is 0.800. The confusion primarily occurs with Soil 2, which is geotechnically reasonable given its similar fine-grained composition and close CPT parameter ranges. Muddy silty clay often represents transitional facies between pure clay and silt, leading to CPT readings that overlap with silty clay or sandy silt layers. The relatively small sample size, which includes 386 samples, further limits the model’s ability to learn distinct patterns. Nevertheless, the majority of predictions still fall within adjacent soil categories, suggesting no severe classification error.
The confusion matrix demonstrates that the XGBoost-based soil classification model achieves strong and geotechnically meaningful classification performance across nine soil categories. Misclassification mainly occurs between neighboring fine-grained soils with overlapping CPT signatures. This pattern confirms that the model successfully captures the intrinsic nonlinear relationships in CPT data and provides reliable soil behavior type predictions for engineering applications.
4.2.2. Result of Precision–Recall Curves and Average Precision
The Precision–Recall (P-R) curves and Average Precision (AP) values for the nine soil categories are shown in Figure 8. The model achieves an overall mean Average Precision (mAP) of 0.954, indicating consistently strong discriminative performance across all soil types. The AP values range from 0.844 (Type 3) to 1.000 (Type 9), reflecting both the inherent separability of individual soil categories in the CPT feature space and the influence of sample size and soil heterogeneity.
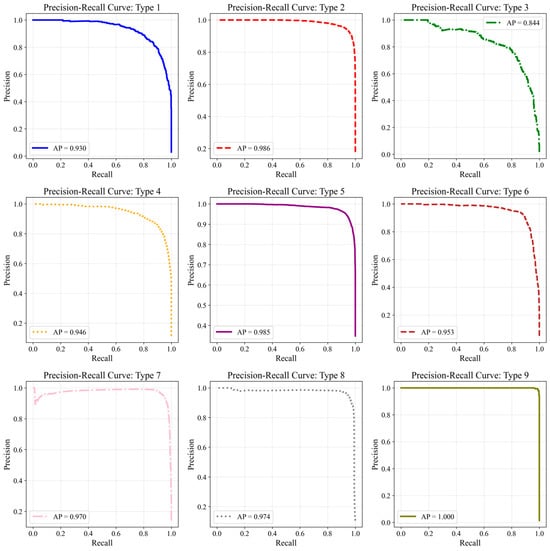
Figure 8.
P-R curves for the nine soil categories.
Soils with distinctive CPT signatures, such as Type 2, 5, 7, 8, and 9, exhibit P-R curves that remain close to the upper-right region of the P-R space, indicating high precision across the full recall spectrum. These soils typically show clear behavioral contrasts in cone tip resistance (qt), specific penetration resistance (ps), sleeve friction (fs), and friction ratio (Fr), enabling the model to differentiate them effectively across a wide range of thresholds. For example, Type 9 displays the highest AP, approaching unity, consistent with the high resistance and low friction ratio typical of sandy soils, which produces well-separated feature clusters. Similarly, Types 2, 5, and 8 benefit from large sample sizes and stable CPT response patterns, leading to smooth P-R curves and minimal degradation at high recall.
Fine-grained cohesive soils such as Type 4 and 6 show slightly lower but still strong AP values. Their P-R curves remain high until very large recall values, where precision gradually declines. This is consistent with the natural similarity between clay-dominated units, where overlapping CPT behavior—such as high pore pressure response and moderate friction ratio—makes boundary classification inherently more challenging. Nonetheless, the AP values close to 0.950 indicate that the model reliably identifies these soils while maintaining low false-positive rates.
In contrast, transitional or highly heterogeneous soils exhibit lower AP values. Type 1 shows reduced precision at high recall levels due to the variable composition and depositional conditions typical of fill materials, which produce inconsistent CPT signatures. Type 3 yields the lowest AP, reflecting its intermediate nature between silt and clay as well as its small sample size. The P-R curve for Type 3 drops more sharply with increasing recall, indicating increased false positives when attempting to retrieve all true samples. This pattern aligns with its observed confusion with Type 2 in the confusion matrix, further suggesting that their CPT parameter ranges partially overlap.
Overall, the P-R curves and AP results demonstrate that the XGBoost-based classifier effectively captures the nonlinear relationships between CPT measurements and soil behavior types. Soil classes characterized by distinct mechanical responses or abundant training data achieve near-optimal P-R performance, whereas transitional soils show moderate degradation consistent with their geological variability. The high mAP value confirms that the model performs reliably across diverse soil conditions, supporting its applicability to multiclass CPT-based soil classification in geotechnical investigation.
4.2.3. Result of Precision, Recall and F1-Score
The Precision, Recall, and F1-score for the nine soil types are presented in Figure 9, providing a detailed assessment of the XGBoost-based model’s performance for each soil category. The results demonstrate consistently high classification quality across most soil categories, with F1-scores ranging from 0.786 to 0.983, in line with the previously reported mAP and confusion matrix results.
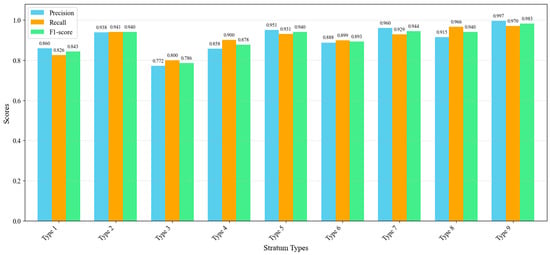
Figure 9.
Precision, Recall and F1-score for the nine soil categories.
Soils with clear mechanical signatures and abundant samples, including Types 2, 5, 7, 8, and 9, exhibit the strongest performance, with all three metrics exceeding 0.910. These soil types typically display well-defined CPT responses, enabling the model to distinguish them with both high precision and high recall, which is reflected in their near-perfect F1-scores.
Moderately cohesive soils, including Types 4 and 6, also achieve robust performance, with F1-scores ranging from approximately 0.878 to 0.893. Their slightly lower precision and recall are consistent with the natural overlap in CPT characteristics among fine-grained clay-dominant soils, where pore-water pressure response and friction ratio transitions tend to blur boundaries between adjacent categories.
In contrast, more heterogeneous or transitional soils show comparatively reduced performance. Type 1 records an F1-score of 0.843, reflecting the inherently irregular composition of fill materials and their variable CPT signatures. Type 3 has the lowest F1-score of 0.786, primarily due to a reduced recall value of 0.800, which is consistent with its observed misclassification into Type 2 in the confusion matrix and the dispersed prediction probabilities noted earlier. This soil type naturally lies between clay and silt facies, resulting in partial overlap of mechanical responses.
Despite these variations, the results indicate that the model achieves reliable performance across all soil categories, with particularly strong capability for distinguishing sand–silt mixtures and cohesive–cohesionless transitions. The class-wise metrics affirm that the XGBoost-based classifier effectively captures both the magnitude and variability of CPT responses across diverse stratigraphic conditions, providing robust support for practical soil profiling applications.
4.2.4. Result of Prediction Probabilities
The prediction probability distributions for the nine soil categories are shown in Figure 10. These histograms represent the confidence levels of the XGBoost-based classifier when predicting the true soil labels. Overall, the distributions exhibit a clear right-skewed distribution pattern, with a dominant peak near a probability of 1.0 for most soil categories, reflecting the model’s strong confidence and discriminative power. This behavior is consistent with the high mAP value (0.954) and the steep, well-separated precision–recall curves observed in previous analyses.
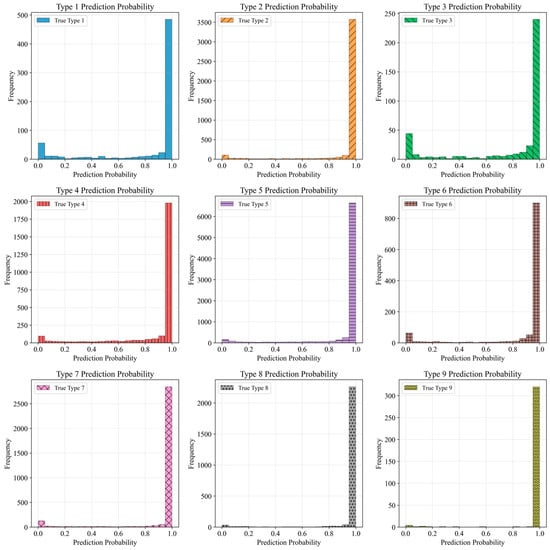
Figure 10.
Prediction probabilities for the nine soil categories.
Soils with distinctive CPT signatures, particularly Types 5, 2, 7, 8, and 9, show highly concentrated probability mass near 0.9~1.0. These soils also correspond to the highest AP values. The alignment between high AP and sharply peaked probability distributions demonstrates that the model not only predicts these soil types correctly but does so with consistently high confidence. Such stability is expected for soils exhibiting clear mechanical contrasts in cone resistance, sleeve friction, and friction ratio, yielding well-separated feature clusters within the CPT dataset.
Cohesive soils, such as Types of 4 and 6, also show strong right-skewed distributions, with most samples predicted at probabilities above 0.850. These findings correspond to their high AP values and support the observation that XGBoost effectively captures fine-grained cohesive soil behavior despite partial overlap in CPT response among clay-rich units. The presence of a small proportion of mid-range probabilities (0.4~0.7) is consistent with the moderate cross-class confusion observed in the confusion matrix, particularly between Types 4 and 6.
In contrast, Types 1 and 3 show more dispersed probability distributions. Type 1 exhibits a broader spread from 0.1 to 1.0, with a less pronounced peak, reflecting the heterogeneous composition of fill material and its variable CPT response. Type 3 shows an even more pronounced long-tail distribution, with many samples receiving intermediate confidence scores. These distributions align with their lower AP values and with the confusion matrix results, where Type 3 in particular shows misclassification into Type 2. The probability dispersion therefore reflects underlying geotechnical ambiguity: transitional fines with mixed clay–silt characteristics naturally produce CPT signatures that are less distinct and therefore more difficult for the model to classify with high certainty.
The prediction probability analysis provides further evidence of the XGBoost-based model’s strong performance and coherent probabilistic behavior. Soil categories with clear CPT signatures produce sharply peaked high-confidence predictions, while transitional or heterogeneous categories yield more diffuse probability distributions, reflecting their inherent geological variability. The consistency between probability patterns, AP values, P-R curves, and confusion matrix results confirms that the model’s confidence scores are meaningful and aligned with true soil behavior, supporting its reliability for CPT-based multiclass soil classification.
4.3. Result of Accuracy Coverage Rate (ACR)
For all 340 CPT soundings used in this study, the ACR was computed individually, and the resulting distribution is presented in Figure 11. The ACR values exhibit a strong concentration between 0.890 and 0.960, with a sample mean of 0.924, median of 0.930, and a small standard deviation of 0.042. The coefficient of variation equals 0.0454, further indicating that prediction continuity with depth is remarkably consistent across different sites. These results reflect that the XGBoost-based classifier not only performs well in terms of global accuracy metrics such as accuracy, F1-score, and mAP, but also maintains stable performance across entire depth profiles in individual CPT soundings.
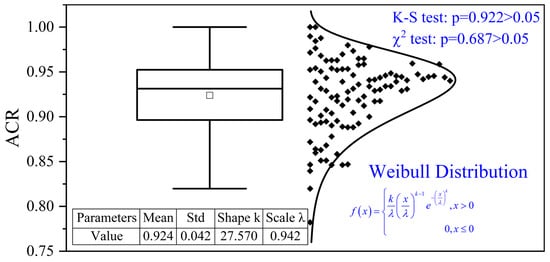
Figure 11.
ACR distribution for all CPTs.
To characterize the statistical distribution of ACR, a Weibull probability model was fitted to the 340 ACR values. The fitted parameters include a shape parameter k = 27.570 and a scale parameter λ = 0.942. Both the Kolmogorov–Smirnov test and chi-square test fail to reject the null hypothesis that ACR follows a Weibull distribution, confirming the adequacy of this probabilistic representation. The narrow confidence intervals further support the stability of the fitted distribution.
From an engineering perspective, the ACR distribution provides two important implications. First, the consistently high ACR values across 340 CPTs demonstrate that the classifier retains strong vertical coherence along soundings, which is critical for applications such as stratigraphic profiling, layer boundary detection, and sedimentary facies mapping. High ACR ensures that predicted soil layers maintain geologically reasonable continuity, reducing the likelihood of spurious thin-layer fluctuations induced by model noise. Second, the Weibull characterization allows ACR to be incorporated into probabilistic geotechnical workflows, enabling engineers to assess the expected reliability of data-driven soil classification at new or untested sites. For instance, the fitted mean 0.924 indicates that, on average, over 92% of the depth points in a CPT sounding are correctly classified; meanwhile, the heavy right tail implies that in favorable soil conditions, ACR can exceed 0.960.
From a theoretical perspective, the Weibull distribution provides a meaningful probabilistic representation for the ACR metric. ACR is a bounded reliability-like indicator that reflects the cumulative agreement between predicted and interpreted soil types along a CPT sounding. Each depthwise classification outcome is influenced by local geological heterogeneity, transitional soil behavior, and measurement uncertainty. The aggregation of these numerous local effects leads to a distribution characterized by a strong central tendency and mild skewness, features that are well captured by the Weibull family.
Weibull distributions are widely adopted in geotechnical engineering to describe strength variability, reliability indices, and performance measures governed by heterogeneous materials and constrained domains. In this context, modeling ACR using a Weibull distribution is not only statistically justified by goodness-of-fit tests, but also conceptually consistent with its interpretation as a stratigraphic reliability indicator. This probabilistic formulation enables quantitative comparison of CPT-based classification consistency across soundings and provides a foundation for uncertainty-aware stratigraphic modeling and engineering decision-making.
4.4. Feature Importance
Figure 12 presents the feature importance scores derived from the XGBoost model for the CPT-based soil classification task. The ranking reveals that both depth-related variables and statistical descriptors of specific penetration resistance ps play essential and mutually complementary roles in determining soil behavior types.
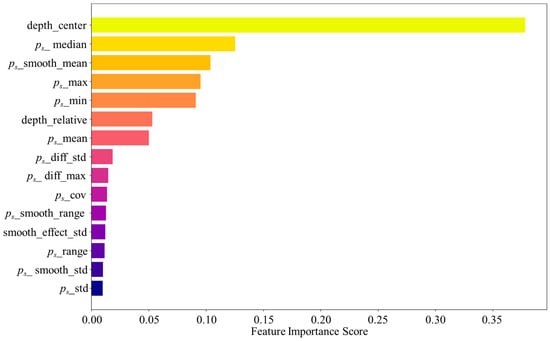
Figure 12.
Feature importance scores for 15 features in XGBoost-based soil classification.
The most influential parameter is depth_center, followed by ps_smooth_mean, ps_max, ps_min, and ps_median. This pattern highlights two key mechanisms in the model’s decision process. First, the strong contribution of depth_center reflects the stratigraphic regularity of natural soil deposits, where soil types commonly follow consistent vertical sequences. Incorporating depth information enables the model to capture these geological trends and reduces ambiguity among soil types with similar CPT signatures but occurring at distinct depths. Second, the dominant ps-based features—particularly the smoothed mean and extreme values—indicate that the classification relies heavily on the magnitude and local variability of cone resistance, which are strongly correlated with soil stiffness [57,58], density [59,60], and undrained shear strength [61,62], which will have a significant effect on the geo-structures [63,64]. The use of smoothed statistics (e.g., ps _smooth_mean, ps_smooth_range) suggests that the model benefits from eliminating small-scale fluctuations to better represent the underlying soil fabric.
Lower-ranked features such as ps_diff_max, ps_diff_std, and ps_cov contribute incremental value by capturing localized transitions and micro-variability within the CPT signal. Although their importance is smaller, these descriptors help distinguish transitional soils (e.g., muddy silty clay or mixed silt–clay layers), consistent with the P-R curve behavior and confusion matrix analysis. The relatively low importance of ps_std and ps_smooth_std suggests that broad-scale variability is less informative than local contrasts and representative central tendencies.
From an engineering perspective, the feature importance results corroborate established CPT interpretation principles. Depth information reflects depositional environments and expected stratigraphic ordering, while key ps statistics directly relate to soil compressibility and strength. The fact that these features dominate the model’s decision-making enhances the interpretability and credibility of the data-driven approach. Furthermore, the insight that smoothed resistance values are more influential than raw variability implies that noise reduction and representative trend extraction are critical for reliable machine-learning-based soil classification. These findings provide practical guidance for future model development and demonstrate that XGBoost effectively captures both geomechanical behavior and geological structure in CPT-based classification tasks.
5. Conclusions
This study proposes an XGBoost-based multiclass soil classification framework for CPT data using a sliding-window feature engineering approach. Based on the results obtained, the main conclusions are summarized as follows:
- A CPT database was collected, containing 340 CPT soundings (depth and specific penetration resistance) collected from 26 sites in Shanghai. The sliding-window approach effectively transforms pointwise CPT measurements into local pattern descriptors, enabling the model to capture depth-wise mechanical trends and improving the distinguishability among nine soil categories. The engineered features provide a richer representation of specific penetration resistance than raw CPT signals.
- The XGBoost classifier demonstrates strong and stable performance, achieving an overall classification accuracy of approximately 92.6%, an average F1-score exceeding 0.905, and a mean Average Precision (mAP) of 0.954. Sandy and silty-sand units exhibit near-perfect recognition, with class-wise precision and recall values close to unity, while transitional clay–silt soils show moderate but geologically consistent classification performance. In addition, the proposed Accuracy Coverage Rate (ACR) provides a meaningful metric for evaluating depthwise prediction consistency, with an average ACR of 0.924 across 340 CPT soundings, indicating reliable stratigraphic continuity in model predictions.
- Feature importance analysis reveals that depth-related attributes and smoothed ps statistics dominate the prediction process, reflecting stratigraphic ordering and soil stiffness trends. The integrated framework captures intrinsic nonlinear CPT–soil relationships while preserving geological continuity, demonstrating its applicability for practical subsurface profiling in geotechnical engineering projects.
The methodological framework presented in this study is specifically scoped for scenarios where geotechnical investigation is constrained by limited data sources, particularly when only single-bridge CPT data is available. Additionally, since all data are sourced from Shanghai, the currently trained model may be more applicable to soil classification in Shanghai. The methodological framework is general and can be applied to other regions given sufficient local training data. From an engineering perspective, the proposed framework provides a practical tool for supporting stratigraphic modeling, foundation design, and geohazard assessment. Future work may focus on integrating the proposed model into three-dimensional geological modeling platforms and developing uncertainty-aware CPT interpretation systems to support risk-informed geotechnical engineering practice.
Author Contributions
Conceptualization: J.Z. and H.H.; methodology: J.Z. and F.W.; resources: H.H. and D.Z.; result analysis: J.N. and J.Z.; writing—original draft preparation, J.Z., J.N. and F.W.; writing—review and editing, F.W. and D.Z. All authors have read and agreed to the published version of the manuscript.
Funding
The authors received financial support for this work from the Chongqing Key Laboratory of Geomechanics and Geoenvironment Protection (LQ22KFJJ10), and the National Natural Science Foundation of China (Nos. 52130805 and 52408434), Shanghai Pujiang Program (2022PJD077), the Fund of Key Laboratory of New Technology for Construction of Cities in Mountain Area, Ministry of Education (LNTCCMA-20240110).
Institutional Review Board Statement
Not applicable.
Informed Consent Statement
Not applicable.
Data Availability Statement
This study comes from a confidential project and data cannot be disclosed due to privacy concerns.
Acknowledgments
This publication was financially supported by Army Logistics Academy of PLA, National Natural Science Foundation of China and Fund of Key Laboratory of New Technology for Construction of Cities in Mountain Area, Minis-try of Education. We would like to express our gratitude to Wenfei Qian for providing essential data resources.
Conflicts of Interest
The authors declare no conflicts of interest.
References
- Zhang, J.; Huang, H.; Zhang, D.; Phoon, K.; Liu, Z.; Tang, C. Quantitative evaluation of geological uncertainty and its influence on tunnel structural performance using improved coupled Markov chain. Acta Geotech. 2025, 16, 3709–3724. [Google Scholar] [CrossRef]
- Zhao, C.; Gong, W.; Juang, C.; Tang, H.; Hu, X.; Wang, L. Optimization of site exploration program based on coupled characterization of stratigraphic and geo-properties uncertainties. Eng. Geol. 2023, 317, 107081. [Google Scholar] [CrossRef]
- Zhang, J.; Zhang, D.; Huang, H.; Phoon, K.; Tang, C.; Li, G. Hybrid machine learning model with random field and limited CPT data to quantify horizontal scale of fluctuation of soil spatial variability. Acta Geotech. 2022, 17, 1129–1145. [Google Scholar] [CrossRef]
- Zhang, J.; Phoon, K.; Zhang, D.; Huang, H.; Tang, C. Novel approach to estimate vertical scale of fluctuation based on CPT data using convolutional neural networks. Eng. Geol. 2021, 294, 106342. [Google Scholar] [CrossRef]
- Lyu, B.; Wang, Y.; Shi, C. Multi-scale generative adversarial networks (GAN) for generation of three-dimensional subsurface geological models from limited boreholes and prior geological knowledge. Comput. Geotech. 2024, 170, 106336. [Google Scholar] [CrossRef]
- Zhao, C.; Gong, W.; Juang, C.; Tang, H.; Liu, Z.; Hu, X. Probabilistic performance analysis of longitudinal tunnels based on coupled characterization of stratigraphic and geo-properties uncertainties. Tunn. Undergr. Space Technol. 2025, 161, 106552. [Google Scholar] [CrossRef]
- Konkol, J.; Miedlarz, K.; Balachowski, L. Geotechnical characterization of soft soil deposits in Northern Poland. Eng. Geol. 2019, 259, 106187. [Google Scholar] [CrossRef]
- Zighmi, K.; Zahri, F.; Faqeih, K.; Al Amri, A.; Riheb, H.; Alamri, S.; Alamery, E. AHP multi criteria analysis for landslide susceptibility mapping in the Tellian Atlas chain. Sci. Rep. 2025, 15, 25747. [Google Scholar] [CrossRef] [PubMed]
- Toscani, R.; Rabelo Matos, D.; Guimaraes Campos, J. An Assessment of Landscape Evolution Through Pedo-Geomorphological Mapping and Predictive Classification Using Random Forest: A Case Study of the Statherian Natividade Basin, Central Brazil. Geosciences 2025, 15, 194. [Google Scholar] [CrossRef]
- Robertson, P. Cone penetration test (CPT)-based soil behaviour type (SBT) classification system—An update. Can. Geotech. J. 2016, 53, 1910–1927. [Google Scholar] [CrossRef]
- Bol, E. The influence of pore pressure gradients in soil classification during piezocone penetration test. Eng. Geol. 2013, 157, 69–78. [Google Scholar] [CrossRef]
- Saye, S.; Santos, J.; Olson, S.; Leigh, R. Linear Trendlines to Assess Soil Classification from Cone Penetration Test Data. J. Geotech. Geoenviron. Eng. 2017, 143, 04017060. [Google Scholar] [CrossRef]
- Sodré, D. Cone penetration index for soil behaviour type prediction. Sci. Rep. 2022, 12, 12412. [Google Scholar] [CrossRef] [PubMed]
- Cetin, K.; Ozan, C. CPT-Based Probabilistic Soil Characterization and Classification. J. Geotech. Geoenviron. Eng. 2009, 135, 84–107. [Google Scholar] [CrossRef]
- Sharma, M.; Ilamparuthi, K. Interpretation of electric piezocone data of Chennai coast. Ocean Eng. 2009, 36, 511–520. [Google Scholar] [CrossRef]
- Ganju, E.; Prezzi, M.; Salgado, R. Algorithm for generation of stratigraphic profiles using cone penetration test data. Comput. Geotech. 2017, 90, 73–84. [Google Scholar] [CrossRef]
- Agaiby, S.; Mayne, P. CPTU identification of regular, sensitive, and organic clays towards evaluating preconsolidation stress profiles. AIMS Geosci. 2021, 7, 553–573. [Google Scholar] [CrossRef]
- Zhang, Z.; Tumay, M. Statistical to fuzzy approach toward CPT soil classification. J. Geotech. Geoenviron. Eng. 1999, 125, 179–186. [Google Scholar] [CrossRef]
- DeJong, J.; Randolph, M. Influence of Partial Consolidation during Cone Penetration on Estimated Soil Behavior Type and Pore Pressure Dissipation Measurements. J. Geotech. Geoenviron. Eng. 2012, 138, 777–788. [Google Scholar] [CrossRef]
- Bol, E.; Önalp, A.; Özocak, A.; Sert, S. Estimation of the undrained shear strength of Adapazari fine grained soils by cone penetration test. Eng. Geol. 2019, 261, 105277. [Google Scholar] [CrossRef]
- Hagh, A.; Eslami, A.; Nobahar, M. Various Approaches for Assessment of Crude Oil Mixed Soil Behavior Using Cone Penetration Test Records. Transp. Infrastruct. Geotechnol. 2025, 12, 24. [Google Scholar] [CrossRef]
- Deng, S.; Zhang, Y.; Han, J.; Wang, K.; Tian, Z.; Liu, T. An Analytical Study on Penetration and Pore Pressure Dissipation of Piezocone Test in Typical Normally and Over-Consolidated Silty Clays. Appl. Sci. 2023, 13, 3797. [Google Scholar] [CrossRef]
- Zhang, Y.; Gao, H.; Fang, X.; Xing, S.; Xiao, L.; Duan, L. Research on the Compactness of Lunar Soil Simulant Based on Static Cone Penetration Test. Appl. Sci. 2025, 15, 7553. [Google Scholar] [CrossRef]
- Shimobe, S.; Spagnoli, G. Fall cone tests considering water content, cone penetration index, and plasticity angle of fine-grained soils. J. Rock Mech. Geotech. Eng. 2020, 12, 1347–1355. [Google Scholar] [CrossRef]
- Tsiambaos, G.; Sabatakakis, N. Empirical estimation of shear wave velocity from in situ tests on soil formations in Greece. Bull. Eng. Geol. Environ. 2011, 70, 291–297. [Google Scholar] [CrossRef]
- Oberhollenzer, S.; Premstaller, M.; Marte, R.; Tschuchnigg, F.; Erharter, G.; Marcher, T. Cone penetration test dataset Premstaller Geotechnik. Data Brief 2021, 34, 106618. [Google Scholar] [CrossRef] [PubMed]
- Koumoto, T.; Houlsby, G. Theory and practice of the fall cone test. Geotechnique 2001, 51, 701–712. [Google Scholar] [CrossRef]
- Shimobe, S.; Spagnoli, G. A global database considering Atterberg limits with the Casagrande and fall-cone tests. Eng. Geol. 2019, 260, 105201. [Google Scholar] [CrossRef]
- Hrubesova, E.; Lunackova, B.; Mohyla, M. Mohajerani method: Tool for determining the liquid limit of soils using fall cone test results with strong correlation with the Casagrande test. Eng. Geol. 2020, 278, 105852. [Google Scholar] [CrossRef]
- Diaz, E.; Pastor, J.; Rabat, A.; Tomas, R. Machine learning techniques for relating liquid limit obtained by Casagrande cup and fall cone test in low-medium plasticity fine grained soils. Eng. Geol. 2021, 294, 106381. [Google Scholar] [CrossRef]
- Nakayenga, J.; Inui, M.; Hata, T. Study on the Effect of Amorphous Silica from Waste Granite Powder on the Strength Development of Cement-Treated Clay for Soft Ground Improvement. Sustainability 2022, 14, 4073. [Google Scholar] [CrossRef]
- Bhattacharya, B.; Solomatine, D. Machine learning in soil classification. Neural Netw. 2006, 19, 186–195. [Google Scholar] [CrossRef] [PubMed]
- Reale, C.; Gavin, K.; Libric, L.; Juric-Kacunic, D. Automatic classification of fine-grained soils using CPT measurements and Artificial Neural Networks. Adv. Eng. Inform. 2018, 36, 207–215. [Google Scholar] [CrossRef]
- Arel, E. Predicting the spatial distribution of soil profile in Adapazari/Turkey by artificial neural networks using CPT data. Comput. Geosci. 2012, 43, 90–100. [Google Scholar] [CrossRef]
- Godoy, C.; Depina, I.; Thakur, V. Application of machine learning to the identification of quick and highly sensitive clays from cone penetration tests. J. Zhejiang Univ.-Sci. A 2020, 21, 445–461. [Google Scholar] [CrossRef]
- Ulloa, H.; Ramirez, A.; Jafari, N.; Kameshwar, S.; Harrouch, I. Machine Learning-Based Organic Soil Classification Using Cone Penetrometer Tests. J. Geotech. Geoenviron. Eng. 2024, 150, 05024008. [Google Scholar] [CrossRef]
- Rauter, S.; Tschuchnigg, F. CPT Data Interpretation Employing Different Machine Learning Techniques. Geosciences 2021, 11, 265. [Google Scholar] [CrossRef]
- Erharter, G.; Oberhollenzer, S.; Fankhauser, A.; Marte, R.; Marcher, T. Learning decision boundaries for cone penetration test classification. Comput.-Aided Civil Infrastruct. Eng. 2021, 36, 489–503. [Google Scholar] [CrossRef]
- Wang, L.; Wang, X.; Kooch, Y.; Song, K.; Wu, D. Improvement of data imbalance for digital soil class mapping in Eastern China. Comput. Electron. Agric. 2023, 214, 108322. [Google Scholar] [CrossRef]
- Athar, M.; Khoshnevisan, S.; Sadik, L. CPT-Based Soil Classification through Machine Learning Techniques. In Proceedings of the GEO-CONGRESS 2023: Geotechnical Systems from Pore-Scale to City-Scale, Los Angeles, CA, USA, 26–29 March 2023; pp. 277–292. [Google Scholar]
- Pacheco, V.; Bragagnolo, L.; Dalla Rosa, F.; Thome, A. Cone Penetration Test Prediction Based on Random Forest Models and Deep Neural Networks. Geotech. Geol. Eng. 2023, 41, 4595–4628. [Google Scholar] [CrossRef]
- Chala, A.; Ray, R. Assessing the Performance of Machine Learning Algorithms for Soil Classification Using Cone Penetration Test Data. Appl. Sci. 2023, 13, 5758. [Google Scholar] [CrossRef]
- Cho, S.; Kim, H.; Kim, H. Locally Specified CPT Soil Classification Based on Machine Learning Techniques. Sustainability 2023, 15, 2914. [Google Scholar] [CrossRef]
- Wu, S.; Zhang, J.; Wang, R. Machine learning method for CPTu based 3D stratification of New Zealand geotechnical database sites. Adv. Eng. Inform. 2021, 50, 101397. [Google Scholar] [CrossRef]
- Liu, W.; Tong, L.; Sun, Y.; Wu, H.; Yan, X.; Liu, S. Automatic soil classification method from CPTU data based on convolutional neural networks. Bull. Eng. Geol. Environ. 2024, 83, 319. [Google Scholar] [CrossRef]
- Zhou, X.; Sheil, B.; Suryasentana, S.; Shi, P. Multi-fidelity fusion for soil classification via LSTM and multi-head self-attention CNN model. Adv. Eng. Inform. 2024, 62, 102655. [Google Scholar] [CrossRef]
- Zhou, X.; Shi, P.; Sheil, B.; Suryasentana, S. Knowledge-based U-Net and transfer learning for automatic boundary segmentation. Adv. Eng. Inform. 2024, 59, 102243. [Google Scholar] [CrossRef]
- Wang, X.; Wang, H.; Liang, R.; Liu, Y. A semi-supervised clustering-based approach for stratification identification using borehole and cone penetration test data. Eng. Geol. 2019, 248, 102–116. [Google Scholar] [CrossRef]
- Zhou, J.; Li, E.; Wang, M.; Chen, X.; Shi, X.; Jiang, L. Feasibility of Stochastic Gradient Boosting Approach for Evaluating Seismic Liquefaction Potential Based on SPT and CPT Case Histories. J. Perform. Constr. Facil. 2019, 33, 04019024. [Google Scholar] [CrossRef]
- Bernard, M. Integrating Machine Learning in Geotechnical Engineering: A Novel Approach for Railway Track Layer Design Based on Cone Penetration Test Data. Infrastructures 2024, 9, 121. [Google Scholar] [CrossRef]
- Zhang, J.; Mao, Z.; Huang, H.; Zhang, D. Soil classification based on unsupervised learning using cone penetration test data. IOP Conf. Ser. Earth Environ. Sci. 2024, 8, 012032. [Google Scholar] [CrossRef]
- Zhao, H.; Wang, Y.; Li, X.; Guo, P.; Lin, H. Prediction of Maximum Tunnel Uplift Caused by Overlying Excavation Using XGBoost Algorithm with Bayesian Optimization. Appl. Sci. 2023, 13, 9726. [Google Scholar] [CrossRef]
- Salehi Hikouei, I.; Kim, S.; Mishra, D. Machine-Learning Classification of Soil Bulk Density in Salt Marsh Environments. Sensors 2021, 21, 4408. [Google Scholar] [CrossRef] [PubMed]
- Qiu, Y.; Zhang, N.; Yin, Z.; Wang, Y.; Xu, C.; Zhang, P. Novel multi-spatial receptive field (MSRF) XGBoost method for predicting geological cross-section based on sparse borehole data. Eng. Geol. 2024, 338, 107604. [Google Scholar] [CrossRef]
- Luo, W.; Yuan, D.; Ng, Y.; Jin, D.; Lu, P.; Wang, T. Prediction of fracture initiation in cohesive soils based on data mining modelling and large-scale laboratory verification. Undergr. Space 2024, 19, 279–300. [Google Scholar] [CrossRef]
- Jaijit, S.; Piamsa-nga, P.; Witthayapraphakorn, A. A machine learning approach to sustainable land use: Integrating Markov chains and XGBoost for black galingale cultivation in Thailand. Environ. Sustain. Indic. 2025, 28, 100896. [Google Scholar] [CrossRef]
- Suzuki, Y.; Lehane, B. Analysis of CPT end resistance at variable penetration rates using the spherical cavity expansion method in normally consolidated soils. Comput. Geotech. 2015, 69, 141–152. [Google Scholar] [CrossRef]
- Kim, J.; Choo, Y.; Kim, D. Correlation between the Shear-Wave Velocity and Tip Resistance of Quartz Sand in a Centrifuge. J. Geotech. Geoenviron. Eng. 2017, 143, 04017083. [Google Scholar] [CrossRef]
- Kluger, M.; Kreiter, S.; Staehler, F.; Goodarzi, M.; Stanski, T.; Moerz, T. Cone penetration tests in dry and saturated Ticino sand. Bull. Eng. Geol. Environ. 2021, 80, 4079–4088. [Google Scholar] [CrossRef]
- Li, R.; Chen, J.; Zhang, J.; Chen, D.; Zhao, X.; Mo, P.; Zhou, G. Cone penetration resistance of CUMT-1 lunar regolith simulant under magnetic-similitude lunar gravity condition. Acta Geotech. 2023, 18, 6725–6744. [Google Scholar] [CrossRef]
- Wu, C.; Song, Y.; Dai, J.; Li, L.; Gu, X. Calibration of Cone Factor in Cone Penetration Test for Evaluating the Undrained Shear Strength of Silty Clay. Materials 2025, 18, 1283. [Google Scholar] [CrossRef]
- Shimobe, S.; Spagnoli, G. Some relations among fall cone penetration, liquidity index and undrained shear strength of clays considering the sensitivity ratio. Bull. Eng. Geol. Environ. 2019, 78, 5029–5038. [Google Scholar] [CrossRef]
- Zhang, J.; Jiang, Q.; Zhang, D.; Huang, H.; Liu, Z. Influence of geological uncertainty and soil spatial variability on tunnel deformation and their importance evaluation. Tunn. Undergr. Sp. Tech. 2024, 152, 105930. [Google Scholar] [CrossRef]
- Zhang, J.; Huang, H.; Zhang, D.; Phoon, K. Experimental study of the coupling effect on segmental shield tunnel lining under surcharge loading and excavation unloading. Tunn. Undergr. Sp. Tech. 2023, 140, 105199. [Google Scholar] [CrossRef]
Disclaimer/Publisher’s Note: The statements, opinions and data contained in all publications are solely those of the individual author(s) and contributor(s) and not of MDPI and/or the editor(s). MDPI and/or the editor(s) disclaim responsibility for any injury to people or property resulting from any ideas, methods, instructions or products referred to in the content. |
© 2025 by the authors. Licensee MDPI, Basel, Switzerland. This article is an open access article distributed under the terms and conditions of the Creative Commons Attribution (CC BY) license.