Featured Application
The presented data constitute an extension of the current thermodynamic knowledge concerning the Cu-Mg-Ti system and can be applied for further phase equilibrium calculations of the system.
Abstract
Since there is limited information available in the literature about the thermodynamic properties of the Cu-Mg-Ti system, this work aims to determine the mixing enthalpy change for several liquid alloys from this system. To achieve the intended purpose, the applied methods were divided into two stages. The first one covered a high-temperature calorimetric measurement of the enthalpy of mixing performed at 1123–1402 K for liquid solutions in six measurement series (A–F). The obtained experimental results indicate that the liquid solutions are characterized by negative deviations from ideal solutions across the whole measured concentration range. The second stage of the study includes thermodynamic modeling. At first, based on the calorimetrically obtained experimental data and thermodynamic properties of the binary systems described by the Redlich–Kister model, a set of ternary optimized parameters for the Cu-Mg-Ti system were calculated. Then, for the calculation of the mixing enthalpy change, two models were used—the symmetrical Muggianu model and the asymmetrical Toop model. This study complements the information available in the literature and the obtained results aim to fill the gap in the current knowledge on thermodynamic properties.
1. Introduction
Attractive properties of Ti-based alloys, such as low density, high melting point, high strength to specific gravity ratio, and corrosion resistance make them suitable, for example, for automotive, aviation, marine, and space industries applications. Additionally, the high biocompatibility of these alloys makes them useful in the biomedical industry [1]. When combined with copper, alloys are characterized by increased antibacterial properties [2,3]. The literature also shows that Cu-Ti alloys are promising candidates for the replacement of Cu-Be alloys, which are expensive and hazardous to health during processing [4,5]. In terms of Mg-based alloys, they are known as a light-weight structural material, due to their potential weight-saving characteristics [6]. Among other magnesium-based alloys, they can be considered a solid-state hydrogen storage material [7,8,9]. Due to the diverse applications of copper-, magnesium-, and titanium-based alloys, research into their ternary system may potentially lead to the development of advanced materials that can be used, additionally, in many industrially important areas, similar to the binary system that forms the ternary system.
The first stage of research on any multicomponent system is to learn the properties of the binary systems, which in the case of the Cu-Mg-Ti system are the Cu-Mg, Cu-Ti, and Mg-Ti systems. For the Cu-Mg system, a detailed review of the literature was presented in our previous work [10]. In order to briefly introduce the system, it is characterized by the occurrence of five phases including the liquid phase, a copper-rich solid solution (Cu), two intermetallic phases (CuMg2 and Cu2Mg), and a magnesium-rich solid solution (Mg) with restricted solubility of copper [11,12]. In relation to thermodynamic properties, the experimental determination of the enthalpy of mixing for binary alloys has been presented in two works. As demonstrated in Sommer et al. [13] and Batalin et al. [14], the obtained values indicate the negative values of the mixing enthalpy for the whole concentration range under investigation. The data presented in both papers are consistent with each other. In terms of the Cu-Ti system, a detailed review of the literature was presented in one of our previous works [15]. The Cu-Ti system is composed of six intermetallic phases (βCu4Ti, Cu2Ti, Cu3Ti2, Cu4Ti3, CuTi, and CuTi2) and four other phases (liquid, Cu, βTi, and αTi) [16,17]. The enthalpies of mixing solid titanium with liquid copper have been determined by Yokokawa and Kleppa [18] at 1372 K and by Kleppa and Watanabe [19] by high-temperature reaction calorimetry. Moreover, Turchanin et al. [20] used solution calorimetry at temperatures of 1573 K and 1873 K over broad concentration ranges. Due to the discrepancy in the available literature data in our previous work, we determined the mixing enthalpy for Cu-Ti alloys [15]. The mixing enthalpy change data obtained in that study were found to be in better agreement with the data from [18,19] than with the data from [20]. The Mg-Ti system assessment by Murray [21] shows the elements’ very low mutual solubility. Under the equilibrium conditions, the following three solid phases occur: low-temperature αTi solid solution, low-temperature Mg solid solution, and the βTi solid phase.
In the case of the Cu-Mg-Ti system, available data are for Cu-rich alloys containing 0–22 at. % Ti and 0–36 at. % Mg. As a result of the investigation, a projection of the partial liquidus surface for the Cu corner of the Cu-Mg-Ti phase diagram and partial isothermal section at 700 °C was constructed. In the studied part of the ternary phase diagram, only one four-phase invariant equilibrium of the transition type is established. It happens at 780 °C and has a peritectic nature and occurs through crystallization [22].
This is the first calorimetric study of mixing enthalpies for the liquid Cu–Mg–Ti system beyond the Cu-rich corner previously reported in [22]. This research’s principal goal is to expand the current knowledge of the thermodynamic properties of liquid alloys from the ternary Cu-Mg-Ti system. Obtaining experimental data and ternary interaction parameters is the first step toward a thorough investigation and evaluation of the system. Furthermore, the results presented in this paper may contribute as a first step to a more accurate understanding of the ternary system. The presented results would address the lack of information in the literature regarding the mixing enthalpy of alloys from the Cu-Mg-Ti system. The data can be used to model phase equilibria and optimize thermodynamic parameters for the cited system and higher-order systems.
2. Materials and Methods
Outcomes shown in this study were achieved with an approach that can be seen as a two-stage process. In the first stage, described as an experimental stage, high-temperature drop calorimetry measurements with the Setaram MHTC 96 line evo (Setaram Instruments—KEP technologies, Caluire, France) calorimeter were performed. The experiments were conducted under a high-purity argon (Pioniergas, Krakow, Poland) atmosphere with a pressure of 0.1 MPa for six measurement series, with the initial compositions presented in Figure 1 and summarized in Table 1. The protective high-purity Argon atmosphere used during each of the described calorimetric measurements is intended to limit the risk of oxidation during each measurement series. The measurement procedure was similar to that in our previous work on measuring the thermodynamic properties of liquid alloys from the Ag-Mg-Ti system [23].
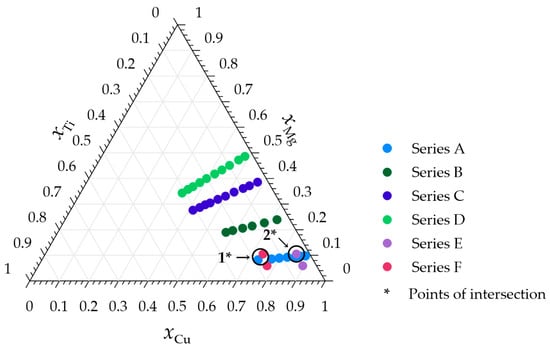
Figure 1.
Compositions of the investigated Cu-Mg-Ti alloys together with the intersection points.

Table 1.
Summarized information of the compositions of the measurement series.
For the sample preparation, high-purity metal wires were used. The final sample had a cylindrical shape with a diameter of 3 mm and a height in the range of 3 mm to 20 mm. Before every measurement series, the calorimeter was purged with high-purity argon and vacuum-pumped several times. To get rid of any possible surface contamination, the samples were mechanically cleaned with a file before being put into the reaction crucible. For series A–E, crucibles made of magnesium oxide (MgO) (INN-THERM, Trzcianka, Poland) and for series F, ZrO2 + Y2O3 crucibles (P.P.H.U. “POWŁOKA” S.C. T. Kurach, P. Woźniak, K. Posytek, Karczew, Poland) were used. Measurements were performed using two types of crucibles to check whether the material used affected the obtained calorimetric results. More information about the used materials is listed in Table 2.
Table 2.
Specification of used materials.
Calorimetric measurements conducted as part of this work include three main stages, which were calibration, measurement of the mixing enthalpy of the binary alloys, and measurement of the mixing enthalpy of the ternary alloys. Each of the mentioned stages can be presented in the form of the following reactions summarized in Table 3.
Table 3.
Reactions of each stage of the experimental measurements for series A–F.
In the above reaction, symbols stand as follows: s for solid state; l for liquid state; x, y, and z represent the number of moles of Cu, Mg, and Ti; CuxMgy(l,TM) and CuxTiz(l,TM) represent the formation of a starting binary liquid alloy and include the increments in enthalpy for pure magnesium and the melting enthalpy at the measurement temperature; and represents the formation of the ith ternary alloy (i = 1, 2, 3, …) and includes the changes in enthalpy for the added metal (Ti or Mg) and the melting enthalpy for the added metal at the measurement temperature.
Figure 2 shows the example of the recorded thermal effects connected with the subsequent stages of the high-temperature drop calorimetry measurements for the measurement series B (results in Table A2).
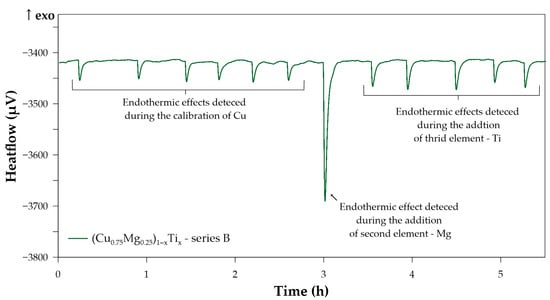
Figure 2.
Thermal effects detected during the measurement series B at a temperature of 1270 K; the effects have been assigned to each stage of the high-temperature drop calorimetry measurements.
During the calibration process based on the thermal effects caused by dropped calibration samples, the calibration constant was determined using Equation (1).
where is the molar enthalpy difference in the calibrant element between room temperature (TD) and the measurement temperature (TM), calculated using relations in [24], is the number of moles of the calibrant sample, and is the voltage signal given in (μV·s)−1, caused by the heat increment that comes from the dropped calibrant sample. Information about the calibration material and the calibration constant for each measurement series is summarized in Table A1, Table A2, Table A3, Table A4, Table A5 and Table A6 together with the results.
Based on the heat effects of the solution of Mg and Ti measured during the experiment and Equations (2) and (3), the mixing enthalpy change for the binary and ternary alloy was calculated. Additionally, the partial molar enthalpies were determined using Equation (4).
The symbols denote as follows: is the mixing enthalpy change in the binary alloy; is the enthalpy of dissolution of pure magnesium and titanium; nX are the numbers of moles of each element (X = Mg or Ti); is the voltage signal given in (μV·s)−1, caused by the heat increment that comes from each dropped Mg or Ti; and is the partial molar enthalpy.
The second stage of the study covered the modeling of thermodynamic properties. The most common methods of modeling thermodynamic properties are based on calculating the contributions from lower-order systems. Numerous methods have been proposed to describe the properties of ternary systems, of which the most widely utilized are the Kohler [25], Muggianu [26], Toop [27], and Bonnier [28] models. Subsequent to this, Hiller [29] divided these models into the following two groups: symmetric and asymmetric. The first two mentioned models are classified as symmetric; in this group, the binary systems are considered to be equivalent. These models are expected to demonstrate the most efficiency in ternary systems where all binary systems exhibit similar deviations from ideal solutions. The remaining two models are classified as asymmetrical; they address the scenario when one of the binary systems exhibits a substantial deviation from the ideal solution or a contrasting sign compared to the other binary systems. This scenario occurs in the Cu-Mg-Ti system due to the Mg-Ti system, which is characterized by positive deviation from the ideal solution.
The obtained experimental data presented in Appendix A were used to evaluate the thermodynamic properties by the symmetrical Muggianu model [26] and the asymmetrical Toop model [27]. Their mathematical expression represents Equations (5) and (6). The distinction between the two groups of models is presented in Figure 3, which shows geometric representations of Muggianu [26] and Toop [27] models.
where is the mixing enthalpy change in the liquid Cu-Mg-Ti alloys, , , are the mole fractions of each element of the Cu-Mg-Ti alloy, represents the binary interaction parameters (Cu-Mg, Cu-Ti, and Mg-Ti) in the Redlich–Kister polynomial [30], and (a = 0, 1, 2, 3) represents the ternary interaction parameters.
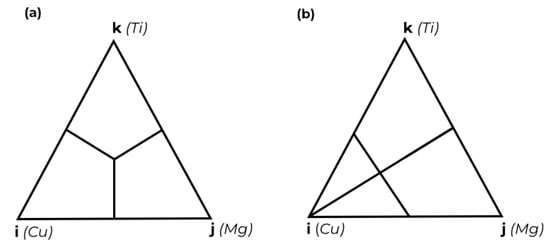
Figure 3.
Schematic representation of the geometric models: (a) Muggianu model [26], (b) Toop model [27].
3. Results and Discussion
The obtained values of the integral molar mixing enthalpies, the mole fraction of pure elements, drop enthalpies, calibration constants, and other important information about each measurement series are gathered in Appendix A in Table A1, Table A2, Table A3, Table A4, Table A5 and Table A6. In the case of the first four A–D measurement series (Table A1, Table A2, Table A3 and Table A4 in Appendix A), the starting binary alloys were from the Cu-Mg system. The determined values of mixing enthalpy for the liquid Cu-Mg alloys with the constant xCu/xMg ratios equal to 3/1, 1/1, 3/2, and 1/3 are in good agreement with the experimental data reported in the literature [13,14]. The results presented in both mentioned paper indicate that the enthalpy of mixing values is negative, which is consistent with the obtained data. The discrepancy for alloys with similar compositions does not exceed 1.2 kJ·mol−1, thereby indicating a satisfactory agreement between the presented and the literature results for binary alloys from the Cu-Mg system [10]. The values for the integral mixing enthalpy for ternary alloys for all series with the Cu-Mg alloy as a starting alloy are characterized by negative values across the whole measured composition range. The minimum for these four series was observed in measurement series D (Cu0.50Mg0.50)xTi1−x and xTi = 0.0286.
For measurement series E and F (Table A5 and Table A6 in Appendix A), the starting binary alloys were from the Cu-Ti system. As observed in the case of Cu-Mg binary alloys, the results for Cu-Ti alloys are consistent with those reported in the extant literature [15,18,19]. Once more, the mixing enthalpy for these alloys is characterized by negative deviation from the ideal solution. The difference for alloys with similar composition presented in this work and reported in [18,19] is not greater than 0.6 kJ·mol−1. When analyzing the measurement results for ternary alloys, it can be seen that across the whole measured composition range, the integral enthalpy of mixing is characterized by a negative deviation from the ideal solution. The minimum in these two measurement series was observed for series F (Cu0.82Ti0.18)xMg1−x and xMg = 0.1042. In the context of measurement series E and F, it should also be noted that two reaction crucible materials were used during the calorimetric measurements. When analyzing the values determined for both measurement series, the differences in the determined mixing enthalpy are within the measurement uncertainties. This suggests that the crucible material does not affect the final mixing enthalpy value at the studied temperature and composition.
Table 4 presents the values of the integral molar enthalpy of mixing for respective sections in the vicinity of the cross points of the cross-sections with series A. The difference between the values obtained in the intersection point 1 is equal to 0.21 kJ·mol−1. In the case of the intersection point 2, the difference between the determined values is significantly greater, exceeding 1 kJ·mol−1. This observation suggests better agreement in the intersection point of series A and F. However, when the standard uncertainties of the measurement for series E are taken into account, the obtained value is found to be in proximity to the enthalpy at the intersection point for series A.
Table 4.
Integral molar enthalpy of mixing near the points of intersection experimental series. Values are in kJ·mol−1.
Based on the calorimetric data presented in Appendix A in Table A1, Table A2, Table A3, Table A4, Table A5 and Table A6, the set of thermodynamic parameters for the liquid ternary alloys was calculated by the least squares method with the use of the proprietary optimization program (TerGexHm 1.0). The calculated standard deviation is equal to 1.012 kJ/mol. The thermodynamic parameters for the liquid binary alloys were taken from the literature and from our previous works focused on the re-optimization of the Cu-Ti [15] and Cu-Mg [10] phase diagrams. All used thermodynamic parameters are listed in Table 5.
Table 5.
Binary and ternary interaction parameters used for the calculation of the integral and partial mixing enthalpy change.
Applying the parameters from Table 5, the integral and partial mixing enthalpies for the Cu-Mg-Ti liquid solutions were calculated for experimental cross-sections and are presented in Appendix B in Table A7, Table A8, Table A9, Table A10, Table A11 and Table A12. All the experimentally obtained and calculated values of the integral mixing enthalpy are presented in Figure 4, Figure 5, Figure 6, Figure 7, Figure 8 and Figure 9. The solid lines show the calculated data with Equation (5), the dashed line represents the values calculated with Equation (6), and the symbols show the experimental values obtained in this study.
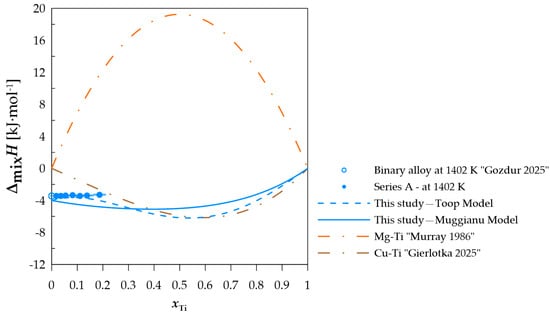
Figure 4.
The experimental and calculated integral mixing enthalpy of starting binary alloys [10] and (Cu0.90Mg0.10)1−xTix alloys together with the standard uncertainties, and the binary systems mixing enthalpy calculated based on the thermodynamic parameters from [15,21]. Due to the low value of the calculated standard uncertainties associated with the low mass of the dropped Ti samples, the measurement error of the integral molar mixing enthalpy for series A are not shown in Figure 4. Calculated measurement uncertainty values are presented in Table A1, together with experimental results.
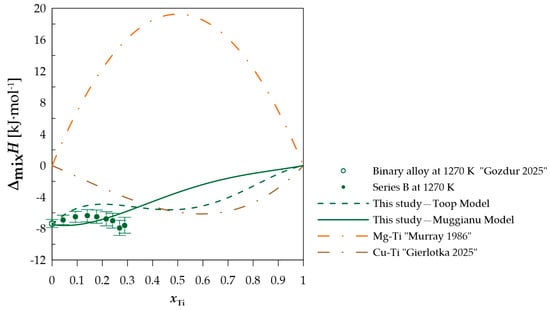
Figure 5.
The experimental and calculated integral mixing enthalpy of starting binary alloy [10] (Cu0.75Mg0.25)1−xTix alloys together with the standard uncertainties, and the binary systems mixing enthalpy calculated based on the thermodynamic parameters from [15,21].
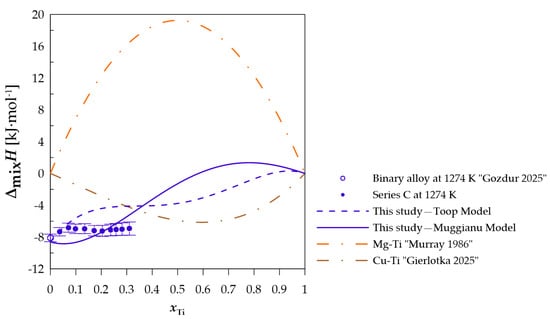
Figure 6.
The experimental and calculated integral mixing enthalpy of starting binary alloy [10] and (Cu0.60Mg0.40)1−xTix alloys together with the standard uncertainties, and binary systems mixing enthalpy calculated based on the thermodynamic parameters from [15,21].
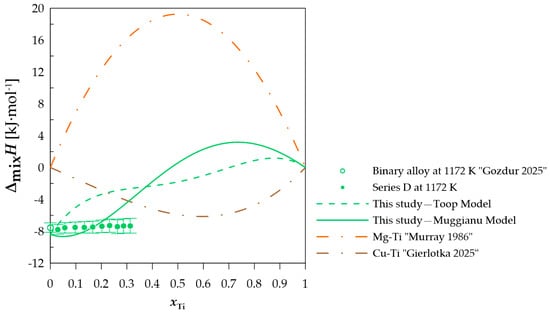
Figure 7.
The experimental and calculated integral mixing enthalpy of starting binary alloy [10] and (Cu0.50Mg0.50)xTi1−x alloys together with the standard uncertainties, and the binary systems mixing enthalpy calculated based on the thermodynamic parameters from [15,21].
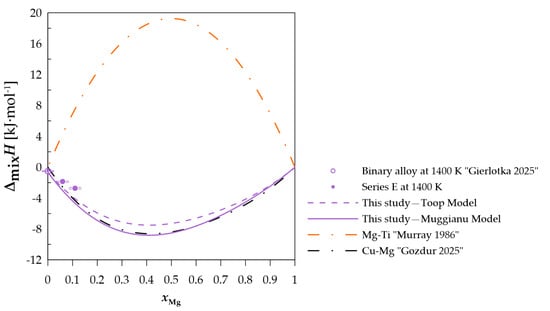
Figure 8.
The experimental and calculated integral mixing enthalpy of starting binary alloy [15] and (Cu0.95Ti0.05)xMg1−x alloys, together with the standard uncertainties, and the binary systems mixing enthalpy calculated based on the thermodynamic parameters from [10,21].
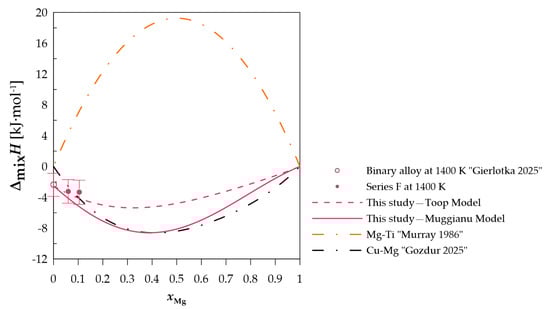
Figure 9.
The experimental and calculated integral mixing enthalpy of starting binary alloy [15] (Cu0.82Ti0.18)xMg1−x alloys, together with the standard uncertainties, and the binary systems mixing enthalpy calculated based on the thermodynamic parameters from [10,21].
In terms of measurement series A, when comparing the difference between the calculated and experimentally determined values, a difference of less than −1 kJ·mol−1 can be observed when using the Toop model [27] and −1.52 kJ·mol−1 for the Muggianu model [26]. The modeled values for this section do not indicate a positive deviation of the enthalpy of mixing. For measurement series B presented in Figure 5, a change in the nature of the curve representing the integral enthalpy of mixing is noticeable. The calculated values with both models indicate negative values for this section. A similar curve character is observed for measurement series C and D (Figure 6 and Figure 7), for which the majority of the modeled concentration range indicates negative values. For specific xTi values, the calculated data for both employed models show a positive integral mixing enthalpy. However, Muggianu model predicts a transition from negative to positive values for lower xTi in comparison to those predicted with the Toop model. For series C, positive values are observed for xTi = 0.59 according to Muggianu model and from xTi = 0.87 for Toop model. In series D, the transition is observed for xTi = 0.48 according to Muggianu model and xTi = 0.71 for Toop model.
In the case of measurement series E and F, in which the Cu-Ti alloys were the initial alloys, the values predicted by both models indicate a negative integral mixing enthalpy for both sections.
It should be noted that an analysis of the models’ ability to predict the enthalpy of mixing change for ternary solutions reveals that it is difficult to determine which model provides a more accurate prediction. Therefore, obtaining experimental data for the enthalpy change in mixing for titanium-rich Cu-Mg-Ti ternary alloys would be valuable for properly assessing the applicability of Muggianu and Toop models.
4. Conclusions
This paper presents the results of the investigation of the ternary liquid alloys from the copper-magnesium-titanium system. Measurements were performed for six series at a temperature range between 1172 K and 1402 K using the high-temperature drop calorimetry method. The obtained calorimetric results of the integral molar mixing enthalpy change show a negative deviation from ideal solutions over the entire measurement range of concentrations. Based on the presented calorimetric data, the set of thermodynamic parameters for the liquid ternary alloys were calculated by the least squares method with the use of the proprietary optimization program.
The integral and partial mixing enthalpies for the Cu-Mg-Ti liquid solutions were calculated with Muggianu and Toop models for experimental cross-sections. In terms of measurement series C and D for specific xTi values, the calculated values indicate positive integral mixing enthalpy values, which is evident for both employed models. For measurement series A, E, and F, the values predicted by both models indicate negative values.
The presented calorimetric results enhance the existing knowledge concerning thermodynamic properties of the Cu-Mg-Ti system. Further studies of this Cu-Mg-Ti ternary system are necessary to determine, among other things, the structural properties and thermodynamic properties of solid and liquid solutions and phases necessary for modeling the phase diagram and physicochemical, mechanical, and other properties.
Author Contributions
Conceptualization, A.D.; methodology, A.D. and W.G. (Władysław Gąsior); software, W.G. (Władysław Gąsior) and W.G. (Wojciech Gierlotka); validation, W.G. (Weronika Gozdur), A.D., W.G. (Władysław Gąsior), W.G. (Wojciech Gierlotka), M.P. (Magda Pęska) and M.P. (Marek Polański); investigation, W.G. (Weronika Gozdur), M.P. (Magda Pęska) and A.D.; writing—original draft preparation, W.G. (Weronika Gozdur), A.D. and W.G. (Władysław Gąsior); supervision, A.D. and W.G. (Władysław Gąsior); project administration, A.D.; funding acquisition, A.D.; visualization, W.G. (Weronika Gozdur). All authors have read and agreed to the published version of the manuscript.
Funding
This research was funded by the National Science Center, Poland, project no. 2021/43/O/ST8/01291. For the purpose of open access, the authors have applied a CC-BY public copyright license to any Author Accepted Manuscript (AAM) version arising from this submission.
Institutional Review Board Statement
Not applicable.
Informed Consent Statement
Not applicable.
Data Availability Statement
The raw data supporting the conclusions of this article will be made available by the authors on request.
Acknowledgments
We gratefully acknowledge Poland’s high-performance Infrastructure PLGrid (HPC Center: ACK Cyfronet AGH) for providing computer facilities and support within the computational grant no. PLG/2024/017199.
Conflicts of Interest
The authors declare no conflicts of interest.
Appendix A
Appendix A presents a tabular summary of the experimental measurements of mixing enthalpy change for series A–F (Table A1, Table A2, Table A3, Table A4, Table A5 and Table A6), together with the essential information about each measurement series.
Table A1.
The integral molar mixing enthalpy of Cu-Mg-Ti alloys—Series A. Calibration material: copper. Standard states: pure liquid elements.
Table A1.
The integral molar mixing enthalpy of Cu-Mg-Ti alloys—Series A. Calibration material: copper. Standard states: pure liquid elements.
| Number of Dropped Moles | Heat Effect | Drop Enthalpy | Mole Friction | Integral Molar Mixing Enthalpy | Partial Molar Enthalpy | Standard Uncertainties |
|---|---|---|---|---|---|---|
| [mol] | [kJ] | [kJ·mol−1] | [kJ·mol−1] | [kJ·mol−1] | [kJ·mol−1] | |
| (Cu0.90Mg0.10)1−xTix—series A = 43.9519 kJ·mol−1; = 42.6648 = 46.8497 kJ·mol−1. Standard uncertainties of starting parameters: u(nCu) = 0.0000016 mol; u(nMg) = 0.0000041 mol; u(nTi) = 0.0000021 mol; u(TD) = 1 K; u(TM) = 1 K; u(K) = 5.43·10−8 kJ·(μVs)−1. | ||||||
| 0.00244 | 0.02013 | −0.0841 | 0.1003 | −3.443 | −34.4 | 0.005 |
| 0.00044 | 0.01935 | −0.0012 | 0.0176 | −3.431 | −2.8 | 0.011 |
| 0.00047 | 0.02015 | −0.0020 | 0.0359 | −3.445 | −4.2 | 0.016 |
| 0.00048 | 0.02176 | −0.0007 | 0.0538 | −3.407 | −1.4 | 0.022 |
| 0.00080 | 0.03604 | −0.0016 | 0.0824 | −3.366 | −2.0 | 0.031 |
| 0.00085 | 0.03475 | −0.0049 | 0.1106 | −3.440 | −5.8 | 0.039 |
| 0.00088 | 0.03982 | −0.0015 | 0.1383 | −3.385 | −1.7 | 0.048 |
| 0.00170 | 0.07669 | −0.0029 | 0.1870 | −3.290 | −1.7 | 0.065 |
Table A2.
The integral molar mixing enthalpy of Cu-Mg-Ti alloys—Series B. Calibration material: copper. Standard states: pure liquid elements.
Table A2.
The integral molar mixing enthalpy of Cu-Mg-Ti alloys—Series B. Calibration material: copper. Standard states: pure liquid elements.
| Number of Dropped Moles | Heat Effect | Drop Enthalpy | Mole Friction | Integral Molar Mixing Enthalpy | Partial Molar Enthalpy | Standard Uncertainties |
|---|---|---|---|---|---|---|
| [mol] | [kJ] | [kJ·mol−1] | [kJ·mol−1] | [kJ·mol−1] | [kJ·mol−1] | |
| (Cu0.75Mg0.25)1−xTix—series B Starting parameters: nCu = 0.02115 mol; K = 7.311·10−6 kJ·(μVs)−1; TD = 298 K; TM = 1270 K; = 26.8462 kJ·mol−1; = 39.8462 kJ·mol−1; = 38.1360 kJ·mol−1; = 42.0710 kJ·mol−1. Standard uncertainties of starting parameters: u(nCu) = 0.0000016 mol; u(nMg) = 0.0000041 mol; u(nTi) = 0.0000021 mol; u(TD) = 1 K; u(TM) = 1 K; u(K) = 3.14·10−7 kJ·(μVs)−1. | ||||||
| 0.00705 | 0.33934 | −0.2075 | 0.2500 | −7.360 | −29.4 | 0.517 |
| 0.00129 | 0.05806 | 0.0037 | 0.0438 | −6.911 | 0.8 | 0.602 |
| 0.00158 | 0.06791 | 0.0013 | 0.0925 | −6.517 | −3.9 | 0.696 |
| 0.00171 | 0.06511 | −0.0067 | 0.1398 | −6.382 | −8.9 | 0.781 |
| 0.00148 | 0.04904 | −0.0131 | 0.1769 | −6.489 | −12.3 | 0.842 |
| 0.00168 | 0.04998 | −0.0207 | 0.2154 | −6.762 | −14.3 | 0.902 |
| 0.00120 | 0.03333 | −0.0171 | 0.2407 | −7.005 | −32.2 | 0.941 |
Table A3.
The integral molar mixing enthalpy of Cu-Mg-Ti alloys—Series C. Calibration material: copper. Standard states: pure liquid elements.
Table A3.
The integral molar mixing enthalpy of Cu-Mg-Ti alloys—Series C. Calibration material: copper. Standard states: pure liquid elements.
| Number of Dropped Moles | Heat Effect | Drop Enthalpy | Mole Friction | Integral Molar Mixing Enthalpy | Partial Molar Enthalpy | Standard Uncertainties |
|---|---|---|---|---|---|---|
| [mol] | [kJ] | [kJ·mol−1] | [kJ·mol−1] | [kJ·mol−1] | [kJ·mol−1] | |
| (Cu0.60Mg0.40)xTi1−x—series C Starting parameters: nCu = 0.02151 mol; K = 7.539·10−6 kJ·(μVs)−1; TD = 298 K; TM = 1274 K; = 26.8126 kJ·mol−1; = 39.9685 kJ·mol−1; = 38.2733 kJ·mol−1; = 42.2133 kJ·mol−1. Standard uncertainties of starting parameters: u(nCu) = 0.0000016 mol; u(nMg) = 0.0000041 mol; u(nTi) = 0.0000021 mol; u(TD) = 1 K; u(TM) = 1 K; u(K) = 1.744·10−7 kJ·(μVs)−1. | ||||||
| 0.00471 | 0.31340 | −0.150 | 0.1796 | −5.711 | −31.8 | 0.302 |
| 0.00469 | 0.10032 | −0.079 | 0.3042 | −7.411 | −16.9 | 0.384 |
| 0.00493 | 0.12701 | −0.062 | 0.4000 | −8.115 | −12.5 | 0.473 |
| 0.00134 | 0.074489 | 0.0180 | 0.0360 | −7.337 | 13.5 | 0.524 |
| 0.00139 | 0.068337 | 0.0096 | 0.0708 | −6.823 | 6.9 | 0.568 |
| 0.00116 | 0.035435 | −0.0137 | 0.0980 | −6.968 | −11.8 | 0.591 |
| 0.00170 | 0.060918 | −0.0109 | 0.1350 | −6.944 | −6.4 | 0.628 |
| 0.00188 | 0.055150 | −0.0242 | 0.1725 | −7.202 | −12.9 | 0.660 |
| 0.00171 | 0.058731 | −0.0134 | 0.2040 | −7.226 | −7.8 | 0.693 |
| 0.00195 | 0.073410 | −0.0090 | 0.2370 | −7.117 | −4.6 | 0.732 |
| 0.00131 | 0.048862 | −0.0063 | 0.2577 | −7.055 | −4.9 | 0.758 |
| 0.00161 | 0.059221 | −0.0087 | 0.2816 | −7.002 | −5.4 | 0.788 |
| 0.00208 | 0.076547 | −0.0113 | 0.3104 | −6.939 | −5.4 | 0.825 |
Table A4.
The integral molar mixing enthalpy of Cu-Mg-Ti alloys—Series D. Calibration material: copper. Standard states: pure liquid elements.
Table A4.
The integral molar mixing enthalpy of Cu-Mg-Ti alloys—Series D. Calibration material: copper. Standard states: pure liquid elements.
| Number of Dropped Moles | Heat Effect | Drop Enthalpy | Mole Friction | Integral Molar Mixing Enthalpy | Partial Molar Enthalpy | Standard Uncertainties |
|---|---|---|---|---|---|---|
| [mol] | [kJ] | [kJ·mol−1] | [kJ·mol−1] | [kJ·mol−1] | [kJ·mol−1] | |
| (Cu0.50Mg0.50)xTi1−x—series D Starting parameters: nCu = 0.02130 mol; K = 8.239·10−6 kJ·(μVs)−1; TD = 298 K; TM = 1172 K; = 23.8158 kJ·mol−1; = 36.8871 kJ·mol−1; = 34.7828 kJ·mol−1; = 38.6401 kJ·mol−1. Standard uncertainties of starting parameters: u(nCu) = 0.0000016 mol; u(nMg) = 0.0000041 mol; u(nTi) = 0.0000021 mol; u(TD) = 1 K; u(TM) = 1 K; u(K) = 2.381·10−7 kJ·(μVs)−1. | ||||||
| 0.00808 | 0.321345 | −0.2380 | 0.2749 | −8.100 | −29.5 | 0.316 |
| 0.00727 | 0.188108 | −0.0646 | 0.4187 | −8.256 | −8.9 | 0.464 |
| 0.00598 | 0.188783 | −0.0191 | 0.5002 | −7.546 | −3.2 | 0.592 |
| 0.00125 | 0.029050 | −0.0194 | 0.0286 | −7.772 | −15.5 | 0.612 |
| 0.00133 | 0.050026 | −0.0014 | 0.0572 | −7.574 | −1.0 | 0.644 |
| 0.00201 | 0.064485 | −0.0133 | 0.0973 | −7.532 | −6.6 | 0.683 |
| 0.00196 | 0.062153 | −0.0135 | 0.1333 | −7.506 | −6.9 | 0.720 |
| 0.00195 | 0.061758 | −0.0136 | 0.1663 | −7.485 | −7.0 | 0.755 |
| 0.00230 | 0.076802 | −0.0119 | 0.2021 | −7.387 | −5.2 | 0.796 |
| 0.00209 | 0.070194 | −0.0107 | 0.2322 | −7.301 | −5.1 | 0.833 |
| 0.00233 | 0.065202 | −0.0247 | 0.2631 | −7.435 | −10.6 | 0.865 |
| 0.00189 | 0.064567 | −0.0083 | 0.2864 | −7.339 | −4.4 | 0.896 |
| 0.00231 | 0.074273 | −0.0151 | 0.3130 | −7.309 | −6.5 | 0.931 |
Table A5.
The integral molar mixing enthalpy of Cu-Mg-Ti alloys—Series E. Calibration material: copper. Reference state: pure liquid elements.
Table A5.
The integral molar mixing enthalpy of Cu-Mg-Ti alloys—Series E. Calibration material: copper. Reference state: pure liquid elements.
| Number of Dropped Moles | Heat Effect | Drop Enthalpy | Mole Friction | Integral Molar Mixing Enthalpy | Partial Molar Enthalpy | Standard Uncertainties |
|---|---|---|---|---|---|---|
| [mol] | [kJ] | [kJ·mol−1] | [kJ·mol−1] | [kJ·mol−1] | [kJ·mol−1] | |
| (Cu0.95Ti0.05 )xMg1−x—series E Starting parameters: nCu = 0.02402 mol; K = 8.08·10−6 kJ·(μVs)−1; TD = 298 K; TM = 1400 K; = 43.8891 kJ·mol−1; = 42.5962 kJ·mol−1; = 46.7760 kJ·mol−1. Standard uncertainties of starting parameters: u(nCu) = 0.0000016 mol; u(nMg) = 0.0000041 mol; u(nTi) = 0.0000021 mol; u(TD) = 1 K; u(TM) = 1 K; u(K) = 2.13·10−7 kJ·(μVs)−1. | ||||||
| 0.00126 | 0.045992 | −0.013 | 0.0500 | −0.520 | −10.4 | 0.048 |
| 0.00157 | 0.027495 | −0.0395 | 0.0560 | −1.958 | −25.1 | 0.075 |
| 0.00141 | 0.032012 | −0.0279 | 0.1054 | −2.849 | −19.8 | 0.105 |
Table A6.
The integral molar mixing enthalpy of Cu-Mg-Ti alloys—Series F. Calibration material: titanium. Crucible material: ZrO2 + Y2O3. Standard states: pure elements.
Table A6.
The integral molar mixing enthalpy of Cu-Mg-Ti alloys—Series F. Calibration material: titanium. Crucible material: ZrO2 + Y2O3. Standard states: pure elements.
| Number of Dropped Moles | Heat Effect | Drop Enthalpy | Mole Friction | Integral Molar Mixing Enthalpy | Partial Molar Enthalpy | Standard Uncertainties |
|---|---|---|---|---|---|---|
| [mol] | [kJ] | [kJ·mol−1] | [kJ·mol−1] | [kJ·mol−1] | [kJ·mol−1] | |
| (Cu0.82Ti0.18)xMg1−x—series F Starting parameters: nTi = 0.022504 mol; nCu = 0.10420 mol; = −2.378 kJ·mol−1 [15]; K = 7.28·10−6 kJ·(μVs)−1; TD = 302 K; TM = 1400 K; = 43.7912 kJ·mol−1; = 42.5962 kJ·mol−1; = 30.4659 kJ·mol−1; = 46.6752 kJ·mol−1. Standard uncertainties of starting parameters: u(nCu) = 0.0000016 mol; u(nMg) = 0.0000041 mol; u(nTi) = 0.0000021 mol; u(TD) = 1 K; u(TM) = 1 K; u(K) = 1.68·10−7 kJ·(μVs)−1. | ||||||
| 0.00799 | 0.206374 | −0.1338 | 0.0593 | −3.230 | −16.4 | 1.529 |
| 0.00675 | 0.249292 | −0.0381 | 0.1042 | −3.346 | −5.7 | 1.570 |
Appendix B
Appendix B presents a tabular summary of the calculated integral and partial mixing enthalpies for the Cu–Mg–Ti liquid solutions for experimental cross-sections A–F (Table A7, Table A8, Table A9, Table A10, Table A11 and Table A12).
Table A7.
Calculated partial and integral function of the Cu-Mg-Ti alloys—Series A.
Table A7.
Calculated partial and integral function of the Cu-Mg-Ti alloys—Series A.
| [kJ·mol−1] | ||||||
|---|---|---|---|---|---|---|
| Series A (Cu0.90Mg0.10)1−xTix alloys at T = 1402 K | ||||||
| 0.900 | 0.100 | 0.000 | −0.715 | −33.602 | −9.892 | −4.004 |
| 0.855 | 0.095 | 0.050 | −0.854 | −32.582 | −8.972 | −4.274 |
| 0.810 | 0.090 | 0.100 | −1.142 | −30.608 | −8.200 | −4.500 |
| 0.720 | 0.080 | 0.200 | −2.110 | −24.057 | −6.965 | −4.837 |
| 0.630 | 0.070 | 0.300 | −3.543 | −14.503 | −5.963 | −5.036 |
| 0.540 | 0.060 | 0.400 | −5.430 | −2.559 | −5.032 | −5.098 |
| 0.450 | 0.050 | 0.500 | −7.823 | 11.096 | −4.076 | −5.003 |
| 0.360 | 0.040 | 0.600 | −10.836 | 25.722 | −3.064 | −4.710 |
| 0.270 | 0.030 | 0.700 | −14.644 | 40.519 | −2.025 | −4.156 |
| 0.180 | 0.020 | 0.800 | −19.485 | 54.625 | −1.055 | −3.259 |
| 0.090 | 0.010 | 0.900 | −25.655 | 67.119 | −0.307 | −1.914 |
| 0.000 | 0.000 | 1.000 | −33.511 | 77.020 | 0.000 | 0.000 |
Table A8.
Calculated partial and integral function of the Cu-Mg-Ti alloys—Series B.
Table A8.
Calculated partial and integral function of the Cu-Mg-Ti alloys—Series B.
| [kJ·mol−1] | ||||||
|---|---|---|---|---|---|---|
| Series B (Cu0.75Mg0.25)1−xTix alloys at T = 1270 K | ||||||
| 0.750 | 0.250 | 0.000 | −3.867 | −18.406 | −12.331 | −7.502 |
| 0.713 | 0.238 | 0.050 | −3.714 | −19.329 | −7.636 | −7.619 |
| 0.675 | 0.225 | 0.100 | −4.071 | −19.407 | −4.044 | −7.519 |
| 0.600 | 0.200 | 0.200 | −5.897 | −16.998 | 0.473 | −6.843 |
| 0.525 | 0.175 | 0.300 | −8.629 | −11.239 | 2.383 | −5.782 |
| 0.450 | 0.150 | 0.400 | −11.747 | −2.386 | 2.658 | −4.581 |
| 0.375 | 0.125 | 0.500 | −14.920 | 9.112 | 2.075 | −3.419 |
| 0.300 | 0.100 | 0.600 | −18.011 | 22.612 | 1.218 | −2.411 |
| 0.225 | 0.075 | 0.700 | −21.075 | 37.277 | 0.479 | −1.611 |
| 0.150 | 0.050 | 0.800 | −24.356 | 52.080 | 0058 | −1.003 |
| 0.075 | 0.025 | 0.900 | −28.293 | 65.799 | −0.040 | −0.513 |
| 0.000 | 0.000 | 1.000 | −33.511 | 77.020 | 0.000 | 0.000 |
Table A9.
Calculated partial and integral function of the Cu-Mg-Ti alloys—Series C.
Table A9.
Calculated partial and integral function of the Cu-Mg-Ti alloys—Series C.
| [kJ·mol−1] | ||||||
|---|---|---|---|---|---|---|
| Series C (Cu0.60Mg0.40)xTi1−x alloys at T = 1274 K | ||||||
| 0.600 | 0.400 | 0.000 | −8.161 | −9.295 | −17.963 | −8.615 |
| 0.570 | 0.380 | 0.050 | −8.024 | −10.054 | −9.048 | −8.846 |
| 0.540 | 0.360 | 0.100 | −8.685 | −10.421 | −2.244 | −8.666 |
| 0.480 | 0.320 | 0.200 | −11.646 | −9.557 | 6.203 | −7.408 |
| 0.420 | 0.280 | 0.300 | −15.725 | −6.063 | 9.517 | −5.447 |
| 0.360 | 0.240 | 0.400 | −19.930 | 0.374 | 9.512 | −3.280 |
| 0.300 | 0.200 | 0.500 | −23.595 | 9.740 | 7.673 | −1.294 |
| 0.240 | 0.160 | 0.600 | −26.385 | 21.691 | 5.157 | 0.232 |
| 0.180 | 0.120 | 0.700 | −28.290 | 35.557 | 2.794 | 1.130 |
| 0.120 | 0.080 | 0.800 | −29.628 | 50.339 | 1.085 | 1.340 |
| 0.060 | 0.040 | 0.900 | −31.044 | 64.712 | 0.205 | 0.910 |
| 0.000 | 0.000 | 1.000 | −33.511 | 77.020 | 0.000 | 0.000 |
Table A10.
Calculated partial and integral function of the Cu-Mg-Ti alloys—Series D.
Table A10.
Calculated partial and integral function of the Cu-Mg-Ti alloys—Series D.
| [kJ·mol−1] | ||||||
|---|---|---|---|---|---|---|
| Series D (Cu0.50Mg0.50)xTi1−x alloys at T = 1172 K | ||||||
| 0.500 | 0.500 | 0.000 | −11.000 | −5.792 | −19.539 | −8.396 |
| 0.475 | 0.475 | 0.050 | −11.562 | −5.774 | −8.540 | −8.662 |
| 0.450 | 0.450 | 0.100 | −12.942 | −5.731 | −0.173 | −8.420 |
| 0.400 | 0.400 | 0.200 | −17.252 | −4.902 | 10.111 | −6.839 |
| 0.350 | 0.350 | 0.300 | −22.372 | −2.210 | 13.963 | −4.415 |
| 0.300 | 0.300 | 0.400 | −27.141 | 3.038 | 13.638 | −1.776 |
| 0.250 | 0.250 | 0.500 | −30.798 | 11.139 | 10.989 | 0.580 |
| 0.200 | 0.200 | 0.600 | −32.976 | 21.994 | 7.474 | 2.288 |
| 0.150 | 0.150 | 0.700 | −33.708 | 35.103 | 4.155 | 3.118 |
| 0.100 | 0.100 | 0.800 | −33.423 | 49.573 | 1.692 | 2.968 |
| 0.050 | 0.050 | 0.900 | −32.949 | 64.108 | 0.351 | 1.874 |
| 0.000 | 0.000 | 1.000 | −33.511 | 77.020 | 0.000 | 0.000 |
Table A11.
Calculated partial and integral function of the Cu-Mg-Ti alloys—Series E.
Table A11.
Calculated partial and integral function of the Cu-Mg-Ti alloys—Series E.
| [kJ·mol−1] | ||||||
|---|---|---|---|---|---|---|
| Series E (Cu0.95Ti0.05)xMg1−x alloys at T = 1400 K | ||||||
| 0.950 | 0.000 | 0.050 | 0.010 | −43.562 | −14.233 | −0.702 |
| 0.903 | 0.050 | 0.048 | −0.322 | −37.737 | −10.914 | −2.696 |
| 0.855 | 0.100 | 0.045 | −0.896 | −32.240 | −8.922 | −4.391 |
| 0.760 | 0.200 | 0.040 | −2.730 | −22.547 | −8.111 | −6.909 |
| 0.665 | 0.300 | 0.035 | −5.311 | −14.862 | −9.986 | −8.340 |
| 0.570 | 0.400 | 0.030 | −8.359 | −9.211 | −12.509 | −8.824 |
| 0.475 | 0.500 | 0.025 | −11.586 | −5.371 | −13.512 | −8.527 |
| 0.380 | 0.600 | 0.020 | −14.800 | −2.961 | −10.794 | −7.616 |
| 0.285 | 0.700 | 0.015 | −17.998 | −1.542 | −2.219 | −6.242 |
| 0.190 | 0.800 | 0.010 | −21.463 | −0.714 | 14.189 | −4.507 |
| 0.095 | 0.900 | 0.005 | −25.861 | −0.212 | 40.147 | −2.446 |
| 0.000 | 1.000 | 0.000 | −32.338 | 0.000 | 77.020 | 0.000 |
Table A12.
Calculated partial and integral function of the Cu-Mg-Ti alloys—Series F.
Table A12.
Calculated partial and integral function of the Cu-Mg-Ti alloys—Series F.
| [kJ·mol−1] | ||||||
|---|---|---|---|---|---|---|
| Series F (Cu0.82Ti0.18)xMg1−x alloys at T = 1400 K | ||||||
| 0.822 | 0.000 | 0.178 | −0.034 | −30.556 | −14.069 | −2.527 |
| 0.781 | 0.050 | 0.169 | −1.032 | −28.577 | −9.754 | −3.881 |
| 0.740 | 0.100 | 0.160 | −2.017 | −25.984 | −6.397 | −5.114 |
| 0.658 | 0.200 | 0.142 | −4.251 | −19.839 | −2.253 | −7.085 |
| 0.576 | 0.300 | 0.124 | −7.132 | −13.550 | −0.752 | −8.264 |
| 0.493 | 0.400 | 0.107 | −10.751 | −8.059 | −0.605 | −8.594 |
| 0.411 | 0.500 | 0.089 | −14.969 | −3.886 | −0.196 | −8.115 |
| 0.329 | 0.600 | 0.071 | −19.477 | −1.194 | 2.357 | −6.956 |
| 0.247 | 0.700 | 0.053 | −23.873 | 0.136 | 9.131 | −5.308 |
| 0.164 | 0.800 | 0.036 | −27.725 | 0.442 | 22.328 | −3.414 |
| 0.082 | 0.900 | 0.018 | −30.641 | 0.208 | 44.207 | −1.548 |
| 0.000 | 1.000 | 0.000 | −32.338 | 0.000 | 77.020 | 0.000 |
References
- Besisa, N.H.A.; Yajima, T. Titanium-Based Alloys: Classification and Diverse Applications. In Titanium-Based Alloys—Characteristics and Applications; IntechOpen: London, UK, 2024. [Google Scholar]
- Mahmoudi, P.; Akbarpour, M.R.; Lakeh, H.B.; Jing, F.; Hadidi, M.R.; Akhavan, B. Antibacterial Ti–Cu Implants: A Critical Review on Mechanisms of Action. Mater. Today Bio 2022, 17, 100447. [Google Scholar] [CrossRef]
- Wang, Z.; Fu, B.; Wang, Y.; Dong, T.; Li, J.; Li, G.; Zhao, X.; Liu, J.; Zhang, G. Effect of Cu Content on the Precipitation Behaviors, Mechanical and Corrosion Properties of As-Cast Ti-Cu Alloys. Materials 2022, 15, 1696. [Google Scholar] [CrossRef] [PubMed]
- Soffa, W.A.; Laughlin, D.E. High-Strength Age Hardening Copper-Titanium Alloys: Redivivus. Prog. Mater. Sci. 2004, 49, 347–366. [Google Scholar] [CrossRef]
- Saito, K.; Suzuki, M.; Hayasaka, Y.; Takenaka, K.; Semboshi, S. Effect of Magnesium Doping on Discontinuous Precipitation in Age-Hardenable Copper–Titanium Alloys. Mater. Charact. 2022, 189, 111911. [Google Scholar] [CrossRef]
- Mezbahul-Islam, M.; Mostafa, A.O.; Medraj, M. Essential Magnesium Alloys Binary Phase Diagrams and Their Thermochemical Data. J. Mater. 2014, 2014, 704283. [Google Scholar] [CrossRef]
- Baran, A.; Polański, M. Magnesium-Based Materials for Hydrogen Storage-A Scope Review. Materials 2020, 13, 3993. [Google Scholar] [CrossRef] [PubMed]
- Wang, H.; Li, J.; Wei, X.; Zheng, Y.; Yang, S.; Lu, Y.; Ding, Z.; Luo, Q.; Li, Q.; Pan, F. Thermodynamic and Kinetic Regulation for Mg-Based Hydrogen Storage Materials: Challenges, Strategies, and Perspectives. Adv. Funct. Mater. 2024, 34, 2406639. [Google Scholar] [CrossRef]
- Sheppard, D.A. Hydrogen Storage Studies of Mesoporous and Titanium Based Materials. Ph.D. Thesis, Curtin University of Technology, Bentley, Australia, 2008. [Google Scholar]
- Gozdur, W.; Gierlotka, W.; Gąsior, W.; Bieda, M.; Góral, A.; Budziak, A.; Pęska, M.; Dębski, A. The Copper-Magnesium System: Calorimetric Studies and Phase Diagram Calculations. J. Magnes. Alloys 2025. [Google Scholar] [CrossRef]
- Nayeb-Hashemi, A.A.; Clark, J.B. The Cu-Mg (Copper-Magnesium) System. Bull. Alloy Phase Diagr. 1984, 5, 36–43. [Google Scholar] [CrossRef]
- Predel, B. Cu-Mg (Copper-Magnesium). In Cr-Cs–Cu-Zr; Madelung, O., Ed.; Springer: Berlin/Heidelberg, Germany, 1994; Volume 5D, pp. 1–7. [Google Scholar]
- Sommer, F.; Lee, J.J.; Predel, B. Calorimetric Investigations of Liquid Alkaline Earth Metal Alloys. In Berichte der Bunsengesellschaft Für Physikalische Chemie; Wiley-VCH: Weinheim, Germany, 1983; Volume 153, pp. 792–797. [Google Scholar] [CrossRef]
- Batalin, G.I.; Sudavtsova, V.S.; Mikhailovskaya, M.V. Thermodynamic Properties of Liquid Alloys of the Cu-Mg Systems. Izv. V. U. Z. Tsvetn. Metall. 1987, 2, 29–31. [Google Scholar]
- Gierlotka, W.; Gozdur, W.; Gąsior, W.; Pęska, M.; Polański, M.; Dębski, A. On the Cu-Ti System: Ab Initio Calculations, Calorimetric Studies and Phase Diagram. J. Alloys Compd. 2025, 1036, 181749. [Google Scholar] [CrossRef]
- Murray, J.L. The Cu–Ti (Copper-Titanium) System. Bull. Alloy Phase Diagr. 1983, 4, 81–95. [Google Scholar] [CrossRef]
- Predel, B. Cu-Ti (Copper-Titanium). In Landolt Börnstein; Springer Nature: Heidelberg, Germany, 2012; Volume 12B, pp. 268–269. [Google Scholar]
- Yokokawa, H.; Kleppa, O.J. Thermochemistry of Liquid Alloys of Transition Metals II. (Copper + Titanium) at 1372 K. J. Chem. Thermodyn. 1981, 13, 703–715. [Google Scholar] [CrossRef]
- Kleppa, O.J.; Watanabe, S. Thermochemistry of Alloys of Transition Metals: Part III. Copper-Silver, -Titanium, Zirconium, and -Hafnium at 1373 K. Metall. Trans. B 1982, 13, 391–401. [Google Scholar] [CrossRef]
- Turchanin, M.A.; Agraval, P.G.; Fesenko, A.N.; Abdulov, A.R. Thermodynamics of Liquid Alloys and Metastable Phase Transformations in the Copper—Titanium System. Powder Metall. Met. Ceram. 2005, 44, 259–270. [Google Scholar] [CrossRef]
- Murray, J.L. The Mg-Ti (Magnesium-Titanium) System. Bull. Alloy Phase Diagr. 1986, 7, 245–247. [Google Scholar] [CrossRef]
- Rokhlin, L.; Bochvar, N. Cu-Mg-Ti (Copper—Magnesium—Titanium). In Light Metal Systems. Part 4; Effenberg, G., Ilyenko, S., Eds.; MSI Publishing: Assam, India, 2006; Volume 11A4, pp. 248–251. [Google Scholar]
- Gozdur, W.; Gąsior, W.; Zrobek, M.; Budziak, A.; Dębski, R.; Gierlotka, W.; Pęska, M.; Polański, M.; Dębski, A. Calorimetric Studies and Thermodynamic Modeling of Ag–Mg–Ti Liquid Alloys. Materials 2024, 17, 1786. [Google Scholar] [CrossRef]
- Dinsdale, A.T. SGTE Data for Pure Elements. Calphad 1991, 15, 317–425. [Google Scholar] [CrossRef]
- Kohler, F. Zur Berechnung Der Thermodynamischen Daten Eines Ternären Systems Aus Den Zugehörigen Binären. Monatsh. Chem. 1960, 91, 738–740. [Google Scholar] [CrossRef]
- Muggianu, Y.-M.; Gambino, M.; Bros, J.-P. Enthalpies de Formation Des Alliages Liquides Bismuth-Étain-Gallium à 723 k. Choix d’une Représentation Analytique Des Grandeurs d’excès Intégrales et Partielles de Mélange. J. Chim. Phys. 1975, 72, 83–88. [Google Scholar] [CrossRef]
- Toop, G.W. Predicting Ternary Activities Using Binary Data. Trans. TMS-AIME 1965, 223, 850–855. [Google Scholar]
- Bonnier, E.; Caboz, R. Sur Lestimation de Lenthalpie Libre de Melange de Certains Alliages Metalliques Liquides Ternaires. Compt. Rend. 1960, 259, 527–529. [Google Scholar]
- Hillert, M. Empirical Methods of Predicting and Representing Thermodynamic Properties of Ternary Solution Phases. Calphad 1980, 4, 1–12. [Google Scholar] [CrossRef]
- Redlich, O.; Kister, A.T. Algebraic Representation of Thermodynamic Properties and the Classification of Solutions. Ind. Eng. Chem. 1948, 40, 345–348. [Google Scholar] [CrossRef]
Disclaimer/Publisher’s Note: The statements, opinions and data contained in all publications are solely those of the individual author(s) and contributor(s) and not of MDPI and/or the editor(s). MDPI and/or the editor(s) disclaim responsibility for any injury to people or property resulting from any ideas, methods, instructions or products referred to in the content. |
© 2025 by the authors. Licensee MDPI, Basel, Switzerland. This article is an open access article distributed under the terms and conditions of the Creative Commons Attribution (CC BY) license.