Abstract
During drill-and-blast construction, complex and variable rock masses are frequently encountered. Owing to the transient nature of the explosion process and the randomness of crack propagation, the response of different rock masses to explosive loading is highly intricate. This study primarily investigates the dynamic response of rock masses with varying strengths under two different charge configurations. First, four cement mortar specimens of differing strengths were prepared then subjected to general blasting and slit charge blasting, respectively. High-speed cameras and digital image correlation techniques were employed to capture and analyse stress wave propagation and crack propagation during detonation. Fractal dimension analysis was subsequently employed to quantify and compare the extent of damage in the specimens. Findings indicate that rock strength influences stress wave attenuation patterns: lower-strength rocks exhibit higher peak strains but faster decay rates. Crack propagation velocity was calculated by deploying monitoring points along fracture paths and defining fracture initiation thresholds. Higher rock strength correlates with both peak and average crack propagation velocities. Slit charge blasting effectively optimizes damage distribution, concentrating it within the intended directions while reducing chaotic fracturing. These findings provide scientific justification for blasting operations in complex rock formations.
1. Introduction
As a traditional and effective construction method, the drilling and blasting method is widely used in coal mining [1,2,3] and tunnel excavation [4,5,6] projects. The variability of engineering conditions necessitates the design of specific blasting parameters for rocks of different strengths. The blasting design is crucial for engineering construction. An optimal design can significantly improve tunneling efficiency and reduce costs [7,8]. In engineering practice, in order to maximize the use of blasting energy for directional fracture of rock mass, slit cartridge blasting is often used. Variations in rock strength inevitably influence the efficacy of directional fracture. The strength change of rock and the charge structure of explosive are two main factors affecting the blasting effect. Numerous scholars and field engineers have investigated these two factors to optimize blasting outcomes. Liu [9] analyzed the mechanism and effect of rock breaking by closed blasting through experimental methods. It was found that the fracture of surrounding rock under closed blasting conditions was the result of the pre-splitting effect of shock wave and stress wave on the rock and the continuous expansion crack enhancement of closed medium. The fracture development model of surrounding rock under closed blasting conditions was established. Peng [10] conducted a crater blasting experiment on sandstone using explosives to study the effect of high stress on rock blasting. The experimental results show that the stress state of surrounding rock changes the crack initiation mode, crack propagation characteristics, and crack distribution. Si [11] analyzed the quantitative relationship between biaxial in situ stress and blasting pit parameters (diameter, area, volume) and found that biaxial static stress has always been the formation of radial cracks, which promotes the formation of circumferential cracks and leads to the delay of initial crack formation time. Silva [12] synthesises existing research methodologies to propose an approach for assessing damage caused by explosions, thereby providing a basis for the safe design of slope blasting operations. Wang [13] studied the effect of surrounding rock on the failure mode of granite specimens by repeated explosion experiments. The experimental results show that the explosion cracks mainly propagate along the direction of the maximum principal stress, and the repeated explosion load in the direction of the minimum principal stress has little contribution to the rock failure. The above research is mainly aimed at the blasting situation in a specific rock, or the use of numerical simulation to study the response of rock with different strength under the action of explosion, but there are few reports on the study of blasting cracks in different strength rock.
In the process of blasting, in order to produce longer cracks to achieve the effect of directional fracture, it is often used to use slit cartridge blasting, shaped cartridge blasting, or grooving blasting [14,15,16]. In essence, the above three methods change the direction of energy release in the early stage of explosion to achieve the purpose of controlling the fracture zone: (1) The grooving blasting is mainly to use mechanical tools to preferentially slit at the predetermined fracture position of the hole wall, so that the crack is preferentially formed and expanded at the notch, but the slitting on the deep hole wall is limited by the mechanical tools [17,18]. (2) Shaped charge blasting is to change the shape of the explosive by using the shaped charge cover so as to control the energy flow direction of the explosive, but the production of the shaped charge cover is complicated, and the on-site installation is difficult [19]. (3) The slit cartridge blasting is to set a slit tube on the outer side of the cartridge so that the explosion energy is concentrated in the slit direction, thereby changing the pressure distribution of the explosion product on the hole wall and preferentially generating cracks in the slit direction. Owing to their ease of manufacture and transport, slit tubes are more amenable to on-site automation [20,21,22]. Therefore, it is widely used in blasting operations in tunnel engineering, coal engineering, and other fields.
Most of the aforementioned studies have focused on blasting within a single rock type, failing to account for the influence of rock strength variations. Furthermore, there has been relatively little comparative analysis of blasting damage and directional crack propagation across different rock formations. To investigate the influence of charge structure on blasting effects in rocks of varying strengths, this study employed cement mortar as the experimental material. By controlling the cement–sand ratio, rock-like specimens of different strengths were prepared. Using a high-speed camera and digital image correlation (DIC) technique, the dynamic response of rocks with different strengths under high blasting load rates was experimentally studied. Building upon these findings, slit charges were introduced into blasting operations on rock masses of varying strengths to investigate crack propagation characteristics and damage distribution patterns during general and slit charge blasting. This research provides both theoretical and experimental foundations for the application of slit charges in engineering fields, offering significant guidance for practical implementation.
2. Experimental System and Materials
2.1. Experimental System
As an optical measurement method for accurate measurement of full-field strain, the digital image correlation method has been maturely applied to the experimental study of statics and impact dynamics [23]. Combined with high-speed photography technology and the digital image correlation method, a set of ultra-high-speed digital image correlation experimental system suitable for the study of ultra-dynamic problems, such as blasting, is established, as shown in Figure 1. The main components of the experimental system include a high-speed camera, lighting system, synchronous control system and detonation system, explosive loading device, and digital image correlation calculation software [24,25]. The introduction of related components is as follows:
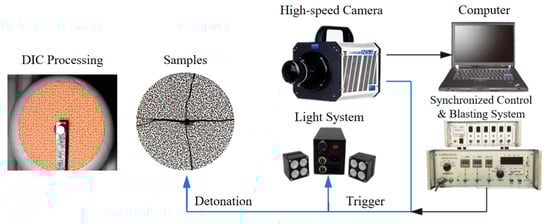
Figure 1.
Experimental system of the high-speed digital image correlation.
- (1)
- High-speed camera: The camera model was ACS-1 M60 (NAC Image Technology, Tokyo, Japan), and the resolution is 1280 pixel × 896 pixel. The highest shooting frequency can reach 220,000 fps, that is, the minimum time interval between two adjacent photos can reach 4.54 μs.
- (2)
- Illumination system: The lighting system includes two DannyU high-speed cameras with highlight flashless LED light source U-40T (DannyU), and an external power supply [26]. The full-bright mode can be continuously turned on for more than 72 h and has the function of adjusting the light intensity.
- (3)
- Synchronous control and detonation system: The synchronous controller can realize the orderly control of the high-speed camera and the pulse initiator so as to ensure that the high-speed camera can capture the whole explosion process of the specimen.
- (4)
- Detonation device: The detonation device, developed by the University of Science and Technology Beijing, can instantaneously release a voltage of 2000 volts at its tip, capable of igniting black powder.
- (5)
- Digital image correlation calculation software: The VIC-2D software (VIC-2D 7) is used to calculate the digital image correlation through the standardized square difference correlation function. The software has a strong sensitivity to the brightness change of the shooting field of view and has low sensitivity to brightness of the experimental light field and can automatically calibrate the graphics scaling factor to ensure the optimization of the calculation process. In the computational system, the subset was selected as 17, and the step was selected as 7.
2.2. Specimen Preparation
In rock blasting model experiments, cement mortar is widely employed as a material with adjustable strength. Extensive experimental and theoretical validation demonstrates that cement mortar specimens accurately reflect the failure characteristics and dynamic fracture behaviour of rock masses [27]. Consequently, cement mortar was selected for fabricating the experimental specimens in this study. Four cement mortar specimens of varying strengths were designed (cement-to-sand ratios of 1:3, 1:4, 1:5, and 1:6), with their fundamental physical and mechanical properties detailed in Table 1.

Table 1.
Physical and mechanical parameters of samples.
Circular specimens were selected due to their ease of preparation and superior retention of isotropic properties during blasting. The specimens measured 260 mm in diameter by 60 mm in height. The blast hole, centred within the specimen, had a diameter of 8 mm and a depth of 40 mm.
This hole comprised a charging section and a plugging section: the charging section measured 6 mm in diameter and 30 mm in length, while the plugging section measured 8 mm in diameter and 10 mm in length. For the slit charge blasting tests, a slit tube was installed in the charging section. The tube had an external diameter of 8 mm, an internal diameter of 6 mm, and a length of 30 mm. The slit measured 26 mm in length and 1 mm in width, positioned centrally within the slit tube, as illustrated in Figure 2.
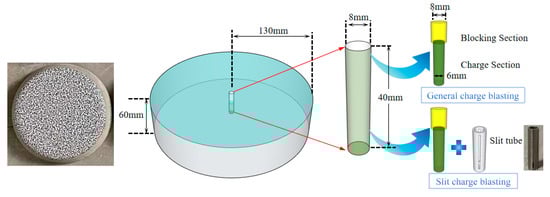
Figure 2.
Blasting samples.
The specific experimental procedure is as follows: (1) Charging: The charging section measures 30 mm in length and 6 mm in diameter, loaded with 300 mg of black powder. For slit blasting, an additional slit tube is installed. The probe is then inserted into the explosive charge. (2) Sealing: The sealing section measures 10 mm in length and 8 mm in diameter, sealed using fine sand and 502 adhesives. Subsequently, fixtures were used to perform secondary sealing of the borehole to prevent the premature escape of powder fumes, which could compromise the field of view. (3) Wiring: Connect the probe to the detonator, sealing the junction with insulating tape. (4) Detonation: Employ a synchronisation controller to trigger detonators whilst simultaneously activating high-speed cameras for synchronised recording. (5) Post-processing: As photographs are in 8-bit pixel format, VIC-2D software may be utilised for computational analysis of experimental imagery.
3. General Charge Blasting
The attenuation law of stress waves in rock mass with different strengths is studied. Firstly, ordinary charge is used to detonate in cement mortar with different strengths. The explosive was selected as black gunpowder, and the detonation charge was controlled to be 2 g each time. Each group of experiments was repeated three times to ensure the repeatability of the experimental results. Figure 3 is the physical picture of two kinds of rock strength after explosion damage. Due to the limitation of specimen size, the specimen after a single hole failure can be divided into two areas: the crushing area and the fracture area. Due to the different responses of rock mass with different strengths to the explosion force, the damage degree of the crushing zone and the crack distribution of the fracture zone are different.
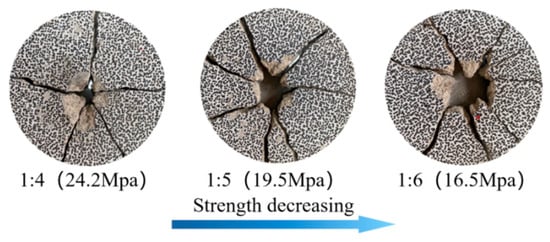
Figure 3.
Failure diagram of general charge blasting specimen.
Comparing the crushing area of the specimen with the weakening of the rock strength, the area of the central crushing area gradually increases; the fracture zone of the specimen was compared. When the rock strength was 24.2 MPa, there were five main cracks in the specimen. When the rock strength is 19.5 MPa, seven main cracks are generated in the specimen.
3.1. Strain Field Analysis of General Charge Blasting
Figure 4 shows the contour maps of the radial strain evolution of the specimen with the explosion loading, and the time of 0 is the detonation time of the explosive. Firstly, the explosion cloud diagram when the rock strength is 19.5 MPa is analyzed. It can be seen from the cloud diagram that when t = 27.27 μs, there is stress concentration near the borehole. With the continuous action of explosion stress wave and detonation gas, the strain gradually expands to the boundary, and the distribution of strain is symmetrical. When t = 45.45 μs, part of the explosive gas carrying dust escapes from the blocking head, affecting the small range of sight near the borehole. When t = 63.637 μs, a large amount of dust escapes, resulting in the loss of image correlation in that area. Although the digital image correlation calculation for the area near the borehole was compromised, it did not affect the analysis of other regions. In different rock strengths, the distribution state and transmission process of strain are basically the same. In order to further analyze the difference in its attenuation law and study the response of rock strength to explosion, nine monitoring points are selected from a position of 30 mm away from the borehole with an interval of 5 mm, and the radial strain near the point is extracted for separate analysis.
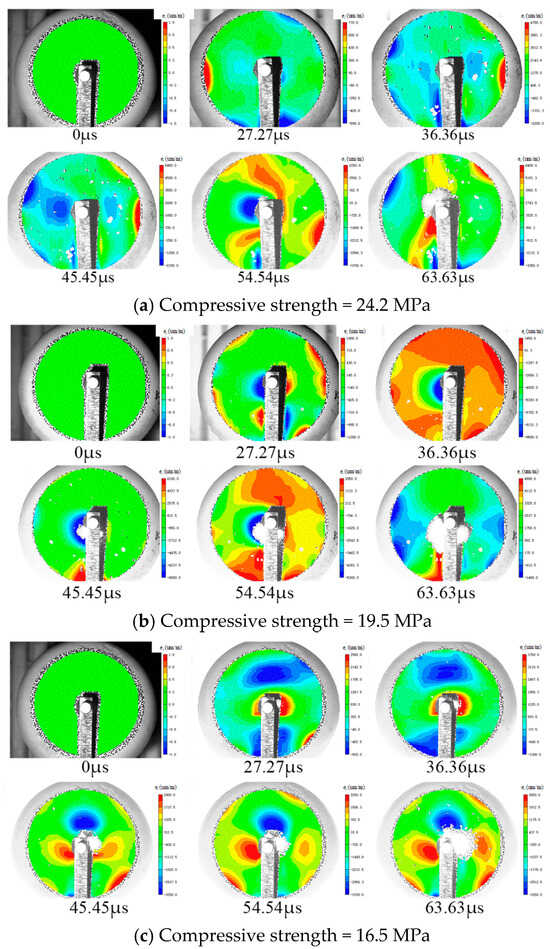
Figure 4.
Radial strain field of general charge blasting.
3.2. Stress Wave Attenuation of General Charge Blasting
In Figure 5a, compressive strain begins to appear at t = 60 μs. At t = 185 μs, the strain reaches its peak, after which radial strain begins to rebound at a faster rate than during the compression phase. In Figure 5b, compressive strain begins at t = 50 μs. The strain peaks at t = 115 μs, and the first monitoring point fails 5 μs later. The rebound rate of radial strain is faster than that during the compression phase. Near t = 150 μs, radial strain transitions from compressive to tensile. In Figure 5c, compressive strain begins to appear at t = 60 μs. At t = 185 μs, the strain reaches its peak, after which radial strain begins to rebound. The rebound rate is faster than that of the compression phase. For lower-strength rock, the strain rate was lower, but the peak radial strain was higher (9985 με). Conversely, higher-strength rock exhibited a higher strain rate but a lower peak radial strain (5102 με).
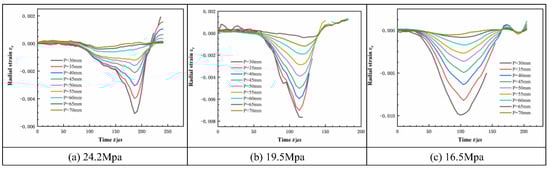
Figure 5.
Radial strain time history curve of general charge blasting.
Extract the peak strain values from each monitoring point and fit them to curves using exponential functions. As shown in Figure 6, the correlation coefficients R2 all exceed 0.93, indicating that the exponential function effectively describes the variation pattern of peak strain. Regarding the strain decay trend, specimens with lower strength exhibit higher overall peak strain values, while the radial strain from the explosive stress wave decays more rapidly. The black curve represents rock with a strength of 16.5 MPa, exhibiting an attenuation index of −2.64; the red curve denotes rock with a strength of 19.5 MPa, showing an attenuation index of −2.19; the blue curve corresponds to rock with a strength of 24.3 MPa, displaying an attenuation index of −2.15. A decrease in material strength is associated with a reduction in bulk density, which corresponds to a lower proportion of solid material and a higher proportion of pores (and any moisture) within the same volume. Gases manifest as voids within the rock mass, obstructing the propagation of explosive stress waves, while liquids cause a delay effect. The combined influence results in faster attenuation of explosive stress waves within rock masses of lower strength.
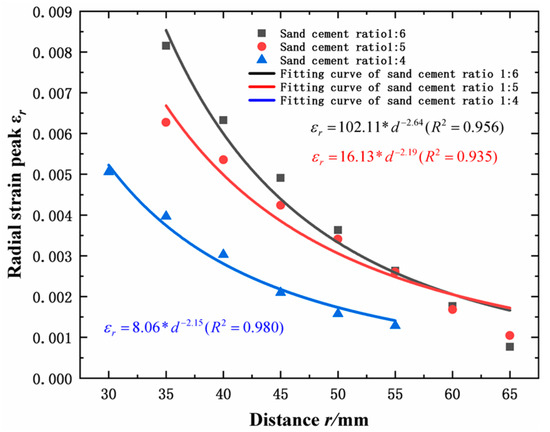
Figure 6.
Peak strain of general charge blasting.
3.3. Rock Damage Analysis of General Charge Blasting
The degree of damage in rock masses is one of the key ways they respond to explosive loads. Combining fractal theory, we analyze the crack distribution patterns in the crushing zone and crack zone during blasting of rocks with varying strengths. To accurately assess rock damage, the test specimens were divided into zones. Due to specimen size constraints, the rock mass was divided into two zones: the crushing zone and the crack zone. The outer contours of the crushing and fracture zones were extracted and subjected to binarization processing. The damage in each zone was then studied separately, as illustrated in Figure 7. The region exhibiting pervasive fragmentation is defined as the crushing zone, whereas the remaining area containing only fractures is termed the crack zone.
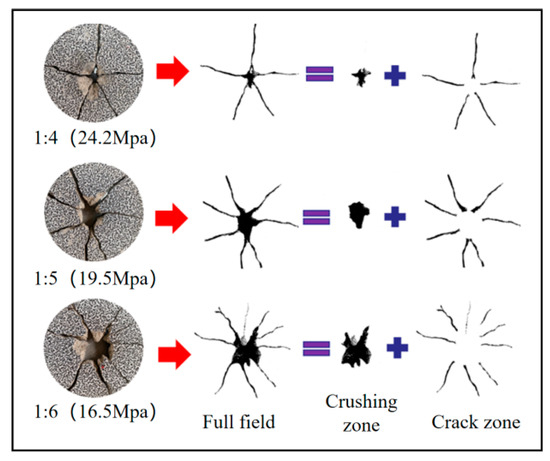
Figure 7.
Binarization Processing (general charge blasting).
The fractures generated by explosions exhibit distinct fractal characteristics, which can be characterised by fractal dimension. Traditional fractal dimensions include similarity dimension, box-counting dimension, and information dimension. Given that the box-counting dimension method possesses a straightforward mathematical expression and can intuitively reflect the extent of crack occupancy, this paper employs this method to investigate the fractal dimension of explosion fractures.
The principle of this method involves covering the image with squares of side length δ, counting the number N(δ) of squares containing the target region/black region, then progressively reducing the square size δ. As δ approaches zero, the condition given by Equation (1) holds, where D is the fractal dimension.
Throughout the processing of this paper, the square side length δ was restricted to positive integer values. Subsequently, N(δ) was calculated for different δ values, and after taking its logarithm, fitting was performed in a double-logarithmic coordinate system (Equation (2)).
Based on the aforementioned methodology, MATLAB (2023a) programming was employed to analyse the binarised images of different regions (Figure 8), thereby obtaining the fractal dimension for each computational region.
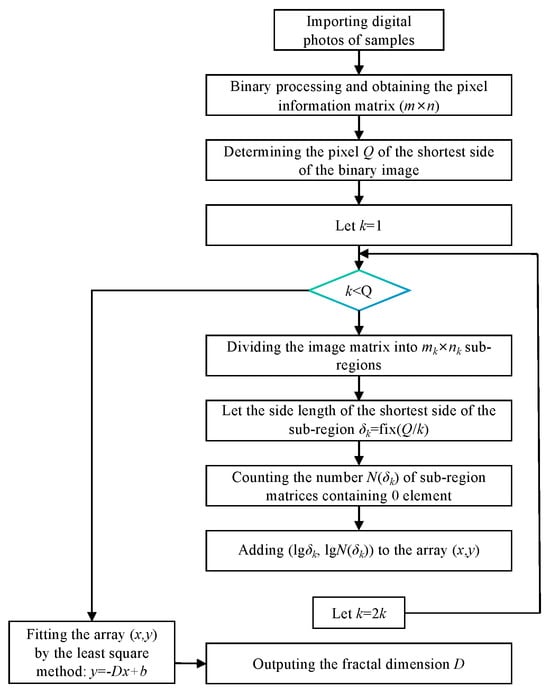
Figure 8.
Flow chart for the calculation of fractal dimension using MATLAB.
By calculating the slope, the fractal dimensions of different zones were determined (Figure 9). Comparison revealed that the fractal dimension of crushing zone > fractal dimension of the full field > fractal dimension of the crack zone. The fractal dimension exhibits a positive correlation with damage. As rock strength decreases, the fractal dimension of the crushing zone gradually increases, while that of the crack zone gradually decreases.
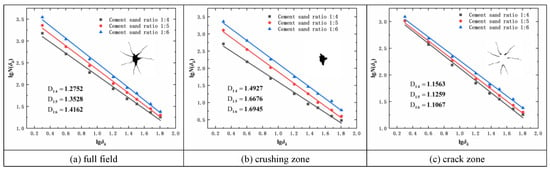
Figure 9.
Fractal Dimension Calculation (general charge blasting).
4. Slit Charge Blasting
Figure 10 shows the failure of rock mass with different strengths after using a slit charge. The radial direction is the energy-gathering direction of the slit charge. It can be seen from the test piece after blasting that the use of slit charge in different rocks can produce a better directional fracture effect, but two cracks are also symmetrically generated perpendicular to the energy gathering direction. Comparative analysis indicates that the directional fracturing effect of the slit charge is more pronounced in higher-strength rock masses.
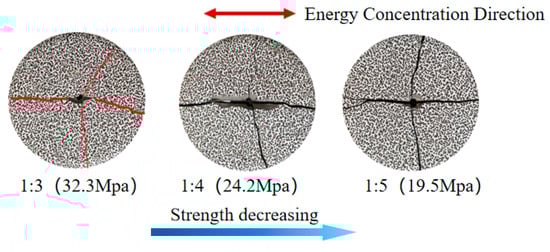
Figure 10.
Slit charge blasting samples.
4.1. Strain Field Analysis of Slit Charge Blasting
Comparing the principal strain distributions of the two specimens, as shown in Figure 11, the specimen with lower strength exhibits larger peak strains. During crack propagation, the boundaries of the strain contour map in the crack tip region are more distinct. In contrast, the specimen with higher strength shows smaller peak strains, and the boundaries of the strain contour map around the crack propagation path appear relatively blurred. Comparing high-speed camera images with the final failure modes of the specimens reveals that cracks initially propagate outward from the energy-focusing direction of the slit tube. After propagating a certain distance, a pair of cracks appears symmetrically perpendicular to the slit direction, termed secondary cracks. In higher-strength specimens, secondary cracks initiated earlier.
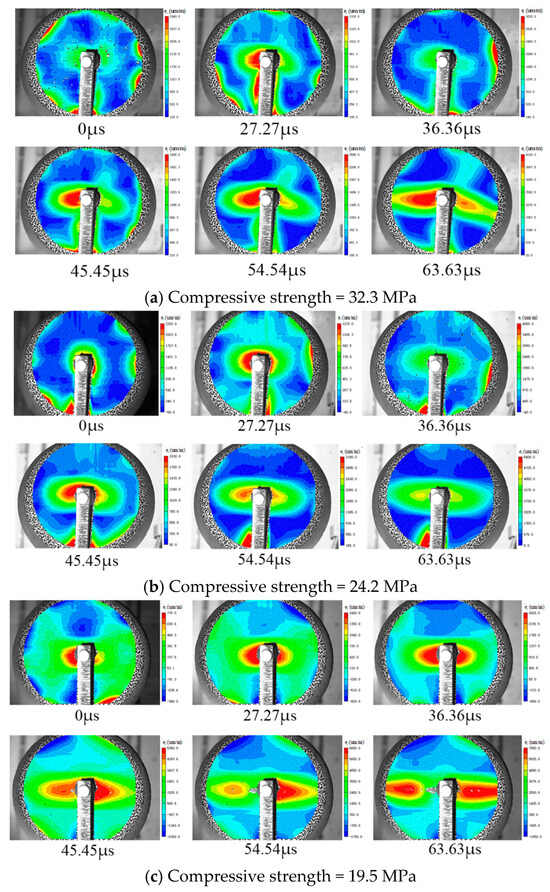
Figure 11.
Radial strain field of slit charge blasting.
4.2. Crack Propagation Velocity Analysis
The fundamental cause of crack initiation in brittle materials lies in the emergence of strain inconsistencies within the continuous medium. When the tensile strain of the material exceeds its ultimate strain limit, cracking occurs. Consequently, crack propagation can be assessed by determining whether the material has reached its fracture strain. Six paired monitoring points (Figure 12), designated G1–G6, were positioned along the crack propagation path at 1 cm intervals, with monitoring point G1 located 2 cm from the blast hole.
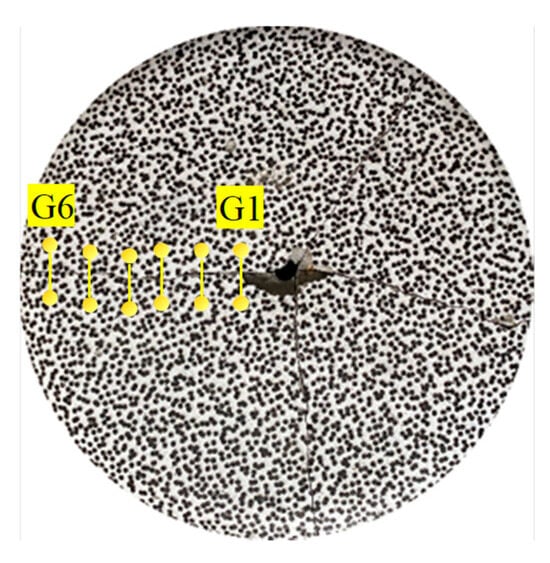
Figure 12.
Location of strain monitoring points.
As shown in Figure 13, during the initial loading phase, the tensile strain at the six monitoring points did not increase significantly, remaining essentially zero, indicating that cracks had not propagated at this stage. As the explosive effect intensified, the explosive gases drove the development of microcracks. The tensile strain at the monitoring point (G-1) near the blast hole gradually increased, though at a very slow rate. At this stage, tensile strain exhibits non-linear growth. When the principal strain at the crack tip reaches the ultimate cracking strain that the specimen can withstand, crack propagation commences. From this point, tensile strain follows a linear variation pattern. Consequently, the “inflection point” where tensile strain transitions from non-linear to linear behaviour is defined as the material’s cracking strain.
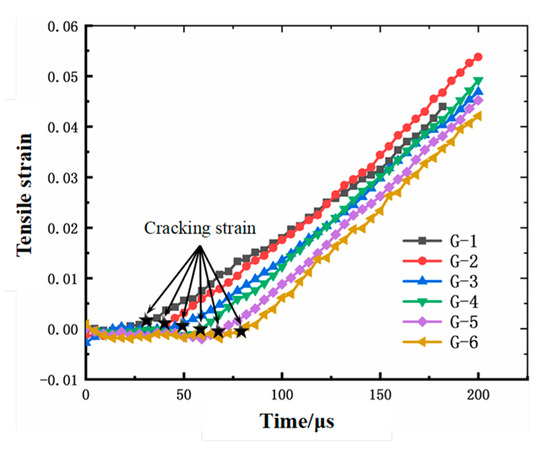
Figure 13.
Determination of initiation strain in specimen.
Using the methodology described in the preceding section, the propagation velocity of directional cracks was calculated for three rock masses of differing strengths. The corresponding tensile strain time history curves are presented in Figure 14. It can be observed that the tensile strain at different measurement points evolves sequentially, and the tensile strain curves for rock masses of varying strengths exhibit similarities.
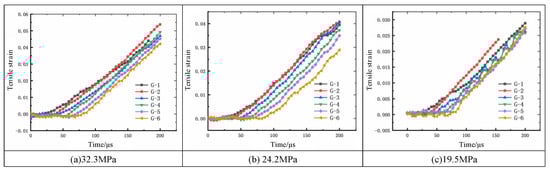
Figure 14.
Tensile strain curves of measuring points in three kinds of specimens.
By monitoring the initiation time of cracking at statistical monitoring points, the crack propagation velocity is subsequently calculated. The statistical crack propagation data is presented in Table 2.
Table 2.
Crack propagation information.
Figure 15 shows the crack propagation velocities for the three experiments. As the propagation of blast-induced cracks involves a continuous cycle of “energy charging” and “energy release”, the crack propagation velocity fluctuates continuously. The initial microcrack continuously accumulates energy under explosive action. When the energy at the crack tip exceeds the propagation threshold, cracking initiates. During propagation, the accumulated energy is released to overcome the crack’s surface energy. Simultaneously, the continuous action of explosive gases on the newly formed crack surface causes the propagation velocity to fluctuate persistently. The black broken line depicts the crack propagation pattern in specimens with σ = 32.3 MPa. The propagation velocity rapidly peaks at 1351.35 m/s before declining. Upon reaching 909 m/s, it rebounds, subsequently exhibiting oscillatory behaviour. Similar trends in propagation velocity variation are observed across other rock strengths. For rock strengths ranging from highest to lowest, the average crack propagation velocities were 1096.5 m/s, 1071.9 m/s, and 1044.1 m/s, respectively; the peak velocities were 1351.35 m/s, 1234.5 m/s, and 1123.596 m/s, respectively. This indicates that higher rock strength correlates with both higher peak and average crack propagation velocities.
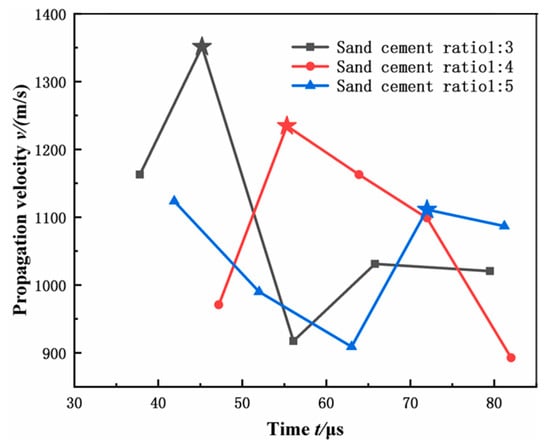
Figure 15.
Propagation velocity of directional cracks.
4.3. Rock Damage Analysis of Slit Charge Blasting
Similarly, the post-explosion specimens underwent binarization processing, with the results shown in Figure 16 and Figure 17. Under slit charge blasting, cracks exhibit a cross-shaped distribution pattern. The distribution characteristics of blasting damage are largely consistent with general blasting: crushing zone > full field > crack zone. However, numerical differences exist, which will be further analyzed and compared below.
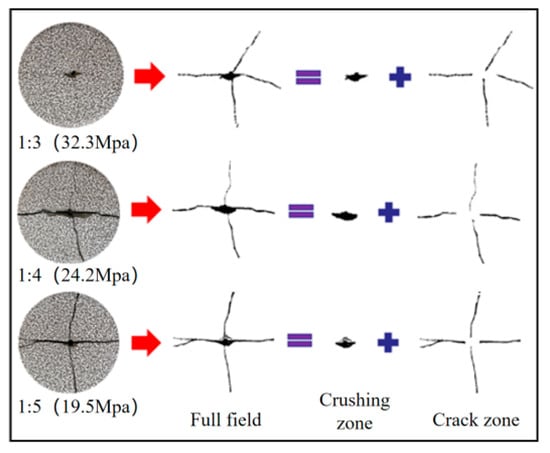
Figure 16.
Binarization Processing (slit charge blasting).
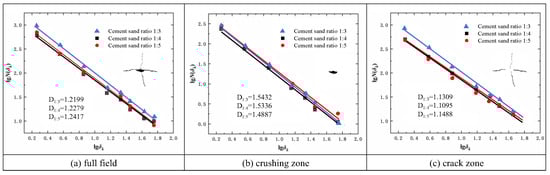
Figure 17.
Fractal Dimension Calculation (slit charge blasting).
A comparative analysis of fractal dimensions across different zones under two charging structures was conducted. The bar chart (Figure 18) clearly shows that the fractal dimension of the crushing zone > the fractal dimension of the full field > the fractal dimension of the crack zone. Across the full field, the fractal dimension of general blasting consistently exceeds that of slit charge blasting. Within the crushing zone, the average fractal dimension of general blasting also surpasses that of slit charge blasting. In the crack zone, however, the fractal dimensions under both blasting methods show minimal difference. This indicates that slit charge blasting reduces the overall damage inflicted on the rock mass, with the disparity being particularly pronounced in the crushing zone.
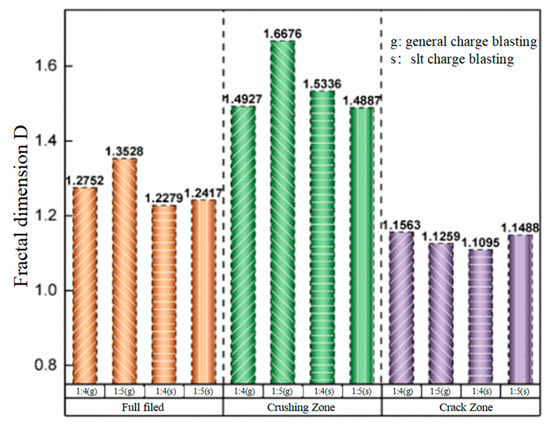
Figure 18.
Fractal Dimension Comparative Analysis.
5. Conclusions
This study employed high-speed cameras and DIC techniques to investigate the influence of varying rock material strength on the propagation of explosive stress waves and dynamic crack growth. Specimen strength was controlled by altering the cement-to-sand ratio in mortar. General blasting and slit blasting were then conducted under identical explosive charge conditions, with analyses performed on the radial strain decay patterns and the propagation velocity of directional cracks. The principal conclusions are as follows:
- (1)
- When rock strength is low, the strain rate is low, and the radial strain peak is maximum (9985 με). When rock strength is high, the strain rate is high, and the radial strain peak is minimum (5102 με). Regarding strain decay trends, specimens with lower strength exhibit higher overall peak strain values, whilst radial strain decay induced by the explosive stress wave is more rapid.
- (2)
- When the specimen strengths were 32.3 MPa, 24.2 MPa, and 19.5 MPa, the average crack propagation velocities were 1096.5 m/s, 1071.9 m/s, and 1044.1 m/s, respectively; the peak crack propagation velocities were 1351.35 m/s, 1234.5 m/s, and 1123.596 m/s, respectively. This indicates that higher rock strength correlates with both higher peak and average crack propagation velocities. In higher-strength rock masses, dynamic crack propagation exhibits greater inertia. At equivalent propagation speeds, cracks in hard rock demonstrate superior penetration capability.
- (3)
- Across the entire site, the fractal dimension of general blasting consistently exceeded that of slit charge blasting. Within the crushing zone, the average fractal dimension of general blasting likewise surpassed that of slit charge blasting. However, within the crack zone, the difference in fractal dimension between the two blasting methods was negligible. This indicates that slit charge blasting can effectively reduce overall rock mass damage, with the reduction being most significant within the crushing zone.
Author Contributions
Conceptualization, Y.Z.; methodology, W.R. and P.G.; software, B.W.; validation, Y.C.; formal analysis, Y.Z.; data curation, Y.C.; writing—original draft preparation, Y.Z.; writing—review and editing, Y.Z. All authors have read and agreed to the published version of the manuscript.
Funding
The authors gratefully acknowledge the support of the National Natural Science Foundation of China (51934001, 52004290, 52208384), the China Postdoctoral Science Foundation (2025T038ZGMK, 2025T001ZGMK).
Data Availability Statement
The original contributions presented in this study are included in the article. Further inquiries can be directed to the corresponding author.
Conflicts of Interest
Authors Wentao Ren, Peng Gu, and Yang Chen were employed by the company Shandong Energy Group Co., Ltd. First author Yuantong Zhang was also employed by State Key Laboratory of Safety and Health for Metal Mines. The remaining authors declare that the research was conducted in the absence of any commercial or financial relationships that could be construed as a potential conflict of interest.
References
- Chen, M.; Ye, Z.W.; Lu, W.B.; Wei, D.; Yan, P. An improved method for calculating the peak explosion pressure on the borehole wall in decoupling charge blasting. Int. J. Impact Eng. 2020, 146, 103695. [Google Scholar] [CrossRef]
- Huo, X.F.; Qiu, X.Y.; Shi, X.Z. Experimental and numerical investigation on the peak value and loading rate of borehole wall pressure in decoupled charge blasting. Int. J. Rock Mech. Min. Sci. 2023, 170, 105535. [Google Scholar] [CrossRef]
- Li, C.X.; Yang, R.S.; Zuo, J.J. Theory and field tests of innovative cut blasting method for rock roadway excavation. Tunn. Undergr. Space Technol. 2025, 155, 106180. [Google Scholar] [CrossRef]
- Peng, Y.Q.; Liu, Z.B.; Li, Y. Research and application of comprehensive detection methods for geological structural planes in drill and blast tunnels. J. Appl. Geophys. 2024, 228, 105449. [Google Scholar] [CrossRef]
- Wang, F.; Xue, Y.H.; Zhang, Y.Y.; Pan, Y.; Luo, C. Response of existing lining subjected to closed blasting in zero-spacing twin tunnels and its damping measures. Eng. Fail. Anal. 2024, 166, 108847. [Google Scholar] [CrossRef]
- Lu, A.; Yan, P.; Lu, W.B.; Li, X.; Liu, X.; Luo, S.; Huang, S.; Grasselli, G. Crack propagation mechanism of smooth blasting holes for tunnel excavation under high in-situ stress. Eng. Fract. Mech. 2024, 304, 110144. [Google Scholar] [CrossRef]
- Xiao, C.L.; Yang, R.S.; You, Y.Y.; Guo, Y.; Zhao, Y.; Zheng, C. Research on directional blasting of multiple slit charge. Eng. Fract. Mech. 2024, 308, 110179. [Google Scholar] [CrossRef]
- Zhao, J.J.; Li, D.Y.; Ranjith, P.G.; Su, X.; Li, Y.; Lyu, X. Innovative cut blasting method for rock excavation at depth based on numerical simulation and field tests. Tunn. Undergr. Space Technol. 2025, 155, 106211. [Google Scholar] [CrossRef]
- Liu, C.Y.; Yang, J.X.; Yu, B. Rock-breaking mechanism and experimental analysis of confined blasting of borehole surrounding rock. Int. J. Min. Sci. Technol. 2017, 27, 795–801. [Google Scholar] [CrossRef]
- Peng, J.Y.; Zhang, F.P.; Du, C.; Yang, X. Effects of confining pressure on crater blasting in rock-like materials under electric explosion load. Int. J. Impact Eng. 2020, 139, 103534. [Google Scholar] [CrossRef]
- Si, Y.T.; Liu, J.P.; Li, F.T.; Shi, H.; Yan, G.; Song, J.; Zhang, C. Experimental and theoretical investigation of roadway fracture induced by static-blast loading using acoustic emission. Eng. Fail. Anal. 2023, 143, 106909. [Google Scholar] [CrossRef]
- Silva, J.; Worsey, T.; Lusk, B. Practical assessment of rock damage due to blasting. Int. J. Min. Sci. Technol. 2019, 29, 379–385. [Google Scholar] [CrossRef]
- Wang, H.C.; Wang, Z.L.; Wang, J.G.; Wang, S.; Wang, H.; Yin, Y.; Li, F. Effect of confining pressure on damage accumulation of rock under repeated blast loading. Int. J. Impact Eng. 2021, 156, 103961. [Google Scholar] [CrossRef]
- Cai, Y.Z.; Xu, Z.H.; Liu, Y.F.; Chen, X.; Qi, W.; Liu, L. Weakly confined slotted cartridge blasting in jointed rock mass. Theor. Appl. Fract. Mech. 2024, 134, 104695. [Google Scholar] [CrossRef]
- Guo, Y.C.; Yang, R.S.; Peng, S.P.; Xiao, C. Experimental study on decoupled charge blasting-induced crack propagation with parabolic shaped charge. Eng. Fract. Mech. 2024, 304, 110178. [Google Scholar] [CrossRef]
- Zhu, F.H.; Liu, Z.G.; Huang, A.C. Study on the coupling mechanism of shaped blasting and empty hole to crack coal body. Process Saf. Environ. Prot. 2023, 175, 644–653. [Google Scholar] [CrossRef]
- Li, J.F.; Ying, P.; Zhu, Z.M.; Wang, M.; Jiang, Y.; Wan, D.; Gong, J. A new method for measuring the dynamic fracture toughness under blast loads using arc-edge rectangle with edge notches. Theor. Appl. Fract. Mech. 2021, 112, 102891. [Google Scholar] [CrossRef]
- Liu, X.; Yan, P.; Lu, W.B.; Lu, A.; Zhang, X.; Chen, M.; Wang, G. Numerical investigation of an improved deep-hole presplitting method based on notched blasting for deep-buried high sidewall structures. J. Build. Eng. 2023, 70, 106310. [Google Scholar] [CrossRef]
- Wan, D.Y.; Zhu, Z.M.; Liu, R.F.; Liu, B.; Li, J. Measuring method of dynamic fracture toughness of mode I crack under blasting using a rectangle specimen with a crack and edge notches. Int. J. Rock Mech. Min. Sci. 2019, 123, 104104. [Google Scholar] [CrossRef]
- Li, C.X.; Yang, R.S.; Wang, Y.B.; Zhang, Y. Theory and numerical simulation of deep hole cut blasting based on dispersed charge and staged detonation. Int. J. Rock Mech. Min. Sci. 2023, 169, 105453. [Google Scholar] [CrossRef]
- Ding, C.X.; Yang, R.S.; Xiao, C.L. Directional fracture behavior and stress evolution process of the multi-slit charge blasting. Soil Dyn. Earthq. Eng. 2022, 152, 107037. [Google Scholar] [CrossRef]
- Yang, R.S.; Ding, C.X.; Li, Y.L.; Zhao, Y. Crack propagation behavior in slit charge blasting under high static stress conditions. Int. J. Rock Mech. Min. Sci. 2019, 119, 117–123. [Google Scholar] [CrossRef]
- Vormwald, M.; Hos, Y.; Freire, J.L.F.; Gonzales, G.L.G.; Diaz, J.G. Crack tip displacement fields measured by digital image correlation for evaluating variable mode-mixity during fatigue crack growth. Int. J. Fatigue 2018, 115, 53–66. [Google Scholar] [CrossRef]
- Gao, G.; Yao, W.; Xia, K.; Li, Z. Investigation of the rate dependence of fracture propagation in rocks using digital image correlation (DIC) method. Eng. Fract. Mech. 2015, 138, 146–155. [Google Scholar] [CrossRef]
- Grzegorz, L.G. Measurement of fracture mechanics parameters of concrete containing fly ash thanks to use of Digital Image Correlation (DIC) method. Measurement 2019, 135, 96–105. [Google Scholar] [CrossRef]
- Ge, Y.; Cai, Z.X.; Zhang, X.C. An experimental investigation on the damage of granite under uniaxial tension by using a digital image correlation method. Opt. Lasers Eng. 2015, 73, 46–52. [Google Scholar] [CrossRef]
- Meng, S.Q.; Shi, Z.M.; Niu, Y.F.; Zheng, H.; Xia, C. Fundamental insights into the crack propagation behavior of functional gradient ultra-high-performance concrete using the digital image correlation method. Constr. Build. Mater. 2023, 376, 131053. [Google Scholar] [CrossRef]
Disclaimer/Publisher’s Note: The statements, opinions and data contained in all publications are solely those of the individual author(s) and contributor(s) and not of MDPI and/or the editor(s). MDPI and/or the editor(s) disclaim responsibility for any injury to people or property resulting from any ideas, methods, instructions or products referred to in the content. |
© 2025 by the authors. Licensee MDPI, Basel, Switzerland. This article is an open access article distributed under the terms and conditions of the Creative Commons Attribution (CC BY) license.