1. Introduction
Infrared small target detection technology is critical in applications such as infrared early warning [
1], buried land detection [
2], and remote sensing-based aircraft detection [
3]. However, infrared imaging is typically conducted from long distances, resulting in small, dim targets that lack distinct texture features. These faint targets are often obscured by complex background clutter and noise, making them difficult to detect. Additionally, the irregular motion and shapes of infrared small targets complicate their dynamic characteristics. Extensive practical experience has demonstrated that relying solely on temporal or spatial information hampers effective detection. Consequently, the effective utilization of spatiotemporal information for robustly detecting infrared small targets in complex backgrounds remains a prominent research focus among experts and scholars
1.1. Related Works
Existing IRSTD methods can be categorized into the following groups: background filtering-based methods, human visual system (HVS)-based methods, deep learning-based methods, low-rank sparse decomposition (LRSD)-based methods, and temporal filtering-based detection methods.
1.1.1. Background Filtering-Based Methods
Background modeling-based methods initially employ image filtering algorithms to estimate the background of an input image, followed by target detection through background subtraction. Principal filtering techniques include top-hat transformation filtering [
4], bilateral filtering [
5,
6], minimum two-dimensional mean square filtering [
7], random walker [
8], and anisotropic diffusion-based filtering [
9,
10,
11,
12], among others. While background filtering approaches can achieve accurate background prediction under stable conditions, they often fail to produce satisfactory results in real-world scenarios where the background undergoes significant changes.
1.1.2. HVS-Based Methods
Building on the robust characteristics of the human visual system (HVS) and Derived Kernel [
13,
14], Kim et al. [
15] introduced a method based on Laplacian scale-space theory. Subsequently, Chen et al. [
16] proposed the local contrast measure (LCM), which also draws on the HVS principles. To better characterize the features of the target’s neighborhood, Wu et al. [
17] and Han et al. [
18] introduced a three-layer sliding window structure. Building on this concept, Cui et al. and Xie et al. further incorporated weighting strategies and proposed the Weighted Three-Layer Local Contrast (WTLLCM) [
19] and the Weighted Tri-Layer Sliding Window Local Contrast (NTLLCM) [
20], respectively, both achieving promising results. However, these single-frame algorithms rely solely on spatial information, limiting their effectiveness under low signal-to-clutter ratio (SCR) conditions.
1.1.3. LRSD-Based Methods
Meanwhile, leveraging the work of Candès et al. [
21] in matrix optimization, low-rank sparse decomposition (LRSD)-based methods IPI, IMNNLWEC, and ILN-SSR [
22,
23,
24] formulate small target detection as an optimization problem. Although these low-rank and sparse-based methods can detect targets in some scenarios, they struggle to perform effectively when faced with complex backgrounds such as forests or urban areas, where the background cannot be characterized as low-rank.
1.1.4. Deep Learning-Based Methods
With the rise of vision-oriented neural networks, works such as ResNet [
25] and Vision-Transformer [
26,
27] have also been applied to various fields [
28], including infrared small target detection. Recent research has extensively explored both Transformer-based and CNN-based approaches [
29,
30,
31,
32,
33]. However, the lack of neighborhood texture information for infrared small targets and the diversity of targets in complex backgrounds make it challenging to learn target features, which significantly limits the applicability of end-to-end networks.
1.1.5. Multi-Frame Methods
In the development of multi-frame temporal filtering for IRSTD, the groundbreaking work of Silverman et al. [
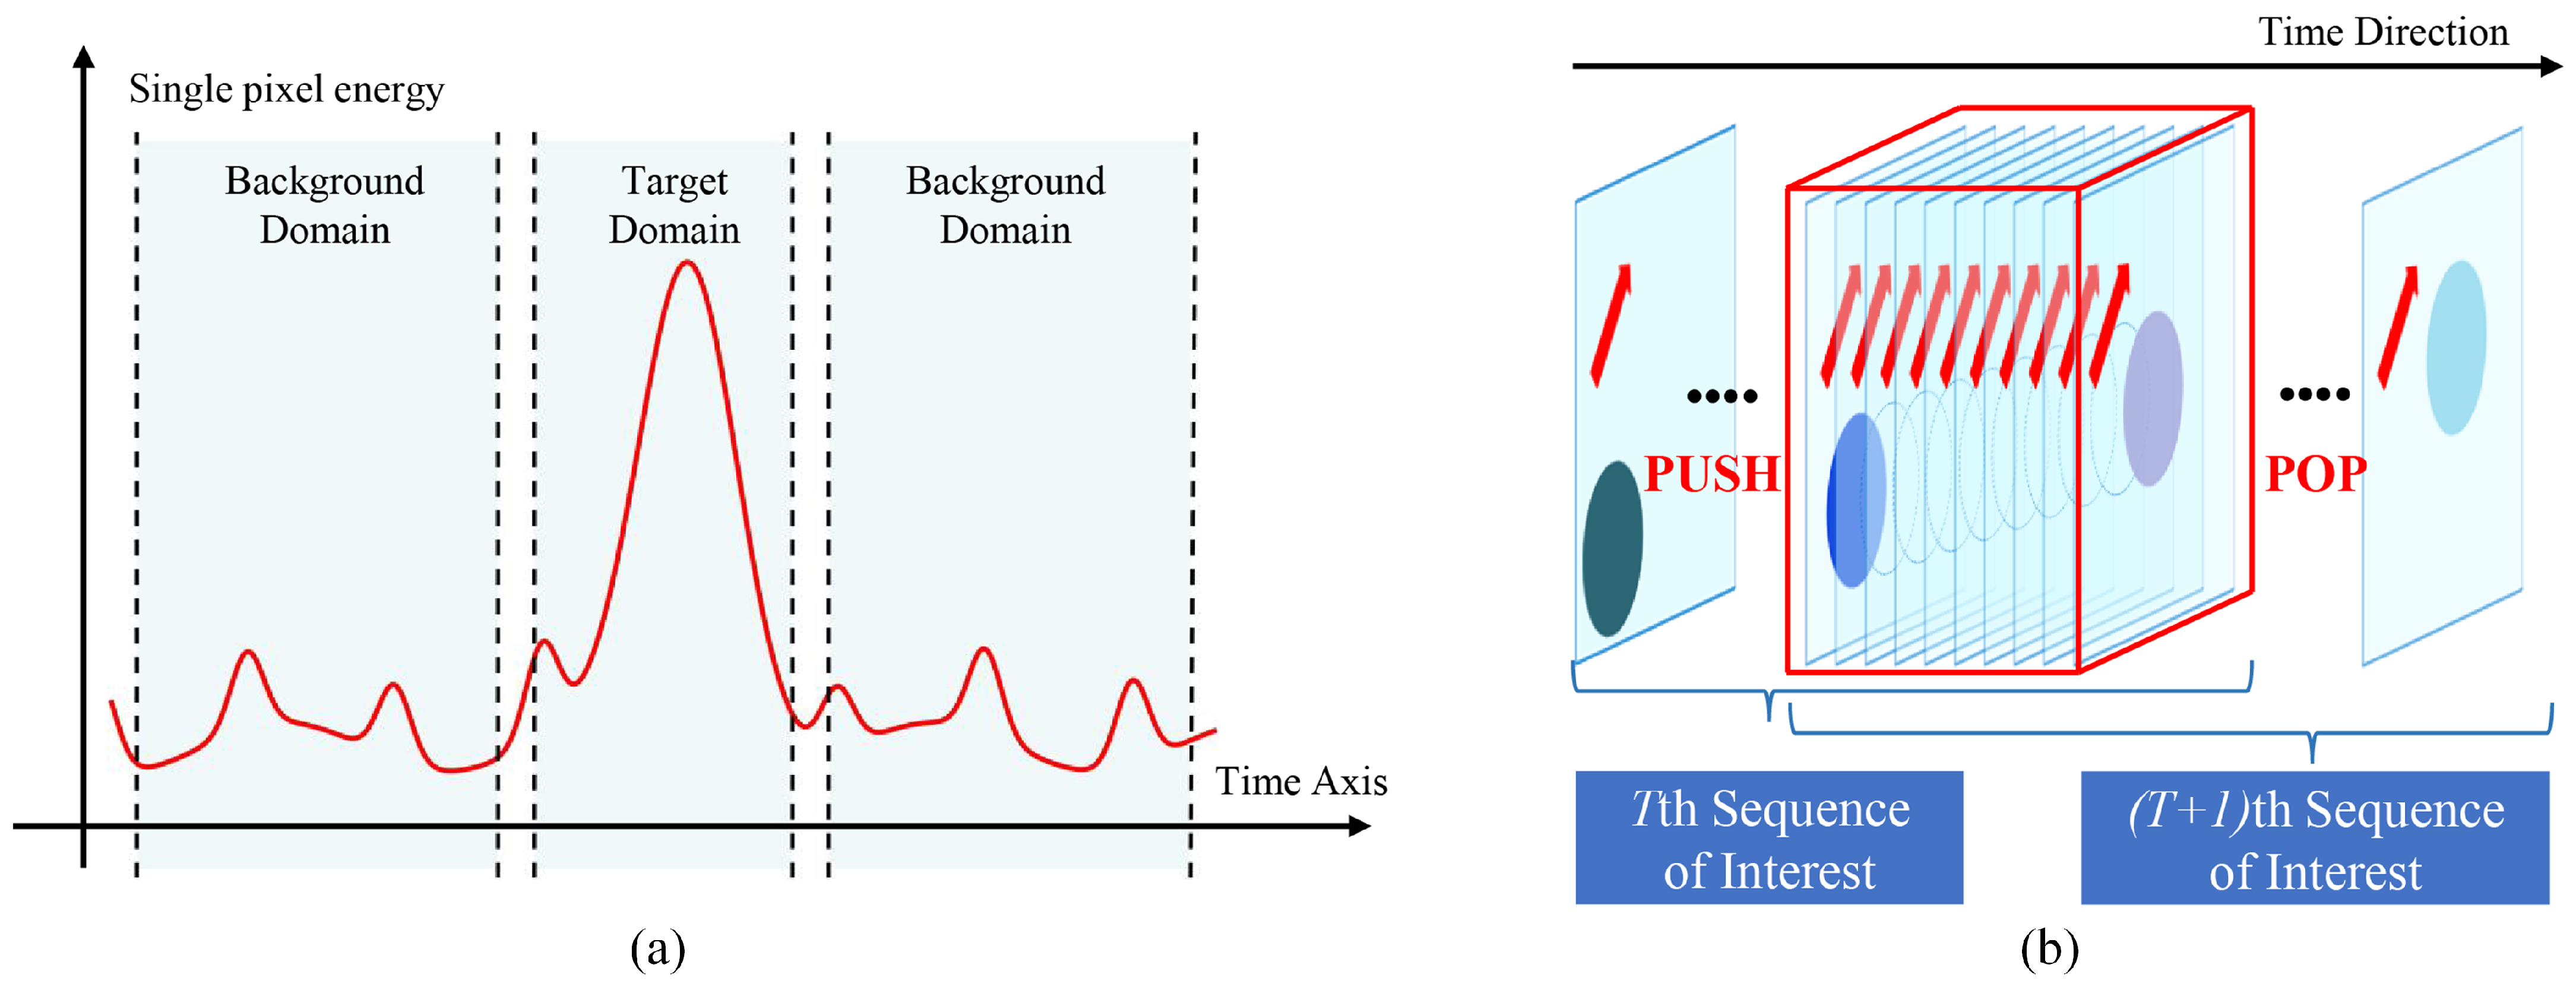
34] introduced the temporal profile model for target pixels, a foundational framework that explicitly characterizes the intensity evolution of small targets across sequential frames. In infrared dim and small target detection, a prominent TP peak indicates a weak target, as shown in
Figure 1. Building on this concept, Niu et al. [
35] introduced a higher-order statistics approach employing a bispectrum-based model, while Liu et al. [
36] used the Kullback–Leibler divergence to measure the similarity between a target’s temporal profile and a template. However, temporal-domain approaches rely on a single source of information, and, when scene changes cause significant image shifts or when the number of frames is insufficient to provide spatial correlation information, this detection becomes notably more challenging.
1.1.6. Spatial–Temporal Fusion Methods
In summary, in recent years, infrared small target detection methods have primarily been categorized into spatial-driven and temporal-driven approaches. Spatial methods distinguish targets from backgrounds through local contrast enhancement (e.g., NTLLCM [
20]), low-rank sparse priors [
22], or end-to-end networks [
29]. However, they are prone to false alarms in complex scenarios such as dynamic clouds and sea clutter. Temporal methods detect targets by leveraging the continuity of their motion trajectories [
36], but they perform poorly when the image shift is significant or the target moves rapidly.
Recent studies have attempted to fuse spatiotemporal features. For instance, SSTLCM [
37] is a proposed detection method combining temporal sampling with multi-layer contrast, while Deng et al. [
38] introduced a detection algorithm based on spatial and temporal contrast, designing a spatiotemporal filter called the Spatial–Temporal Local Contrast Filter (STLCF). Zhao et al. [
39] further enhanced this approach with an improved Spatial–Temporal Local Contrast Map (STLCM). These spatial–temporal-based methods have indeed demonstrated robust detection capabilities. However, they rely solely on temporal sampling points to analyze temporal profile features, potentially overlooking critical local gray intensity difference information of small moving targets across consecutive frames. Additionally, the spatial feature analysis tends to homogenize with the temporal domain, failing to provide new information. The core limitations of these methods lie in: (1) insufficient interaction between spatial and temporal features, which hinders the synergy between dynamic background suppression and weak target enhancement, and (2) the lack of effective detection of spatiotemporal target features, which limits the cross-scenario generalization capability of the detection methods.
1.2. Motivations and Contributions
In real-world scenarios, moving dim and small targets are situated in diverse backgrounds and exhibit varying intensities. For dimmer targets in simpler backgrounds, energy accumulation across adjacent frames enhances detection capability, as it amplifies weak target signals while suppressing transient noise. Conversely, for brighter targets in more complex backgrounds, temporal contrast modeling proves effective by leveraging the statistical differences between targets and their surrounding backgrounds.
To address the limitations of temporal-domain and single-frame algorithms in information extraction, as well as the challenges posed by variations in target brightness and scene complexity, this work integrates single-frame spatial contrast and gradient features into the detection process. Specifically, we introduce two novel temporal-domain techniques. The first is Regional Intensity Accumulation (RIA). By accumulating target energy across consecutive frames, RIA enhances the detectability of dim targets while mitigating the impact of noise and background clutter. The second, Temporal Regional Contrast (TRC), models the temporal contrast between targets and their local backgrounds, effectively suppressing dynamic interference in complex scenarios. For spatial analysis, we propose the Gradient-Enhanced Local Contrast Measure (GELCM), which incorporates gradient direction and magnitude coherence into local contrast computation, further reducing false alarms caused by edges and structured backgrounds. Based on these components, we propose Spatial–Temporal Fusion Detection (STFD), a method that robustly combines spatial and temporal information for small target detection. STFD adaptively balances the contributions of RIA, TRC, and the GELCM based on scene complexity and target characteristics, ensuring superior performance across diverse scenarios.
The main contributions of this paper are as follows:
This work proposes Regional Intensity Accumulation and Temporal Regional Contrast, which are temporal detection methods based on temporal profile analysis that successfully characterize and address scenarios involving complex backgrounds and dim targets. These methods reliably obtain temporal detection results from multi-frame image sequences.
This work introduces the Gradient-Enhanced Local Contrast Measure, a spatial contrast detection method that integrates gradient direction and magnitude information. The GELCM effectively describes real-world targets, significantly enhances target detectability in complex backgrounds, and efficiently extracts spatial detection results from multi-frame images.
This study designs and integrates the GELCM (spatial detection) with TRC and RIA (temporal detection) into the Spatial–Temporal Fusion Detection method. The GELCM, TRC, and RIA complement each other, and their synergy in STFD enables effective target detection across diverse scenarios. The method demonstrates its effectiveness and robustness through evaluations in various scenarios and infrared sequence types.
2. Methodology
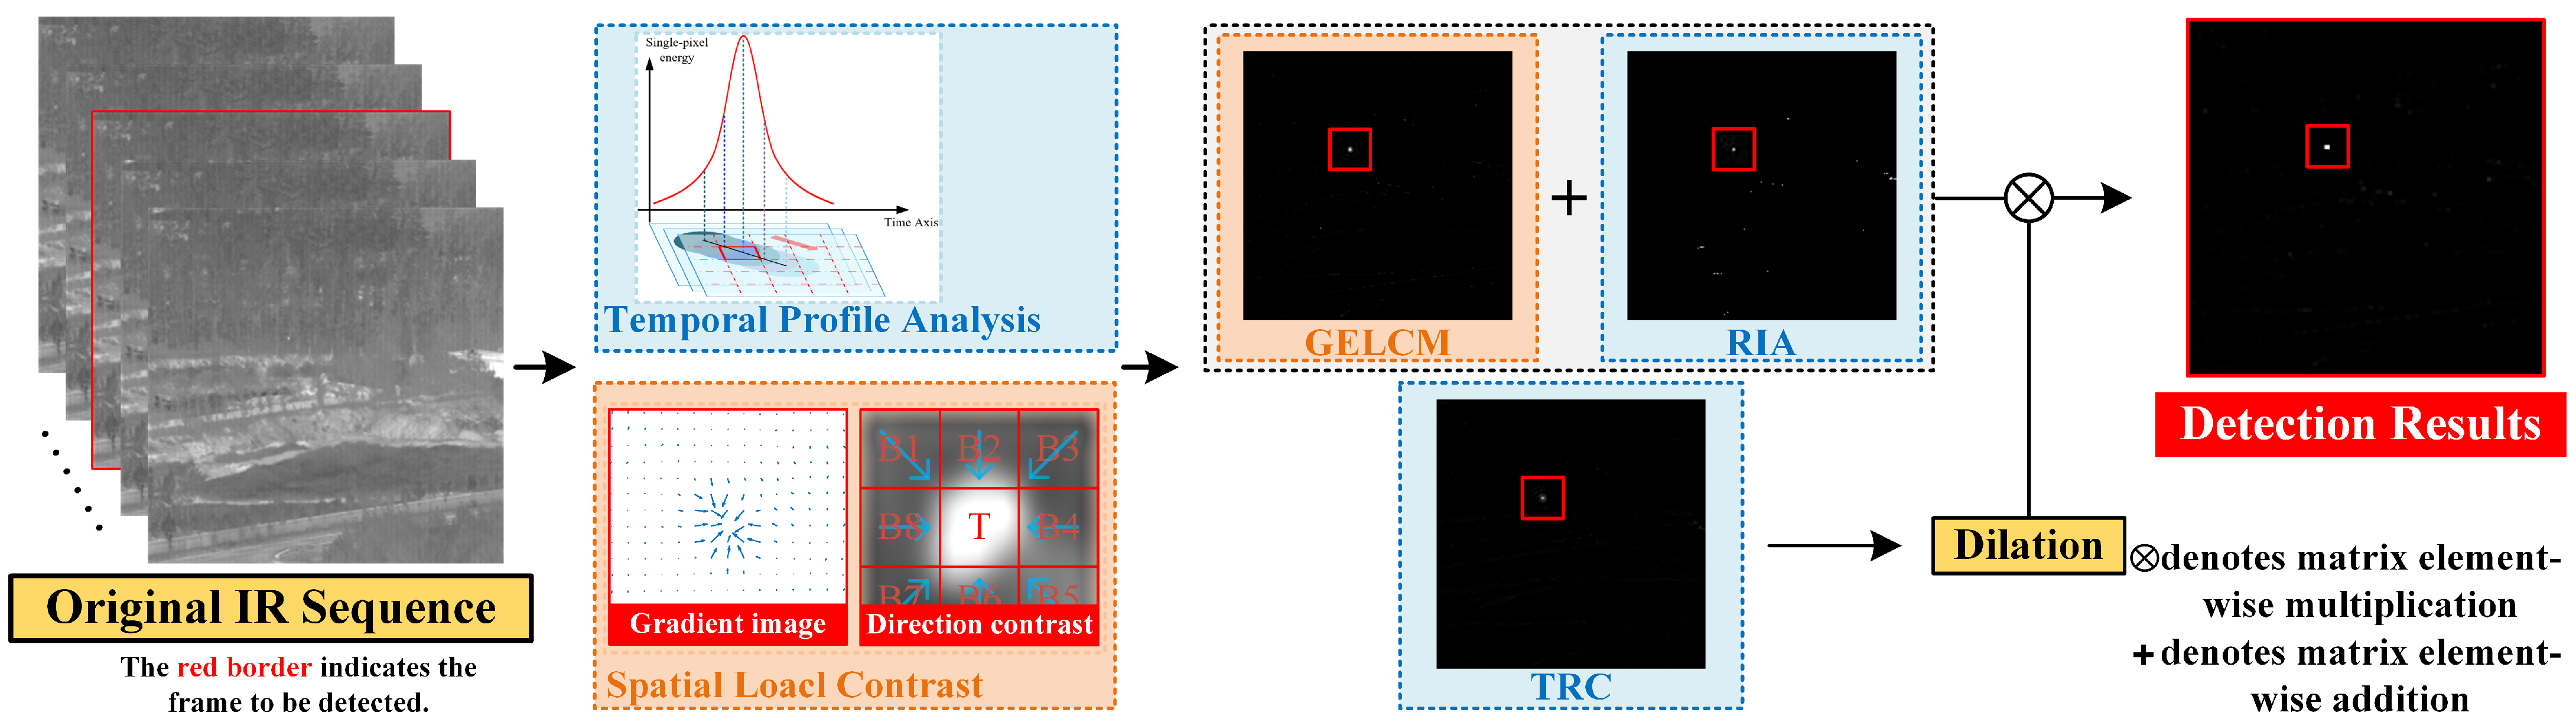
As illustrated in
Figure 2, STFD comprises three key components. In the temporal domain, we propose TRC and RIA, which address challenges posed by complex scenarios and dim targets. In the spatial domain, we introduce the GELCM, which leverages directional contrast to capture gradient information for spatial target detection. Finally, we fuse the detection results from these three components to achieve robust and effective detection of dim and small targets in complex scenarios.
2.1. Temporal Regional Contrast
In infrared small target detection, the local contrast measure [
16], inspired by the human visual mechanism, estimates target presence by analyzing the contrast between the target region and the background in the spatial domain. Building on this concept, we developed a temporal contrast measure to enhance and detect dim and small targets by utilizing contrast in the temporal domain.
As shown in
Figure 3, for an infrared image sequence at time
t, we select
N preceding and
N succeeding frames to construct the current sequence of interest:
where
represents the
t-th frame of the infrared image sequence
x.
This study divides the temporal sequence into two regions: the Domain of Target (DT) and the Domain of Background (DB). A target’s presence within the observed period is characterized by a distinct peak in the temporal profile, enabling its detection at the pixel level.
In contrast, background edges or flashing pixels exhibit temporal continuity, resulting in consistent statistical measures between the DT and DB regions. However, for infrared small targets with varying brightness or position, the instantaneous nature of the DT disrupts this consistency, creating detectable statistical differences from the DB.
Inspired by the contrast concept of the LCM, this study proposes a detection method based on temporal contrast:
where
and
denote the average values of the DT and DB, respectively. While the mean reflects grayscale characteristics, it is insufficient to capture complex differences between targets and backgrounds, particularly in cluttered environments where it may be skewed, leading to inaccuracies in temporal contrast computation. To address this, we incorporate the standard deviation as an additional metric to refine the calculation of temporal contrast:
where
and
represent the standard deviations of the target domain and the background domain, respectively. This extension incorporates the degree of grayscale dispersion, enhancing the expression of contrast.
In practical imaging scenarios, multi-frame images often involve phase shifts, causing background clutter to exhibit impulse-like peaks in the temporal profile, which can result in false alarms. Additionally, when such clutter appears near the target’s spatial neighborhood, the excessively large standard deviation and mean values in the background domain can lead to missed detections.
To address the aforementioned issues, this study applies truncation to the statistical values of
and
in the background domain. Specifically, the truncation operation replaces pixel values exceeding a defined upper percentile threshold (e.g., the top 20% of values), with the maximum value within the retained range, while values below a defined lower percentile threshold (e.g., the bottom 20%) are adjusted to the minimum retained value. For example, in a 100 × 100 image, pixel values at both extremes of a defined proportion range are adjusted to the corresponding percentile thresholds. By truncating excessively large or small background statistics, the method better characterizes the background changes in the target’s temporal neighborhood. This approach is named Temporal Regional Contrast, abbreviated as TRC:
where
represents
X with the largest and smallest 20% values truncated.
2.2. Regional Intensity Accumulation
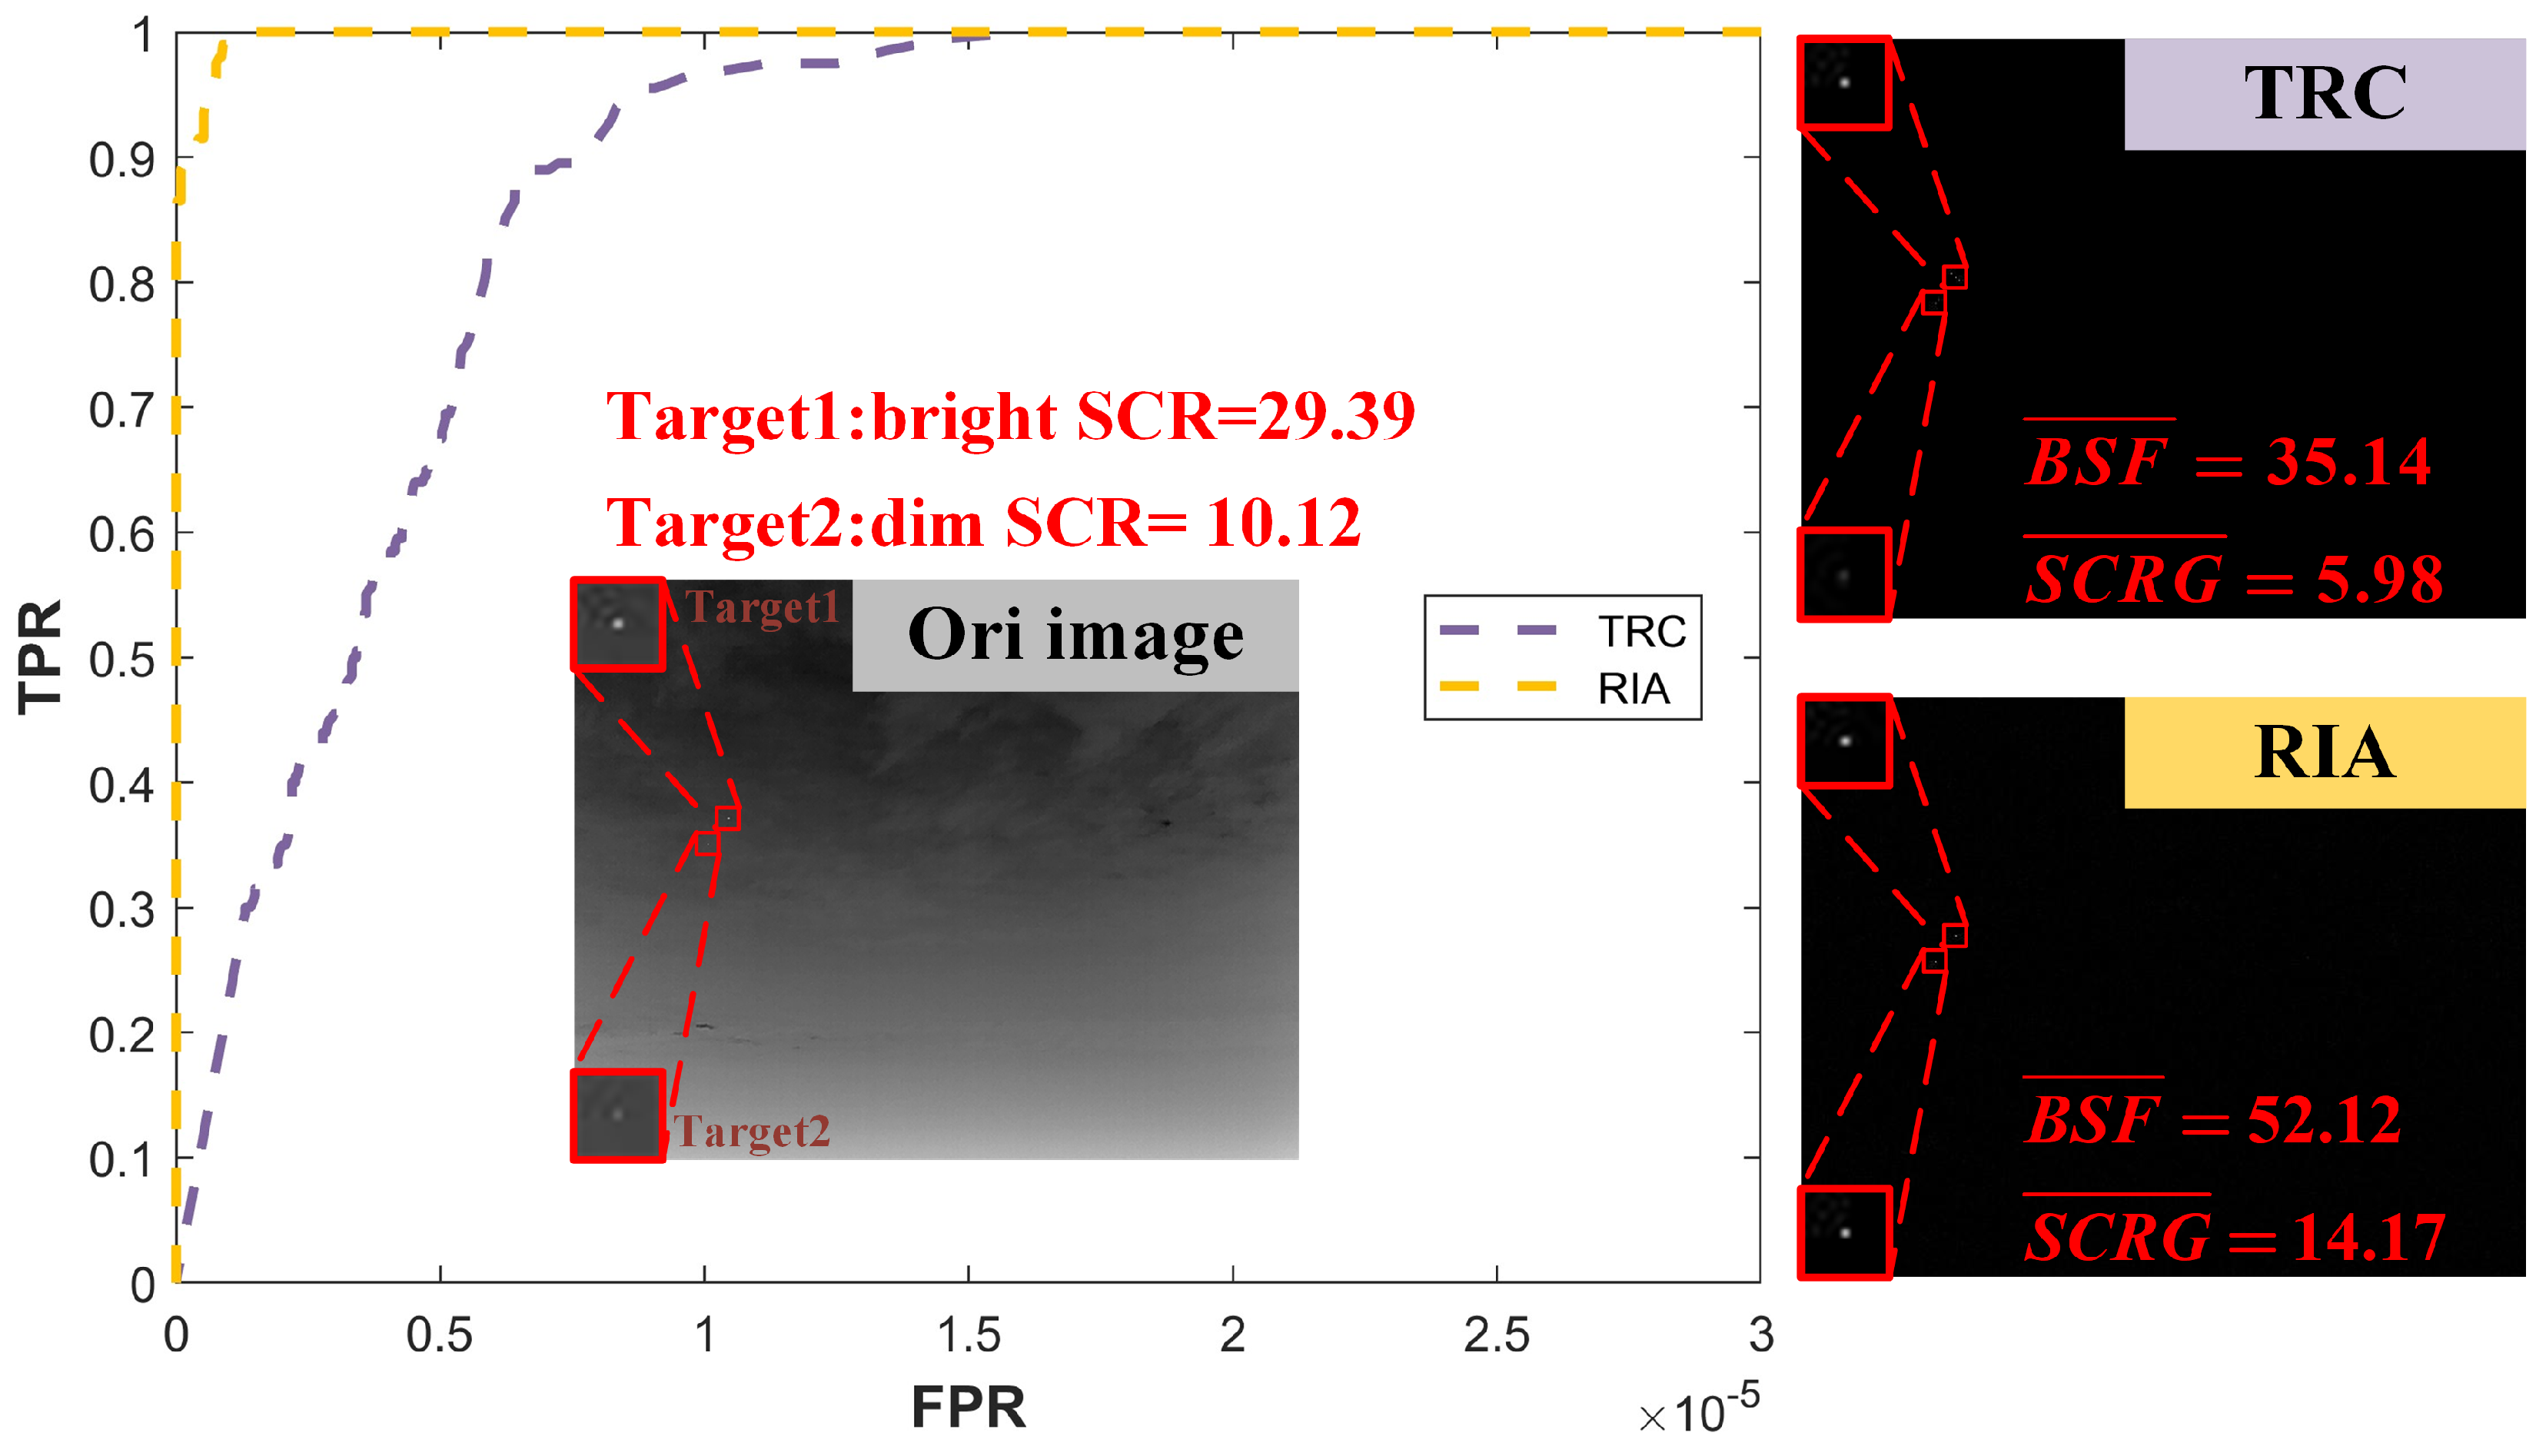
This study observes that the contrast calculation of TRC is highly sensitive to changes in bright targets but performs poorly in responding to some weaker targets. Additionally, since the calculation involves statistical values within the DT, the responses from other frames in the target domain can influence the detection of the current frame.
In response, this study proposes a detection method based on temporal regional energy accumulation, specifically targeting dim and weak objects with a focus on centroid localization. By analyzing differences between the current frame and neighboring frames, target energy is estimated, and its accumulation enhances the visibility of dim and weak targets. The results demonstrate that energy accumulation provides a strong response to such targets, while using a single frame as the reference for differences enables more precise centroid estimation.
Specifically, similar to Section II-A Equation (
1), we analyze
by selecting the preceding
N frames and succeeding
N frames, performing difference calculations with
. To mitigate interference caused by phase shifts, negative values resulting from the difference are truncated. After the differences, the images are accumulated, causing the energy to converge. We name this method Regional Intensity Accumulation (RIA), which can be defined as follows:
where
N is determined based on the estimated speed of the target’s movement. RIA repeatedly accumulates target intensity, exhibiting high sensitivity to moving dim targets while effectively mitigating the impact of background motion. As shown in
Figure 4, a comparison of TRC and RIA on dim and bright targets highlights RIA’s superior enhancement through accumulation.
2.3. Gradient-Enhanced Local Contrast Measure
Spatial information complements temporal information to improve target detection. However, the spatial texture of infrared small targets is often blurred and challenging to utilize directly. To address this, this study proposes the Gradient-Enhanced Local Contrast Measure (GELCM), which leverages local directional contrast and gradient characteristics. The GELCM captures grayscale differences between the target and background while considering directional trends in grayscale variation.
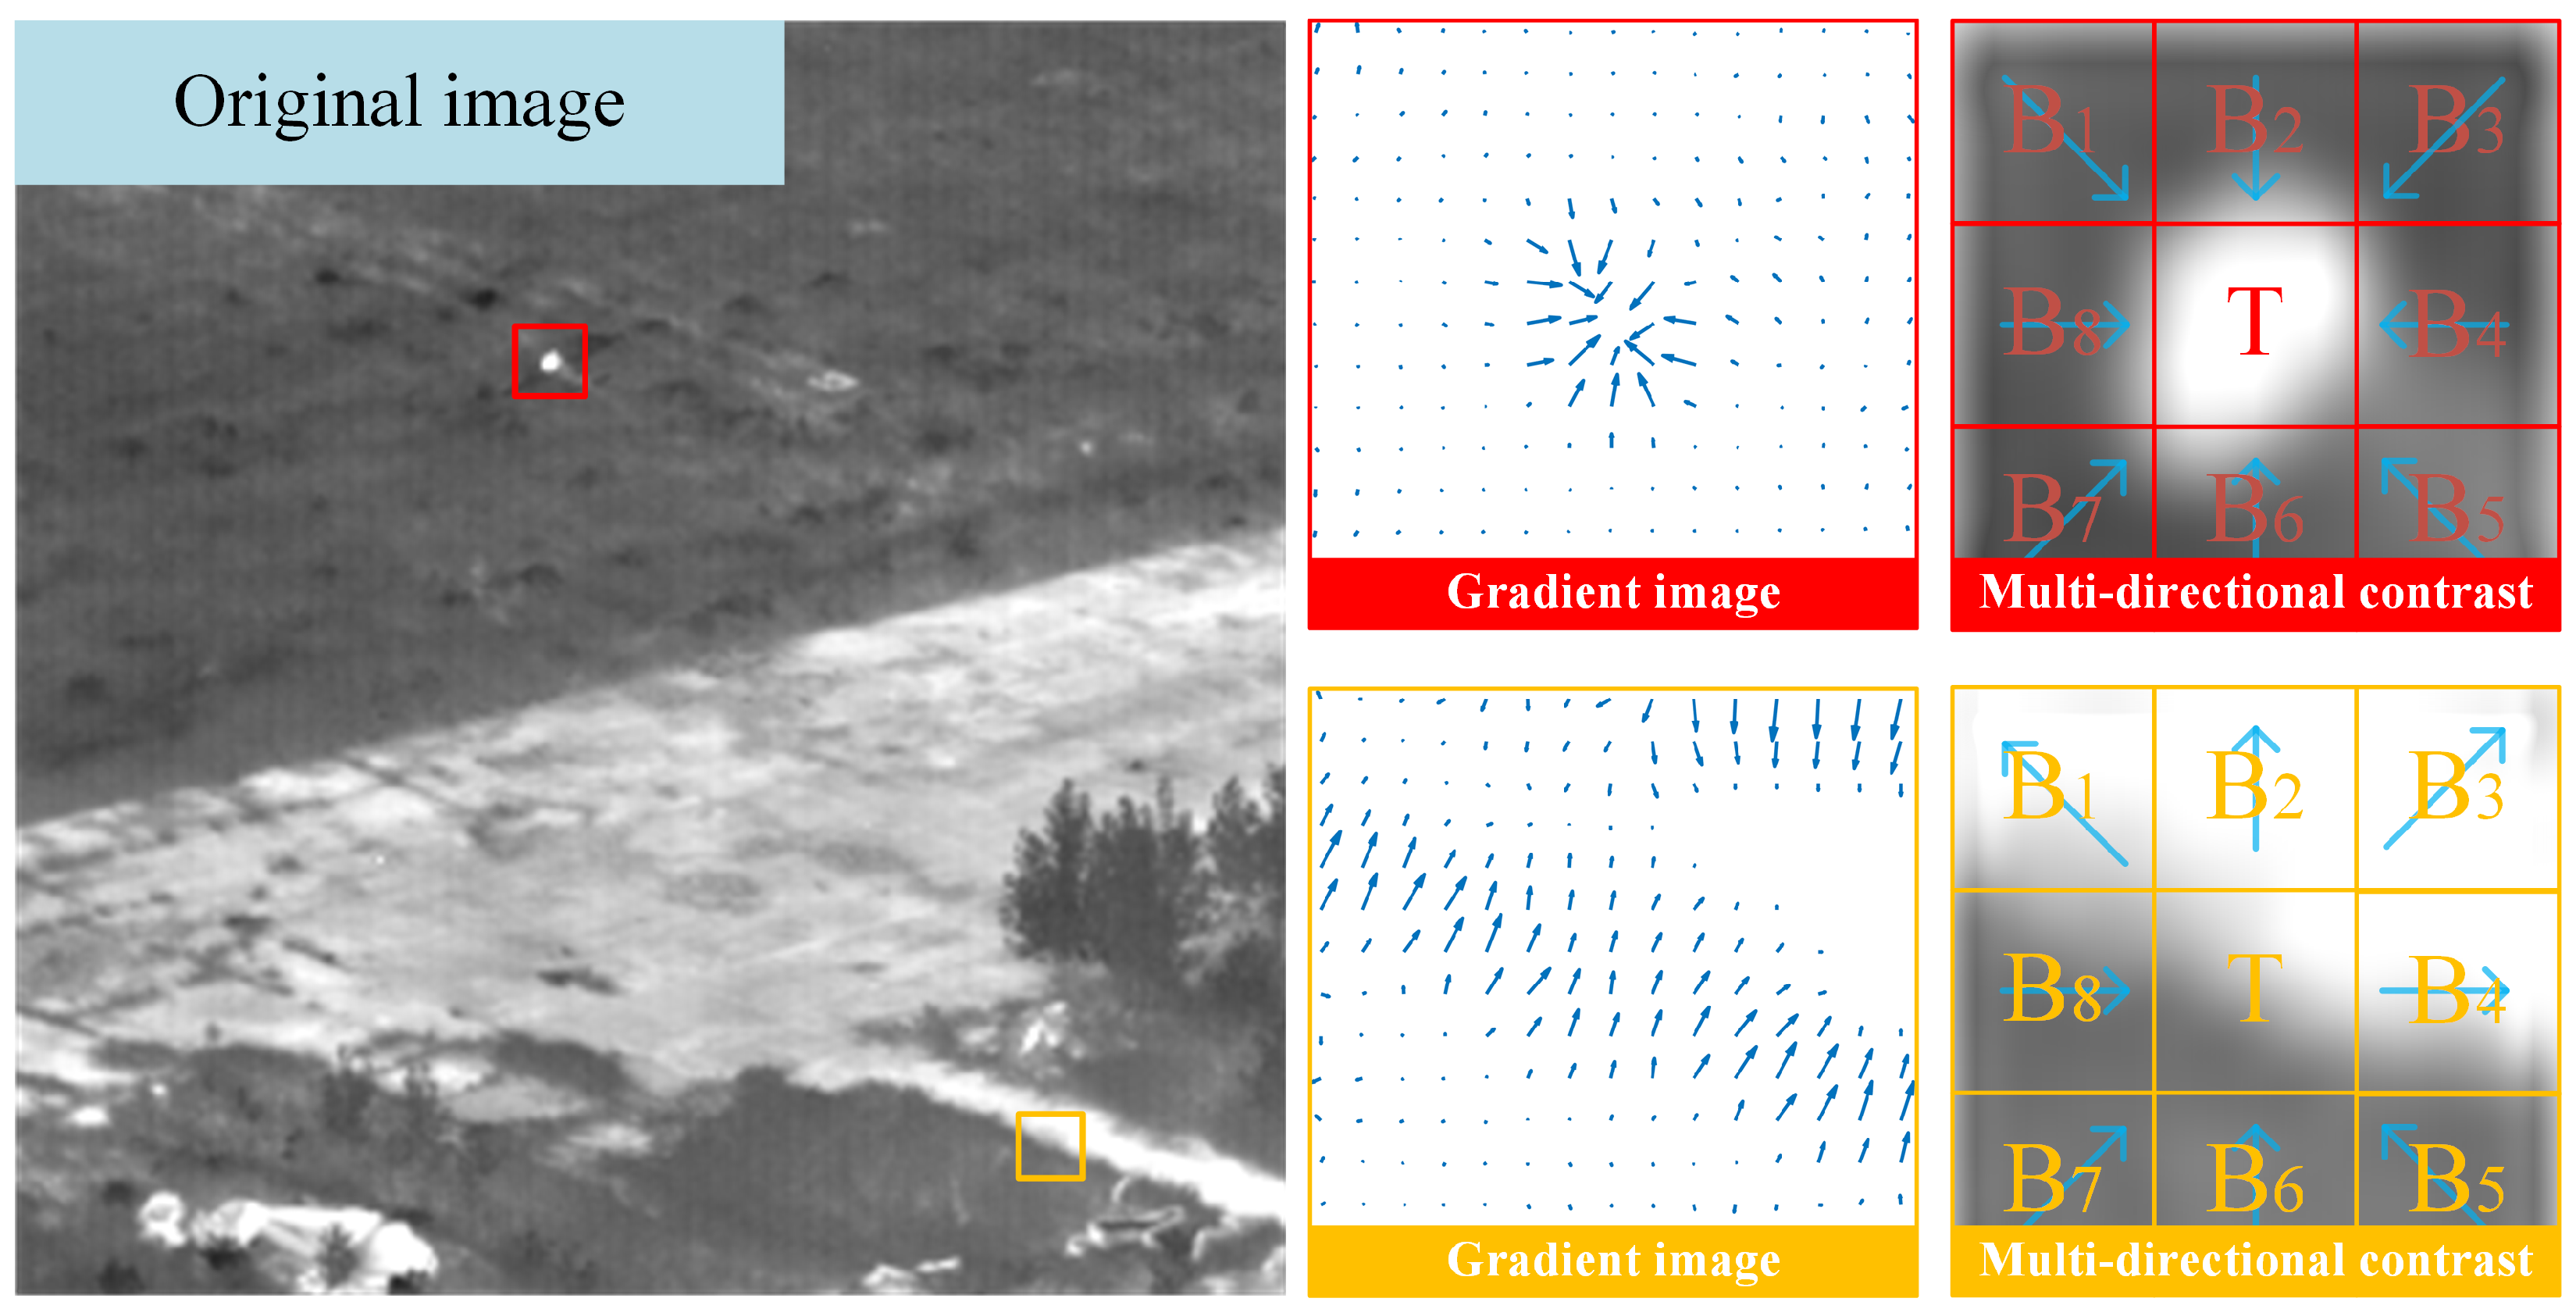
As observed in
Figure 5, most gradients in the vicinity of the small and weak target point toward the target region, with relatively high gradient magnitudes near the target. In contrast, edges and other clutter in the image lack this characteristic, a pattern commonly observed in infrared imagery [
40,
41]. This suggests that a higher number of gradients converging toward the center increases the likelihood of the region containing a small and weak target. Additionally, gradient magnitudes near the target are typically more pronounced.
Directly computing the direction and magnitude of gradient vectors in the image neighborhood is complex, prone to interference, and ineffective for slightly larger targets. To address these challenges, this study employs multi-directional contrast to characterize gradient distributions in specific directions, offering a more robust representation.
This study calculates multi-directional contrast for each pixel using the mean differences within sliding window image patches. As illustrated in
Figure 5, each sliding patch window is divided into nine
cells. The central cell, denoted as
T, serves as the focal area where a candidate target is likely to appear at its center. The surrounding cells, labeled
to
, represent the background regions.
This study defines the difference between the central cell and the corresponding surrounding background cell in a specific direction as follows:
Here,
and
represent the grayscale mean values of the central region and the
i-th corresponding background region in
Figure 5, respectively. Negative values of
are set to zero. To further characterize the property that gradient magnitudes near the target are relatively large, this study comprehensively considers the multi-directional contrast magnitudes across all directions:
Building on this, the study considers gradient directionality as a key criterion for determining target presence. Based on the previous analysis, a higher number of gradients in the vicinity of a candidate region converging toward that region increases the likelihood of it containing a target. Correspondingly, in the calculation of multi-directional contrast, the greater the number of
values larger than 0 there are, the higher is the likelihood of the central region containing a target. Based on the above analysis, this study proposes the GELCM:
Here, is a binarized mask of positive gradients based on the gradient directions to . By counting the number of local gradient directions pointing toward the target, this mask enhances the saliency of the target region. The parameter serves as the gradient direction factor, controlling the influence of directional gradients on target detection. The GELCM integrates this gradient directionality information with local contrast measures, effectively distinguishing the target from the background.
2.4. Spatial–Temporal Fusion and Calculation
After the proposal of the temporal sequence methods TRC and RIA and the single-frame method GELCM, Spatial–Temporal Fusion Detection can be defined as:
where
represents the dilation operation, and se denotes the structuring element used for dilation. This study observes that the GELCM and RIA demonstrate high precision in capturing the centroids of targets, while TRC performs less effectively in this aspect. To address this, we apply a dilation operation to TRC and multiply its result with the sum of the GELCM and RIA.
Furthermore, TRC and the GELCM demonstrate strong detection capabilities in complex backgrounds, while RIA, which relies on energy accumulation, is comparatively less effective in such conditions. Although TRC is less sensitive to dim targets, the GELCM and RIA effectively address this limitation. Additionally, TRC and RIA primarily utilize temporal information within image sequences, whereas the GELCM focuses on spatial information. Together, these three methods enable robust detection of dim and small targets in diverse and challenging scenarios. By leveraging target energy accumulation and regional contrast, the three methods delineate temporal target profiles through gradient-based analysis. Crucially, TRC detects targets under varying background intensities while collaborating with RIA and the GELCM to suppress clutter via spatiotemporal synergy. Their pointwise multiplication further filters background interference, enabling STFD to enhance detection performance.
In this study, the parameters DT, DB, and N are configured based on the target’s motion speed, while l is determined by the target’s size. For example, in scenarios where the target moves at a speed of 1–3 pixels per frame, DT is set to 3, DB to 6, and N to 7. Since infrared small targets typically have a small size, l can be directly set to a value between 1 and 3.
3. Experiments and Analysis
3.1. Datasets
To validate the practical effectiveness of STFD, this study utilized two datasets from the National University of Defense Technology [
42,
43,
44]. Six image sequences were selected, each consisting of 100 frames, covering various complex scenarios, including cluttered backgrounds, dim targets, and varying target speeds. In
Figure 6 and
Table 1, we present sample frames from these six datasets, along with brief descriptions of their content. To validate the heterogeneity among these datasets, we conducted Kolmogorov–Smirnov (KS) tests between different dataset pairs. The results shown in
Table 2 demonstrate significant differences in data distributions across the datasets, which statistically justifies the rationality of our dataset selection.
Among them, Seq.1 to Seq.3 have a size of 256 × 256, with relatively complex backgrounds and slow-moving targets. Seq.4 to Seq.6 have a size of 512 × 640, where Seq.4 and Seq.5 feature relatively clean sky backgrounds, and Seq.6 includes a background comprising both sky and urban areas, with targets of varying speeds moving across these two regions.
3.2. Baseline Methods and Experimental Setup
In this study, STFD was compared against several state-of-the-art methods, including single-frame local contrast-based methods (DNGM [
17], TLLCM [
18]), low-rank sparse decomposition-based methods (IPI [
22], IMNNLWEC [
23]), a temporal-based method (TVF [
34]), a spatial temporal method (SSTLCM [
37]), a segmentation-based method (FKRW [
8]), and a deep learning-based method (UIUNet [
33]). These eight methods represent a diverse array of detection strategies and have demonstrated strong performance in their respective domains, serving as a comprehensive benchmark for evaluating the effectiveness of STFD.
All experiments were performed on an Ubuntu 20.04 system with an Intel Core i9-13900K CPU (5.8 GHz), 64 GB of RAM (Intel, Santa Clara, CA, USA), and an NVIDIA RTX 4090 GPU with 24 GB of memory (NVIDIA, Santa Clara, CA, USA).
3.3. Evaluation Metrics
To evaluate the detection performance of the proposed method, we utilized the Signal-to-Clutter Ratio Gain (SCRG), Background Suppression Factor (BSF), and Receiver Operating Characteristic (ROC) curve based on the True Positive Rate (TPR) and False Positive Rate (FPR). SCRG measures the target enhancement capability, the BSF assesses global background suppression, and the ROC curve depicts the relationship between the FPR and TPR across varying thresholds.
The definition of SCRG is as follows:
where
,
, and
denote the mean of the target region, the mean, and the standard deviation of the surrounding local neighborhood, respectively.
and
represent the SCR of the original and detection results, respectively.
The BSF is defined as:
where
and
represent the standard deviations of the original and detection results, respectively, and
prevents division by zero.
TPR and FPR are defined as:
The Area Under the Curve (AUC) from the ROC curve quantifies detection performance, with higher values indicating superior accuracy. A curve closer to the top-left corner reflects better target identification with fewer false alarms.
This paper employs the Kolmogorov–Smirnov (KS) test to evaluate the distribution similarity between detection results and ground truth masks. For datasets without ground truth masks, we generate binary masks using target location annotations through element-wise multiplication with images and threshold processing. Let
and
denote the empirical cumulative distribution functions (ECDFs) of pixel intensities from detection results and ground truth, respectively. The KS statistic is defined as:
Here, D quantifies the maximum divergence between distributions. Smaller D values indicate stronger alignment with ground truth. In infrared dim-target scenarios characterized by extremely sparse targets (typically <0.01% pixels) and dominant background regions, the D-statistic derived from the KS test between threshold-constrained detection results and ground truth specifically reflects the suppression capability against high-confidence false alarms.
3.4. Qualitative Comparison
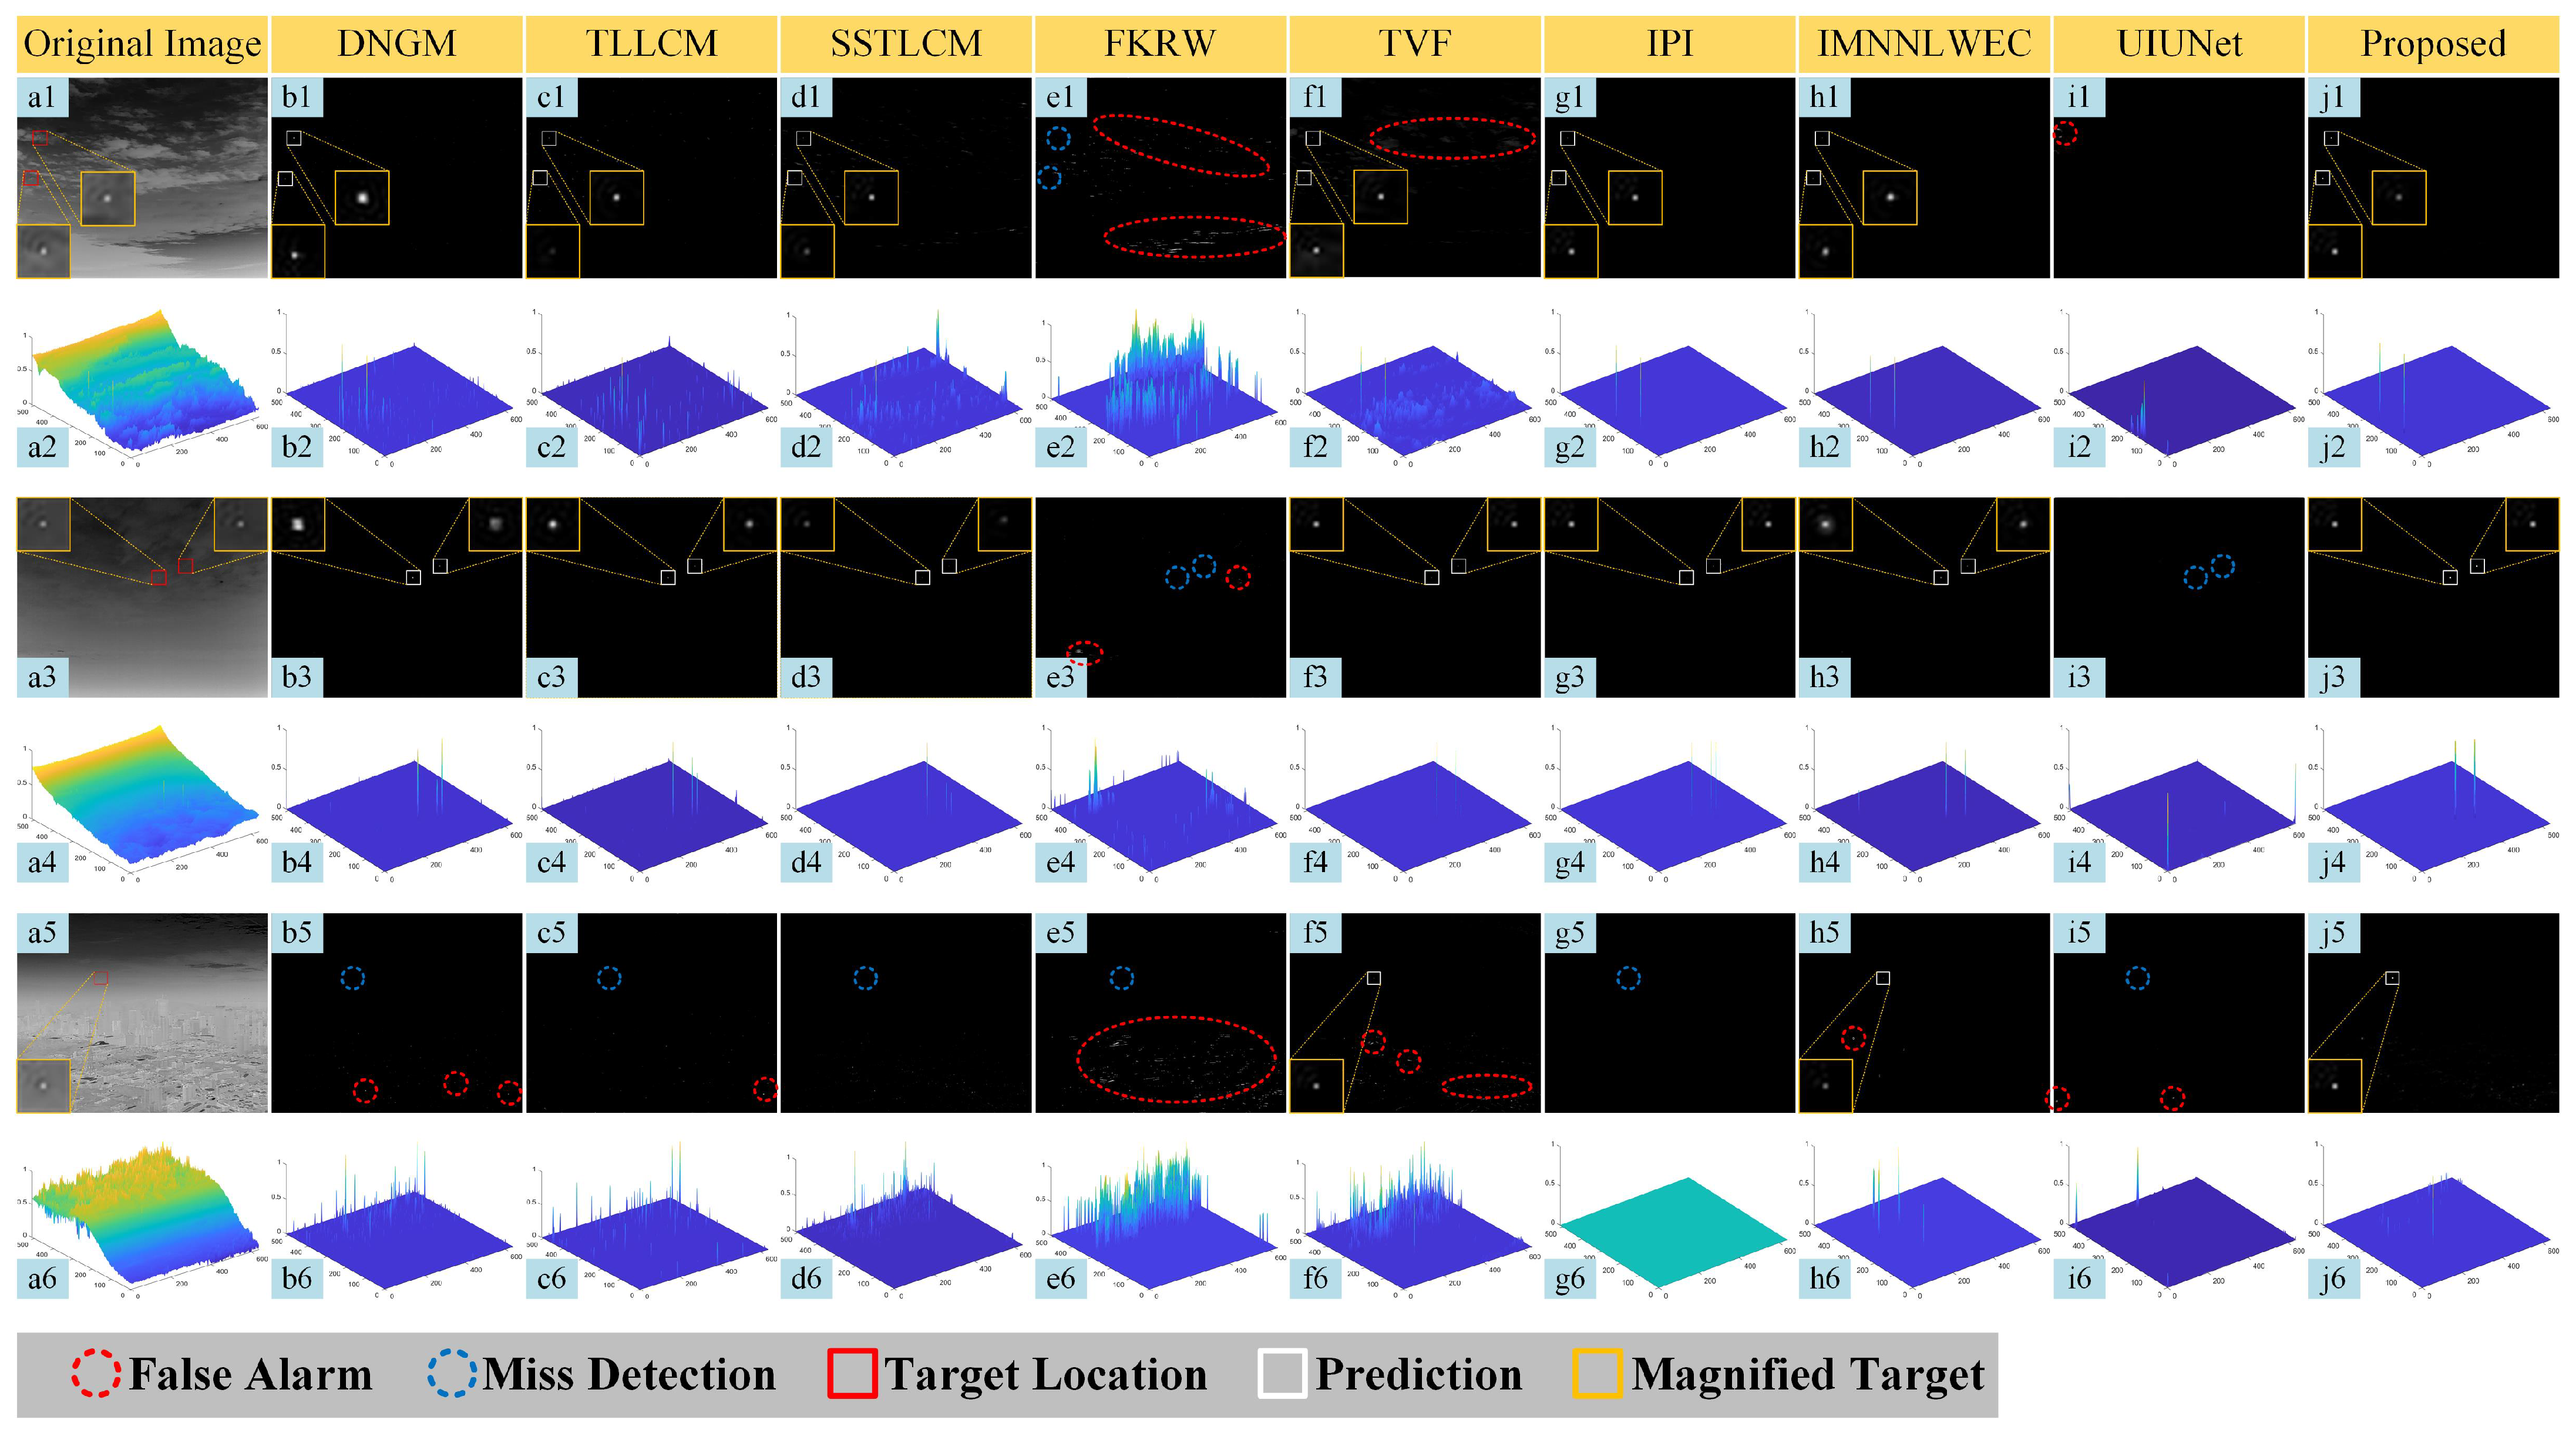
The qualitative detection results, shown in
Figure 7 and
Figure 8, include a selection of detection results with corresponding 3D diagrams. Detected targets are highlighted by red boxes and enlarged in the image corners. The backgrounds of Seq.1, Seq.2, Seq.3, and Seq.6 are complex, containing point-like clutter and bright elements. In contrast, Seq.4 and Seq.5 have simpler backgrounds but some feature very weak and multiple targets. The performance of different methods is analyzed as shown below.
3.4.1. TVF
The temporal filtering performance of TVF is excellent under simple backgrounds. However, in complex backgrounds, as the background moves in the image, the intricate structures of the background may be detected as false alarms due to phase shifts. This can be observed particularly in the detection results of TVF in
Figure 7(f1–f6), especially in the results of Seq.3.
3.4.2. LCM-Based Methods (DNGM, TLLCM)
The LCM-based methods of DNGM (
Figure 8(b1–b4)) and TLLCM (
Figure 8(c1–c4)), which are based on local contrast, show better visual performance under simple backgrounds. However, in complex scenarios, such as those shown in
Figure 7(b1–b6,c1–c6,d1–d6) and
Figure 8(b5,b6,c5,c6,d5,d6), they suffer from missed detections due to background interference.
3.4.3. SSTLCM
The spatiotemporal contrast fusion method SSTLCM exhibits suboptimal performance in comparative experiments, with missed detections and occasional false alarms observed for targets in complex scenarios (
Figure 7(d1–d6)). We attribute this deficiency to insufficient integration between temporal information analysis and spatial contrast extraction—failures in either aspect under complex scenarios directly lead to detection omissions.
3.4.4. LRSD-Based Methods (IPI, IMNNLWEC)
In LRSD-based methods, IPI detects a relatively large number of targets, but it also erroneously identifies sparse components from other regions as targets. In contrast, the IMNNLWEC method accurately locates sparse targets in simple cloud backgrounds but, as shown in
Figure 7(h1–h6), performs poorly in complex backgrounds.
3.4.5. Other Methods (FKRW, UIUNet)
In the experiment, FKRW performs poorly, generating numerous false alarms and failing to identify any true targets. The deep learning-based method, UIUNet, generally produces fewer false alarms, but, as seen in results like
Figure 8(i1–i6), it suffers from significant missed detections.
3.4.6. Proposed STFD Method
The proposed STFD detection method performs excellently across all six datasets. In complex backgrounds such as Seq.1, Seq.2, Seq.3, and Seq.6, it effectively filters out clutter caused by pixel displacement. For weak targets in Seq.4 and Seq.5, it effectively accumulates their energy across multiple frames. Overall, our method delivers the best visual results.
3.5. Quantitative Comparison
Table 3 and
Figure 9 present the experimental results, including BSF, SCRG, AUC, KS test results and ROC curves. In
Table 3, the best-performing results are highlighted in
bold italics, while the second-best results are
underlined. Notably, the BSF and SCRG are reported as average values calculated across all detection results for the entire sequence. The performance of different methods is analyzed as shown below.
3.5.1. LCM-Based Methods (DNGM, TLLCM)
Methods based on single-frame local contrast generally perform better on datasets with clean backgrounds, such as Seq.4 and Seq.5. Although the WTTLCM method achieves relatively high AUC values in Seq.1 and Seq.2, its lower SCRG and BSF values indicate difficulty in effectively detecting targets amidst significant clutter. This issue is further illustrated by the ROC curves in
Figure 9, while TLLCM’s elevated D-statistic values in Seq.1–Seq.3 (1.65
, 9.93
, 7.95
) further confirm its inadequate suppression of high-confidence false alarms.
3.5.2. SSTLCM
While spatiotemporal fusion-based methods like SSTLCM demonstrate superior background suppression in cleaner scenarios (BSF > 38, SCRG > 13 in Seq.4–Seq.6), their comparatively lower SCRG (4.41–11.80) coupled with elevated D-statistic values (5.17
–3.88
) in complex scenarios (Seq.1–Seq.3) reveal fundamental limitations in cluttered background rejection stemming from suboptimal fusion of spatial contrast analysis and temporal sampling mechanisms, which fails to filter structured background interference. This persists despite maintaining decent AUC levels, as shown in
Figure 9.
3.5.3. LRSD-Based Methods (IPI, IMNNLWEC)
The LRSD-based methods, IPI and IMNNLWEC, demonstrate strong performance in partially complex and simple backgrounds. IPI achieves the second-highest BSF and SCRG values in Seq.4 and Seq.5, along with relatively high AUC values in Seq.1 and Seq.2, with its superior false alarm suppression capability particularly evidenced by competitive D-statistic values in Seq.4–Seq.6 (2.70 , 6.93 , and 7.14 , respectively). However, in specific scenarios—such as Seq.3 and Seq.6 for IPI, and Seq.1 to Seq.3 for IMNNLWEC—these methods experience near-complete detection failures, with AUC values approaching 0.5 and ROC curves aligning closely with the lower axis. Notably, while maintaining decent background suppression in simpler environments (D-statistic < 8.51 in Seq.5–6), their dramatic performance degradation under cross-scenario validation (e.g., D-statistic surges to 3.79 in Seq.2 for IPI) fundamentally reflects insufficient robustness. These results highlight the lack of robustness of these methods across diverse scenarios.
3.5.4. TVF
The temporal-domain method TVF performs relatively well, achieving good results across Seq.1 to Seq.6. However, it struggles to identify false alarms caused by phase shifts in complex backgrounds, which limits its overall performance, particularly evident in Seq.3 where its D-statistic surges to 1.73 (over 10× higher than other sequences), primarily due to TVF’s insufficient temporal sensitivity in target perception and ineffective suppression of temporal clutter generated by image-shifting terrain structures adjacent to targets.
3.5.5. Other Methods (FKRW, UIUNet)
The FKRW method and the deep learning-based UIUNet exhibit poor performance in the experiments, lagging behind other methods in all metrics across Seq.1 to Seq.6. Although UIUNet demonstrates ostensibly competitive background suppression ratios (BSF > 50) and D-statistic values (1.26
in Seq.4–Seq.6), this anomaly actually stems from its pathological tendency to classify all pixels as background (zero-detection), as shown in
Figure 8, fundamentally revealing end-to-end networks’ deficient perception capability for low-texture dim targets in complex environments.
3.5.6. Proposed STFD Method
Analyzing
Figure 9 and
Table 3, our proposed method demonstrates superior performance, with its ROC curve closest to the top-left corner and all metrics ranking as either the best or second-best. This superiority originates from the TRC and RIA techniques, which effectively discriminate target-background intensity temporal profiles: despite significant background fluctuations in Seq.3, TRC effectively captures subtle temporal anomalies and synergizes with the GELCM-RIA fusion mechanism to eliminate interference. Notably, in Seq.2, Seq.3, and Seq.6, IMNNLWEC (Seq.2–3) and IPI (Seq.6) as representative single-frame methods fail to detect any targets in certain frames, resulting in abnormally high BSF values that exceed those of our method. However, this does not indicate superior detection performance because their collapsed SCRG scores (0.00), near-random AUC values, and ROC curves hugging the x-axis in
Figure 9 demonstrate conclusive evidence of complete detection failure. In Seq.2, the SCRG metric for IPI surpasses that of our method due to its sparse target assumption, which yields cleaner detection in the target neighborhood. Nevertheless, when considering the comprehensive AUC metric and the global background suppression ratio, IPI’s performance in Seq.2 is inferior to the proposed STFD.
Through quantitative experimental analysis, the STFD method demonstrates significant advantages in both cluttered and simple background scenarios. The background complexity quantified by the signal-to-clutter ratio (SCR) (as shown in
Table 1) indicates that Seq.1–Seq.3 and Seq.6 correspond to low-SCR scenarios (SCR < 10, high background complexity), whereas Seq.4–Seq.5 represent high-SCR scenarios (SCR > 10, low background complexity). Under this classification, STFD exhibits superior performance across key metrics. In low-SCR environments (Seq.1–Seq.3 and Seq.6), the Background Suppression Factor (BSF) achieves 21.39–80.34, with AUC-ROC values exceeding 0.95, demonstrating clear advantages over baseline methods. In high-SCR scenarios (Seq.4–Seq.5), the Signal-to-Noise Gain (SRG) improves to 71.34–91.46, accompanied by statistically significant superiority in the D-statistic compared with competing approaches. These results substantiate that STFD effectively mitigates the impact of background complexity variations on detection performance through its temporal profile characterization and spatiotemporal fusion mechanisms.
3.6. Runtime Analysis
We conducted runtime comparisons across Seq3, Seq4, and Seq6, including multi-scale sequences. UIUNet was excluded due to its GPU-dependent implementation, ensuring fair CPU-based benchmarking. As shown in
Table 4, the proposed method demonstrates competitive runtime performance, significantly outperforming computationally intensive iterative optimization methods while remaining comparable to lightweight single-domain filtering approaches. Though marginally slower than TVF and DNGM—which achieve speed prioritization through specialized acceleration—our approach delivers substantially superior background suppression (BSF) and target contrast enhancement (SCRG), as evidenced by the comprehensive metrics in
Table 1. This moderate computational overhead is well-justified given the critical improvements in detection reliability and clutter rejection capability, particularly in cluttered scenarios where conventional methods exhibit severe performance degradation (e.g., Seq3 D-statistic comparisons in
Section 3.5).
In terms of memory utilization, our method exhibits a moderate increase in consumption (34.74 MB–171.14 MB) compared with TVF (4.82 MB–226.42 MB) and DNGM (5.12 MB–216.64 MB), yet demonstrates significantly greater efficiency than memory-intensive approaches like IMNNLWEC (291.48 MB–293.05 MB). Notably, our method shows superior scalability on larger images, as evidenced by its performance on Seq4 and Seq6. While DNGM and TLLCM experience substantial memory growth (DNGM: 5.12 MB to 216.64 MB; TLLCM: 13.64 MB to 218.73 MB) and IPI suffers from extreme memory inefficiency (213.68 MB–213.72 MB), our approach maintains a more controlled memory footprint (34.74 MB–171.14 MB) with better computational stability. This elevated memory footprint primarily arises from the temporal fusion mechanisms essential for robust target detection in complex backgrounds. While lightweight methods achieve reduced memory usage through simplified processing pipelines, they fail to maintain comparable detection accuracy, as demonstrated in
Table 3. The memory trade-off in our approach is thus well-justified by its superior performance metrics, particularly in challenging scenarios where conventional methods struggle to balance detection capability and computational efficiency. This design optimization ensures reliable detection across diverse infrared scenarios while maintaining practical resource requirements, establishing an effective compromise between memory utilization and detection performance.
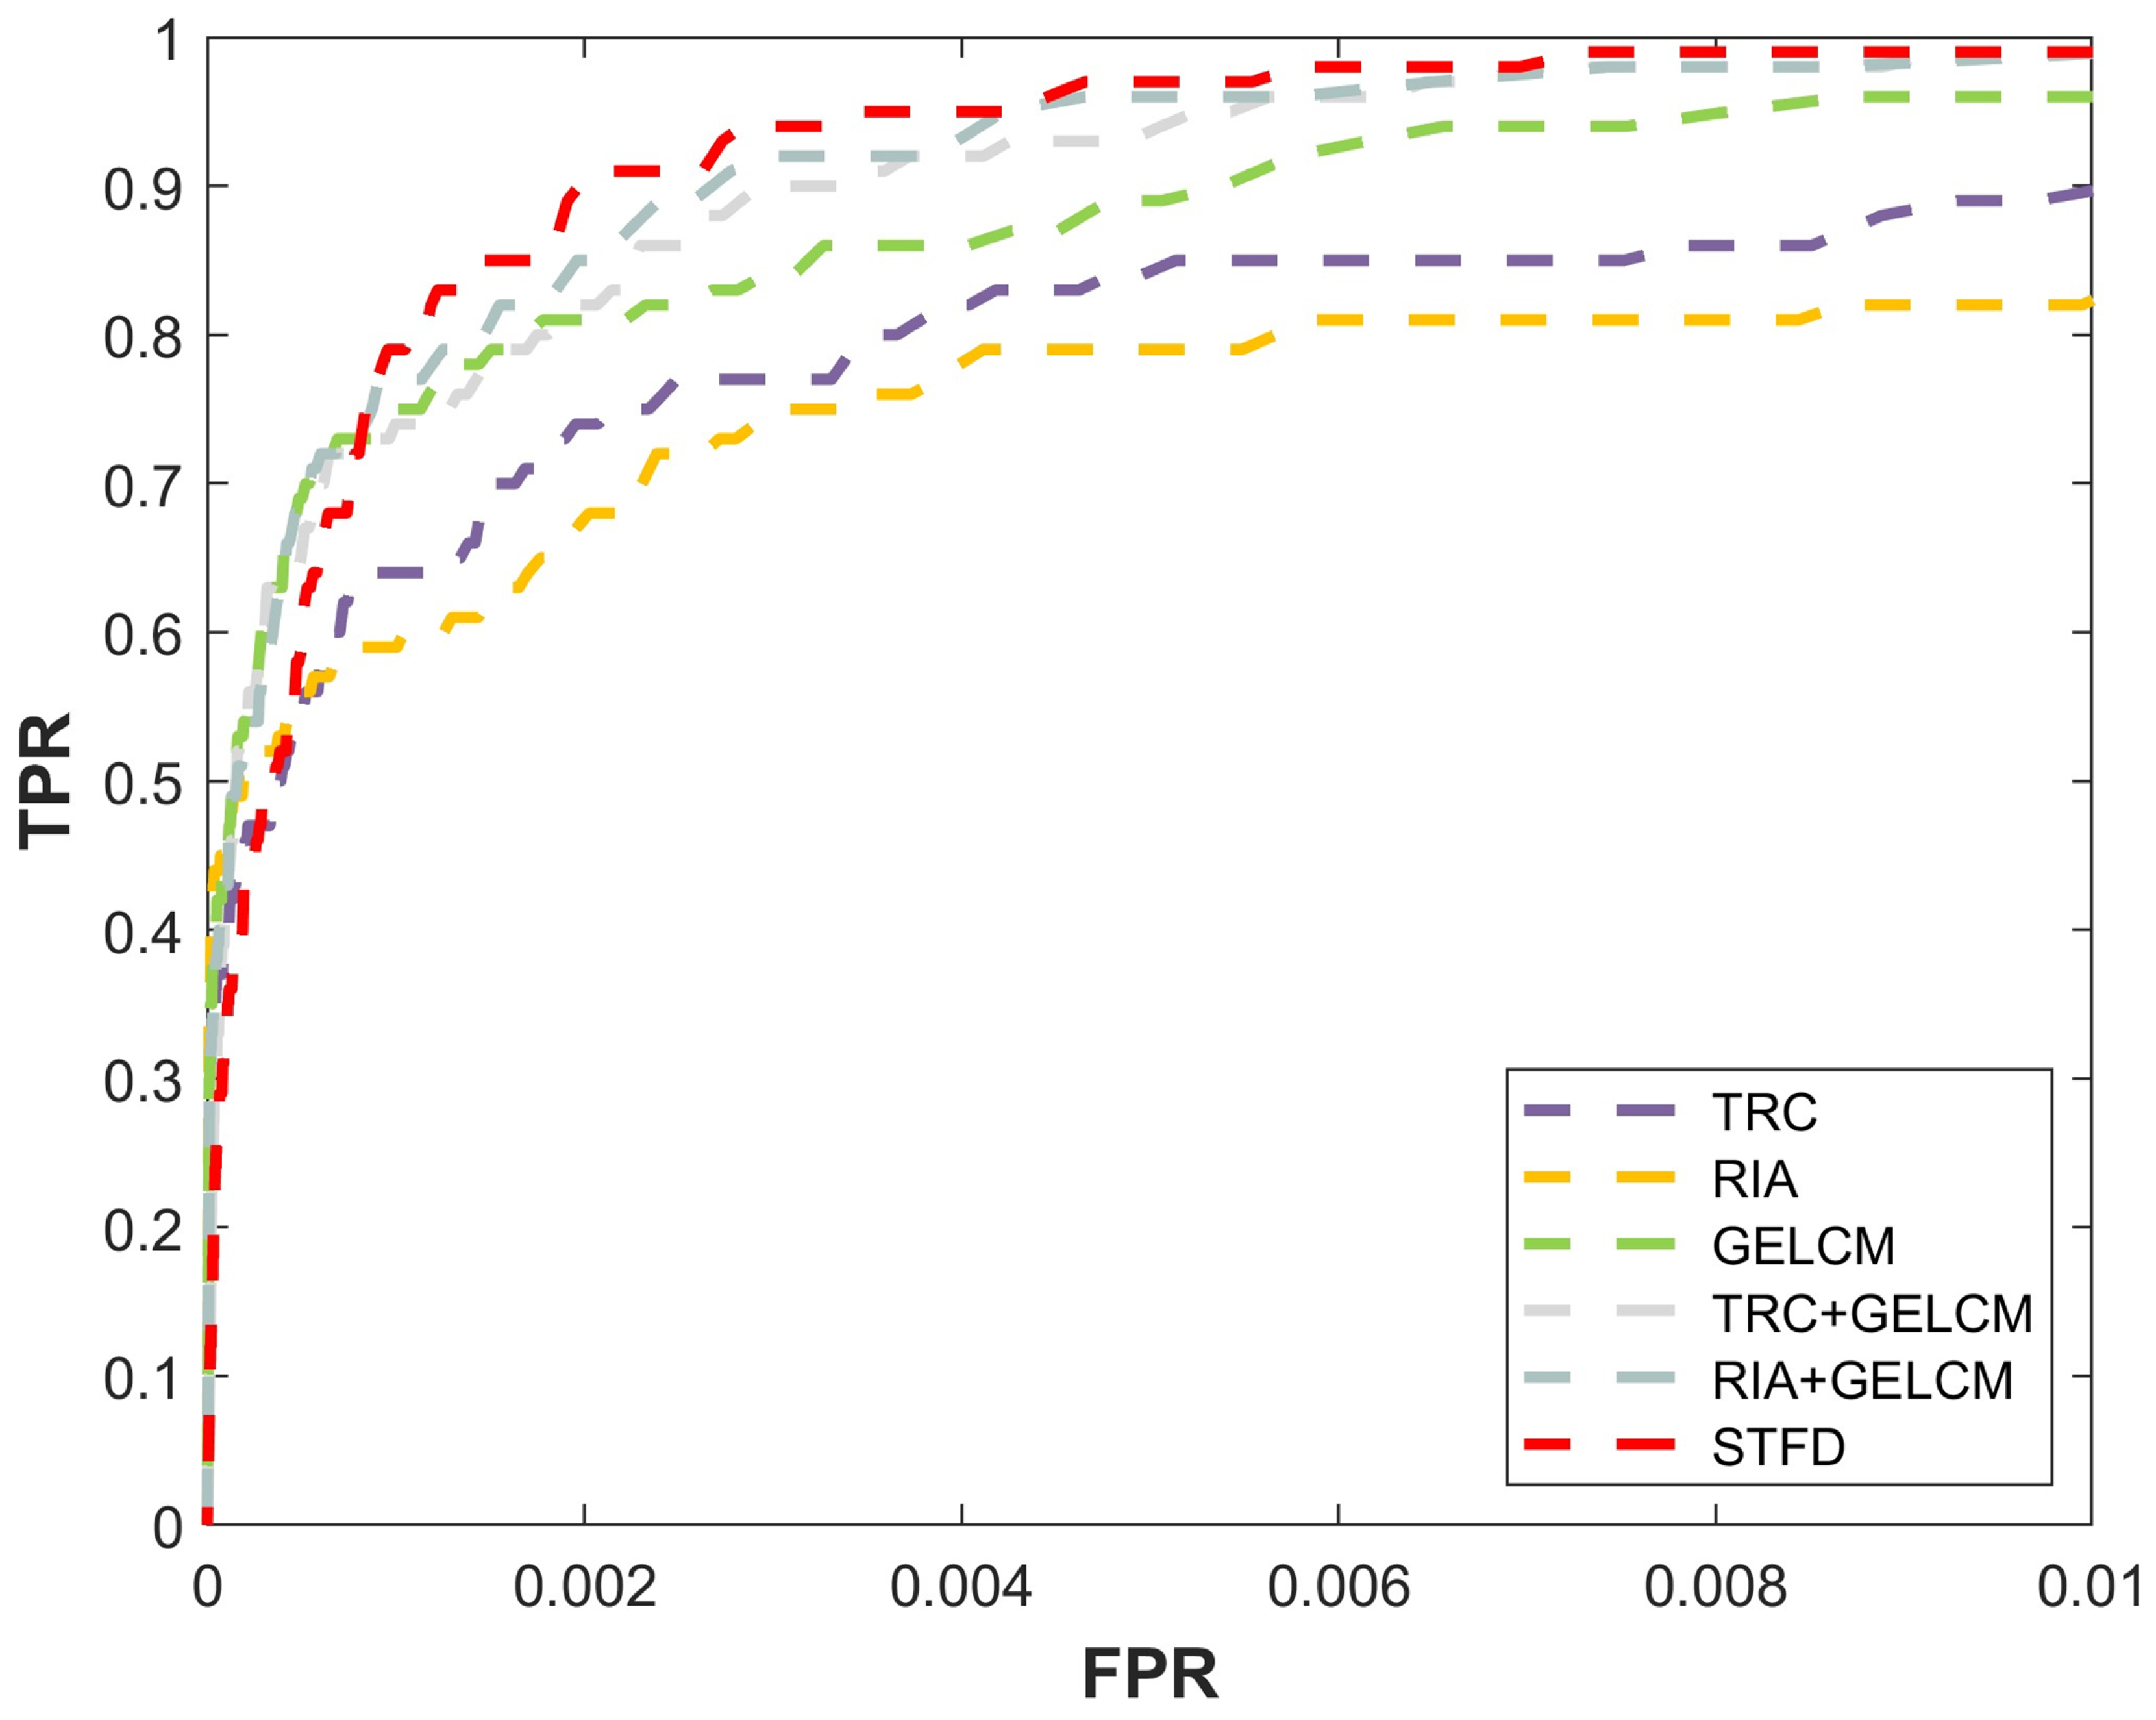
3.7. Ablation Study
This study conducted ablation experiments on the Seq. 3 scenario, analyzing TRC, RIA, GELCM, and their various combinations as shown in
Figure 10. From the experimental results, it can be observed that although the GELCM performs slightly better than TRC and RIA individually, the combinations of TRC+GELCM or RIA+GELCM significantly outperform the standalone methods. The proposed method achieves the best performance, highlighting the superior effectiveness of the approach and underscoring the rationality and robustness of the STFD design.
4. Discussion
The STFD framework achieves robust infrared target detection through a collaborative design of temporal and spatial analysis. By combining temporal coherence evaluation and gradient-enhanced contrast measurement, the method effectively addresses key challenges like transient noise interference and complex background suppression. The temporal components (TRC-RIA) enhance target persistence through multi-frame energy integration while filtering short-term clutter, while the spatial module (GELCM) distinguishes targets from textured backgrounds through adaptive gradient analysis. Critically, comprehensive experimental validation demonstrates STFD’s consistent effectiveness across diverse operational scenarios—from highly cluttered environments with overlapping terrain reflections to relatively uniform backgrounds under clear atmospheric conditions.
This balanced architecture ensures adaptability across varied operational conditions. Unlike methods specialized for either moving platforms or static scenes, STFD dynamically adjusts its emphasis on temporal versus spatial features based on scenario characteristics. The modular design not only simplifies computational implementation but also maintains interpretability—critical for practical systems compared with black-box deep learning models. Notably, STFD is particularly effective in high-frame-rate infrared small target tracking and detection tasks, such as aircraft IRST platform detection, space-based early warning systems, and ground-based UAV tracking, making it a versatile solution for military and surveillance applications.
Despite its strong performance, STFD has certain limitations that warrant further investigation. First, the computational complexity, though moderate compared with iterative optimization methods, may still pose challenges for extremely resource-constrained systems. To address this, future work could explore GPU acceleration or lightweight parallel computing architectures to enhance real-time performance. Second, the framework’s sensitivity to parameter settings, particularly in the GELCM’s gradient thresholds and TRC’s temporal window sizes, could affect its adaptability in highly dynamic environments. Potential solutions include integrating adaptive parameter optimization techniques, such as lightweight neural networks or reinforcement learning, to dynamically adjust these parameters based on scene characteristics.
These advancements could further expand STFD’s applicability in emerging domains such as autonomous drone navigation, satellite-based reconnaissance, and next-generation military surveillance systems, ensuring its relevance in the rapidly evolving field of infrared target detection. Such hybrid approaches would retain interpretable physical principles while adapting to evolving sensor technologies, striking a practical balance between reliability and adaptability. These enhancements would strengthen STFD’s applicability in even more challenging operational environments, ensuring its continued relevance in the evolving field of infrared target detection.
5. Conclusions
In this paper, we propose the Spatial–Temporal Fusion Detection (STFD) framework for small infrared target detection in diverse and cluttered backgrounds. STFD integrates Temporal Regional Contrast (TRC), Regional Intensity Accumulation (RIA), and the Gradient-Enhanced Local Contrast Measure (GELCM) to leverage both temporal and spatial information. TRC captures temporal intensity changes to highlight targets while suppressing transient clutter, RIA enhances weak targets through multi-frame energy accumulation, and the GELCM enhances spatial contrast for improved detection by analyzing local directional contrast and gradients. The combination of these components enables robust detection performance across various scenarios, including bright backgrounds, point-like clutter, and multi-target scenes, significantly outperforming mainstream methods.
By leveraging its modular design, STFD adapts to complex scenarios, with temporal components addressing background motion and dim targets, while the GELCM refines spatial details, reducing false alarms and missed detections. Experimental results showed that STFD achieves precise detection with minimal computational overhead. Future work may focus on advanced fusion strategies, precise shape modeling of dim targets, and neural network-based representations of temporal and spatial characteristics. STFD offers a promising foundation for real-time applications in infrared detection and tracking, particularly in challenging operational environments.
Author Contributions
Conceptualization, F.C. and L.L. (Liyuan Li); methodology L.L. (Liqi Liu) and X.N.; software, L.L. (Liqi Liu) and R.Z.; validation, L.L. (Liqi Liu); formal analysis, L.L. (Liqi Liu) and X.S.; investigation, L.L. (Liqi Liu) and X.N.; resources, L.L. (Liqi Liu) and X.S.; data curation, L.L. (Liqi Liu); writing—original draft preparation, L.L. (Liqi Liu); writing—review and editing, L.L. (Liyuan Li); supervision, F.C.; project administration, F.C. and L.L. (Liyuan Li); funding acquisition F.C. and L.L. (Liyuan Li). All authors reviewed the manuscript. All authors have read and agreed to the published version of the manuscript.
Funding
This work was supported by the National Natural Science Foundation of China under Grant No. 61975222 and 62405062, and the Strategic Priority Research Program of the Chinese Academy of Sciences under Grant XDA19010102 (CASEarth Minisatellite Thermal Infrared Spectrometer Project).
Institutional Review Board Statement
Not applicable.
Informed Consent Statement
Not applicable.
Data Availability Statement
The original contributions presented in the study are included in the article. Further inquiries can be directed to the corresponding author.
Conflicts of Interest
The authors declare no conflicts of interest.
References
- Ping, L.; Hui, X.; Juanfeng, W.; Bing, W.; Ligang, H.; Jinsuo, W. Research on early warning and detection capability of scanning camera of space-based infrared system. Infrared Laser Eng. 2022, 51, 20210977. [Google Scholar]
- Thanh, N.T.; Sahli, H.; Hao, D.N. Infrared thermography for buried landmine detection: Inverse problem setting. IEEE Trans. Geosci. Remote Sens. 2008, 46, 3987–4004. [Google Scholar] [CrossRef]
- Li, L.; Zhou, X.; Hu, Z.; Gao, L.; Li, X.; Ni, X.; Chen, F. On-orbit monitoring flying aircraft day and night based on SDGSAT-1 thermal infrared dataset. Remote Sens. Environ. 2023, 298, 113840. [Google Scholar] [CrossRef]
- Bai, X.; Zhou, F. Analysis of new top-hat transformation and the application for infrared dim small target detection. Pattern Recognit. 2010, 43, 2145–2156. [Google Scholar] [CrossRef]
- Qin, H.; Zhou, H.; Liu, S.; Li, F. Dim and small target background suppression using bilateral filtering. High Power Laser Part. Beams 2009, 21, 25–28. [Google Scholar]
- Zeng, Y.; Chen, Q. Dim and small target background suppression based on improved bilateral filtering for single infrared image. Infrared Technol. 2011, 33, 537–540. [Google Scholar]
- Bae, T.W.; Zhang, F.; Kweon, I.S. Edge directional 2D LMS filter for infrared small target detection. Infrared Phys. Technol. 2012, 55, 137–145. [Google Scholar] [CrossRef]
- Qin, Y.; Bruzzone, L.; Gao, C.; Li, B. Infrared small target detection based on facet kernel and random walker. IEEE Trans. Geosci. Remote Sens. 2019, 57, 7104–7118. [Google Scholar] [CrossRef]
- Lu, F.; Li, Y.; Chen, X.; Chen, G.; Rao, P. Weak target detection for PM model based on top-hat transform. Syst. Eng. Electron. 2018, 40, 1417–1422. [Google Scholar]
- Wang, T.; Chen, F.; Su, X. Research of infrared background suppression method based on anisotropic bilateral filtering. J. Hunan Univ. (Nat. Sci.) 2018, 45, 119–126. [Google Scholar]
- Huang, S.; Peng, Z.; Wang, Z.; Wang, X.; Li, M. Infrared small target detection by density peaks searching and maximum-gray region growing. IEEE Geosci. Remote Sens. Lett. 2019, 16, 1919–1923. [Google Scholar] [CrossRef]
- Perona, P.; Malik, J. Scale-space and edge detection using anisotropic diffusion. IEEE Trans. Pattern Anal. Mach. Intell. 1990, 12, 629–639. [Google Scholar] [CrossRef]
- Smale, S.; Rosasco, L.; Bouvrie, J.; Caponnetto, A.; Poggio, T. Mathematics of the neural response. Found. Comput. Math. 2010, 10, 67–91. [Google Scholar] [CrossRef]
- Li, H.; Wei, Y.; Li, L.; Yuan, Y. Similarity learning for object recognition based on derived kernel. Neurocomputing 2012, 83, 110–120. [Google Scholar] [CrossRef]
- Kim, S.; Yang, Y.; Lee, J.; Park, Y. Small target detection utilizing robust methods of the human visual system for IRST. J. Infrared Millimeter Terahertz Waves 2009, 30, 994–1011. [Google Scholar] [CrossRef]
- Chen, C.P.; Li, H.; Wei, Y.; Xia, T.; Tang, Y.Y. A local contrast method for small infrared target detection. IEEE Trans. Geosci. Remote Sens. 2013, 52, 574–581. [Google Scholar] [CrossRef]
- Wu, L.; Ma, Y.; Fan, F.; Wu, M.; Huang, J. A double-neighborhood gradient method for infrared small target detection. IEEE Geosci. Remote Sens. Lett. 2020, 18, 1476–1480. [Google Scholar] [CrossRef]
- Han, J.; Moradi, S.; Faramarzi, I.; Liu, C.; Zhang, H.; Zhao, Q. A local contrast method for infrared small-target detection utilizing a tri-layer window. IEEE Geosci. Remote Sens. Lett. 2019, 17, 1822–1826. [Google Scholar] [CrossRef]
- Cui, H.; Li, L.; Liu, X.; Su, X.; Chen, F. Infrared small target detection based on weighted three-layer window local contrast. IEEE Geosci. Remote Sens. Lett. 2021, 19, 1–5. [Google Scholar] [CrossRef]
- Xie, J.; Feng, S.; Huang, S.; Wei, D. UAV cluster detection algorithm based on weighted tri-layer window local contrast. Infrared Phys. Technol. 2023, 133, 104795. [Google Scholar] [CrossRef]
- Candes, E.J.; Wakin, M.B.; Boyd, S.P. Enhancing sparsity by reweighted ℓ1 minimization. J. Fourier Anal. Appl. 2008, 14, 877–905. [Google Scholar] [CrossRef]
- Gao, C.; Meng, D.; Yang, Y.; Wang, Y.; Zhou, X.; Hauptmann, A.G. Infrared patch-image model for small target detection in a single image. IEEE Trans. Image Process. 2013, 22, 4996–5009. [Google Scholar] [CrossRef] [PubMed]
- Luo, Y.; Li, X.; Chen, S.; Xia, C.; Zhao, L. IMNN-LWEC: A novel infrared small target detection based on spatial–temporal tensor model. IEEE Trans. Geosci. Remote Sens. 2022, 60, 1–22. [Google Scholar] [CrossRef]
- Liu, L.; Zhang, R.; Mei, J.; Ni, X.; Li, L.; Su, X.; Chen, F. ILN-SSR: Improved Logarithmic Norm and Sparse Structure Refinement for Infrared Small Target Detection. Remote Sens. 2024, 16, 4018. [Google Scholar] [CrossRef]
- He, K.; Zhang, X.; Ren, S.; Sun, J. Deep residual learning for image recognition. In Proceedings of the IEEE Conference on Computer Vision and Pattern Recognition, Las Vegas, NV, USA, 27–30 June 2016; pp. 770–778. [Google Scholar]
- Vaswani, A.; Shazeer, N.; Parmar, N.; Uszkoreit, J.; Jones, L.; Gomez, A.N.; Kaiser, Ł.; Polosukhin, I. Attention is all you need. Adv. Neural Inf. Process. Syst. 2017, 30, 6000–6010. [Google Scholar]
- Dosovitskiy, A.; Beyer, L.; Kolesnikov, A.; Weissenborn, D.; Zhai, X.; Unterthiner, T.; Dehghani, M.; Minderer, M.; Heigold, G.; Gelly, S. An Image is Worth 16x16 Words: Transformers for Image Recognition at Scale. In Proceedings of the International Conference on Learning Representations, Virtual, 3–7 May 2021. [Google Scholar]
- Hittawe, M.M.; Harrou, F.; Sun, Y.; Knio, O. Stacked Transformer Models for Enhanced Wind Speed Prediction in the Red Sea. In Proceedings of the 2024 IEEE 22nd International Conference on Industrial Informatics (INDIN), Beijing, China, 18–20 August 2024; pp. 1–7. [Google Scholar] [CrossRef]
- Nian, B.; Jiang, B.; Shi, H.; Zhang, Y. Local contrast attention guide network for detecting infrared small targets. IEEE Trans. Geosci. Remote Sens. 2023, 61, 5607513. [Google Scholar] [CrossRef]
- Zhang, T.; Li, L.; Cao, S.; Pu, T.; Peng, Z. Attention-guided pyramid context networks for detecting infrared small target under complex background. IEEE Trans. Aerosp. Electron. Syst. 2023, 59, 4250–4261. [Google Scholar] [CrossRef]
- Wu, T.; Li, B.; Luo, Y.; Wang, Y.; Xiao, C.; Liu, T.; Yang, J.; An, W.; Guo, Y. MTU-Net: Multilevel TransUNet for space-based infrared tiny ship detection. IEEE Trans. Geosci. Remote Sens. 2023, 61, 5601015. [Google Scholar] [CrossRef]
- Xu, S.; Zheng, S.; Xu, W.; Xu, R.; Wang, C.; Zhang, J.; Teng, X.; Li, A.; Guo, L. HCF-Net: Hierarchical Context Fusion Network for Infrared Small Object Detection. arXiv 2024, arXiv:2403.10778. [Google Scholar]
- Wu, X.; Hong, D.; Chanussot, J. UIU-Net: U-Net in U-Net for infrared small object detection. IEEE Trans. Image Process. 2022, 32, 364–376. [Google Scholar] [CrossRef]
- Silverman, J.; Caefer, C.E.; DiSalvo, S.; Vickers, V.E. Temporal filtering for point target detection in staring IR imagery: II. Recursive variance filter. In Proceedings of the Signal and Data Processing of Small Targets, Orlando, FL, USA, 13–17 April 1998; SPIE: Bellingham, WA, USA, 1998; Volume 3373, pp. 44–53. [Google Scholar]
- Niu, W.; Zheng, W.; Yang, Z.; Wu, Y.; Vagvolgyi, B.; Liu, B. Moving point target detection based on higher order statistics in very low SNR. IEEE Geosci. Remote Sens. Lett. 2017, 15, 217–221. [Google Scholar] [CrossRef]
- Liu, X.; Li, L.; Liu, L.; Su, X.; Chen, F. Moving dim and small target detection in multiframe infrared sequence with low SCR based on temporal profile similarity. IEEE Geosci. Remote Sens. Lett. 2022, 19, 7507005. [Google Scholar] [CrossRef]
- Yu, J.; Li, L.; Li, X.; Jiao, J.; Su, X.; Chen, F. Infrared moving small-target detection using strengthened spatial-temporal tri-layer local contrast method. Infrared Phys. Technol. 2024, 140, 105367. [Google Scholar] [CrossRef]
- Deng, L.; Zhu, H.; Tao, C.; Wei, Y. Infrared moving point target detection based on spatial–temporal local contrast filter. Infrared Phys. Technol. 2016, 76, 168–173. [Google Scholar] [CrossRef]
- Zhao, B.; Xiao, S.; Lu, H.; Wu, D. Spatial-temporal local contrast for moving point target detection in space-based infrared imaging system. Infrared Phys. Technol. 2018, 95, 53–60. [Google Scholar] [CrossRef]
- Qian, Y.; Chen, Q.; Zhu, G.; Gu, G.; Xiao, J.; Qian, W.; Ren, K.; Wan, M.; Zhou, X. Infrared small target detection based on saliency and gradients difference measure. Opt. Quantum Electron. 2020, 52, 1–21. [Google Scholar] [CrossRef]
- Liu, D.; Cao, L.; Li, Z.; Liu, T.; Che, P. Infrared small target detection based on flux density and direction diversity in gradient vector field. IEEE J. Sel. Top. Appl. Earth Obs. Remote Sens. 2018, 11, 2528–2554. [Google Scholar] [CrossRef]
- Hui, B.; Song, Z.; Fan, H.; Zhong, P.; Hu, W.; Zhang, X.; Lin, J.; Su, H.; Jin, W.; Zhang, Y.; et al. A Dataset for Infrared Image Dim-Small Aircraft Target Detection and Tracking Under Ground/Air Background. Sci. Data Bank 2019, 5, 4. [Google Scholar] [CrossRef]
- Guo, L.; Sun, X.; Zhang, W.; Li, Z.; Yu, Q. Small aerial target detection using trajectory hypothesis and verification. IEEE Trans. Geosci. Remote Sens. 2023, 61, 5609314. [Google Scholar] [CrossRef]
- Sun, X.; Guo, L.; Zhang, W.; Wang, Z.; Yu, Q. Small aerial target detection for airborne infrared detection systems using LightGBM and trajectory constraints. IEEE J. Sel. Top. Appl. Earth Obs. Remote Sens. 2021, 14, 9959–9973. [Google Scholar] [CrossRef]
Figure 1.
Temporal profile diagram, blue-bordered rectangles denote image frames; red-bordered hollow rectangles mark regions of interest; red arrows indicate target movement direction; multi-colored circles represent targets at different time points.
Figure 1.
Temporal profile diagram, blue-bordered rectangles denote image frames; red-bordered hollow rectangles mark regions of interest; red arrows indicate target movement direction; multi-colored circles represent targets at different time points.
Figure 2.
The flowchart of the STFD detection process.
Figure 2.
The flowchart of the STFD detection process.
Figure 3.
(a) Temporal profile diagram. (b) TRC’s sequence of interest.
Figure 3.
(a) Temporal profile diagram. (b) TRC’s sequence of interest.
Figure 4.
Comparison test of TRC and RIA in a simple background dim target scenario. As demonstrated in the figure under clean background conditions with low−contrast targets, the RIA method demonstrates superior detection capability over TRC across all evaluation metrics, including ROC curves, Background Suppression Factor (BSF), and Signal-to-Clutter Ratio Gain (SCRG).
Figure 5.
Gradient image and multi−directional contrast diagram.
Figure 5.
Gradient image and multi−directional contrast diagram.
Figure 6.
Visual and 3D surface analysis across sequences. (a1–f1) Infrared images from Seq.1 to Seq.6, with targets highlighted in red boxes and magnified in the image corners. (a2–f2) Corresponding 3D surface mesh diagrams for each sequence. Targets in the figure are annotated with red bounding boxes and magnified.
Figure 7.
Detection results and corresponding 3D visualizations for Seq.1 to Seq.3 using different algorithms. The red rectangle indicates the target location, with an enlarged view in the corner. A missing rectangle indicates a missed target in the frame. Rows 1, 3, and 5 (a1–j1, a3–j3, a5–j5) correspond to detection results for Seq.1, Seq.2, and Seq.3, respectively, while rows 2, 4, and 6 (a2–j2, a4–j4, a6–j6) show the 3D mesh visualizations for Seq.1, Seq.2, and Seq.3.
Figure 8.
Detectionresults and corresponding 3D visualizations for Seq.4 to Seq.6 using different algorithms. The red rectangle indicates the target location, with an enlarged view in the corner. A missing rectangle indicates a missed target in the frame. Rows 1, 3, and 5 (a1–j1, a3–j3, a5–j5) correspond to detection results for Seq.4, Seq.5, and Seq.6, respectively, while rows 2, 4, and 6 (a2–j2, a4–j4, a6–j6) show the 3D mesh visualizations for Seq.4, Seq.5, and Seq.6.
Figure 9.
(a–f) ROC curves of 9 methods in Seq.1–Seq.6.
Figure 9.
(a–f) ROC curves of 9 methods in Seq.1–Seq.6.
Figure 10.
ROC curve for ablation study.
Figure 10.
ROC curve for ablation study.
Table 1.
Details of datasets.
Table 1.
Details of datasets.
| Sequence Number | Frame Number | Image Size | Target Size | Target Number | Background Description | SCR |
|---|
| Seq.1 | 100 | 256 × 256 | 3 × 3 | 1 | Complex rural ground background | 7.02 |
| Seq.2 | 100 | 256 × 256 | 2 × 2–3 × 3 | 1 | Complex forest terrain with terrain-induced glare interference | 5.81 |
| Seq.3 | 100 | 256 × 256 | 1 × 1–3 × 3 | 1 | Complex hilly terrain background with overlapping clutter interference caused by terrain reflections | 2.94 |
| Seq.4 | 100 | 256 × 256 | 3 × 3 | 2 | Multi-target scenario with cluttered cloud background | 10.98 |
| Seq.5 | 100 | 256 × 256 | 1 × 1–3 × 3 | 2 | Relatively clear sky background | 15.88 |
| Seq.6 | 100 | 256 × 256 | 1 × 1–3 × 3 | 1 | Urban background under haze conditions | 7.32 |
Table 2.
Kolmogorov–Smirnov test between raw experimental sequences (D-statistic/p-value).
Table 2.
Kolmogorov–Smirnov test between raw experimental sequences (D-statistic/p-value).
| Sequence | Comparison Sequence |
|---|
| Seq.1 | Seq.2 | Seq.3 | Seq.4 | Seq.5 | Seq.6 |
|---|
| Seq.1 | – | 0.148/0.000 | 0.238/0.000 | 0.620/0.000 | 0.711/0.000 | 0.442/0.000 |
| Seq.2 | 0.148/0.000 | – | 0.198/0.000 | 0.568/0.000 | 0.669/0.000 | 0.363/0.000 |
| Seq.3 | 0.238/0.000 | 0.198/0.000 | – | 0.403/0.000 | 0.480/0.000 | 0.245/0.000 |
| Seq.4 | 0.620/0.000 | 0.568/0.000 | 0.403/0.000 | – | 0.152/0.000 | 0.447/0.000 |
| Seq.5 | 0.711/0.000 | 0.669/0.000 | 0.480/0.000 | 0.152/0.000 | – | 0.478/0.000 |
| Seq.6 | 0.442/0.000 | 0.363/0.000 | 0.245/0.000 | 0.447/0.000 | 0.478/0.000 | – |
Table 3.
Quantitative evaluation (AUC, SCRG, BSF) with KS test D-statistic validation.
Table 3.
Quantitative evaluation (AUC, SCRG, BSF) with KS test D-statistic validation.
| Sequence | Metrics | DNGM | TLLCM | SSTLCM | FKRW | TVF | IPI | IMNNLWEC | UIUNet | Proposed |
|---|
| Seq.1 | AUC | 0.9734 | 0.8334 | 0.9871 | 0.5377 | 0.9937 | 0.9096 | 0.4996 | 0.6048 | 0.9998 |
| SCRG | 2.64 | 7.34 | 6.87 | 0.31 | 21.36 | 27.59 | 0.00 | 7.27 | 33.38 |
| BSF | 4.59 | 3.27 | 4.70 | 1.61 | 7.54 | 2.38 | 3.44 | 11.91 | 21.39 |
| D-statistic | 7.48 | 1.65 | 5.33 | 5.67 | 4.61 | 9.03 | 4.40 | 2.56 | 2.52 × 10⁻⁵ |
| Seq.2 | AUC | 0.8868 | 0.7517 | 0.9984 | 0.6772 | 0.9650 | 0.8998 | 0.4997 | 0.8498 | 0.9999 |
| SCRG | 1.58 | 1.38 | 11.80 | 2.87 | 30.86 | 90.27 | 0.00 | 42.13 | 57.76 |
| BSF | 14.79 | 9.67 | 6.04 | 3.32 | 5.09 | 26.25 | 85.35 | 23.60 | 34.88 |
| D-statistic | 3.92 | 9.93 | 5.17 | 3.83 | 2.70 | 3.79 | 2.57 | 3.88 | 2.96 × 10⁻⁵ |
| Seq.3 | AUC | 0.6057 | 0.5229 | 0.9617 | 0.5165 | 0.9779 | 0.5400 | 0.5000 | 0.6845 | 0.9991 |
| SCRG | 0.31 | 0.20 | 4.41 | 0.44 | 10.70 | 19.92 | 0.00 | 36.59 | 80.34 |
| BSF | 4.14 | 6.54 | 12.21 | 4.61 | 7.89 | 31.21 | 4.66 | 23.68 | 29.56 |
| D-statistic | 3.11 | 7.95 | 3.88 | 5.16 | 1.73 | 2.70 | 3.42 | 3.48 | 7.23 × 10⁻⁶ |
| Seq.4 | AUC | 0.8615 | 0.8870 | 0.9336 | 0.6932 | 0.9953 | 0.9550 | 0.9275 | 0.6065 | 1.0000 |
| SCRG | 10.86 | 11.24 | 26.70 | 2.48 | 47.43 | 91.55 | 53.98 | 1.85 | 97.46 |
| BSF | 39.46 | 27.01 | 101.77 | 5.89 | 108.72 | 179.59 | 154.95 | 50.15 | 182.92 |
| D-statistic | 1.58 | 1.77 | 1.80 | 1.48 | 7.18 | 5.55 × 10⁻⁶ | 1.73 | 1.56 | 1.23 |
| Seq.5 | AUC | 0.9925 | 0.9800 | 0.9625 | 0.7047 | 0.9972 | 0.9700 | 0.8225 | 0.7824 | 1.0000 |
| SCRG | 16.61 | 20.91 | 21.34 | 6.142 | 28.02 | 46.30 | 7.597 | 1.172 | 71.34 |
| BSF | 100.30 | 91.05 | 127.20 | 15.14 | 122.34 | 131.94 | 98.90 | 67.66 | 151.05 |
| D-statistic | 1.05 | 7.23 | 7.17 | 4.05 | 3.05 | 6.93 × 10⁻⁶ | 7.26 | 1.26 | 6.84 |
| Seq.6 | AUC | 0.7478 | 0.7296 | 0.8073 | 0.5377 | 0.9770 | 0.5000 | 0.7200 | 0.6546 | 0.9994 |
| SCRG | 11.85 | 27.64 | 13.29 | 0.43 | 51.68 | 0.00 | 50.12 | 2.98 | 54.25 |
| BSF | 26.58 | 33.71 | 38.81 | 6.04 | 14.52 | 203.76 | 33.41 | 60.72 | 67.21 |
| D-statistic | 1.09 | 1.16 | 8.51 | 1.54 | 4.86 | 7.14 × 10⁻⁶ | 1.68 | 9.95 | 6.13 |
Table 4.
Runtime and memory cost comparison (Seconds/MB).
Table 4.
Runtime and memory cost comparison (Seconds/MB).
| Seq | Metric | DNGM | TLLCM | SSTLCM | FKRW | TVF | IPI | IMNNLWEC | Proposed |
|---|
| Seq.3 | Runtime | 0.384 | 25.806 | 11.88 | 9.344 | 0.025 | 59.239 | 167.324 | 1.950 |
| Memory | 5.12 | 13.64 | 33.37 | 16.55 | 4.82 | 6.57 | 291.48 | 24.74 |
| Seq.4 | Runtime | 1.838 | 124.114 | 18.40 | 16.924 | 0.091 | 1266.426 | 675.276 | 9.757 |
| Memory | 216.64 | 218.73 | 267.56 | 218.91 | 226.42 | 213.72 | 292.39 | 171.14 |
| Seq.6 | Runtime | 1.838 | 128.059 | 17.76 | 19.38 | 0.092 | 522.474 | 689.988 | 9.893 |
| Memory | 216.26 | 218.72 | 267.33 | 291.11 | 178.99 | 213.68 | 293.05 | 170.98 |
| Disclaimer/Publisher’s Note: The statements, opinions and data contained in all publications are solely those of the individual author(s) and contributor(s) and not of MDPI and/or the editor(s). MDPI and/or the editor(s) disclaim responsibility for any injury to people or property resulting from any ideas, methods, instructions or products referred to in the content. |
© 2025 by the authors. Licensee MDPI, Basel, Switzerland. This article is an open access article distributed under the terms and conditions of the Creative Commons Attribution (CC BY) license (https://creativecommons.org/licenses/by/4.0/).


 ,
, 


