Abstract
This paper presents an experimental investigation of drivers’ reading reaction times and errors when reading a speedometer as a part of a complex instrument cluster. The laboratory-based experiment involved 32 participants and 7 instrument clusters from existing passenger cars. The objective of this study was to analyze the effects of different instrument cluster (IC) designs on the time and accuracy of information retrieval from the speedometer, including correlations with participants’ age and gender. Reaction times ranged from 451 ms to 11,116 ms. Reading accuracy was assessed based on the number of coarse errors, among other factors. The results indicated no influence of participants’ gender on performance, while a moderate positive correlation was observed between reaction time and participants’ age. Specific design features of both the speedometer and the IC that could be related to the results were identified. From the point of view of both reaction time and reading accuracy, centrally located speedometers (whether digital or analog) were found to be more effective. The highest number of coarse errors occurred when participants misread information, attributed to unfavorable layouts and designs of two instrument clusters.
1. Introduction
Traffic- and vehicle-related information are displayed by individual means in vehicles and by collective means on the roadside (visible through the windshield) [1,2,3,4]. The motor vehicles are equipped with indicators and instruments positioned on the instrument cluster (IC) and on the central console as part of the human–machine interface (HMI). Driver–Vehicle Interface (DVI) is the more commonly used term because the term HMI is not limited to vehicles. Ergonomic aspects of information displays for navigation, Transport Information and Control Systems (TICSs), Intelligent Transportation Systems (ITSs), touch screen controls, and Advanced Driver Assistance Systems (ADASs) warnings and the design of the system’s safety are in the current focus of the regulations and research [5,6,7]. One of the reasons is the trend to transfer more and more information from outside the vehicle (roadside information means) to in-vehicle traffic information services [6,8].
The instrument cluster consists of instruments, displays, and indicators that provide the driver with various information. Although, in fact, there are no restrictions on the type and range of information provided, a cluttered instrument cluster (information noise) and/or unfavorable display characteristics lead to long glance duration and/or may cause difficulties in finding appropriate information. This leads to distraction from the primary driving task or results in misreading or misunderstanding [4,5,6,9]. Individual instruments or indicators must not have too complex graphics, small size, low contrast, rapidly changing information, etc. [5,6,7]. The time period required to take the eyes off the road to the instruments, reading, and understanding the information should be as short as possible [5,6]. The research of Rockwell et al. (cited in [1]) showed that the average time to read the speed from an analog speedometer (a moving pointer on a fixed scale) is about 0.5–1.2 s. In the research of Göbel et al. (1998), presented in the report [5] (Chapter 12, p. 75), it was estimated that transit bus driver has a speedometer gaze frequency at a rate of 45 per hour and a mean duration of 0.65 s. Kroon et al. [6] stated that glances to collect relevant in-car information should not last longer than 2 s. The Standard ISO 15005 set an upper limit of 1.5 s for TICS [10]. Accordingly, the design and content of the automobile instrument cluster is a compromise between providing information to the driver and distracting attention from the driving task. However, style and technology are also factors that influence a final IC design.
Vehicle speed is a dynamic variable, and this information must be available to the driver at any given moment [5,8]. Every motor vehicle must be equipped with a speedometer, which is the most frequently used instrument in the vehicle [1]. The speedometer is placed on the instrument cluster within the primary field of vision, and it must be clearly legible both day and night [1,2,5]. There are two types of speedometer styles in modern vehicles in terms of the visual presentation of the vehicle speed [2,3,8]. The first one is the analog presentation, where the speed is indicated by a moving pointer and its position within a fixed round scale (pointer and dial). This presentation could be called a classic design. The instrument can be mechanical with a physical pointer or as a graphic on an electronic liquid crystal display (LCD). The second type is a numerical presentation of the vehicle speed (digital speedometer). There are also ICs that combine both presentation modes. Analog presentations have remained popular in the European market, while digital displays are preferred in the US and Japan [3]. Analog instruments should show better results in comparing speed values, such as “speed is increasing”, “speed is over the limit”, etc. On the other hand, digital instruments enable easier perception of quantitative results [2,8]. The third type is the additional Head-Up Display (HUD), which is increasingly being used in vehicles, although it is still not mandatory. A HUD with digital speed presentation reduces distraction time and minimizes eye accommodation [2,11].
Despite the fact that the speedometer is probably the oldest instrument used since the beginning of the motor vehicle era, it can still be found as a subject of research in recent literature. Vehicle speed monitoring is important and can be treated as a medium to high warning priority. Although it may not always be related to the cause of the accident, inappropriate vehicle speed is one of the major contributors to road safety, which increases both the number of traffic accidents and the severity of their consequences. Huang et al. [12] presented a detailed review of the relationship between inappropriate speed and crashes as well as worldwide statistics of offenses caused by speeding. In addition, they identified traffic congestion as one of the primary causes of drivers’ inappropriate speed choices. Parthasarthy et al. [13] have investigated the use of speed alerts that minimize the driver’s perception time without adding redundant visual clutter. The alert devices were placed at different locations within the vehicle. The experiments were conducted in a simulator with 24 participants. The results showed that younger participants (18–23 years) better responded to the visual alerts and obeyed speed limits compared to the older and more experienced participants. In addition, alerts in the mid-peripheral visual region and alerts that flashed had better response rates for observing speed limits.
The driver’s reaction is not necessary every time if the speed is appropriate for the current situation. Without a speedometer, the driver’s subjective estimation of the vehicle’s speed is relatively unreliable. It depends on visual and auditory inputs and his/her experience, and the driver must use visual, quantitative information from the in-vehicle instrument [2,4]. The importance of speedometers is reflected in the finding that drivers tend to adapt to sustained speed over a period of time. The consequence is a decrease in the perceived speed of the vehicle without looking at the speedometer [4]. According to the study carried out by Gstalter and Hoyos (cited in [4], p. 29), the average speed error was more than 20 percent higher when drivers were asked to reduce the speed to the instructed value without the aid of the speedometer. The error was also present when drivers went from a lower speed to a higher one. Re-adaptation from the so-called “speed creep” lasted several minutes [4].
Vehicle speed control is also important for fuel-efficient driving. Allison and Stanton [14] proposed in-vehicle interfaces designed to reduce fuel consumption and emissions. One example is a dynamic graphical indicator on the speedometer, which suggests the best possible speed for the current location to minimize the likelihood of stopping because of traffic lights or congestion. A similar method was proposed by Schewe and Vollrath [15] to extend the speedometer into an interface for optimal safe speed and distance control.
In the study of Quan et al. [16], the speedometer observation pattern was investigated using questionnaires and accident investigations. The subjects were 63 male drivers and 44 female drivers. The authors concluded that about half of the subjects frequently observe the speedometer, but almost half of the drivers think that the speed observation has different degrees of burden. Nearly 80% believe that they are sensible about the speed of a car and they can estimate the speed in many ways. Their results showed that female drivers have a lower sensitivity to speed than male drivers. Female drivers and new drivers usually pay more attention to the speedometer. Drivers who wear glasses have a higher observation frequency and a higher burden. The data about the type of vehicles or design of the instrument cluster were not given in their paper.
The effects of driver gender and age are generally taken into account when a group of subjects participates in ergonomic experiments. Differences in relevant performances between men and women are not practically significant, but age certainly has effects [4,8,17,18]. Human visual performance, response time, channel capacity, and processing time required for decision-making decline with age. A study by Weiss [19] aimed to assess how young (20 participants aged 20 to 30) and older drivers (30 participants aged 65 years and over) interacted with novel instrument cluster designs while driving. Four IC designs with different levels of complexity were used during simulated driving tasks. The performance was measured as the time required to retrieve information from the IC. The results indicated that the novel instrument clusters did not make reading easier for older drivers.
In the study by François et al. [20], the efficiency, usability, and visual distraction of three types of speedometers were compared: digital, analog, and redundant speedometers. Measurements with a group of 18 active male truck drivers were performed in a simulated truck driving setup. The primary driving task was to follow a car in front of the truck. The speedometers were tested for absolute reading, relative reading, and dynamic reading. The authors concluded that the digital speedometer is more efficient and less visually distracting for absolute and relative readings, while the analog speedometer is more effective for speed change detection. The redundant speedometer has the best performance compared to the other two types. In their experiments, only the speedometer was displayed on the instrument cluster to isolate its effect, and interactions with other gauges and instruments have not been investigated.
Electric vehicles (EV) and autonomous vehicles are changing the concepts of DVI, directing numerous research projects toward reconsidering IC design [8,21,22]. The study by Stromberg et al. [22] aimed to evaluate two different IC concepts for EV. The first IC concept was based on a traditional IC, while the design of the second concept was inspired by other battery-operated products. The results showed that the participants had problems understanding the EV-specific information content independently of concepts. In addition, the subjects considered the speedometer to be the most important instrument, and if it was not placed in the middle of the IC, this was taken as a disadvantage. The study of Papakostopoulos and Marmaras [23] aimed to evaluate the usefulness of the information provided to the drivers by the conventional vehicle display units. Drawing from memory was used as the method to obtain traces of the operative images of 425, both experienced and less experienced non-professional drivers. In addition to the survey data, directions were also created that would lead to the simplification of future displays. One of the suggestions was to omit some less important gauges and simplify the numbering and labeling of the speedometer.
An ergonomically appropriate visual instrument should provide correct information to the driver in the shortest possible time. In general, the main attributes of IC that are considered favorable in terms of reading errors and information retrieval time are as follows [1,2,8,10,24]:
- Large instrument and large characters on it;
- An instrument which is distinctive on the cluster;
- High contrast between the number/pointer and the background of the instrument;
- Motion compatibility.
Mandatory information and basic display or instrument design, characteristics, and position are defined by relevant standards and regulations [5,25,26], but there is still a lot of space for IC design diversity. The motivation for this study was the fact that there are large differences in IC design among different types and series of vehicles, even within the same brand [27]. A variety of visual HMIs designed across vehicle manufacturers may impact driver distraction [28]. Reconfigurable ICs and someone’s personalization of IC could pose a similar problem. The research of Davidsson and Alm [29] has shown that drivers need and want different types of information in different contexts. Their results indicated low consensus about the display function among 33 drivers that were involved in the study and that the design of the display should be individualized.
The conditions of the experiment presented in this paper correspond to the situation when an active driver changes the type of vehicle: using a rent-a-car, borrowing someone’s vehicle, getting a substitute car from a workshop, car sharing, etc. When the driver is familiar with a certain type and model of the IC, it is assumed that the reading of the instrument is easier, faster, and more accurate than when the driver is faced for the first time with the IC in the vehicle he or she is driving.
The literature review shows that experiments with assessment of instrument performances are usually conducted on a generic instrument that is presented in isolation from other instruments and indicators. The experiment in this study was designed to include the effects of the entire real-world instrument cluster on the results but to exclude the driving task workload. Seven complete instrument clusters were selected from modern and older types of real-world passenger cars. The experiment was laboratory-based, using a graphical representation of an instrument cluster model. The collected quantities were reaction time (RT) and speedometer reading accuracy. The participants were 32 persons of different ages and both genders.
The results of the experiment under the given conditions should provide insight into the following main questions:
- Is there a correlation between reaction time and reading accuracy?
- Do speedometer design type (analog or digital, i.e., classic or modern) and its interaction with other instruments, as well as IC, affect the speedometer reading efficiency, expressed through the time and accuracy of information retrieved from the speedometer?
- What individual characteristics of the speedometer design and the overall design of the ICs from the sample can be identified as important to the results, both positively and negatively?
Since the participants are gender- and age-mixed, between-subject influences on the results are also taken into account, in order to check and identify possible correlations with some of the characteristics of the ICs.
2. Material and Method
Research aimed at determining the driver’s reaction time can be carried out in real driving conditions (field tests) or in laboratory conditions. Given that the stimuli of the subjects in this research came from the interior of the car (instrument cluster), and in order to facilitate control of the boundary conditions, this experiment was conducted in laboratory conditions using a simplified model of the instrument cluster. Other influencing parameters (traffic, vehicle control, dynamic effects, etc.) were excluded from this experiment so as not to affect the results but to isolate the influence of the IC design.
2.1. The Experimental Setup
The layout of the experimental equipment is shown in Figure 1. Images of instrument clusters were presented to the participants on a Lenovo ThinkPad T590 laptop. The laptop has a 15.6 inch FHD IPS antiglare display and a resolution of 1920 × 1080. The laptop display was positioned at an angle of 22° from the vertical side, at an approximate distance of 0.7 m from the subject’s eyes.
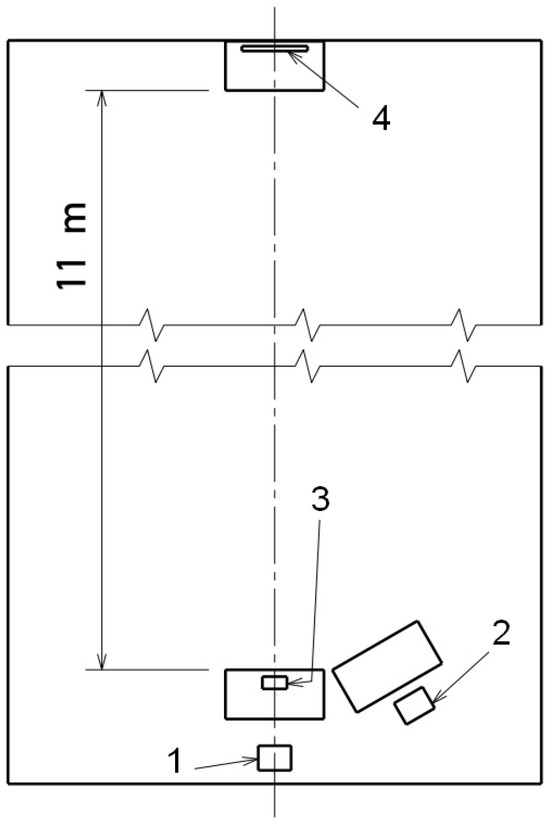
Figure 1.
Scheme of the laboratory setup. 1—participant, 2—examiner, 3—laptop, 4—monitor.
The monitor was positioned at a distance of 11 m from the table where the participants were sitting (Figure 1 and Figure 2). The monitor was Grundig Vision 9 32-9970 T/C, 32 inch Active Matrix TFT LCD screen and a resolution of 1920 × 1080. The monitor was used as a target to keep the participants’ gaze ahead before reading the instrument cluster.
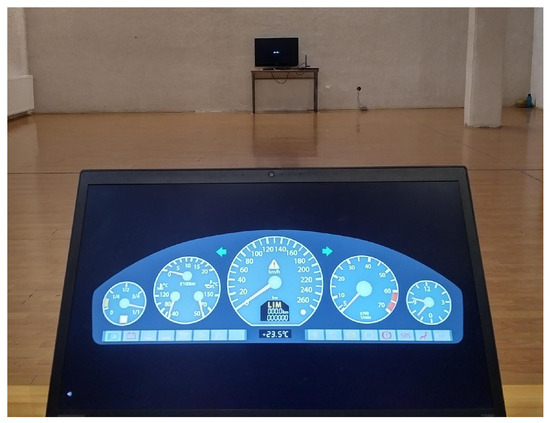
Figure 2.
A view from the participant’s place: the instrument cluster at the laptop’s display and the monitor.
Auditory signals were recorded using the laptop’s microphone. The audio analysis software was Audacity version 3.7.1 (https://www.audacityteam.org/, accessed 28 August 2023).
The examiner sat next to the participant to verbally instruct the participant on the procedure.
2.2. The Participants
The participants were 16 male and 16 female active non-professional drivers of passenger cars, all aged between 22 and 75 years, who participated voluntarily. All participants live in Serbia, and they are not professionally related to the automotive industry or design. They were recruited through a combination of personal or telephone contact or via email. The sample was chosen so that the participants are approximately equally distributed in three age and gender-balanced groups: 20–30 years, 30–60 years, and over 60 years. The participants had normal or corrected-to-normal vision. Their average age was 44.3 years, and the standard deviation (SD) was 18.7 years (man: average 45.3 years, SD 20.2 years, women: average 43.3 years, SD 17.6 years). To the best of the authors’ knowledge, the participants do not own any of the cars whose instrument clusters were used in this experiment.
2.3. The Instrument Clusters
Table 1 shows the main speedometer characteristics of selected instrument clusters. The criterion for the selection of instrument clusters was to have mutually different design characteristics. The ICs are coded according to the numbers given in the Table 1: IC01…IC07.

Table 1.
The main characteristics of the speedometers and the ICs. Speedometer type: D—digital, A—analog. Style: C—classic, M—modern.
The common attributes for all ICs are that they have moderate to high contrast between the speedometer background and the pointer, as well the scale markings (as recommended for in-vehicle visual presentation from the ISO 15008 Standard [7]), the speedometer characters have a visual angle greater than 20′ under the given conditions, and the characters are without serifs.
The instrument clusters are shown in Figure 3 and Figure 4. The instruments and indicators are in the state presented to the participants in the two test sessions (moderate and high speed). The first four ICs (Figure 3) can be described as traditional or classic (C) designs, while the last three (Figure 4) are modern designs (M).
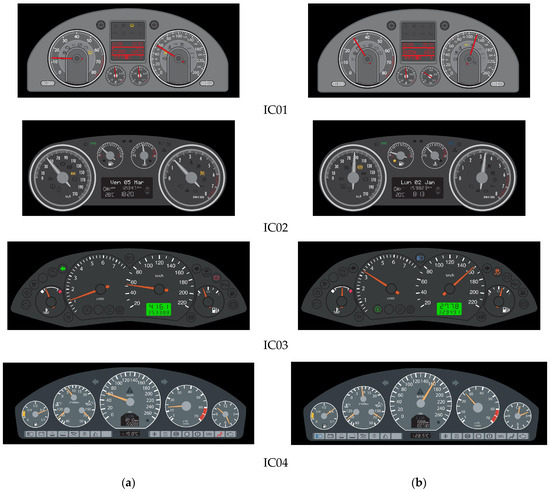
Figure 3.
Classic-style instrument clusters (IC no. 1 to 4 in Table 1), set to medium speed (a) and higher speed (b).
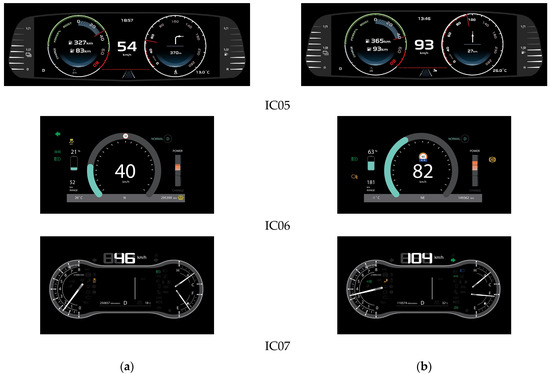
Figure 4.
Modern-style instrument clusters (IC no. 5 to 7 in Table 1), set to medium speed (a) and higher speed (b).
2.4. Boundary Conditions
The experiments were carried out indoors under artificial light in the period from 5 June 2023 to 7 July 2023, between 4 and 9 p.m. Ambient light and microclimatic conditions were kept approximately the same in all experiments.
2.5. Experimental Procedure
Before the regular tests began, the examiner explained the procedure of the experiment to each participant. The participants were first shown all ICs, after which they had trial tests. All participants were tested with each IC in two test groups, i.e., sessions. In the first session, the speedometers were set to a moderate speed, while in the second session, the speed was in a higher range. The order of the ICs remained the same in those two sessions.
The monitor at a distance of 11 m from the test site should ensure that prior to the instrument reading, the participant’s gaze and attention are directed far ahead and not on the instrument cluster because the experiment was not conducted in real or simulated driving conditions (Figure 2). Simple mathematical expressions (e.g., 3 + 4 = ?) appeared randomly on the monitor. At the beginning of the test, the participant had to give the correct answer after the examiner’s question, “What is the result of the expression?”.
After the given answer, the appearance of a static image of the IC on the laptop display is announced by a sound signal (beep). The participant must clearly pronounce the speed they read from the speedometer when it appears. The duration between the sound signal and the onset of the participant’s answer in milliseconds (ms) in this experiment was recorded by the audio analysis software (Figure 5).
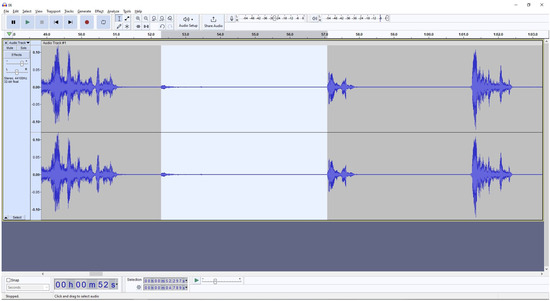
Figure 5.
Example of a screenshot of the recorded sound. The light area represents the period taken as the reaction time.
2.6. The Depending Variables
2.6.1. Reaction Time
During the reading of the data from an instrument, the driver’s eyes will be off the road. This period is probably more important in terms of driving safety than the accuracy of the information perceived from the instrument. The so-called duration of diversion consisted of the following [30]:
- Transition time;
- Glance duration (saccades + fixations).
Transition time is the period of movement of the gaze direction from the road to the instrument cluster and back. A Saccade is a fast movement of the eyes (direction of gaze) that changes the point of fixation within one or more areas of interest [30]. The duration of the saccade depends on the complexity of the IC as well as how familiar the driver is with the layout of the IC. Fixation is the period during which visual information is extracted from the area of interest. The duration of the fixation depends on how the speed value is presented, that is, on the visual characteristics of the speedometer. Transition, saccade, and fixation durations can be determined using eye-tracking equipment, which was not used in these experiments.
The time period from moving the eyes from the road to understanding the information is taken as reaction time (RT) in this study. RT in real-world conditions includes vehicle speed correction, if necessary, after making a decision based on the received speed information. RT should be as short as possible but cannot be zero. The upper limit value was not defined in this study. Since this experiment was conducted under laboratory conditions, it was expected that the RT could be much longer in some cases than in real driving conditions without the safety issues caused by the eyes off the road. Therefore, eye contact with the speedometer in real driving conditions can be interrupted at any time.
2.6.2. Accuracy of Readings
The difference between the value read by the participant from the speedometer and the set speed is the reading error:
where
Δv = vr − vs,
- vr—read value (km/h);
- vs—set speed (km/h).
A read error can be positive or negative. A positive error is the case when the read value is larger than the set value, as it is more preferable for driving safety (also related to the defined accuracy of the speedometer [25]). A reading lower than the actual speed can be considered unfavorable for driving safety.
Absolute error values (error magnitude) were used to quantify the error for individual ICs and to avoid the influence of negative values.
In order to normalize the error for different values of the set speed, the relative error was used. The relative error E was calculated as the ratio between the reading error Δv and the set speed vs:
E = Δv/vs = (vr − vs)/vs,
3. Results and Discussion
A total of 448 tests were performed (2 sessions with 32 participants and 7 ICs). The results directly collected from the experiments were the reaction time (RT in ms) and reading speed values (vr, in km/h). The results of RT and speedometer readings for Sessions 1 and 2 are given in Table A1, Table A2, Table A3 and Table A4 (Appendix A), including descriptive statistics.
3.1. The Effect of Gender and Age of the Participants
The effect of participants’ gender on RT and on error was preliminarily analyzed using the t-test for the results of the male and female groups. The test gives the probability (p-value) that the difference in the means of the two groups (men and women) could have been due to chance or other effects. If the probability is below the adopted significance level (α = 0.05), the difference can be considered statistically significant.
Relatively high values of p for each individual IC indicate that the gender of the participant has no significant effects on RT (p = 0.255…0.913) and on reading error (p = 0.167…0.960) in the conducted tests.
The effect of the participant’s age on the mean RT is described by the correlation coefficient. The correlation coefficients are 0.338 and 0.557 in the first and second sessions, respectively. The overall correlation coefficient is 0.473. These values indicate a moderate positive correlation; that is, RT could be longer with the age of the participants. Because IC design also affects RT, the correlation coefficients for each IC are given in Table 2.
Table 2.
Correlation coefficients between participant age and RT averaged for both sessions.
A moderate correlation (about 0.5) between participant age and error magnitude was observed on IC03 and IC04, indicating that older participants made more reading errors than younger participants. The correlation between age and error on other ICs was weak.
3.2. Effect of Repetition
The effect of the test repetition, the so-called learning effect, was assessed by comparing mean RT values as well as reading errors between the first and second sessions using the paired two-sample t-test. Repetition should improve the results if there is a learning effect, i.e., both RTs and reading errors should be lower in the second session.
On most ICs, repetition did not make a significant difference to the results. A second test on IC01 and IC02 resulted in a smaller reading error, which could be statistically significant. Only IC06 had a statistically significant improvement in RT in the second test. However, RT was longer in IC01, IC03, and IC05 in the second session, but this was statistically confirmed only in IC03.
It can be concluded that no learning effect was detected. The test in one session was performed consecutively on all seven ICs. If the test were repeated on only one IC, the learning effect would probably be more pronounced.
3.3. Relationship Between RT and Reading Error
The relationship between collected RTs and the reading errors is shown in Figure 6. The scattering of the results indicates that there was no strong mathematical correlation between the two, although a relatively long RT usually resulted in a correct reading: despite the complexity of the IC, the participant had enough time to correctly read the speed value. Conversely, striving to complete a task as quickly as possible could increase the rate of errors on the same IC, but this rule was not confirmed.
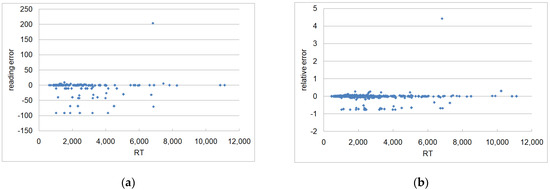
Figure 6.
Relationship between RT and reading error (a), and between RT and relative reading error (b).
Most errors tend toward negative values, which means that the participant read a lower value than the value on the speedometer.
3.4. Effect of IC Design
The effect of IC design on RT and reading error is within-subject analysis. The main features considered in the analysis were the type of presentation (digital or analog), the position and relative size of the speedometer, and the influence of surrounding instruments.
3.4.1. Reaction Time
The resulting RTs for each of the ICs are given in Table A1 and Table A2 (Appendix A). The Kolmogorov–Smirnov test (significance level α = 0.05) showed that values of RT as well as ln(RT), both averaged between the participants and between the ICs, had normal distribution. This corresponds to the typical distribution of human reaction time [4].
Table 3 shows a summary of the results. To assess the effects of IC designs on RTs, the results were evaluated for each pair of ICs using the paired t-test. The significance level was α = 0.05.
Table 3.
Descriptive statistics of RT (in ms).
The shortest mean RTs were achieved on IC04 and IC06, compared to other ICs (t-test resulted in p < 0.05, except between IC06 and IC03 where p = 0.1 in the first session, and between IC04 and IC07 where p = 0.16 in the second session). The shortest individual time (451 ms) was achieved in the second session by a 48-year-old woman (participant no. 18) on IC06, with a correct reading. The difference in RT between IC04 (analog speedometer) and IC06 (digital speedometer) was not statistically significant. A common feature of IC04 and IC06, compared to other ICs, is that the speedometer is positioned centrally, which is distinctive of the IC. The left or right position of the speedometer, such as on IC01, IC02, and IC03, was not identified as a factor that affects RT.
Like the IC06, the IC05 and IC07 also have digital speedometers positioned in the center of the IC. However, the mean RTs were significantly longer than those in IC04 and IC06. The reason may be the presence of round instruments that resemble a speedometer and increase the time needed to find the speedometer. The longest time (11,116 ms) was recorded by a 52-year-old woman (participant no. 21) in the first session on IC07, with a correct reading.
None of the ICs from the sample was statistically confirmed as the IC with the longest mean RT.
In addition to the duration of the saccade and fixation, the accuracy of the reading is also affected by the visual characteristics of the speedometer, the analysis of which is given in the next section.
3.4.2. Reading Errors
A summary of reading errors for individual ICs is presented in Table 4. As can be seen from Table A3 and Table A4 in Appendix A, a number of coarse errors occurred, which are detailed in Table 4. Coarse errors are values that are far from the set speed, e.g., errors not caused by the scale graduation. Because of these large deviations from the set values, the results are described and analyzed by the median and range instead of the mean value and standard deviation of the reading error [2,31]. Ratios of the number of coarse errors to the number of correct values are also considered in evaluating the differences between the ICs and their speedometers.
Table 4.
Summary of the reading errors (errors are in km/h).
The lowest reading errors were achieved in the 2nd session on IC06. No coarse errors were noted on both classical-style IC02 and IC04, and the error range was relatively low.
The highest ratio of coarse errors was recorded on IC01 (analog speedometer) and IC07 (digital speedometer). The values read by the participants correspond to the values set on the tachometer. The exceptions are two readings on IC06 (25 and 52 km/h instead of 40 km/h) and one reading on IC07 (250 km/h instead of 46 km/h), all in the 1st session. The mean RT in the cases where most of the coarse errors were recorded was 2527 ms on IC01 and 4120 ms on IC07.
Three participants repeated coarse errors in the 2nd session on IC01 (participants no. 4, 22, and 24), and the other three participants repeated coarse errors in the 2nd session on IC07 (no. 9, 28, and 32). Two participants had three coarse errors in the first session (no. 4 and 11), and the other two had two coarse errors in the first session (no. 28 and 32). In the second session, only one participant had two coarse errors (no. 12).
Both IC01 and IC07 have a tachometer shaped and sized like a speedometer, graduated in hundreds of revolutions per minute (RPM), i.e., 10, 20, 30, etc. This apparently led to confusion between a speedometer and a tachometer. The tachometer on IC04 was also graded in hundreds of RPM, but the larger size of the speedometer than the tachometer contributed to the reading from the correct instrument.
IC01 and IC02 have similar (classic) designs, but IC02 has a tachometer graduated in thousands of RPM (i.e., 1, 2, 3, etc). The tachometer reading on IC02 (coarse errors) was not recorded, as it was on IC01, despite the similarity of the IC layout.
IC05 has both digital and analog speed presentation, but the wrong readings from the second round instrument (power status indicator) were noted in both sessions. While the research of François et al. [20] showed that a redundant speedometer (combined analog and digital representation) had the best performance compared to the analog or digital, this was not the case in this experiment.
Although the digital presentation of the speed is unambiguous, and the digits are several times bigger than the digits on the classic speedometer scale, mistakes did happen. Coarse errors have already been explained by the confusion with another instrument. There were two coarse errors on the digital speedometers IC06 and IC07 in the 1st session that cannot be correlated to any other information at those ICs.
The number of accurate readings on ICs with a classic speedometer is relatively low compared to a digital speedometer. The design of analog speedometers from the sample is not suitable for precise reading in a short time. The graduation of the scale and the pointer that conceals the numbers can be the causes of small errors, i.e., within the major division of the scale. There is no obvious advantage of minor marks on the IC01 and IC02 scales. Even so, the accuracy of the reading is usually quite sufficient for controlling the speed of the vehicle, as an absolutely accurate value is not necessary.
4. Conclusions
This paper presents the experimental investigation of the driver’s reaction time and the accuracy of speedometer reading as a function of the instrument cluster layout and speedometer design. The research was carried out in laboratory conditions. Seven different instrument clusters of real-world passenger cars with various types and designs of speedometers were used to test the reaction time and reading accuracy of 32 participants. In addition to the speedometer characteristics, the integral design of the instrument cluster was included in the analysis in order to capture some additional effects on the results.
Reaction time and reading accuracy were generally not correlated. It must be taken into account that in real driving conditions, there would be no pressure to perform the task as it was in this laboratory experiment and that the driver can at all times return his gaze to the road. No significant differences were found in either reaction time or accuracy between male and female participants. A certain dependence of the reaction time on the age of the participants was found to be a typical increase in the reaction time in older participants.
The following design attributes of the speedometer, as well as the instrument cluster, were identified as factors that affect the results:
- The shortest mean reaction time and the lowest error rates were recorded on the instrument clusters with a centrally positioned speedometer that stands out from the other instruments, regardless of the type of the presentation: analog (“classic”) or digital (“modern”) speedometer;
- The reading from the digital speedometer was not error-free despite preferable characteristics;
- A typical cause of coarse errors in this experiment for both analog and digital speedometers was the reading from another instrument that resembles a “classic” speedometer (for example, a tachometer);
- The tachometer or any other instrument graduation in hundreds of RPM (i.e., 10, 20, 30, etc.) has been identified as the cause of coarse errors. In contrast, participants did not make the coarse errors if a tachometer was graduated in thousands of RPM (i.e., 1, 2, 3, etc.), even when the instrument panel had a visually symmetrical instrument layout”.
As the presented work shows, instrument cluster design and its interaction with human factors is a complex area with potential for future research. The speedometer, or any other instrument, cannot be evaluated as an individual component but as an integral part of the instrument cluster. The method used in this study is suitable for initial studies of Driver-Vehicle Interface (DVI) design due to the simple setup and equipment, as well as the unrestricted variations of the instrument clusters being evaluated. In later stages, other influences of boundary conditions (driving tasks, vibrations and movements, other visual/auditory inputs), as well as additional monitored quantities (eye tracking, lane keeping monitoring, etc.) can be included in the experiments. This method is also applicable to other types of instruments on vehicles, as well as to displays in other systems where there is an HMI and where user performance is important. The space for further investigation in this project is still open, and it will be expanded with the results of subjective assessment. Although the experiment was conducted under simplified laboratory conditions, the proposed methodology and the data collected in this study contribute to the understanding of Human-Machine Interface (HMI) design and can serve as a useful resource for future research in this field.
Author Contributions
Conceptualization, D.B. and D.R.; methodology, D.B. and D.R.; formal analysis, D.R. and D.B.; investigation, D.B.; resources, D.B.; data curation, D.R.; writing—original draft preparation, D.R. and D.B.; writing—review and editing, N.N., B.S. and S.M.-S.; visualization, D.R. and D.B.; funding acquisition, N.N. and B.S. All authors have read and agreed to the published version of the manuscript.
Funding
This research has been supported by the Ministry of Science, Technological Development and Innovation (Contract No. 451-03-65/2024-03/200156) and by the Faculty of Technical Sciences, University of Novi Sad through project “Scientific and Artistic Research Work of Researchers in Teaching and Associate Positions at the Faculty of Technical Sciences, University of Novi Sad” (No. 01-3394/1).
Institutional Review Board Statement
Ethical review and approval were waived for this study due to the following reason: Based on the Code of Academic Integrity of the University of Novi Sad (Document number 04-111/1 from 30 January 2020, Article 7—Scientific Research Involving Human Participants), obtaining approval from the Faculty’s Ethics Committee is not required for the category of participants and type of experiment involved in our study.
Informed Consent Statement
Informed consent was obtained from all subjects involved in the study.
Data Availability Statement
The original data presented in this study are included in the article. Further inquiries can be directed to the corresponding author.
Conflicts of Interest
The authors declare no conflicts of interest.
Appendix A
Table A1.
Reaction times (ms), 1st session.
Table A1.
Reaction times (ms), 1st session.
| IC | 01 | 02 | 03 | 04 | 05 | 06 | 07 | ||
|---|---|---|---|---|---|---|---|---|---|
| vs (km/h) | 55 | 47 | 52 | 58 | 54 | 40 | 46 | ||
| Participant | gender | age (years) | |||||||
| 1 | f | 22 | 1325 | 1811 | 2024 | 1157 | 3153 | 1727 | 5063 |
| 2 | m | 23 | 1498 | 1739 | 1203 | 1499 | 1606 | 940 | 1391 |
| 3 | m | 23 | 1663 | 1737 | 2134 | 1806 | 2570 | 792 | 872 |
| 4 | f | 23 | 2412 | 2754 | 3345 | 1572 | 5074 | 4844 | 2412 |
| 5 | f | 23 | 2279 | 1766 | 1680 | 1590 | 1564 | 718 | 1626 |
| 6 | m | 24 | 2302 | 4486 | 1699 | 1974 | 1331 | 973 | 1273 |
| 7 | f | 24 | 2345 | 2768 | 1775 | 1493 | 2095 | 903 | 5494 |
| 8 | m | 25 | 1844 | 2130 | 2038 | 1408 | 2169 | 754 | 1602 |
| 9 | m | 26 | 2115 | 2473 | 2168 | 1530 | 2501 | 1171 | 3258 |
| 10 | m | 27 | 2353 | 4443 | 2246 | 2332 | 1446 | 803 | 2688 |
| 11 | f | 27 | 6012 | 7671 | 3031 | 2227 | 6376 | 7281 | 6822 |
| 12 | f | 28 | 3239 | 1652 | 1171 | 829 | 599 | 473 | 7816 |
| 13 | m | 33 | 1238 | 1780 | 1705 | 1036 | 2395 | 1031 | 1177 |
| 14 | f | 35 | 2404 | 2815 | 2872 | 1770 | 1879 | 1158 | 1580 |
| 15 | f | 40 | 3657 | 2845 | 1798 | 1286 | 1602 | 697 | 1639 |
| 16 | m | 41 | 1712 | 2469 | 2191 | 1984 | 2275 | 885 | 1032 |
| 17 | m | 43 | 2725 | 4631 | 2212 | 1775 | 3534 | 2106 | 1614 |
| 18 | f | 48 | 3220 | 2295 | 3653 | 1876 | 934 | 707 | 988 |
| 19 | f | 49 | 2835 | 4573 | 2565 | 1837 | 1131 | 1072 | 3583 |
| 20 | m | 50 | 1615 | 2502 | 1611 | 962 | 2763 | 670 | 1083 |
| 21 | f | 52 | 5690 | 5122 | 3171 | 2753 | 2078 | 3101 | 11,116 |
| 22 | m | 59 | 3503 | 2273 | 2782 | 2418 | 1071 | 956 | 1215 |
| 23 | f | 60 | 3979 | 4979 | 2818 | 2611 | 2258 | 945 | 1326 |
| 24 | f | 62 | 2013 | 1814 | 2244 | 1112 | 560 | 762 | 929 |
| 25 | f | 64 | 3190 | 4055 | 2508 | 2198 | 3870 | 5826 | 3012 |
| 26 | m | 66 | 1903 | 2566 | 2113 | 1668 | 3099 | 2675 | 10,861 |
| 27 | m | 66 | 3679 | 2603 | 2055 | 4464 | 5688 | 1378 | 6896 |
| 28 | f | 67 | 1149 | 1350 | 2344 | 1268 | 5042 | 1521 | 4032 |
| 29 | f | 69 | 2811 | 5631 | 2413 | 1934 | 723 | 593 | 883 |
| 30 | m | 70 | 2522 | 3306 | 1614 | 1366 | 3432 | 735 | 1025 |
| 31 | m | 74 | 3362 | 6042 | 3223 | 3010 | 4867 | 2011 | 2444 |
| 32 | m | 75 | 4554 | 2680 | 5858 | 2228 | 8503 | 10,233 | 6733 |
| RT mean | 2723 | 3180 | 2383 | 1843 | 2756 | 1889 | 3234 | ||
| RT SD | 1175 | 1532 | 877 | 712 | 1843 | 2193 | 2890 | ||
| RT median | 2408 | 2642 | 2202 | 1773 | 2267 | 965 | 1633 | ||
Table A2.
Reaction times (ms), 2nd session.
Table A2.
Reaction times (ms), 2nd session.
| IC | 01 | 02 | 03 | 04 | 05 | 06 | 07 | ||
|---|---|---|---|---|---|---|---|---|---|
| vs (km/h) | 121 | 85 | 159 | 162 | 93 | 82 | 104 | ||
| Participant | gender | age (years) | |||||||
| 1 | f | 22 | 2264 | 2339 | 1643 | 1297 | 2819 | 1031 | 2627 |
| 2 | m | 23 | 1554 | 1387 | 1303 | 948 | 949 | 689 | 981 |
| 3 | m | 23 | 1028 | 1655 | 2085 | 1444 | 1666 | 998 | 1440 |
| 4 | f | 23 | 4132 | 2656 | 4667 | 1755 | 3033 | 1715 | 6626 |
| 5 | f | 23 | 2967 | 1860 | 1384 | 1979 | 1620 | 635 | 1080 |
| 6 | m | 24 | 3093 | 2049 | 1891 | 1209 | 814 | 648 | 5761 |
| 7 | f | 24 | 2578 | 1780 | 1614 | 896 | 1063 | 858 | 1173 |
| 8 | m | 25 | 1764 | 2227 | 1875 | 1177 | 2507 | 838 | 2153 |
| 9 | m | 26 | 1954 | 2818 | 2149 | 1473 | 2675 | 1016 | 1875 |
| 10 | m | 27 | 2544 | 2542 | 3745 | 1164 | 745 | 826 | 714 |
| 11 | f | 27 | 2210 | 2332 | 1407 | 2160 | 6970 | 1418 | 7448 |
| 12 | f | 28 | 1530 | 1399 | 2371 | 952 | 2305 | 655 | 903 |
| 13 | m | 33 | 1523 | 1757 | 1796 | 1271 | 1234 | 814 | 1163 |
| 14 | f | 35 | 1646 | 2279 | 2237 | 1844 | 1163 | 911 | 1044 |
| 15 | f | 40 | 2634 | 2841 | 3279 | 1436 | 710 | 674 | 1350 |
| 16 | m | 41 | 1868 | 2747 | 1634 | 1304 | 3600 | 837 | 3160 |
| 17 | m | 43 | 5933 | 6601 | 3204 | 4908 | 1300 | 1310 | 1748 |
| 18 | f | 48 | 3670 | 2334 | 4153 | 2154 | 840 | 451 | 1042 |
| 19 | f | 49 | 3166 | 2176 | 4511 | 1682 | 9887 | 2424 | 1188 |
| 20 | m | 50 | 1033 | 1567 | 3334 | 1040 | 1502 | 877 | 935 |
| 21 | f | 52 | 2892 | 5294 | 6323 | 2043 | 1349 | 872 | 1813 |
| 22 | m | 59 | 3212 | 5465 | 4038 | 3478 | 973 | 955 | 1123 |
| 23 | f | 60 | 2590 | 3461 | 4024 | 1391 | 3466 | 1085 | 1010 |
| 24 | f | 62 | 2456 | 2886 | 2774 | 2622 | 697 | 715 | 618 |
| 25 | f | 64 | 4029 | 3562 | 2373 | 3545 | 4393 | 807 | 2058 |
| 26 | m | 66 | 4668 | 2694 | 1999 | 1328 | 3669 | 940 | 2342 |
| 27 | m | 66 | 2654 | 2251 | 2076 | 1570 | 1997 | 882 | 3956 |
| 28 | f | 67 | 2797 | 1445 | 2927 | 1252 | 4971 | 939 | 4504 |
| 29 | f | 69 | 2537 | 5461 | 4687 | 1632 | 9720 | 1607 | 1435 |
| 30 | m | 70 | 2358 | 3223 | 4871 | 2047 | 3545 | 711 | 850 |
| 31 | m | 74 | 4149 | 3937 | 6658 | 1893 | 4118 | 1972 | 3984 |
| 32 | m | 75 | 8259 | 2111 | 6729 | 3483 | 7350 | 2710 | 6859 |
| RT mean | 2865 | 2786 | 3118 | 1824 | 2927 | 1057 | 2343 | ||
| RT SD | 1454 | 1296 | 1566 | 904 | 2492 | 515 | 1942 | ||
| RT median | 2584 | 2337 | 2574 | 1521 | 2151 | 879.5 | 1438 | ||
Table A3.
Speedometer readings (km/h), 1st session.
Table A3.
Speedometer readings (km/h), 1st session.
| IC | 01 | 02 | 03 | 04 | 05 | 06 | 07 | ||
|---|---|---|---|---|---|---|---|---|---|
| vs (km/h) | 55 | 47 | 52 | 58 | 54 | 40 | 46 | ||
| Participant | gender | age (years) | |||||||
| 1 | f | 22 | 60 | 50 | 50 | 60 | 50 | 40 | 16 |
| 2 | m | 23 | 55 | 48 | 51 | 55 | 54 | 40 | 46 |
| 3 | m | 23 | 58 | 49 | 55 | 59 | 56 | 40 | 46 |
| 4 | f | 23 | 13 | 49 | 15 | 60 | 50 | 40 | 13 |
| 5 | f | 23 | 55 | 50 | 50 | 58 | 54 | 40 | 46 |
| 6 | m | 24 | 57 | 48 | 52 | 56 | 54 | 40 | 46 |
| 7 | f | 24 | 55 | 49 | 51 | 59 | 54 | 40 | 46 |
| 8 | m | 25 | 55 | 50 | 55 | 60 | 54 | 40 | 46 |
| 9 | m | 26 | 55 | 50 | 50 | 60 | 55 | 40 | 15 |
| 10 | m | 27 | 13 | 47 | 52 | 57 | 54 | 40 | 46 |
| 11 | f | 27 | 55 | 48 | 51 | 59 | 35 | 25 | 250 |
| 12 | f | 28 | 50 | 50 | 55 | 60 | 54 | 40 | 46 |
| 13 | m | 33 | 60 | 50 | 50 | 60 | 55 | 40 | 46 |
| 14 | f | 35 | 57 | 48 | 55 | 58 | 54 | 40 | 46 |
| 15 | f | 40 | 55 | 48 | 52 | 58 | 54 | 40 | 46 |
| 16 | m | 41 | 57 | 49 | 52 | 58 | 54 | 40 | 46 |
| 17 | m | 43 | 58 | 48 | 53 | 58 | 54 | 40 | 46 |
| 18 | f | 48 | 13 | 45 | 53 | 58 | 54 | 40 | 46 |
| 19 | f | 49 | 55 | 49 | 52 | 59 | 54 | 40 | 46 |
| 20 | m | 50 | 55 | 49 | 55 | 60 | 55 | 40 | 46 |
| 21 | f | 52 | 55 | 48 | 52 | 58 | 54 | 40 | 46 |
| 22 | m | 59 | 15 | 50 | 52 | 48 | 54 | 40 | 46 |
| 23 | f | 60 | 13 | 58 | 52 | 58 | 54 | 40 | 46 |
| 24 | f | 62 | 15 | 60 | 50 | 60 | 54 | 40 | 46 |
| 25 | f | 64 | 56 | 49 | 52 | 59 | 55 | 40 | 46 |
| 26 | m | 66 | 60 | 55 | 55 | 60 | 54 | 40 | 46 |
| 27 | m | 66 | 55 | 58 | 52 | 58 | 53 | 40 | 46 |
| 28 | f | 67 | 15 | 50 | 52 | 60 | 58 | 40 | 20 |
| 29 | f | 69 | 57 | 45 | 52 | 58 | 54 | 40 | 46 |
| 30 | m | 70 | 58 | 58 | 52 | 58 | 55 | 40 | 46 |
| 31 | m | 74 | 54 | 48 | 52 | 58 | 54 | 40 | 46 |
| 32 | m | 75 | 55 | 60 | 52 | 59 | 54 | 52 | 15 |
| error magnitude mean (km/h) | 10.2 | 3.7 | 2.2 | 1.3 | 1.2 | 0.8 | 10.8 | ||
| error magnitude SD (km/h) | 16.7 | 3.8 | 6.5 | 1.8 | 3.5 | 3.3 | 36.4 | ||
| error magnitude median (km/h) | 2.0 | 2.0 | 1.0 | 1.0 | 0.0 | 0.0 | 0.00 | ||
Table A4.
Speedometer readings (km/h), 2nd session.
Table A4.
Speedometer readings (km/h), 2nd session.
| IC | 01 | 02 | 03 | 04 | 05 | 06 | 07 | ||
|---|---|---|---|---|---|---|---|---|---|
| vs (km/h) | 121 | 85 | 159 | 162 | 93 | 82 | 104 | ||
| Participant | gender | age (years) | |||||||
| 1 | f | 22 | 120 | 90 | 160 | 160 | 90 | 82 | 104 |
| 2 | m | 23 | 110 | 87 | 160 | 170 | 93 | 82 | 104 |
| 3 | m | 23 | 30 | 88 | 160 | 162 | 95 | 82 | 104 |
| 4 | f | 23 | 30 | 80 | 160 | 160 | 90 | 82 | 104 |
| 5 | f | 23 | 120 | 85 | 160 | 161 | 90 | 82 | 104 |
| 6 | m | 24 | 120 | 86 | 160 | 162 | 93 | 82 | 104 |
| 7 | f | 24 | 120 | 85 | 160 | 160 | 93 | 82 | 104 |
| 8 | m | 25 | 110 | 85 | 130 | 170 | 95 | 82 | 104 |
| 9 | m | 26 | 110 | 85 | 160 | 160 | 95 | 82 | 35 |
| 10 | m | 27 | 110 | 85 | 158 | 165 | 93 | 82 | 104 |
| 11 | f | 27 | 120 | 87 | 180 | 162 | 95 | 82 | 110 |
| 12 | f | 28 | 30 | 90 | 150 | 161 | 45 | 82 | 104 |
| 13 | m | 33 | 130 | 90 | 160 | 160 | 93 | 82 | 104 |
| 14 | f | 35 | 110 | 85 | 159 | 163 | 93 | 82 | 104 |
| 15 | f | 40 | 120 | 82 | 159 | 162 | 93 | 82 | 104 |
| 16 | m | 41 | 30 | 85 | 159 | 164 | 93 | 82 | 104 |
| 17 | m | 43 | 120 | 85 | 158 | 165 | 93 | 82 | 104 |
| 18 | f | 48 | 120 | 85 | 150 | 162 | 93 | 82 | 104 |
| 19 | f | 49 | 110 | 88 | 160 | 162 | 95 | 82 | 104 |
| 20 | m | 50 | 110 | 90 | 160 | 163 | 95 | 82 | 104 |
| 21 | f | 52 | 110 | 85 | 158 | 162 | 93 | 82 | 104 |
| 22 | m | 59 | 30 | 85 | 160 | 162 | 93 | 82 | 104 |
| 23 | f | 60 | 120 | 88 | 158 | 162 | 94 | 82 | 104 |
| 24 | f | 62 | 30 | 80 | 160 | 140 | 93 | 82 | 104 |
| 25 | f | 64 | 120 | 88 | 149 | 162 | 98 | 82 | 104 |
| 26 | m | 66 | 110 | 90 | 160 | 160 | 90 | 82 | 35 |
| 27 | m | 66 | 120 | 90 | 160 | 160 | 90 | 82 | 104 |
| 28 | f | 67 | 110 | 90 | 160 | 160 | 90 | 80 | 35 |
| 29 | f | 69 | 110 | 85 | 159 | 162 | 95 | 82 | 104 |
| 30 | m | 70 | 120 | 90 | 160 | 160 | 93 | 82 | 104 |
| 31 | m | 74 | 110 | 85 | 158 | 162 | 93 | 82 | 104 |
| 32 | m | 75 | 120 | 80 | 150 | 162 | 93 | 82 | 34 |
| error magnitude mean (km/h) | 21.9 | 2.3 | 3.4 | 2.1 | 2.7 | 0.1 | 8.8 | ||
| error magnitude SD (km/h) | 34.0 | 2.2 | 6.4 | 4.1 | 8.4 | 0.4 | 23.2 | ||
| error magnitude median (km/h) | 11.0 | 2.5 | 1.0 | 1.0 | 0.5 | 0.0 | 0.0 | ||
References
- Bhise, V. Ergonomics in the Automotive Design Process; Taylor & Francis Group: Boca Raton, FL, USA, 2012. [Google Scholar]
- Bubb, H.; Bengler, K.; Grünen, R.E.; Vollrath, M. (Eds.) Automotive Ergonomics; Springer: Wiesbaden, Germany, 2021. [Google Scholar]
- Knoll, P.M. Some pictures of the history of automotive instrumentation. J. Soc. Inf. Disp. 2017, 25, 44–52. [Google Scholar] [CrossRef]
- Koppa, R. Human factors, Chapter 3. In Traffic Flow Theory Transportation Research Board Monograph; Gartner, N.H., Messer, C.J., Rathi, A.K., Eds.; National Research Council: Washington, DC, USA, 2000. [Google Scholar]
- Campbell, J.L.; Brown, J.L.; Graving, J.S.; Richard, C.M.; Lichty, M.G.; Sanquist, T.; Bacon, P.; Woods, R.; Li, H.; Williams, D.N.; et al. Human Factors Design Guidance for Driver-Vehicle Interfaces; Report No. DOT HS 812 360; National Highway Traffic Safety Administration: Washington, DC, USA, 2016.
- Kroon, E.C.M.; Martens, M.H.; Brookhuis, K.A.; Hagenzieker, M.P.; Alferdinck, J.W.A.M.; Harms, I.M.; Hof, T. Human Factor Guidelines for the Design of Safe In-Car Traffic Information Services. Smart Mobility Round Table Human Factors, Guideline, 2nd ed.; Delft University of Technology: Delft, The Netherlands, 2016. [Google Scholar]
- Standard ISO 15008: 2017; Road Vehicles—Ergonomic Aspects of Transport Information and Control Systems—Specifications and Test Procedures for In-Vehicle Visual Presentation. International Organization for Standardization: Geneva, Switzerland, 2017.
- Lee, J.M.; Park, S.W.; Ju, D.Y. Drivers’ User-interface Information Prioritization in Manual and Autonomous Vehicles. Int. J. Automot. Technol. 2020, 21, 1355–1367. [Google Scholar] [CrossRef]
- François, M.; Fort, A.; Crave, P.; Osiurak, F.; Navarro, J. Gauges design for a digital instrument cluster: Efficiency, visual capture, and satisfaction assessment for truck driving. Int. J. Ind. Ergon. 2019, 72, 290–297. [Google Scholar] [CrossRef]
- Standard ISO 15005: 2012; Road Vehicles—Ergonomic Aspects of Transportation and Control Systems—Dialogue Management Principles and Compliance Procedures. International Organization for Standardization: Geneva, Switzerland, 2012.
- Kiefer, R. Effect of a Head-Up Versus Head-Down Digital Speedometer on Visual Sampling Behavior and Speed Control Performance During Daytime Automobile Driving. SAE Trans. Sect. 6 J. Passeng. Cars 1991, 100, 82–93. [Google Scholar]
- Huang, Y.; Sun, D.J.; Zhang, L.-H. Effects of congestion on drivers’ speed choice: Assessing the mediating role of state aggressiveness based on taxi floating car data. Accid. Anal. Prev. 2018, 117, 318–327. [Google Scholar] [CrossRef] [PubMed]
- Ramanathan Parthasarthy, A.; Mehrotra, S.; Fitzpatrick, C.; Roberts, S.; Christofa, E.; Knodler, M. Driver behavior and performances on in-vehicle display based speed compliance. Accid. Anal. Prev. 2021, 162, 106390. [Google Scholar] [CrossRef]
- Allison, C.K.; Stanton, N.A. Ideation using the “Design with Intent” toolkit: A case study applying a design toolkit to support creativity in developing vehicle interfaces for fuel-efficient driving. Appl. Ergon. 2020, 84, 103026. [Google Scholar] [CrossRef] [PubMed]
- Schewe, F.; Vollrath, M. Visualizing distances as a function of speed: Design and evaluation of a distance-speedometer. Transp. Res. Part F Traffic Psychol. Behav. 2019, 64, 260–273. [Google Scholar] [CrossRef]
- Quan, Y.; Shenjun, T.; Kaifeng, L.; Yibing, L. Investigation and Analysis of Drivers’ Speedometer Observation and Vehicle-speed Cognition. In Proceedings of the Fifth International Conference on Measuring Technology and Mechatronics Automation, Hong Kong, China, 16–17 January 2013. [Google Scholar] [CrossRef]
- Son, J.; Park, M. The Effects of Distraction Type and Difficulty on Older Drivers’ Performance and Behaviour: Visual vs. Cognitive. Int. J. Automot. Technol. 2021, 22, 97–108. [Google Scholar] [CrossRef]
- Lee, S.C.; Kim, Y.W.; Ji, Y.G. Effects of visual complexity of in-vehicle information display: Age-related differences in visual search task in the driving context. Appl. Ergon. 2019, 81, 102888. [Google Scholar] [CrossRef] [PubMed]
- Weiss, B.P. Examining the Relationship Between Age and Instrument Cluster Design Preference. Master Thesis, University of Michigan-Dearborn, Dearborn, MI, USA, 2017. [Google Scholar]
- François, M.; Crave, P.; Osiurak, F.; Fort, A.; Navarro, J. Digital, analogue, or redundant speedometers for truck driving: Impact on visual distraction and usability. Appl. Ergon. 2017, 65, 12–22. [Google Scholar] [CrossRef] [PubMed]
- Olaverri-Monreal, C.; Lehsing, C.; Trubswetter, N.; Schepp, C.A.; Bengler, K. In-Vehicle Displays: Driving Information Prioritization and Visualization. In Proceedings of the 2013 IEEE Intelligent Vehicles Symposium (IV), Gold Coast, Australia, 23–26 June 2013. [Google Scholar]
- Stromberg, H.; Andersson, P.; Almgren, S.; Ericsson, J.; Karlsson, M.A.; Nabo, A. Driver Interfaces for Electric Vehicles. In Proceedings of the Automotive UI 2011, Salzburg, Austria, 30 November–2 December 2011. [Google Scholar]
- Sanders, M.; McCormick, E. Human Factors in Engineering and Design; McGraw-Hill: New York, NY, USA, 1993. [Google Scholar]
- Standard ISO 4040: 2009; Road Vehicles—Location of Hand Controls, Indicators and Tell-Tales in Motor Vehicles. International Organization for Standardization: Geneva, Switzerland, 2009.
- Papakostopoulos, V.; Marmaras, N. Conventional vehicle display panels: The drivers’ operative images and directions for their redesign. Appl. Ergon. 2012, 43, 821–828. [Google Scholar] [CrossRef] [PubMed]
- United Nations. UN Regulation No. 39—Uniform Provisions Concerning the Approval of Vehicles with Regard to the Speedometer and Odometer Equipment Including Its Installation, Revision 2; United Nations: Geneva, Switzerland, 2018. [Google Scholar]
- Kern, D.; Schmidt, A. Design Space for Driver-based Automotive User Interfaces. In Proceedings of the Automotive User Interfaces and Interactive Vehicular Applications (AutomotiveUI 2009), Essen, Germany, 21–22 September 2009. [Google Scholar]
- Perrier, M.J.R.; Louw, L.T.; Carsten, O.M.J. Usability testing of three visual HMIs for assisted driving: How design impacts driver distraction and mental models. Ergonomics 2023, 66, 1142–1163. [Google Scholar] [CrossRef] [PubMed]
- Davidsson, S.; Alm, H. Context adaptable driver information—Or, what do whom need and want when? Appl. Ergon. 2014, 45, 994–1002. [Google Scholar] [CrossRef] [PubMed]
- Standard ISO 15007: 2020; Road Vehicles—Measurement of Driver Visual Behaviour with Respect to Transport Information and Control Systems. International Organization for Standardization: Geneva, Switzerland, 2020.
- Human Factors: From Science to Application. Available online: https://www.visualexpert.com/ (accessed on 26 August 2024).
Disclaimer/Publisher’s Note: The statements, opinions and data contained in all publications are solely those of the individual author(s) and contributor(s) and not of MDPI and/or the editor(s). MDPI and/or the editor(s) disclaim responsibility for any injury to people or property resulting from any ideas, methods, instructions or products referred to in the content. |
© 2025 by the authors. Licensee MDPI, Basel, Switzerland. This article is an open access article distributed under the terms and conditions of the Creative Commons Attribution (CC BY) license (https://creativecommons.org/licenses/by/4.0/).