Article

Assessing the Economic Performance and Environmental Impact of Farming Systems Based on Different Organic Conservation Practices in Processing Tomato Cultivation

by
Lorenzo Gagliardi
1,
Sofia Matilde Luglio
1,*,
Marco Fontanelli
1,
Michele Raffaelli
1,
Christian Frasconi
1,
Danial Fatchurrahman
2 and
Andrea Peruzzi
1,*
1
Department of Agriculture, Food and Environment, University of Pisa, Via del Borghetto 80, 56124 Pisa, Italy
2
Department of Agriculture, Food, Natural Resources and Engineering, University of Foggia, Via Napoli 25, 71122 Foggia, Italy
*
Authors to whom correspondence should be addressed.
Appl. Sci. 2025, 15(4), 1883; https://doi.org/10.3390/app15041883
Submission received: 14 November 2024 / Revised: 23 January 2025 / Accepted: 10 February 2025 / Published: 12 February 2025
(This article belongs to the Special Issue New Horizon in Climate Smart Agriculture)

Abstract

:
Conservation Agriculture practices in Organic Farming can enhance the sustainability of these farming systems. However, these practices have economic and environmental implications for farmers, which must be considered. In the present study, eight technical itineraries were compared in tomato cultivation. These differed in how reduced and no-tillage practices were used to manage four soil cover types and to control weeds. The itinerary’s gross salable production (GSP), gross income (GI), and CO2 emissions were evaluated. In the second growing season, the no-tillage itinerary values of both GSP and GI were lower than those based on reduced tillage (34,681.03 and 71,891.58 EUR ha−1, respectively). The use of cover crops tendentially resulted in an increase in GSP in both growing seasons compared to cultivation on bare soil (8190.00 and 41,959.89 EUR ha−1 in 2020 and 2021, respectively), particularly with clover monoculture and a clover–rye mix in 2020 (25,326.60 and 25,818.97 EUR ha−1, respectively) and with clover monoculture in 2021 (69,310.18 EUR ha−1). A similar trend was also observed for GI. Cover crop adoption was related to a higher CO2 emissions (642.73 and 234.84 kg ha−1 in 2020 and 353.23 and 213.30 kg ha−1 in 2021, for itineraries based on reduced-tillage and no-tillage, respectively). Further studies could focus on the economic and environmental evaluation of these systems in the same pedoclimatic conditions but over the long term, quantifying the various environmental benefits of cover crops.

1. Introduction

In a growing global population scenario, climate change, environmental degradation, and increasing resource scarcity mean that ensuring sustainable food and nutrition security requires a significant shift in the agri-food system towards sustainability [1]. Agriculture, forestry, and other land-use activities account for 22% of global anthropogenic carbon emissions [2,3]. These systems serve dual functions within terrestrial ecosystems, acting both as carbon sources and sinks, underscoring the importance of their effective management for carbon mitigation [4].
In this context, organic farming could represent a considerable opportunity—although not without its challenges—to achieve sustainability. Adopting strategies based on higher or lower reductions in soil disturbance—an essential principle of conservation agriculture—in organic farming enhances soil carbon sequestration and supports compliance with government programs to reduce carbon emissions [5,6]. Either no-tillage or reduced tillage practices maintain and improve the soil organic carbon content and provide additional benefits such as soil moisture conservation and soil erosion mitigation [7]. Furthermore, reducing the tillage intensity decreases energy consumption and associated carbon dioxide emissions while decreasing labor demand [8]. For example, no-till systems can reduce energy use by 25% compared to conventional tillage based on deep tillage practices like moldboard plowing or chiseling [9].
Maintaining vegetation cover, another critical principle of conservation agriculture, offers several environmental benefits. Cover crops support this principle, protect soil from erosion, conserve water, and enhance nutrient availability and soil organic matter content [10]. Cover crops also mitigate greenhouse gases by capturing carbon and storing it in roots, soil, and above-ground biomass [11]. In organic farming, cover crops are commonly used as green manures to improve soil fertility and supply nutrients to cash crops [12].
An alternative management strategy involves terminating cover crops and spontaneous vegetation and leaving their residues as dead mulch on the soil surface. This natural mulch represents a valuable option in organic weed management [13]. In a no-till-based practice, the termination can be performed with roller crimpers [14]. Moreover, flaming can be effectively associated with crimper rolling to speed up cover crop termination and prevent delays in planting the following cash crop [15]. However, reduced and no-tillage practices, as well as the use of cover crops, have had economic implications for farmers, which must be carefully considered [16], compared a tillage management system with no-till systems. Cover crops were sown with a no-till drill and terminated by a roller-crimper in organic tomato cultivation.
The authors found that no-till systems incurred higher production costs and obtained lower returns than conventional tillage systems due to lower yields. Pearson et al. [17] observed that using reduced tillage in an organic crop rotation resulted in a 13% decrease in gross revenues and a 6% reduction in annual costs, ultimately maintaining net returns.
The economic impacts of cover crops vary significantly, with some systems benefiting from increased profitability, while others do not [18,19]. Severini et al. [20], comparing farming systems based upon cover cropping to bare soil cultivation systems for organic maize production, observed that cover cropping systems lead to higher production costs (due to seed purchases and field management) that negatively affect their economic performance with respect to bare soil systems. On the contrary, Belfry et al. [21], who evaluated the use of cover crops in conventional tomato cultivation, observed a higher profit margin than that obtained using systems without cover crops, mainly when oilseed radish was used. Therefore, the ability to enhance profitability through reduced or no-tillage practices and cover cropping may differ based on factors such as the environmental characteristics of the locations; the typology, setting up, and adjustment of the used agricultural machines; and the choice of cover and cash crops. Therefore, to conclude their economic profitability, it is essential to conduct site-specific evaluations. This research refers to and complements the study conducted by Abou Chehade et al. [22], in which eight technical itineraries were compared in processing tomato cultivation, evaluating tomato yield performance besides other agronomic drawbacks. In the different farming systems, different tillage practices—reduced and no-tillage—were used and combined with four types of soil coverage that were managed differently, such as weeds after tomato emergence. In the present study, however, the results of the different technical itineraries from an economic perspective, considering the gross salable production, average variable costs, and gross income, were analyzed and evaluated. This research also aimed to evaluate the itineraries’ environmental outcomes, assessing them regarding the CO2 emissions calculated from direct energy consumption.

2. Materials and Methods

The trial was carried out during the seasons 2019–2020 and 2020–2021 at the Experimental Farm of the University of Pisa, the Agriculture and Environment Research Centre “Enrico Avanzi”—San Piero a Grado (Pisa), Italy (43°40′ N Lat; 10°19′ E Long; 1 m a.s.l. and 0% slope). The two selected areas were located near the Food technology and tree cultivation laboratory—known as “Podere Cipollini” (Figure 1).
The Experimental farm was managed following the criteria of organic farming (Reg. CE 834/2007 [23]). Two cycles of the same crop, processing tomato (Solanum lycopersicum L. cv. Elba F1), were performed during the trial. During the two growing seasons, the experiment was conducted in two different fields within the abovementioned experimental area (Figure 1), and in both cases, this followed a fallow year. Both in the first growing season (2019–2020) and in the second one (2020–2021), the field experiments were carried out on soils with a similar texture (loamy sand in the first year and sandy loam in the second one). The particle size of the loamy sand soil was 76% sand, 16% silt, and 8% clay, while that of the sandy loam soil was 53% sand, 32% silt, and 15% clay. Detailed information regarding the soil’s chemical characteristics and weather conditions during the growing seasons 2019–2020 and 2020–2021 are described in [22].

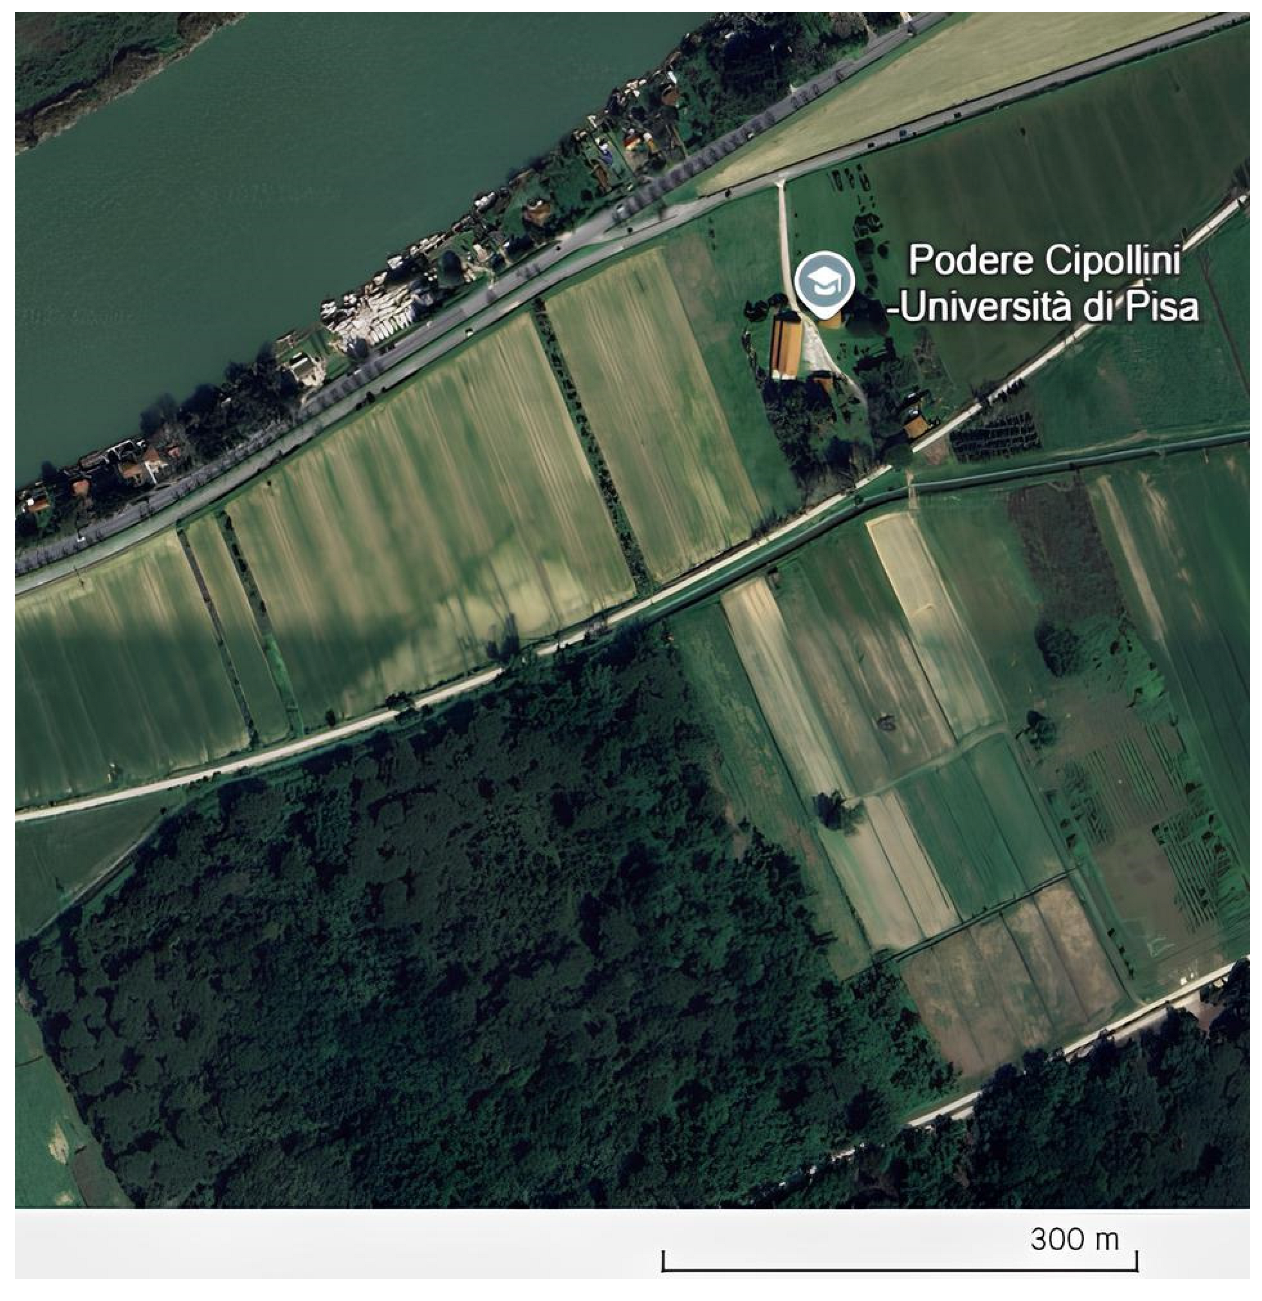
2.1. Experimental Layout

During the trial, eight technical itineraries were compared in tomato crops. These itineraries were distinguished within two management systems: the reduced tillage (RT) and no-tillage (NT) systems. In both types of systems, three different cover crops (two monocultures of squarrose clover—Trifolium squarrosum cv. OK—and of rye—Secale cereale cv. Dukato—and a 50% mixture of the two species) differently managed (shredded and buried in the soil or terminated by crimper rolling and flaming and thus transformed into dead mulch), were used. Their influence on the economic performance of processing tomatoes and CO2 emissions was evaluated and compared with each other as well as bare soil cultivation, where the only coverage was represented by spontaneous vegetation that grew during winter. Cover crops, when present, were sown before transplanting the tomatoes. In RT systems, cover crops were managed as green manure, while in NT ones, cover crops were managed as dead mulch. In both cases, the management of cover crops preceded tomato transplanting.
Another aspect that distinguished the two systems was the weed control strategy adopted during tomato growth. In the RT systems, weed control was performed using precision hoeing (a machine designed and realized at the University of Pisa) and hand weeding. In the NT systems, weed control was mainly based on the presence of dead mulch that exerts both an allelopathic and a physical barrier effect, thus inhibiting weed seed germination and weed emergence. Moreover, a few interventions, such as shredding and manual weeding, were performed when needed. The experimental design adopted was a randomized complete block design with three replications. Each plot measured 6 m × 10 m. The main aspects concerning the eight technical itineraries are summarized in Table 1.

2.2. Agriculture Operations Performed and Machines Employed Within the Technical Itineraries

During both the growing seasons, in each technical itinerary, a 3 m wide combined cultivator was used before cover crop establishment to perform seedbed preparation at a depth of 15 cm. The machine was equipped with nine rigid tines with “swing” tools, four couples of concave and inclined discs arranged in a “V”, and a packer roll to achieve light compaction and leveling of tilled soil. After this intervention, a rotary harrow was used to perform soil refinement at a working depth of about 12 cm. The rotary harrow was equipped with a packer roller and presented a working width of 2.5 m. Cover crop seeds were hand-broadcast distributed. The seed rate of each cover crop established in the trial is described in [22]. In the RT itineraries, green manure was obtained by shredding and burying the cover crop and/or spontaneous vegetation (in the bare soil system).
Cover crop burying was performed with two passes of the abovementioned combined cultivator at a depth of 10 cm. In the NT itineraries, dead mulch was obtained by crimper rolling and flaming cover crops. Therefore, a roller-crimper and a flamer machine were employed. The roller crimper was 1.5 m wide and equipped with flat blades arranged in a tangential pattern. The flamer machine has an effective working width of 2 m, was fed with liquefied petroleum gas (LPG), and was equipped with 50 cm wide four-rod burners arranged orthogonally to the forward direction. Two rolling and flaming interventions were performed each year. Tomato planting was performed by a transplanter able to work on one or two rows, modified by the University of Pisa to operate both in tilled and untilled soils [24]. Each transplanter unit was equipped with a smooth disc with a diameter of 30 cm, followed by a rigid tine. However, in this field experiment, the transplanter was equipped with a single working unit adjusted to operate at a depth of 18 cm.
Transplanting was carried out at a density of 2.2 plants m−2 and a planting layout of 1.5 m between rows and 0.3 m within the rows. This planting density was chosen because the farm is managed organically and aims to reduce conditions favorable for the development of fungal diseases. Immediately after the transplant, the irrigation hoses and localized fertigation of the tomato were laid out. The tomato plants were irrigated from transplanting to harvest using a drip irrigation system equipped with drip tape placed at the center of the bed, delivering a flow rate of 3.6 L m⁻1 per hour, with irrigation cycles lasting 6 h every 4 days. The same irrigation regime was adopted in the different technical itineraries.
In the RT itineraries, weed control in the intra-row area was performed with an intervention of manual weeding each year. In contrast, in the inter-row area, a precision weeder was used twice in the first year and once in the second. The precision weeder’s working width was 1.5 m, and it was arranged with working units equipped only with a central goose-foot sweep.
In the NT itineraries, hand weeding was performed to control intra-row weeds, while two interventions for shredding were used to control weeds in the inter-row space.
Fertilization involved the application through drip fertigation of 38.7 kg ha−1 and 36.3 kg ha−1 of N in the first and second year, respectively, along with 21.8 kg ha−1 of K2O in the second year (NUTRIGREEN, Green Has Italia, Canale, Italy, 8-0-0; VIT-ORG, Green Has Italia, 3-0-6). Additionally, in the second year, 8 kg ha−1 of CaO (NEWCAL, Green Has Italia, 16.8%) was applied via foliar spraying. During the first growing season, phytosanitary treatments consisted of four interventions to control the tomato late blight pathogen (Phytophthora infestans), three of which were performed using only 755 g ha−1 of tetraramic oxychloride each (Pasta Caffaro Blu, Sumitomo Chemical Italia S.r.l., Milan, Italy), while in the fourth intervention, 190 g ha−1 of tribasic copper sulfate (Cuproxat SDI, Nufarm, Bologna, Italy) were also applied. In addition to controlling late blight pathogens during the second growing season, Tuta absoluta (Meyrick) was also controlled. To control Phytophthora infestans, five treatments with 400 g ha−1 of copper sulfate (Poltiglia bordolese Disperss blu, Upl, Cesena, Italy) were performed. Six treatments with 74.18 kg ha−1 of Bacillus thuringiensis Berliner var. Kurstaki each (Delfin, Dupont, Wilmington, DE, USA) and five treatments with 30.13 g ha−1 of azadirachtin each (Oikos, Sipcam, Durham, USA) were carried out to control T. absoluta. A sprayer with a working width of 12 m was employed.
The dates on which each agricultural operation was carried out are reported in [22]. For operations requiring greater power, such as using the combined cultivator, a 4WD tractor equipped with a 154.5 kW diesel engine was used. A 2WD tractor equipped with a 51.5 kW diesel engine was used for all other operations.

2.3. Technical Itineraries Operative and Economic Performance Estimation

Working speed, width, depth; theoretical field times; turning times; and supply times were considered for the operational parameter estimation. Theoretical field times are the times when machines effectively operate at an optimum working speed and work over their full width of action. Supply times are the time required for fueling and technical means of refueling. The travel times of a straight section of 10 m located inside the experimental area were timed to calculate the machine’s working speeds for each operation.
The range values for the working speed are reported in Table 2. The field time and fuel consumption per unit area of each operation carried out in each technical itinerary were estimated using the previously described parameters (Table 3).
To evaluate the economic performance of the technical itineraries, the gross salable production (GSP), average variable costs (VC), and gross income (GI) of each technical itinerary and for each growing season were taken into consideration. The GSP was calculated by multiplying each technical itinerary yield by the market price of organic processing tomato, which was set at 1170 EUR Mg−1 in 2020 and 1120 EUR Mg−1 in 2021 [25]. The average variable costs (VC) included expenses for labor, fuel, agricultural operations, and technical inputs. For labor costs calculations, the time and number of operators required for each operation were considered, and an hourly rate of 20 EUR h−1 was used according to the actual hourly remuneration of agricultural workers. Fuel costs were estimated using an average market price of agricultural diesel at 0.88 EUR kg−1. The unit costs of agricultural operations were based on the costs associated with tractors and their coupled machinery, accounting for fixed costs (such as depreciation, interest, and miscellaneous expenses over the equipment’s useful life) and variable maintenance and repair costs. For technical inputs, costs related to cover crop seeds and the LPG for flame weeding, irrigation, fertilization, and phytosanitary treatments were included. The gross income was then determined by subtracting the total VC from the GSP. CO2 emissions were calculated considering CO2 emission values of 3.17 kg per kg of diesel fuel and 2.92 kg per kg of LPG consumed [26,27].

2.4. Statistical Analysis

Data were analyzed using R statistical software (version 2.4.2, R Core Team, Vienna, Austria). Normality distribution was evaluated using the Shapiro–Wilk normality test; the Bartlett test was employed for homoskedasticity. A three-way ANOVA was performed to assess the effects of cover crop type (CC), technical itinerary (TI), year, and the interactions between these factors on the gross salable production (GSP) and gross income (GI). The post-hoc LSD (Least Significant Difference) test at 0.05 probability was carried out through the package “agricolae” when necessary.

3. Results

The results of the three-way ANOVA revealed that the year, CC, and TI had a significant effect on the GSP and GI (p < 0.001) (Table 4). The interaction between year and TI also significantly affected the GSP and GI (p < 0.001). For this reason, a two-way ANOVA analysis was conducted separately for the data collected in 2020 and 2021.

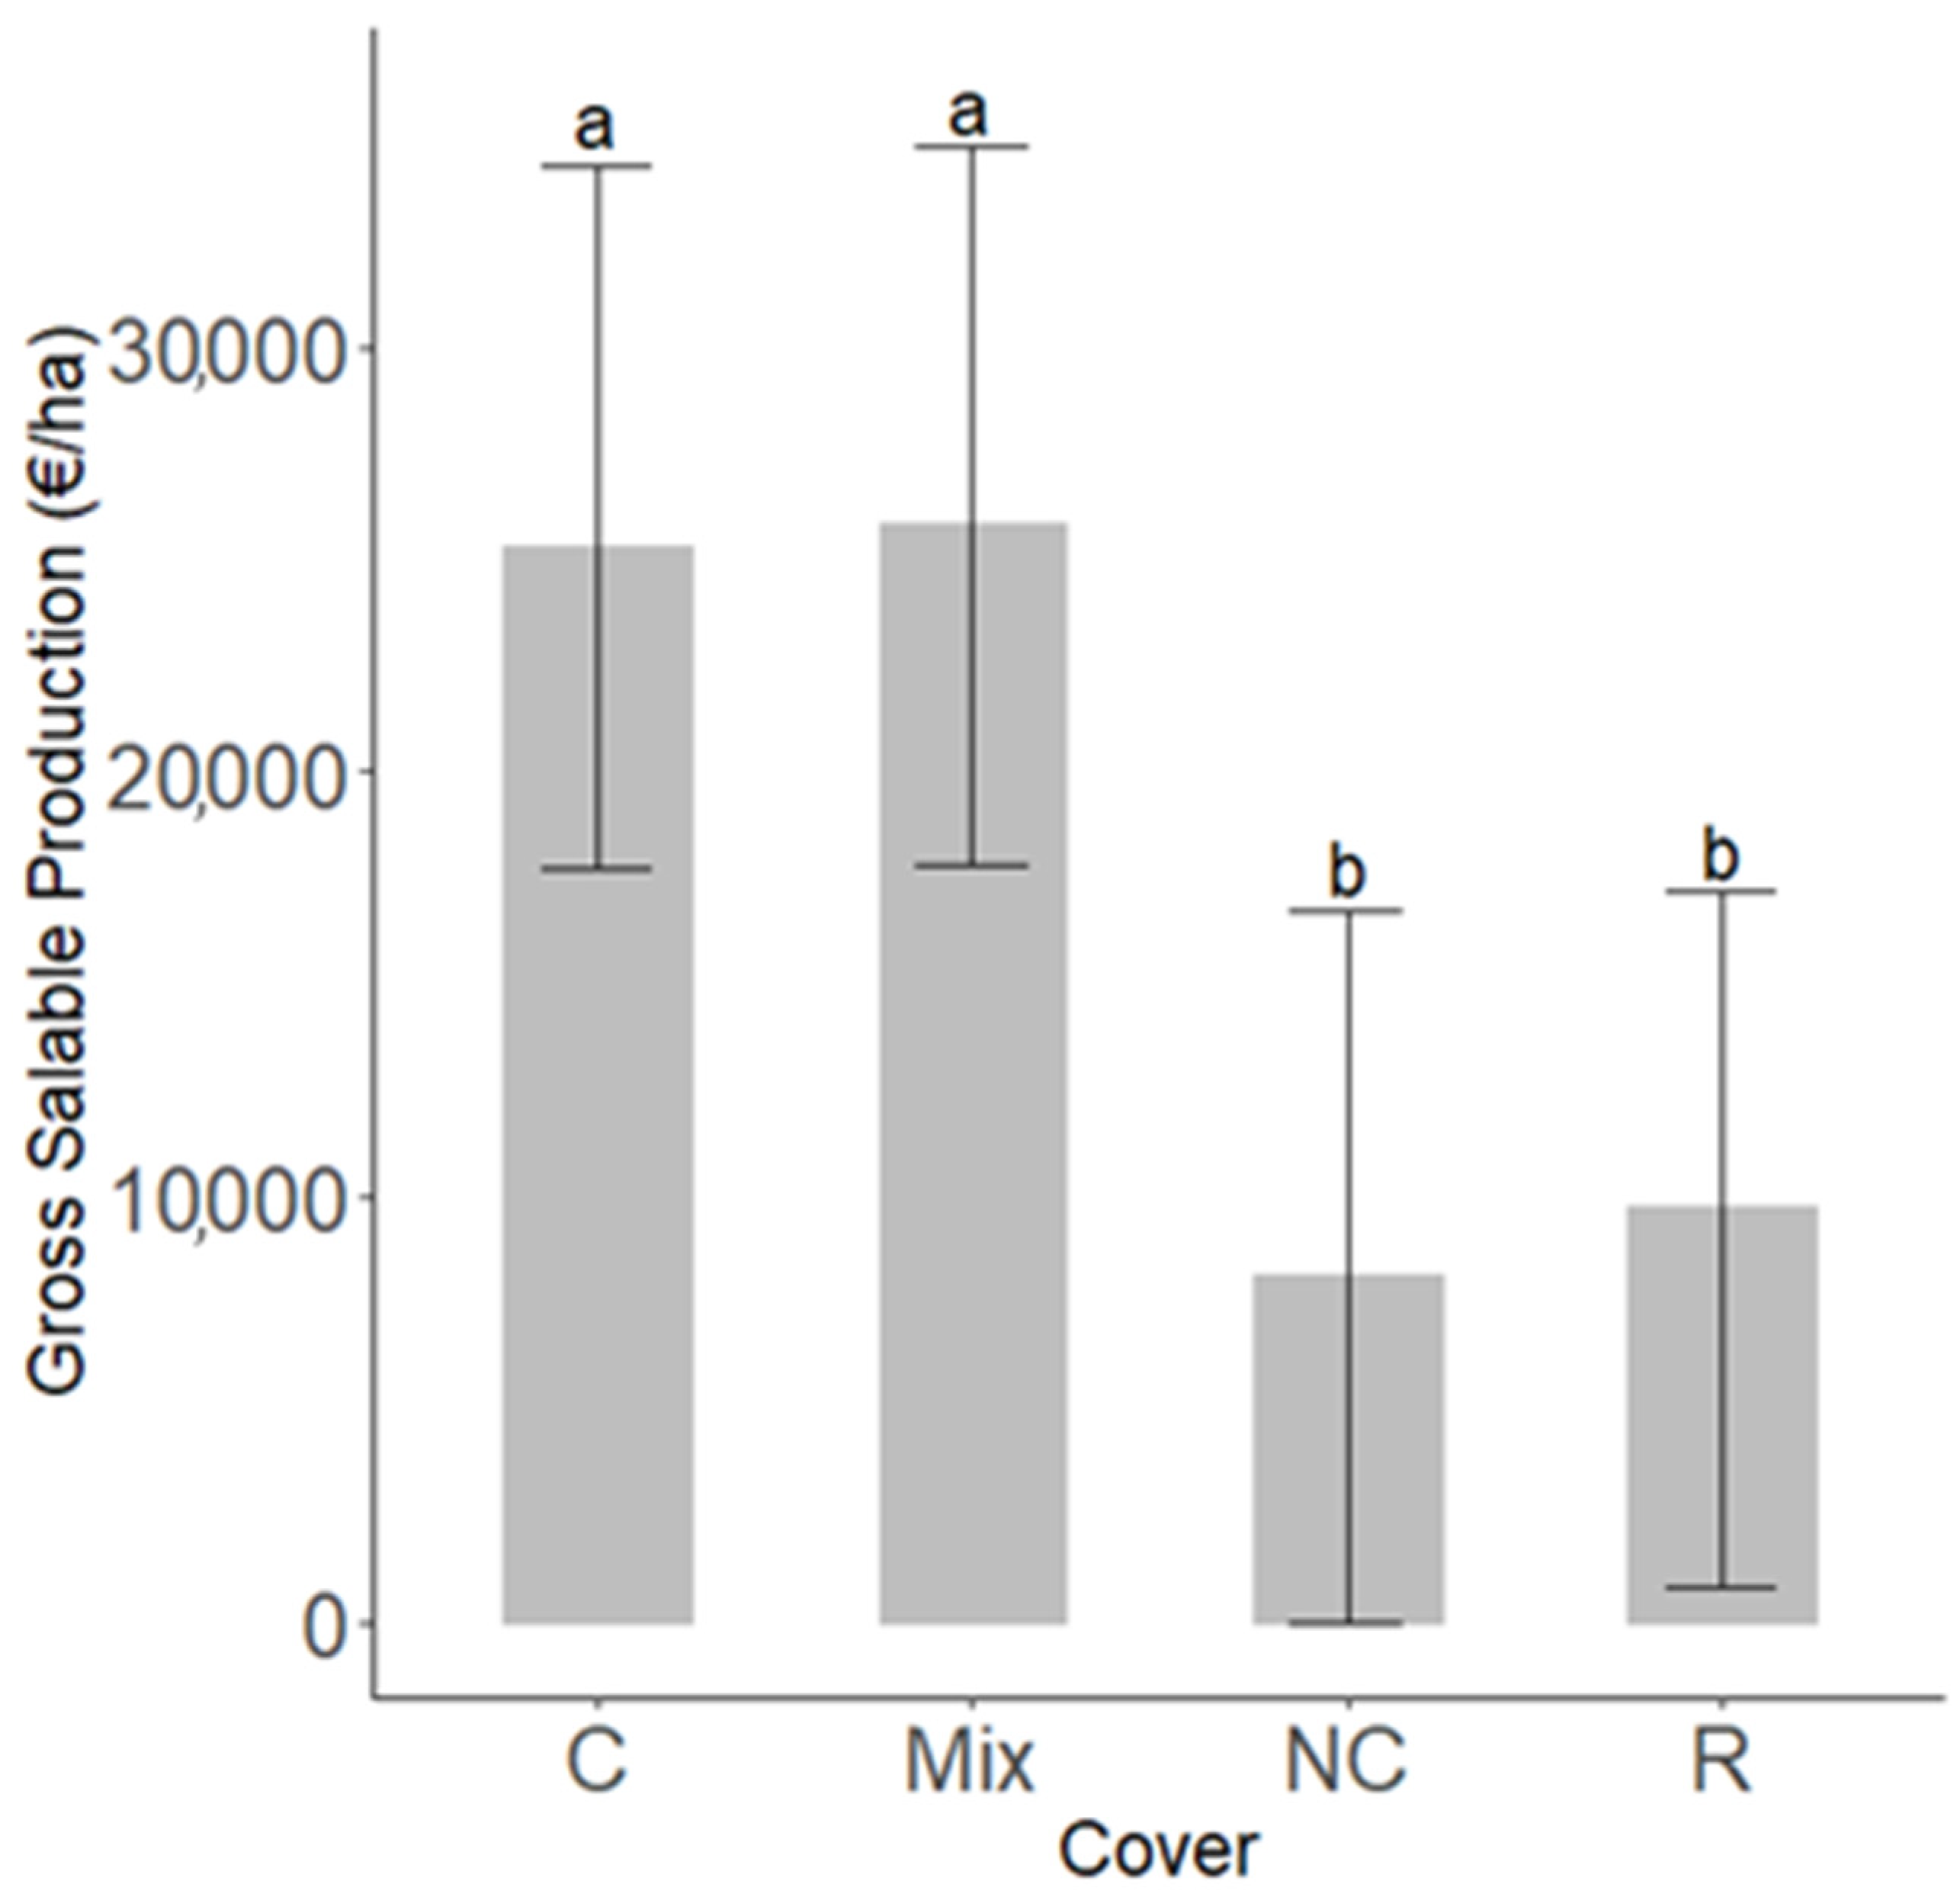
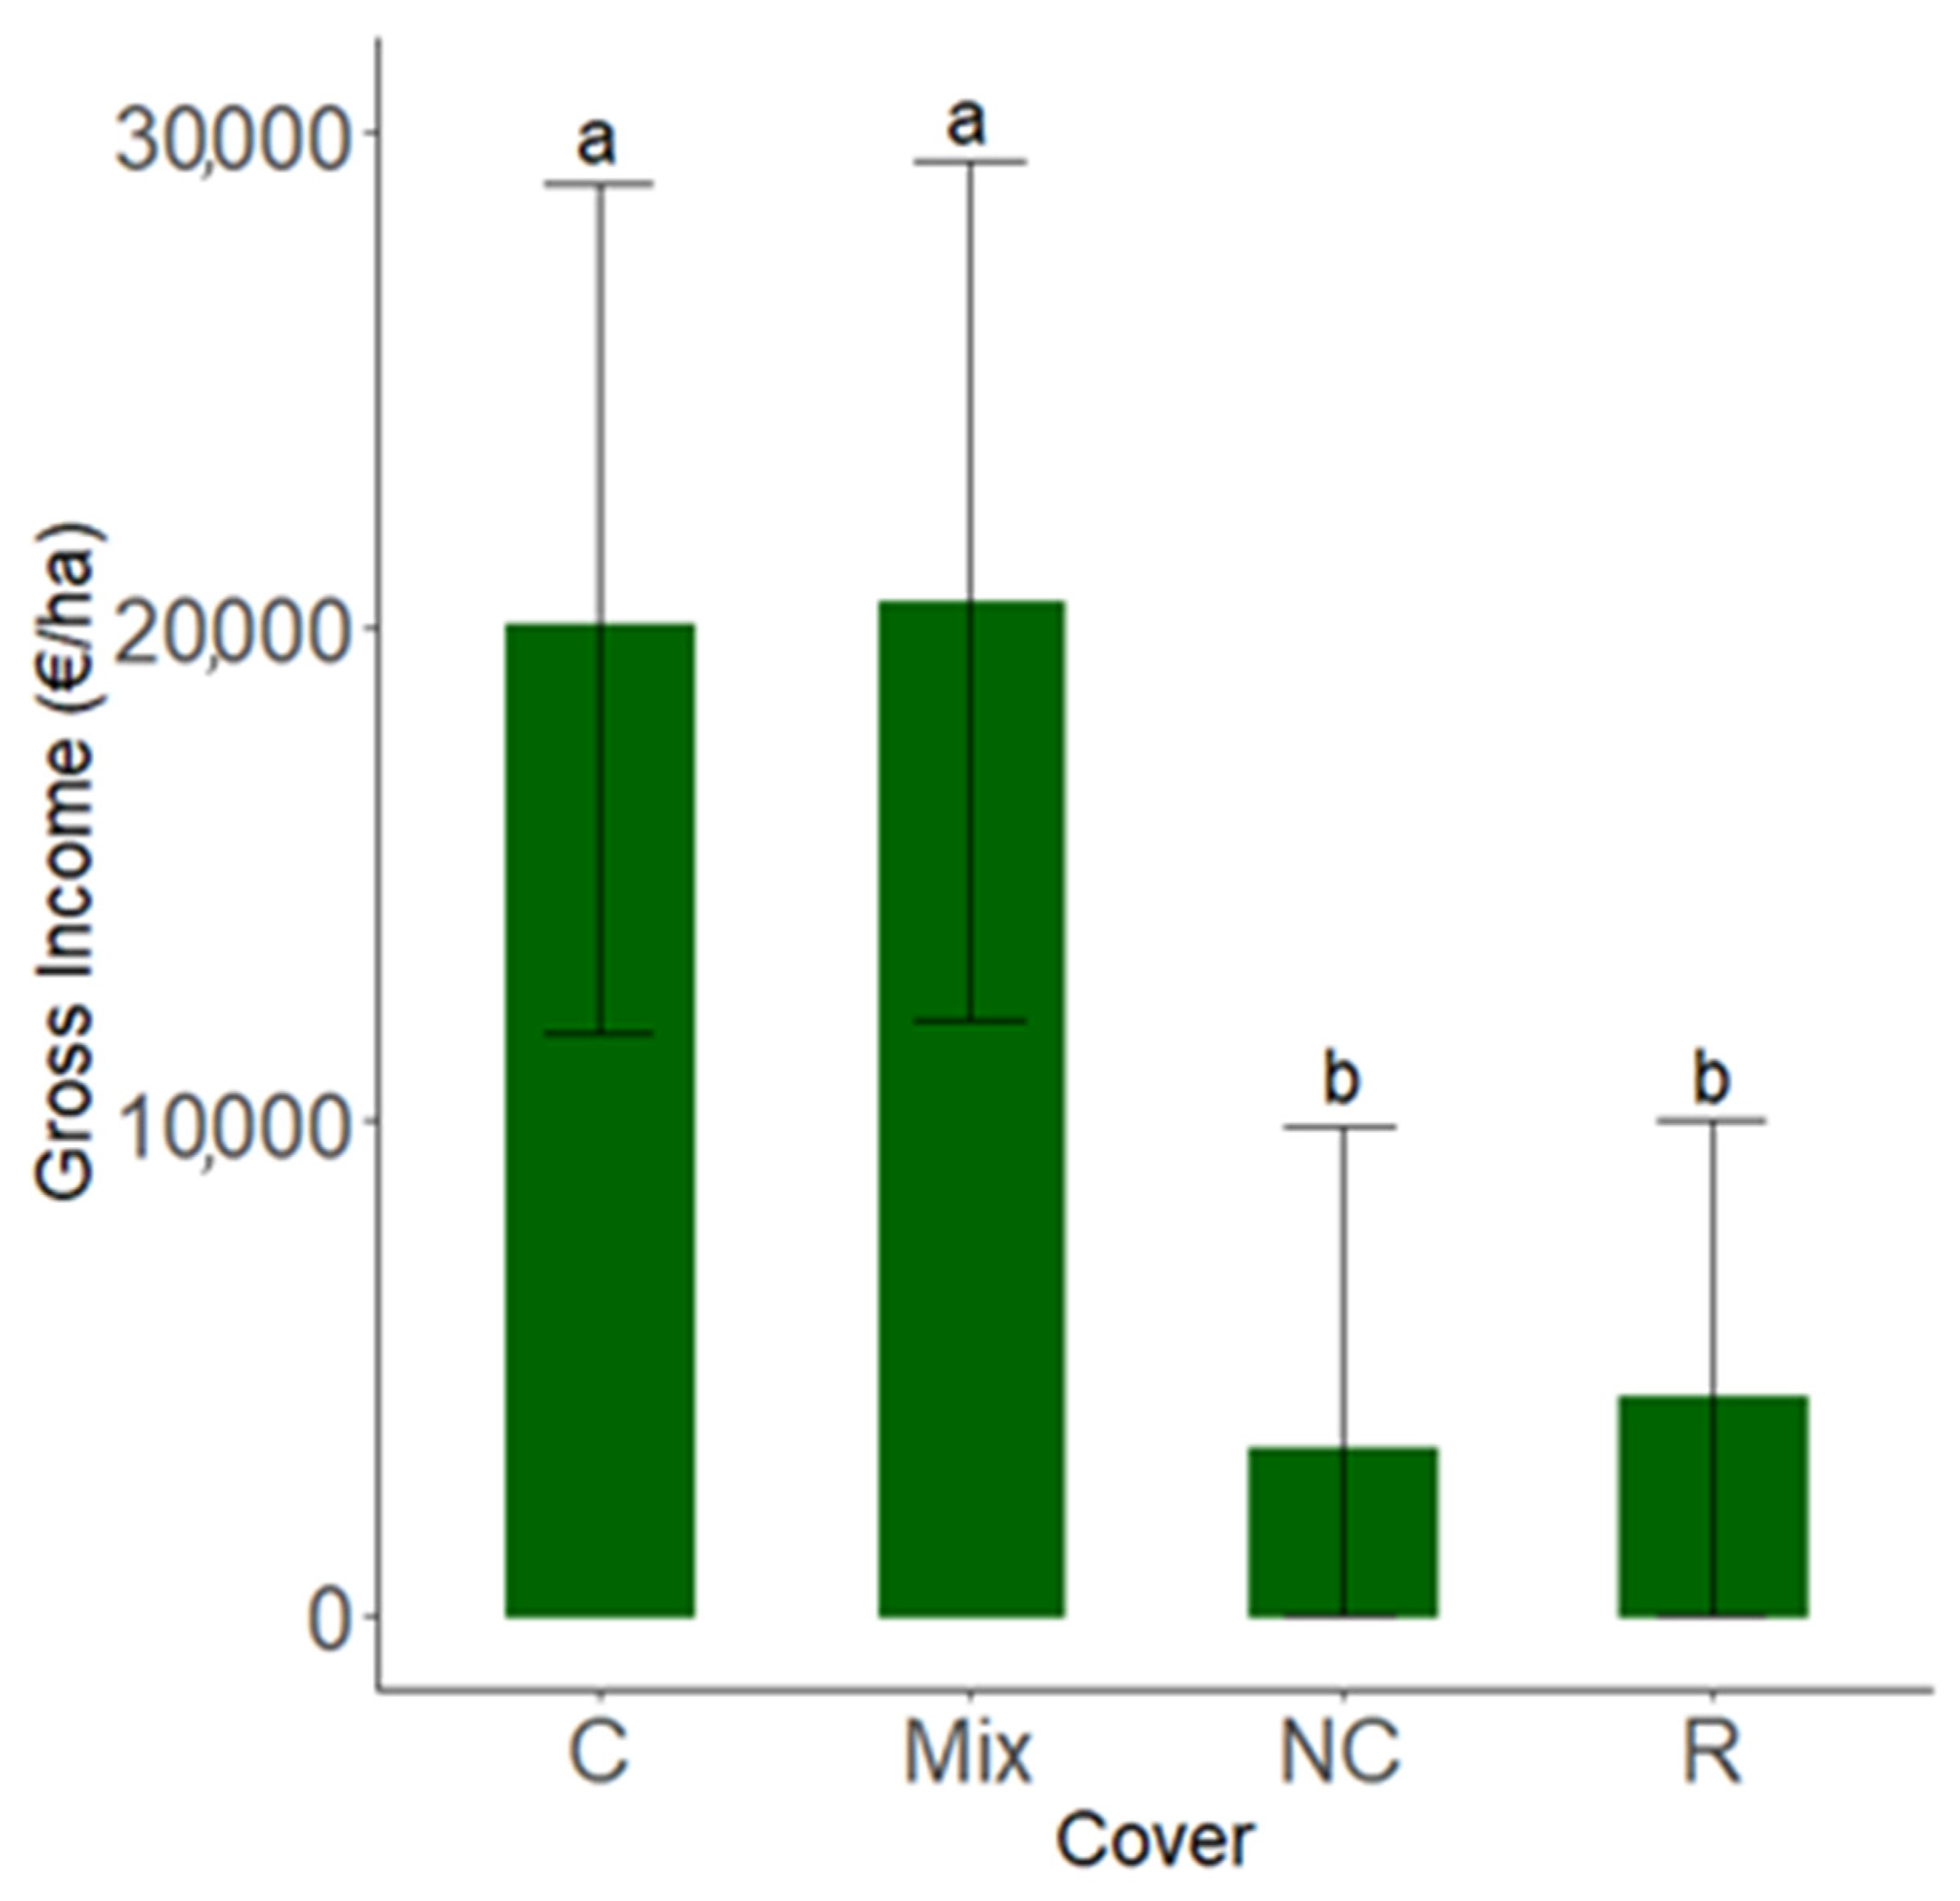
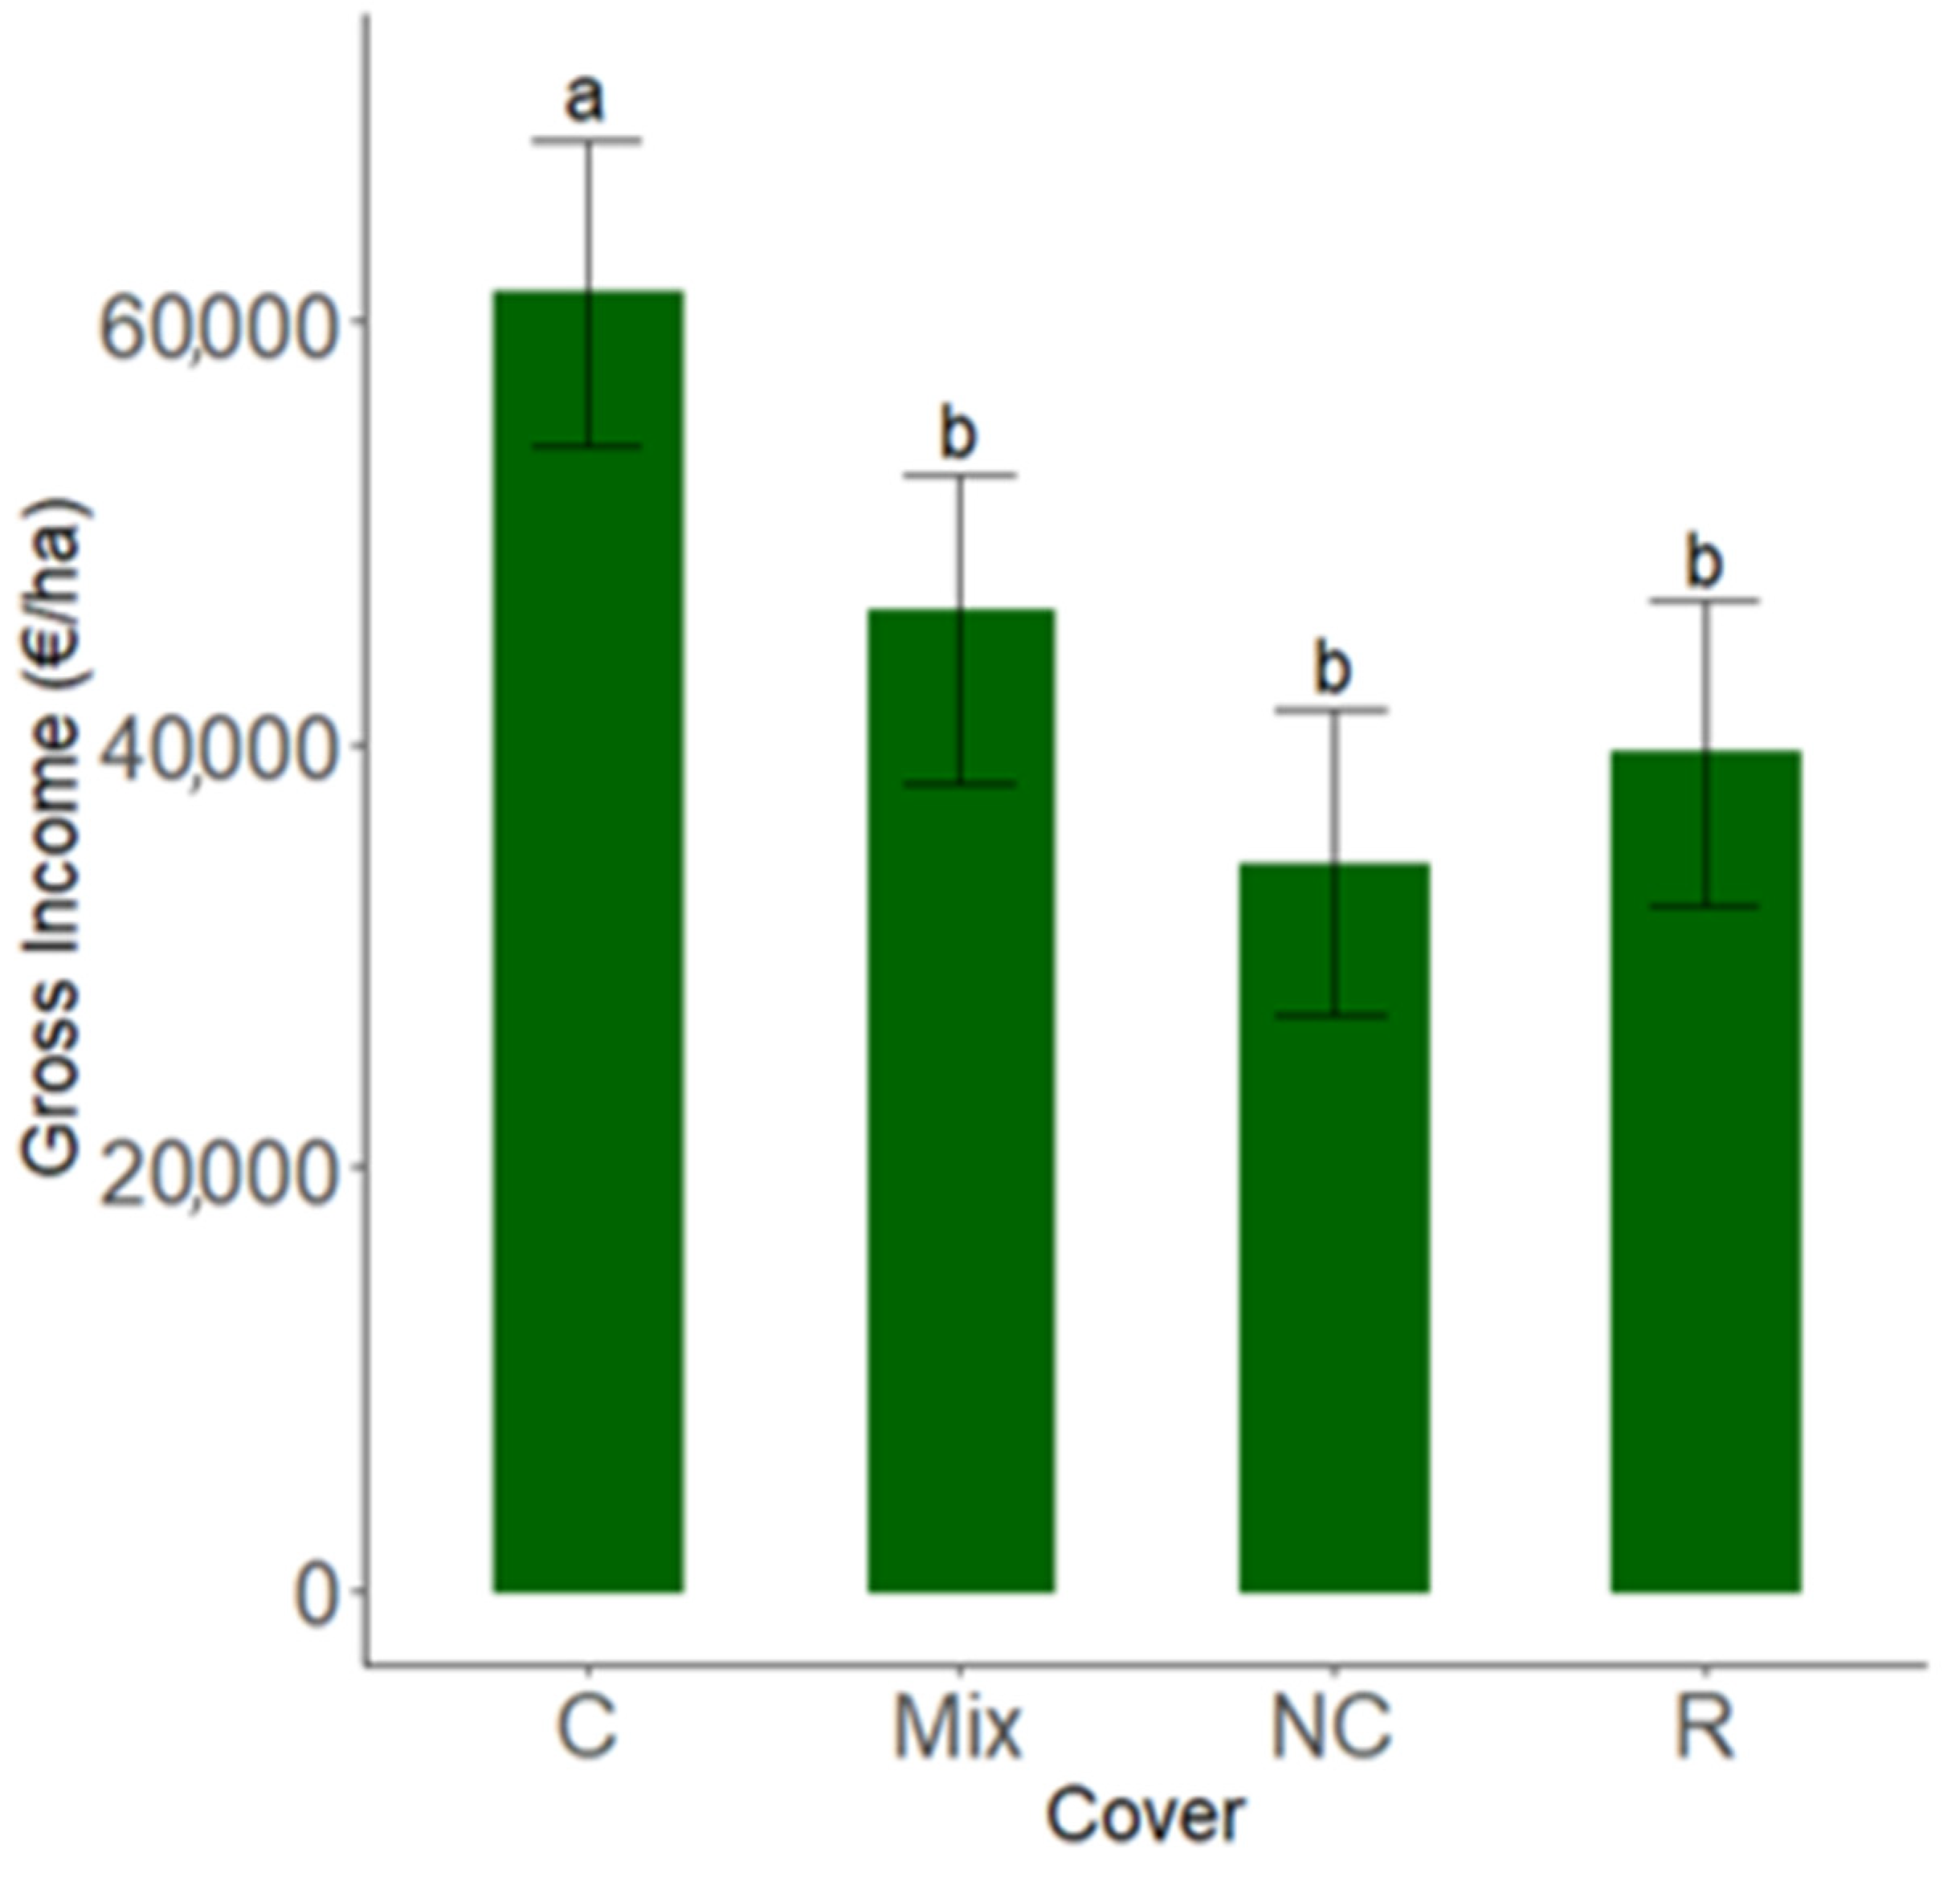
3.1. Economic Performances of the First Year

An analysis of variance (Two-way ANOVA) revealed that both GSP and GI were affected by the type of CC (p < 0.05) during 2020. The results of the two-way ANOVA conducted on GSP and GI are reported in Table 5.
A higher value of GSP was detected for Mix (25,818.97 EUR ha−1) and C (25,326.60 EUR ha−1) compared to R (9746.10 EUR ha−1) and NC (8190.00 EUR ha−1); no differences emerged in the comparison among Mix and C, and between NC and R (Figure 2).
Higher mean values of GI were detected for Mix (20490.88 EUR ha−1) and C (20034.50 EUR ha−1) compared to R (4382.01 EUR ha−1) and NC (3387.44 EUR ha−1). No difference emerged between C and Mix and between NC and R (Figure 3).

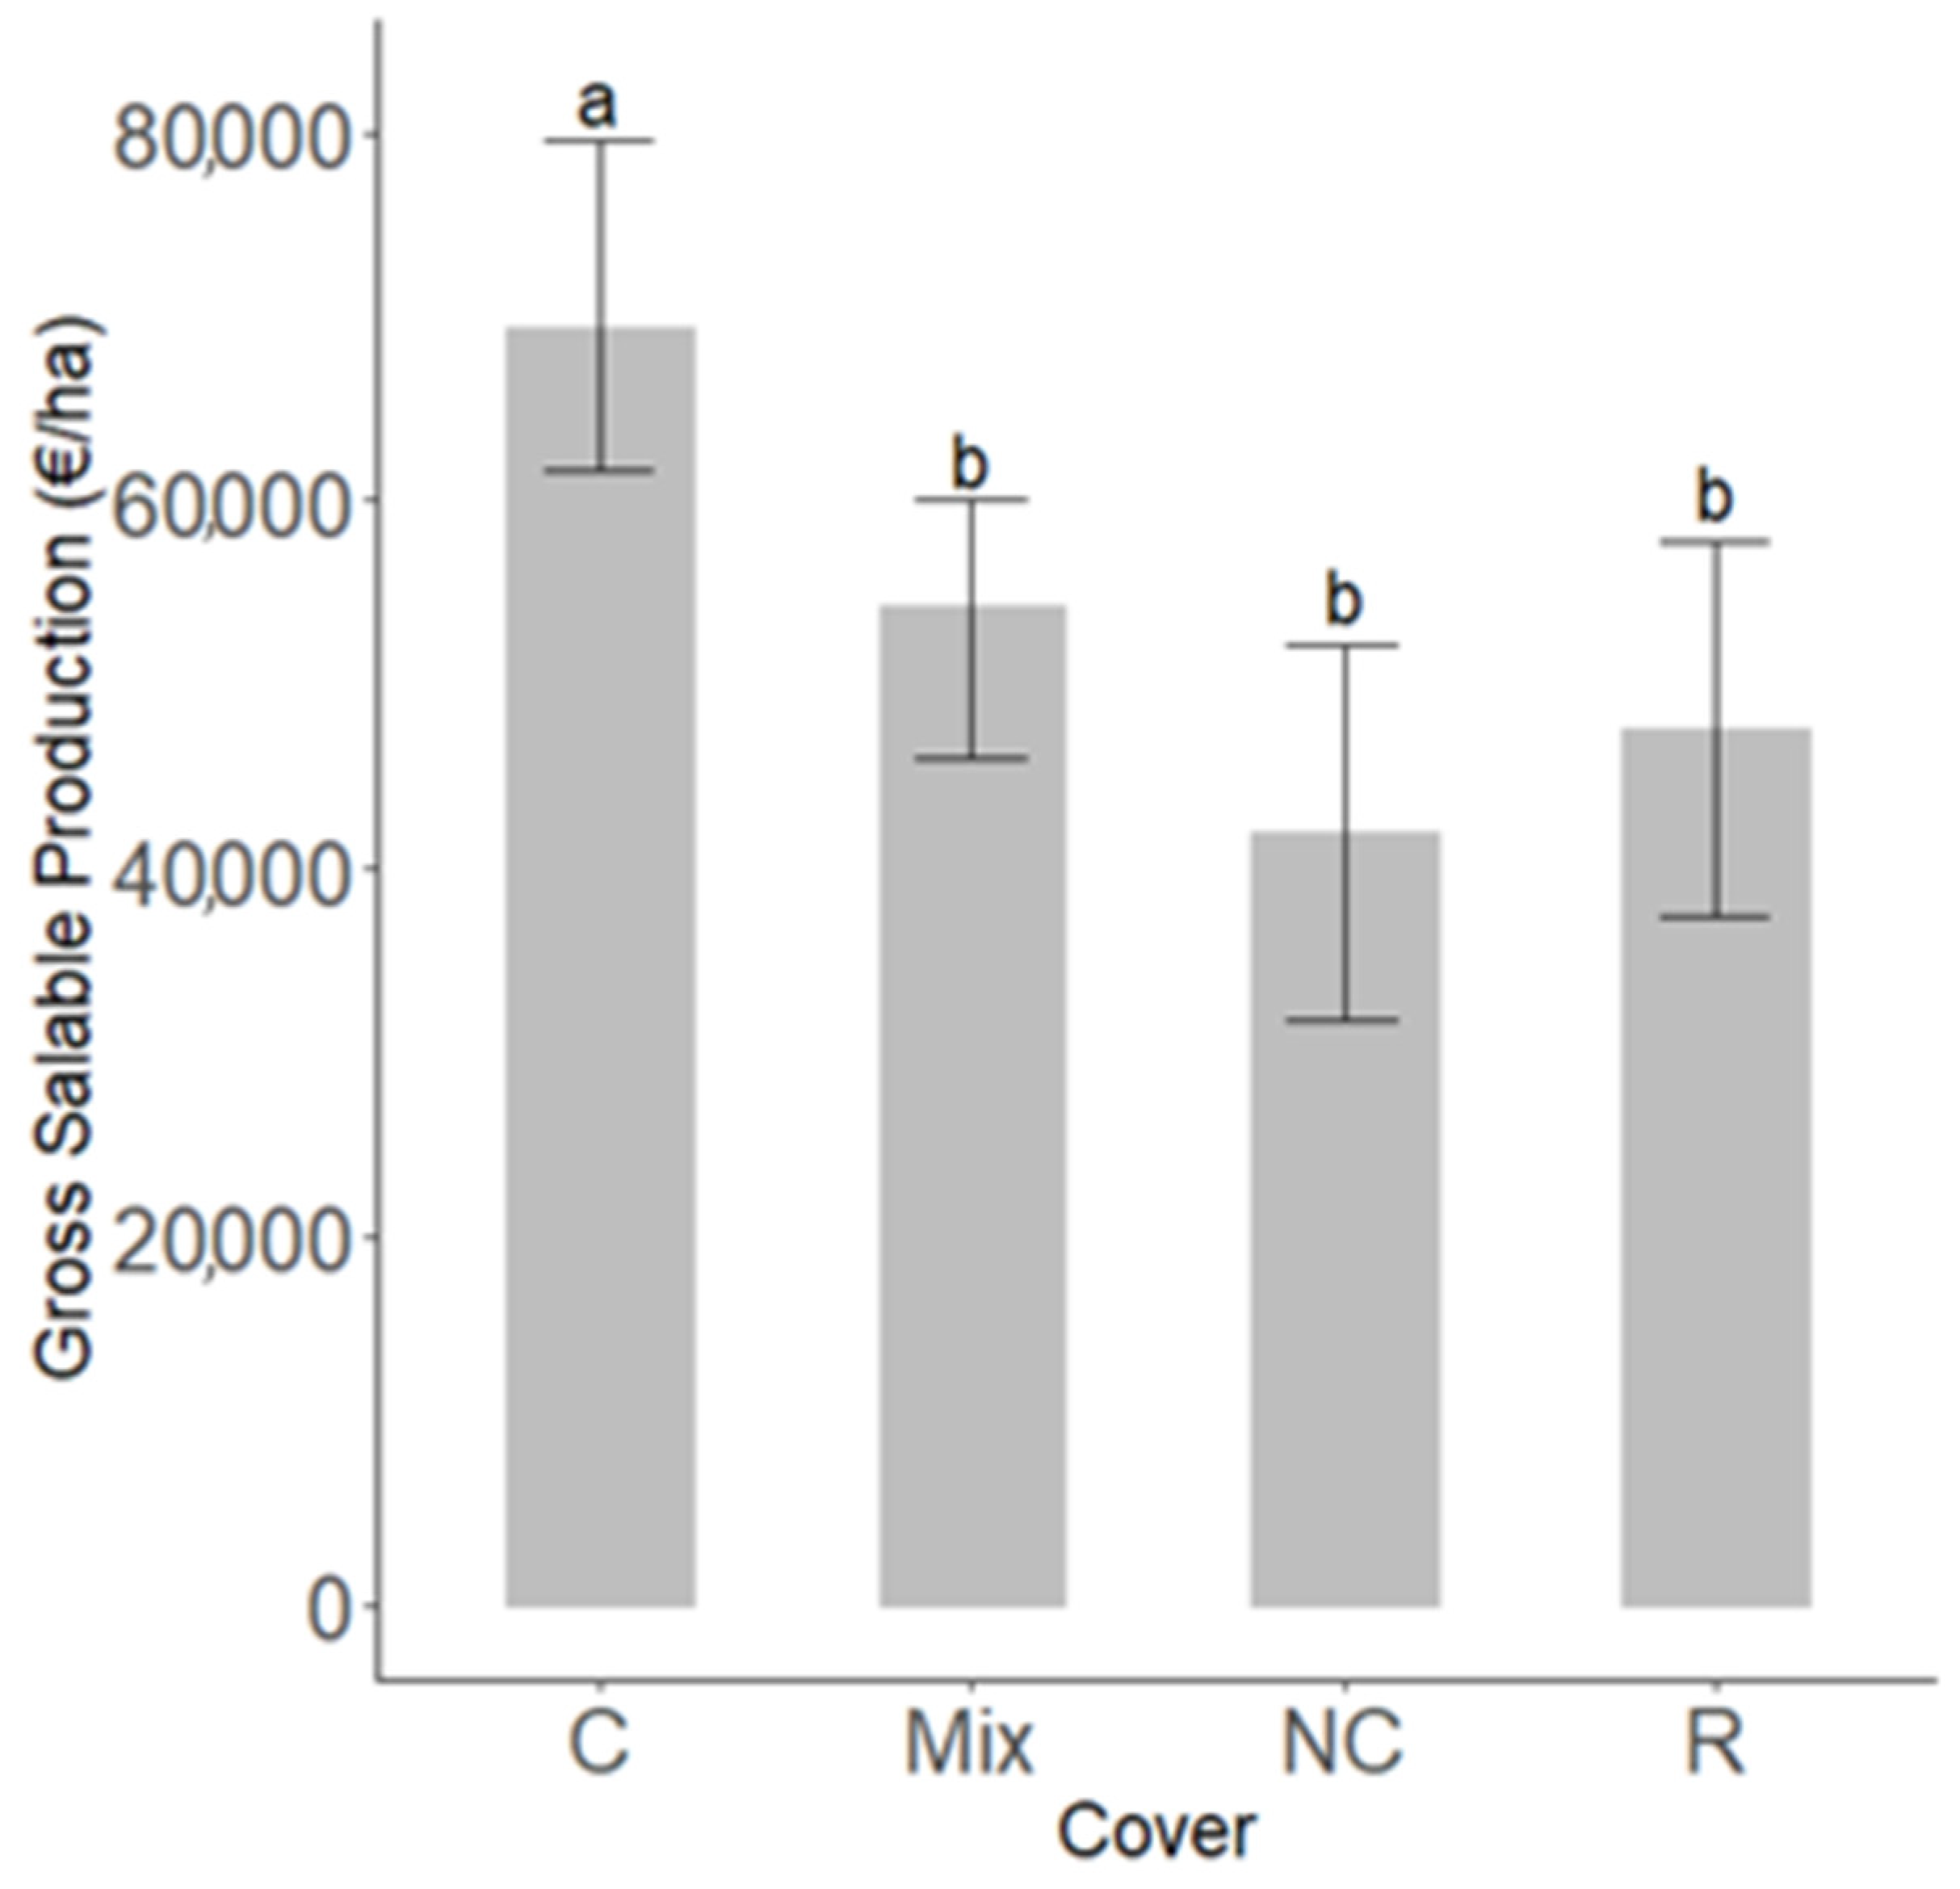
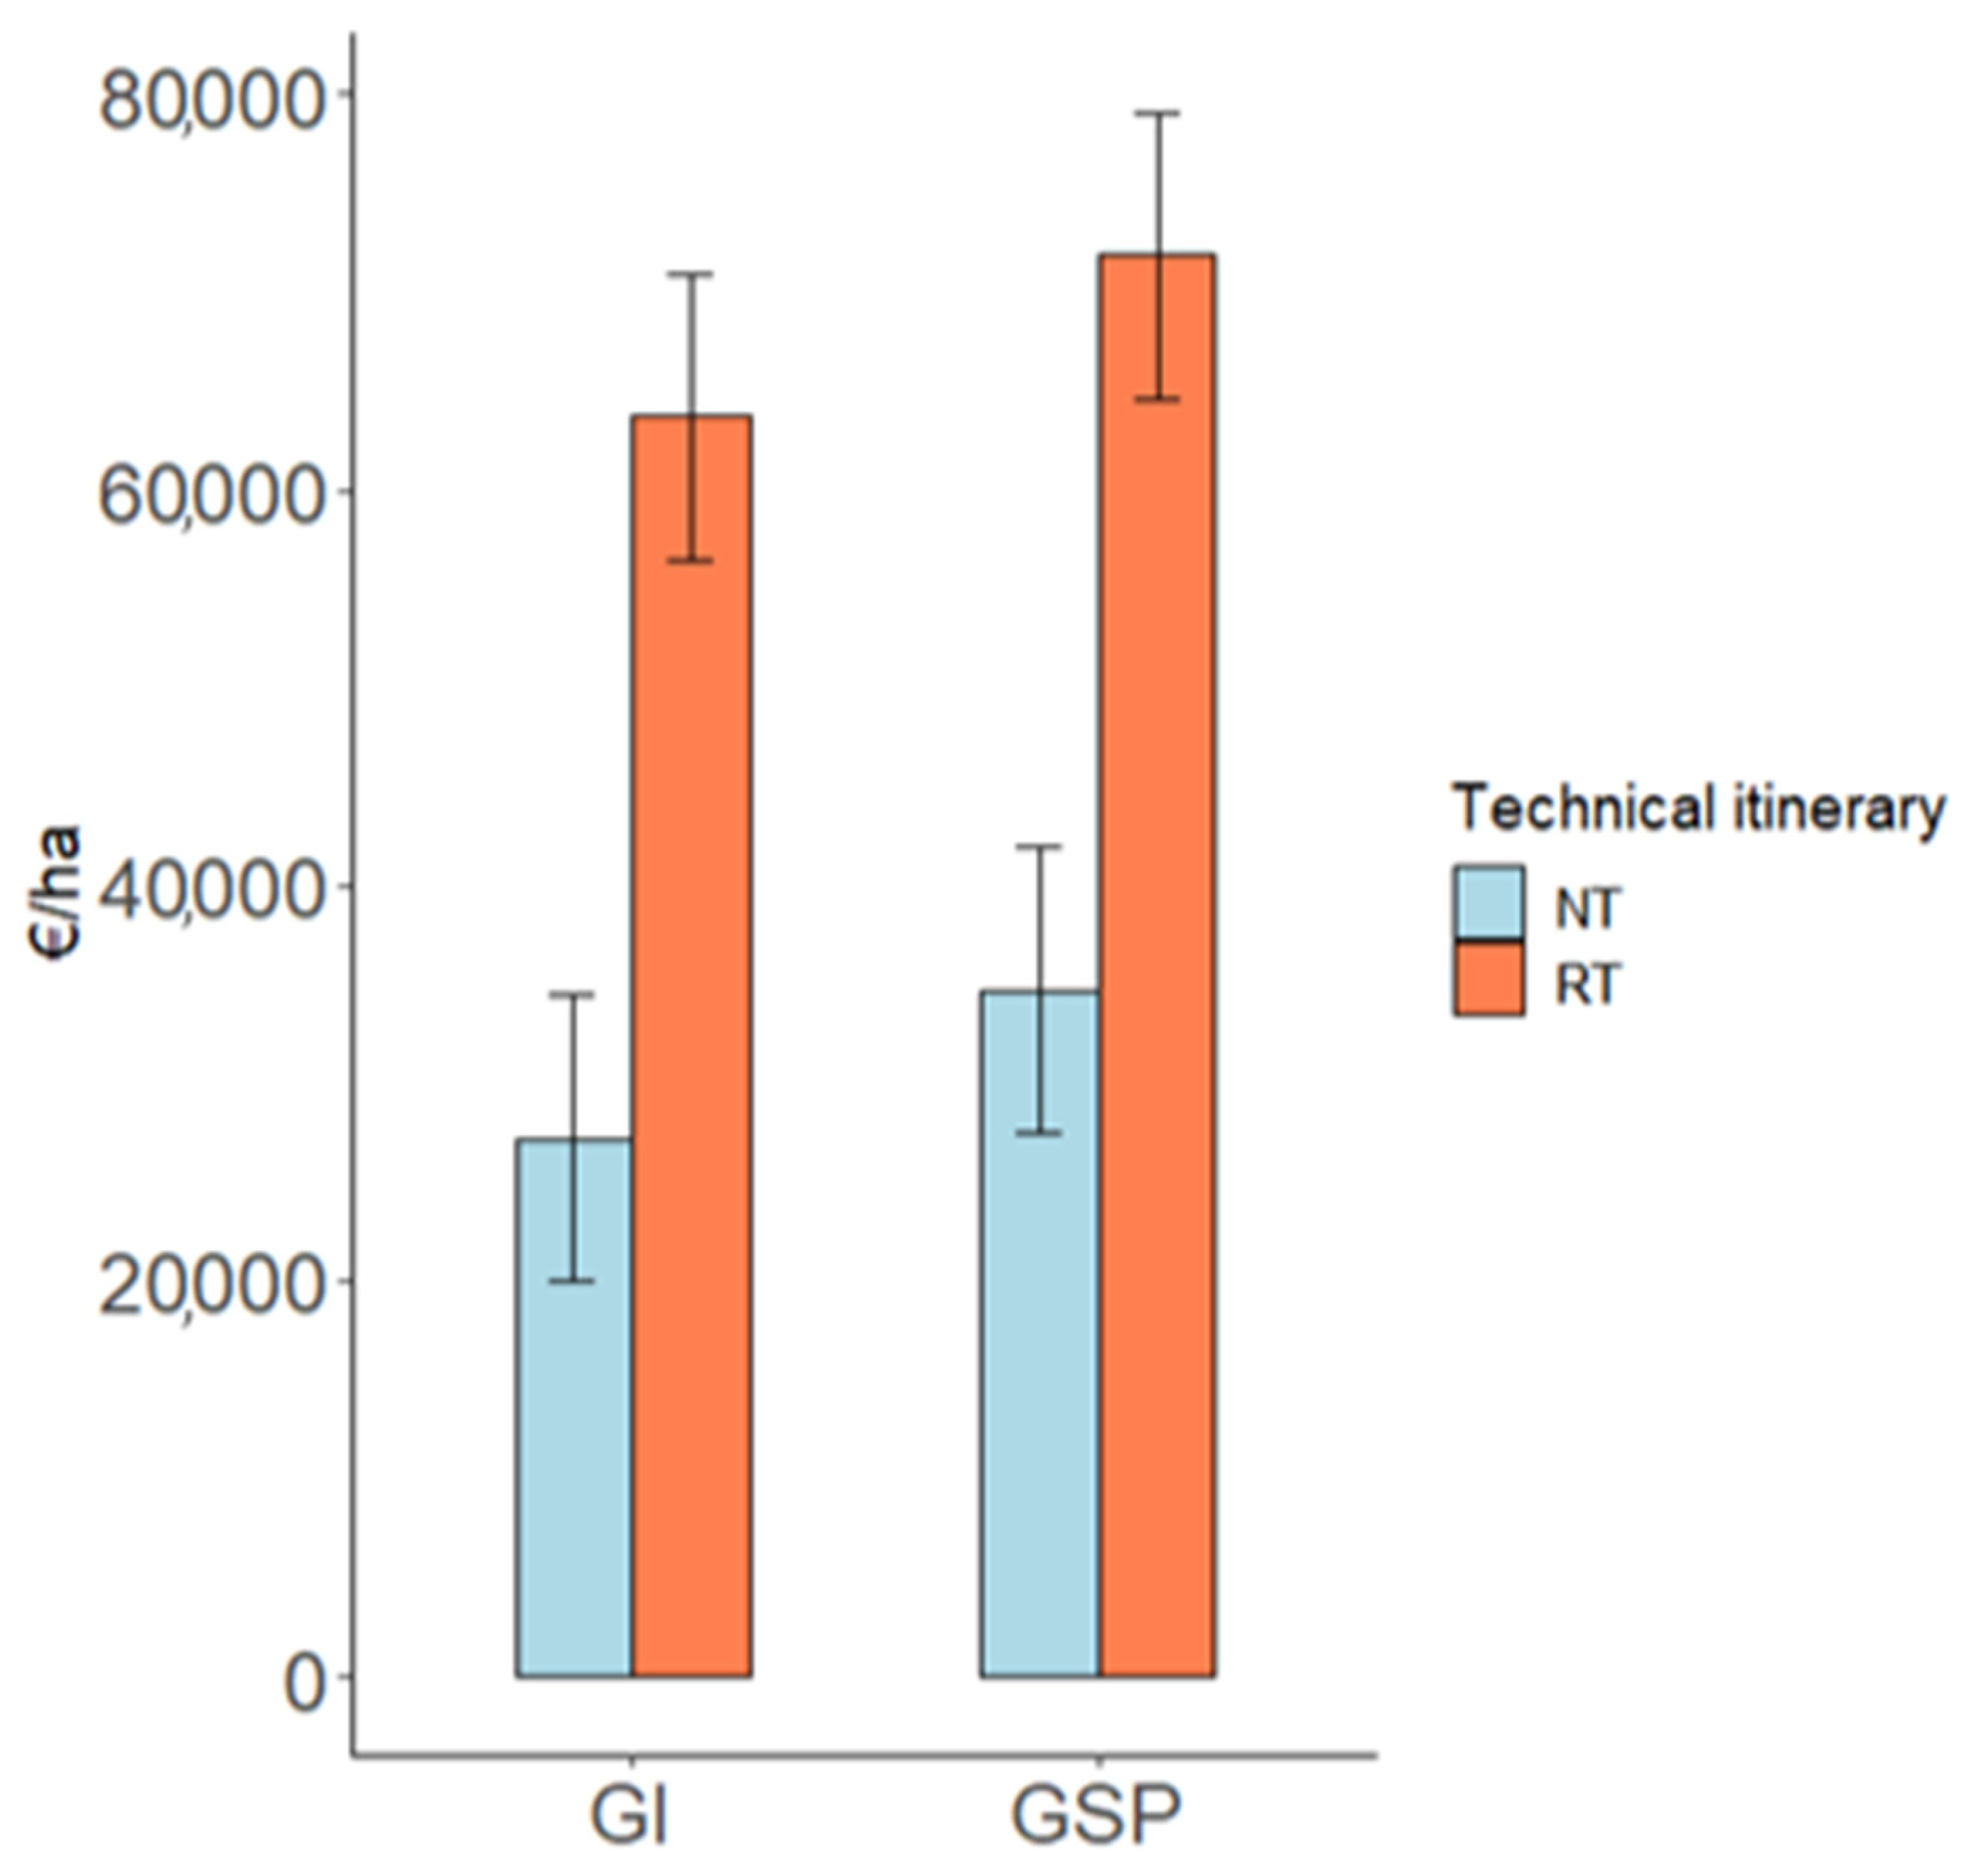
3.2. Economic Performances of the Second Year

An analysis of variance (Two-way ANOVA) revealed that both GSP and GI were affected by the type of CC (p < 0.01) and TI (p < 0.001) during 2021 (Table 4). The results of the two-way ANOVA regarding the GSP and GI during 2021 are shown in Table 6.
The highest mean value of GSP was detected for C (69,310.18 EUR ha−1) compared to Mix (54,293.26 EUR ha−1), R (47,581.89 EUR ha−1), and NC (41,959.89 EUR ha−1), which obtained similar results (Figure 4).
Higher mean values of GI were detected for C (61,405.36 EUR ha−1) compared to Mix (46,352.45 EUR ha−1), R (39,605.07 EUR ha−1), and NC (34,416.35 EUR ha−1). No differences emerged between Mix, R, and NC (Figure 5).
A higher mean value of GSP was detected for the RT itinerary (71,891.58 EUR ha−1) than for the NT itinerary (34,681.03 EUR ha−1). A higher mean value of GI was detected for the RT itinerary (63,699.28 EUR ha−1) compared to the NT itinerary (27,190.34 EUR ha−1) (Figure 6).

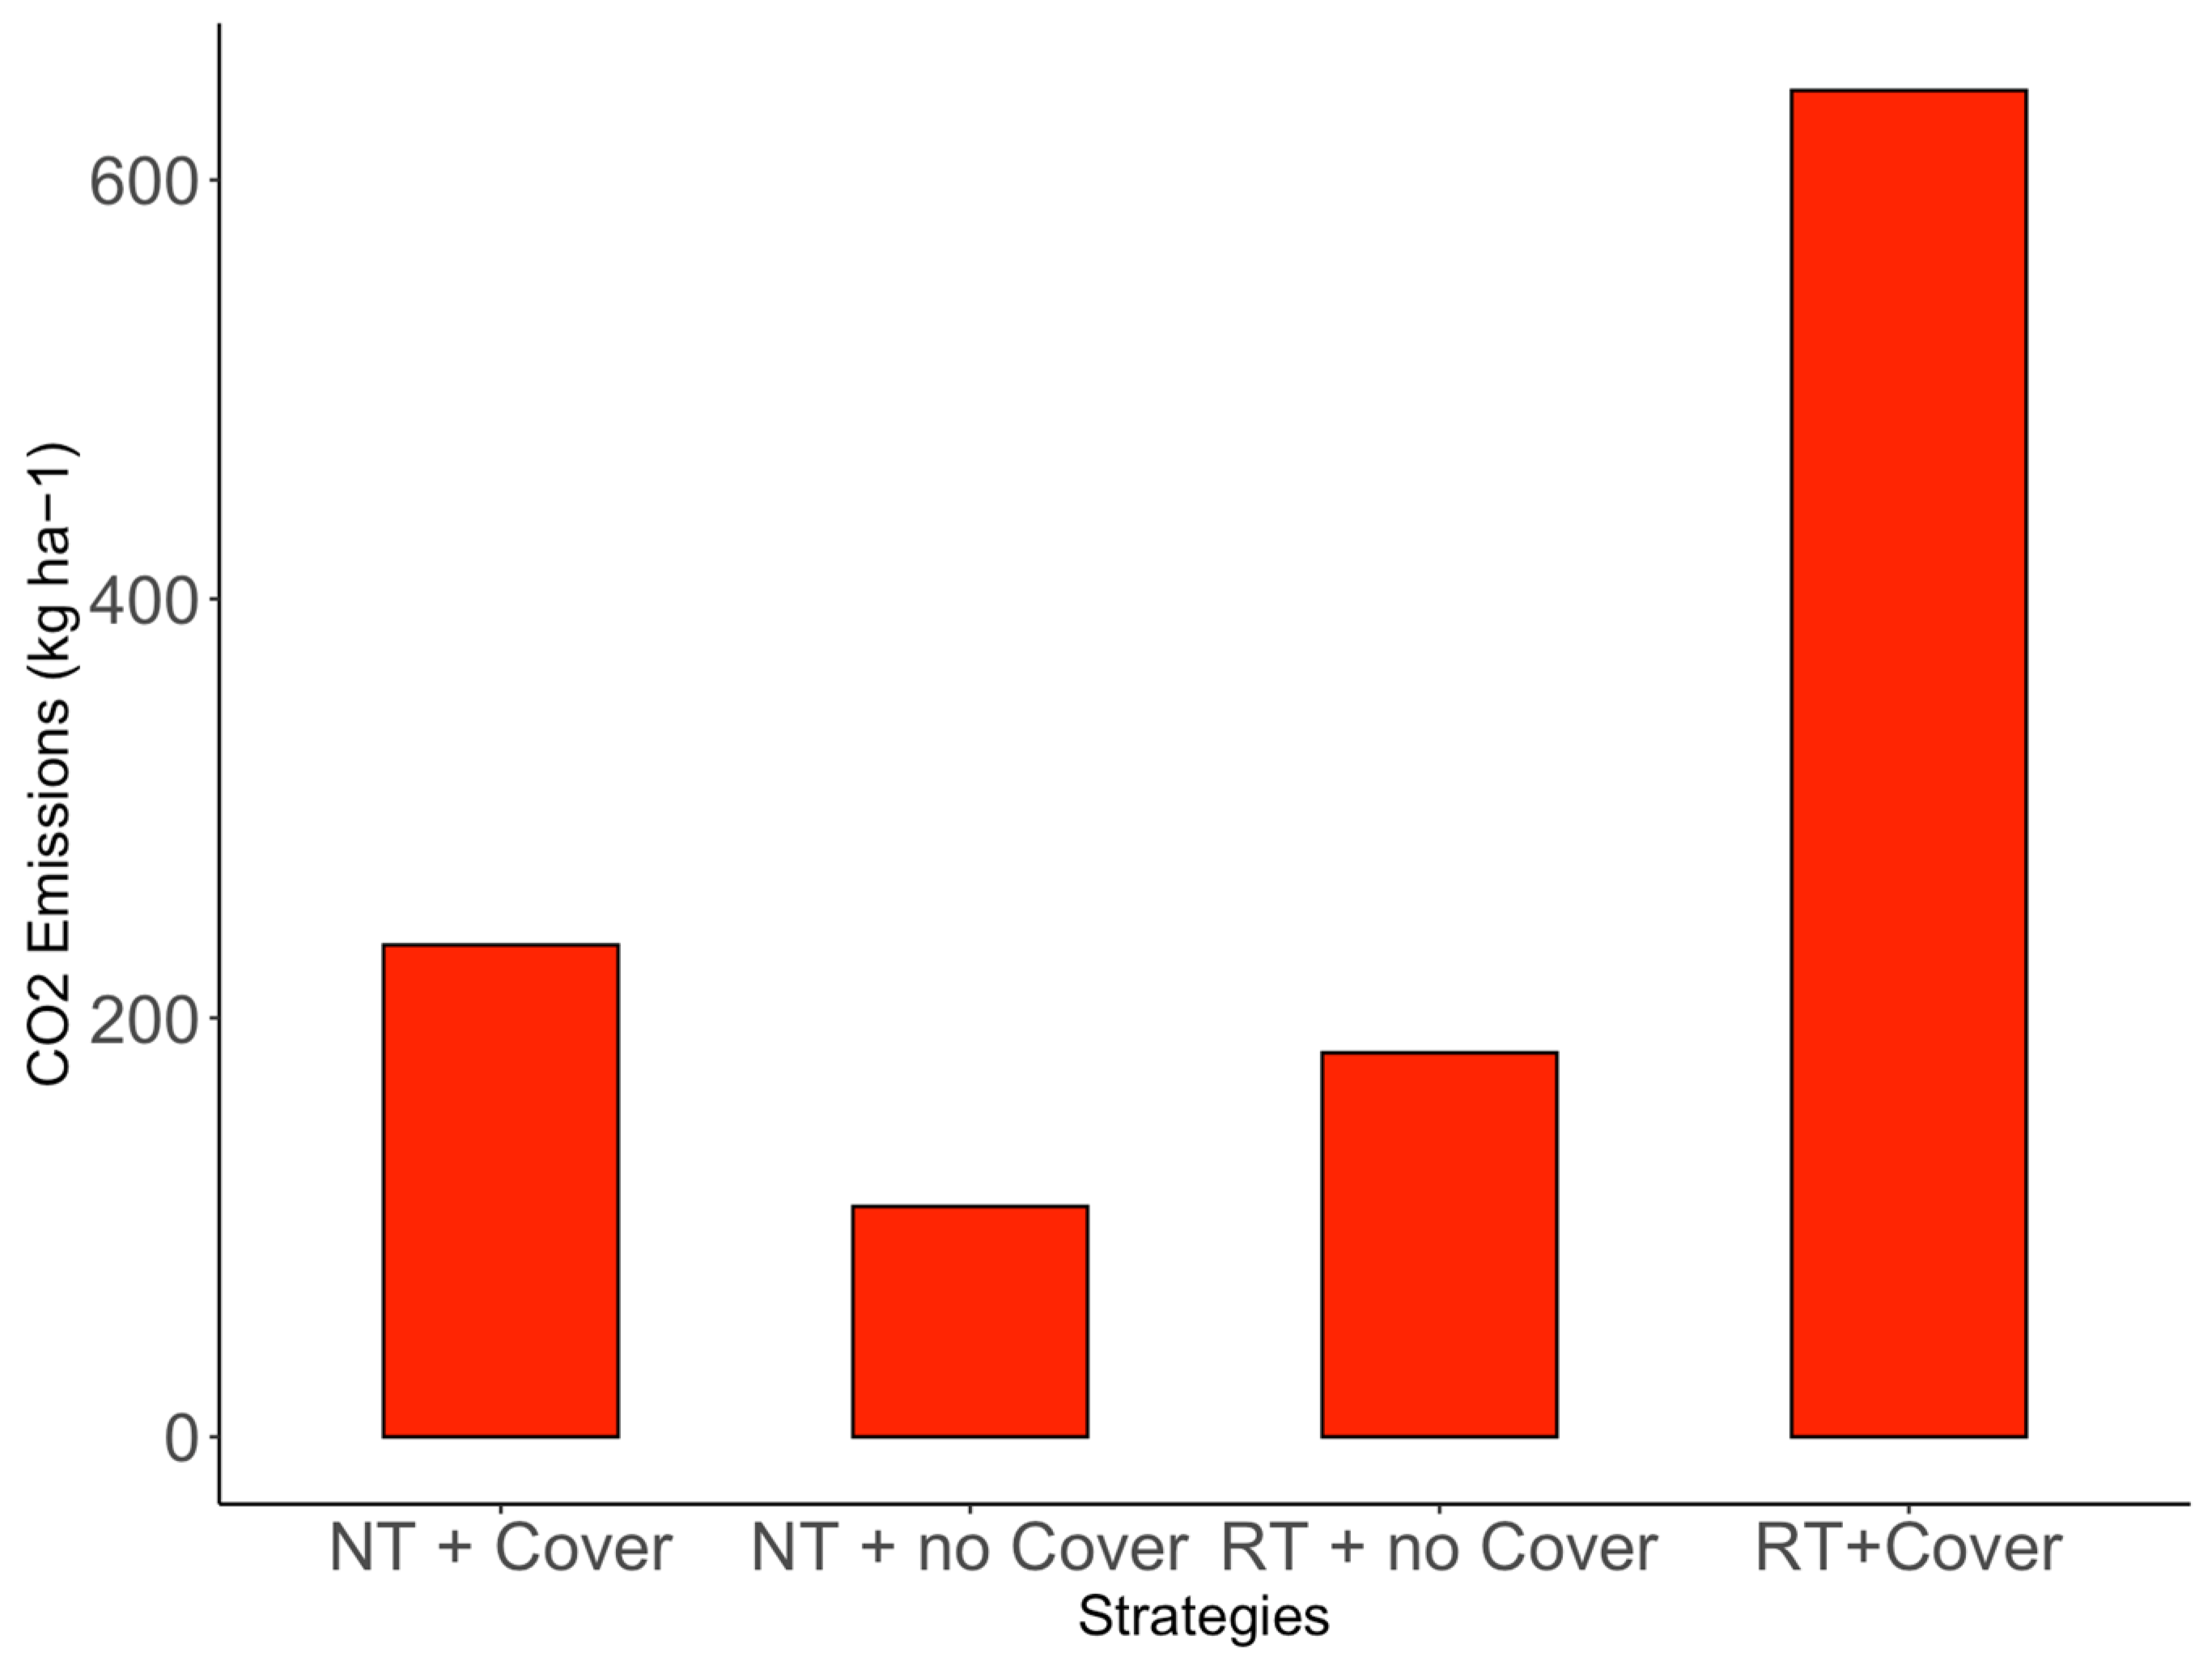
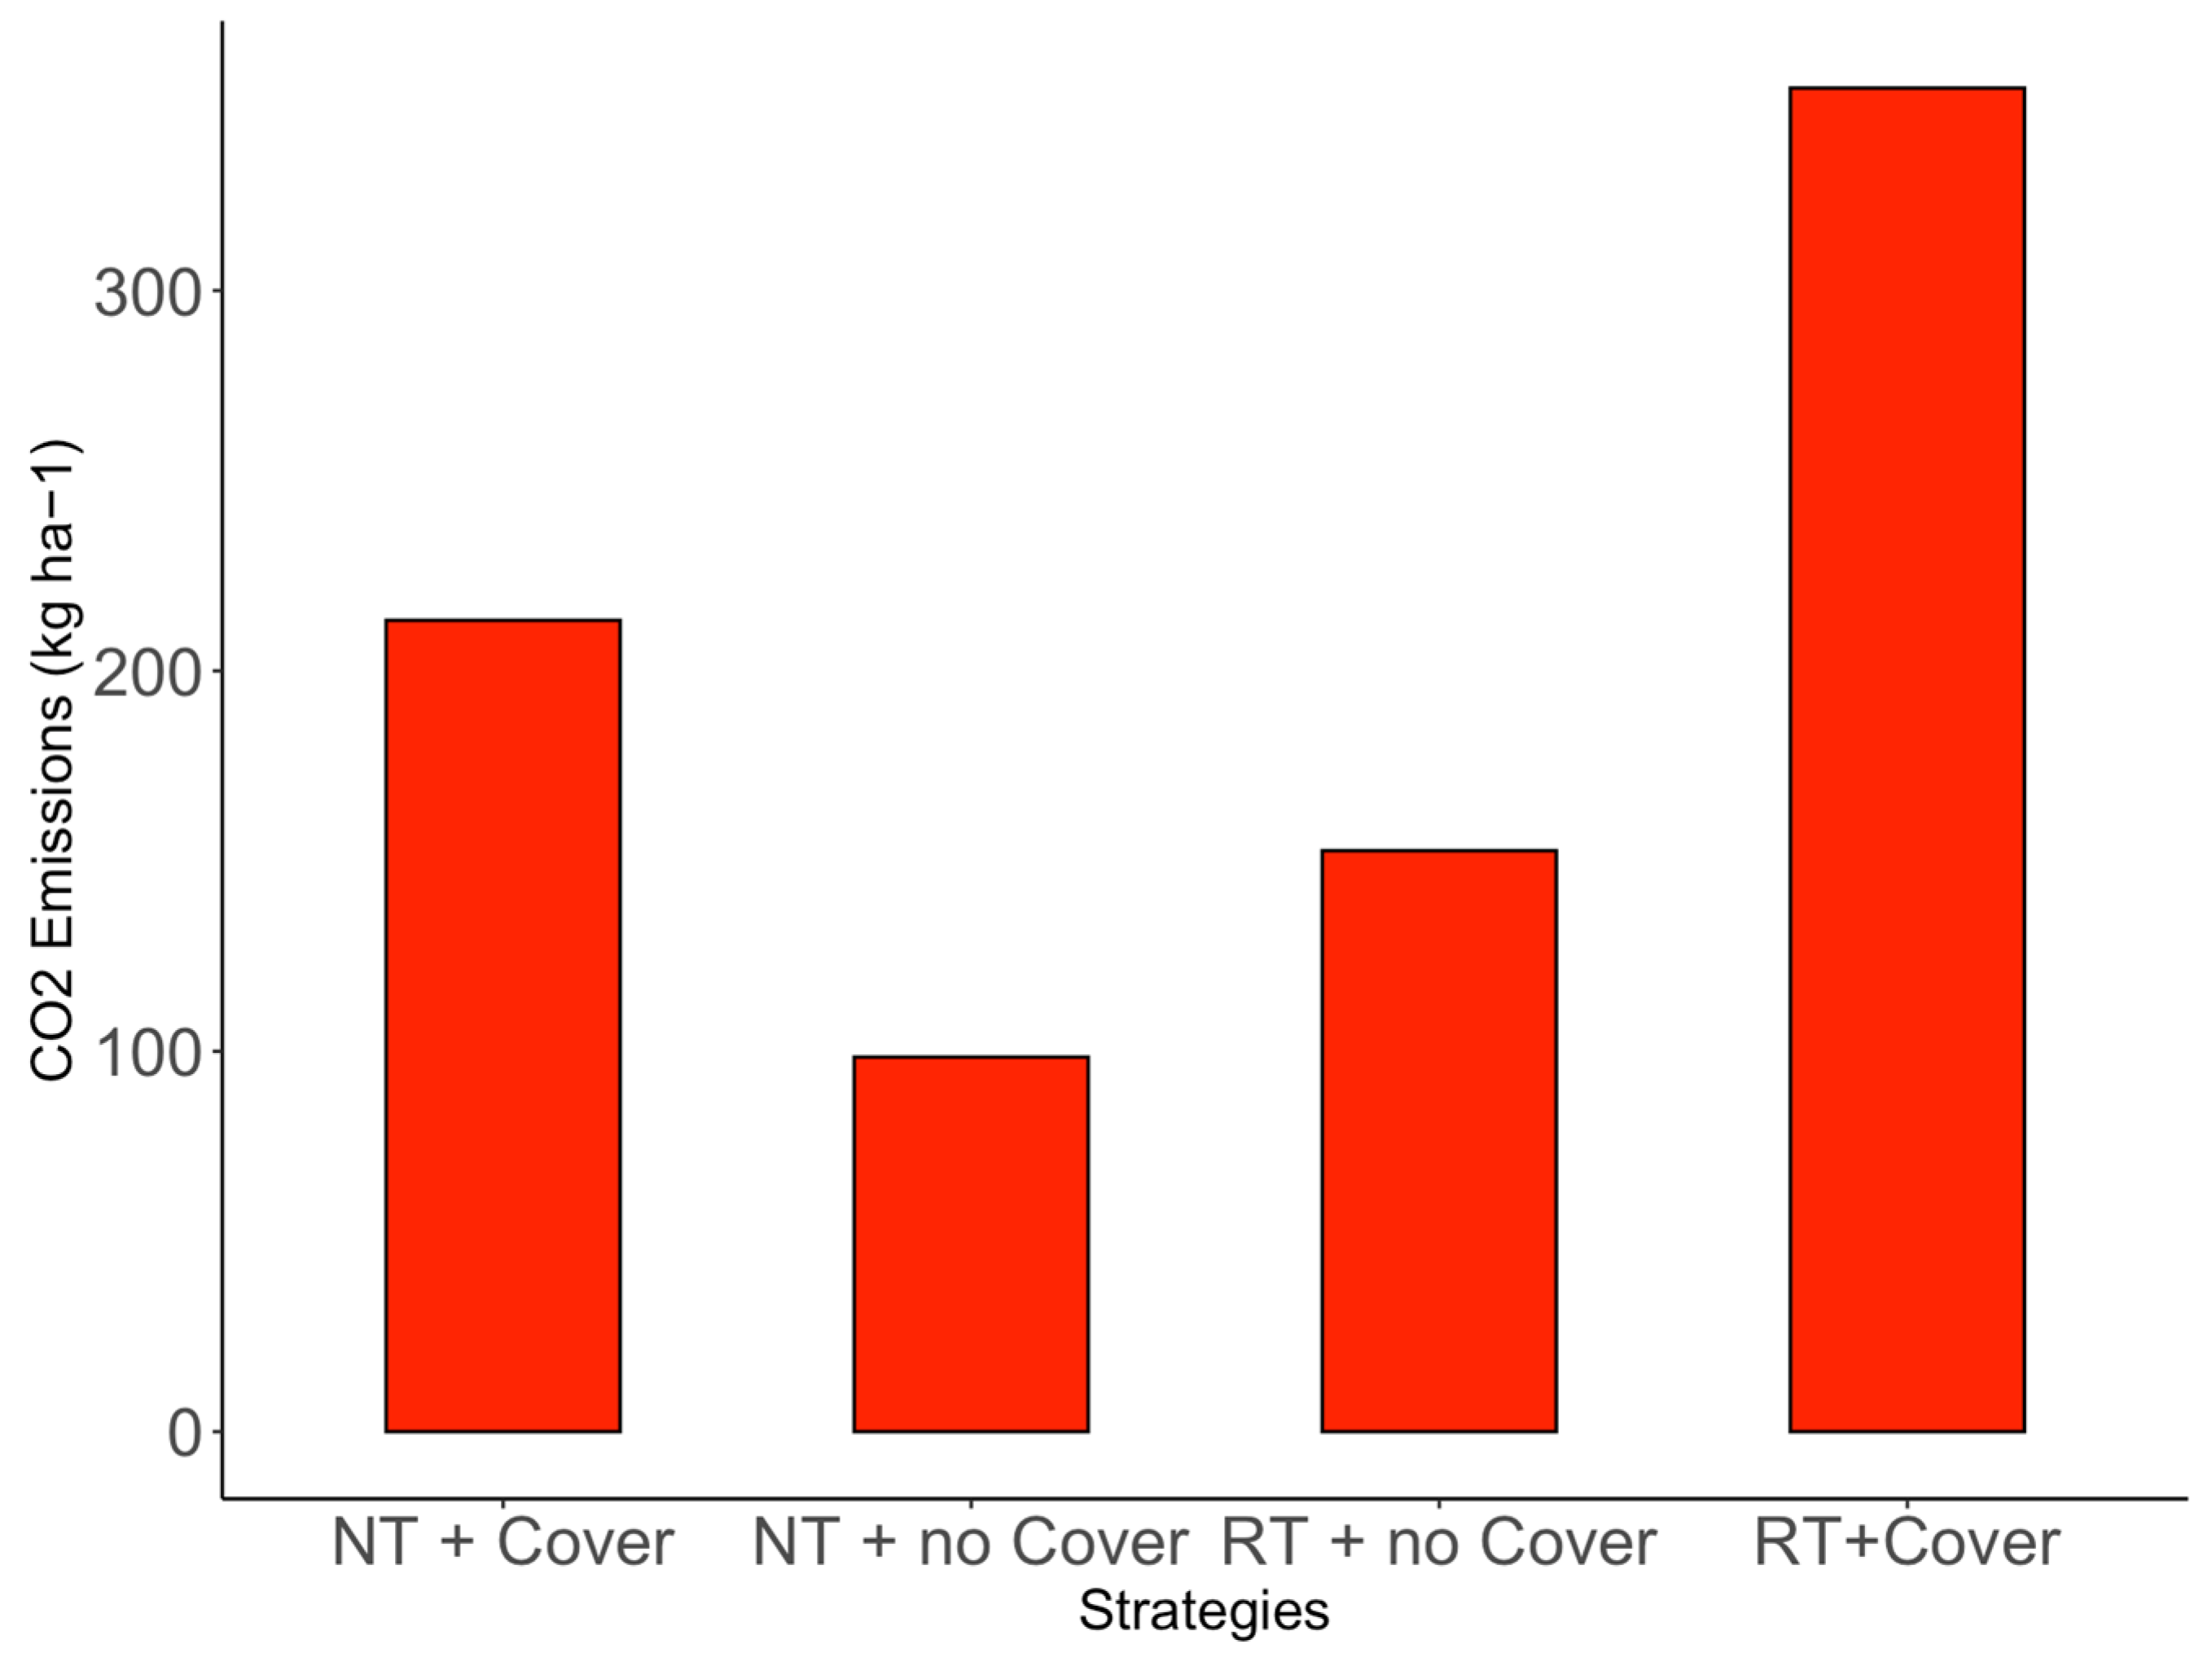
3.3. Technical Itineraries’ CO2 Emissions

The CO2 emissions are reported for the technical itineraries based on reduced or no tillage for each year, each with or without cover crops. As shown in Figure 7, in 2020, the RT itinerary achieved higher values in terms of CO2 emissions than the NT one for the same type of ground cover. The technical itinerary NT with a cover crop produced higher emissions than the RT and NT without the cover crop. The same trend, although with different absolute values, was maintained in 2021 (Figure 8).

4. Discussion

The analysis of the obtained results clearly demonstrated that the tillage system adopted (in 2021) and the type of cover crop (both in 2020 and 2021) significantly influenced economic profitability, as evidenced by the gross salable production (GSP) and gross income (GI).
In the first year of the trial (2020), the GSP and GI results obtained with NT and RT were positive and did not differ. Moreover, according to Delate et al. [16], even if the initial production costs may increase as a consequence of factors like seed purchases and cover crop management, conservative agriculture practices adoption benefits (i.e., increasing the soil content of organic matter, reducing reliance on external inputs, enhanced soil health in general) that can contribute to improving economic outcomes over the time.
Gagliardi et al. [28], in a trial conducted as part of the same research project (MEORBICO), observed lower yields and gross income for strategies involving conservation practices, such as covering crops, compared to conventional tillage strategies (controls). However, starting in the second year, the results of the conservation strategies had already improved. The lower results for the GSP and GI of NT compared to a more ordinary, even if conservative, management method such as RT could be due to the different types of soil compared to the first year. There is a higher silt content in sandy loam soils than loamy sand soils. Thus, in 2021, reduced tillage could probably have mitigated soil compaction, improved aeration, water infiltration, and nutrient availability, thereby promoting tomato development, yield, and economic performance compared to no-tillage [29].
Regarding the results of the effect of the type of cover on GSP, these agree with [30,31], which supports how cover crops containing legume species (such as clover and Mix in this trial) enrich soil-available N and increase tomato yield and income compared with non-legume or no cover crops. In particular, the lower performance of rye with respect to clover (both in 2020 and 2021) could be related to the high rye C/N ratio (>25), which causes a yield reduction due to decreased nitrogen availability through the process of immobilization [32].
Moreover, considering the economic return perspective, the cumulative advantages in terms of ecosystem services (i.e., biodiversity enhancement, nutrient cycling, and improved water quality) are decidedly relevant [33]. Though not easily quantifiable, these services play a critical role in providing resilience against climate change and improving farm sustainability. The interplay between economic viability and environmental stewardship underlines the necessity for site-specific evaluations of these practices. Understanding local conditions, including soil type and climate, is essential for tailoring conservation practices to maximize both agronomic and environmental outcomes [20]. For example, adopting cover crops may have varying effects based on local conditions [34].
The best overall results achieved in the second year in terms of GSP and GI can be attributed to the soil type. The sandy loam soil, where the trials were conducted in the second year, offers better water and nutrient retention capacity while maintaining good aeration favorable to root development compared to loamy sand soils [35,36]. Thus, it benefited both the cover crops and the tomato plants, which could exert their positive effects more effectively.
Moreover, according to [34], crop yield differences may also be connected to water availability, which was more favorable for tomato production in 2021 than 2020. Specifically, in the second year (2021), more significant rainfall occurred during spring compared to 2020, allowing a more substantial water reserve in the soil during the early period of tomato growth. There was also greater precipitation near harvest time in 2021. Therefore, the pedoclimatic conditions seem to clearly explain the higher values of GSP and GI registered in 2020–2021 with respect to those obtained in 2019–2020.
Furthermore, the difference in the CO2 emission trend over the two years of the trial is probably related to the soil typology and weather conditions. Loamy sand soils in drier conditions can require a higher drawbar pull and, consequently, higher fuel consumption than sandy loam soils [37]. This is particularly noticeable in the fields where the cover crops were sown. In fact, the cover crop incorporation practices of RT itineraries with sown cover crops resulted in significantly higher CO2 emissions than those of the NT itineraries with cover crops (642.73 kg vs. 234.84 kg ha−1) in 2020. Instead, in the second year, this difference decreased (353.23 vs. 213.30 kg ha−1, for RT cover and NT cover, respectively), precisely due to the lower fuel consumption from the cover crop incorporation in RT cover systems. In contrast, NT with sown cover crop values were similar to those obtained in the first year.
Therefore, the results obtained are following Kim et al. [38], which affirmed that the CO2 emissions have a similar fuel consumption trend.
These results obtained regarding the difference between RT and NT were expected, as observed by other authors [39,40]. In the case of RT, three cultivator passes are required for primary tillage and cover crop burying, while in NT, only one pass is needed for primary tillage before sowing cover crops. The subsequent management operations in NT demand lower energy. This contrasts with what is reported in [41], where a possible disadvantage of this technique is highlighted, due to carbon emissions from using LPG for flaming. However, it should also be noted that propane combustion is relatively cleaner than that of other fossil fuels such as diesel [41].

5. Conclusions

This study assessed the economic and environmental effects of various technical itineraries in tomato cultivation based on using reduced or no-tillage practices for managing different types of soil cover and controlling weeds. In the second growing season, no-tillage practices showed lower GSP values than itineraries based on reduced tillage (34,681.03 and 71,891.58 EUR ha−1, respectively), probably due to different soil characteristics and climate trends compared to the first year. This highlights the importance of understanding local conditions to tailor conservation practices effectively. Sowing cover crops, tendentially, improved GSP in both growing seasons compared to cultivation on bare soil (8190.00 and 41,959.89 in 2020 and 2021, respectively), especially with clover and the clover–rye mix in 2020 (25,326.60 and 25,818.97 EUR ha−1, respectively), and clover in 2021 (69,310.18 EUR ha−1), mainly due to the N provided by the legume species. The same trend was observed for GI. Itineraries with sown cover crops exhibited higher CO2 emissions (642.73 and 234.84 in 2020 and 353.23 and 213.30 kg ha−1 in 2021 for RT and NT, respectively) due to the operations required for cover crop management and the chosen technical methods, emphasizing how their choice directly affects environmental outcomes. Nonetheless, it is crucial to consider the environmental benefits of cover crops, including carbon sequestration, enhanced biodiversity, nutrient cycling, and improved water quality. Further studies could focus on the economic and environmental evaluation of these systems in the same pedoclimatic conditions but over the long term, quantifying the various environmental benefits of cover crops.

Author Contributions

Conceptualization, A.P., C.F. and M.F.; methodology, A.P. and C.F.; software, S.M.L. and L.G.; validation, M.R., D.F. and A.P.; formal analysis, S.M.L. and L.G.; investigation, C.F., S.M.L. and L.G.; resources, A.P. and C.F.; data curation, C.F., S.M.L. and L.G.; writing—original draft preparation, L.G. and S.M.L.; writing—review and editing, A.P., C.F. and D.F.; visualization, M.R. and M.F.; supervision, C.F. and A.P.; project administration, A.P. and C.F.; funding acquisition, A.P. All authors have read and agreed to the published version of the manuscript.

Funding

This research was funded by the Italian Ministry of Agricultural, Food, and Forestry Policies (MiPAAF) under the project MEORBICO (MEccanizzazione dell’ ORticoltura BIologica e COnservativa), DM 89238, 19 December 2019.

Data Availability Statement

Data are contained within this paper.

Acknowledgments

The authors acknowledge all the CiRAA staff involved in the field management. In particular, thanks to Alessandro Pannocchia, Giovanni Melai, and Marco Della Croce. A special thanks to Marco Ginanni, who helped design the trial and the water irrigation plant. We also acknowledge Massimo Sbrana, Michel Pirchio, Nicolò Pignotti, and Alessandro Beninati for their precious help during field activities.

Conflicts of Interest

The authors declare no conflicts of interest.

References

  1. El Bilali, H. Transition Heuristic Frameworks in Research on Agro-Food Sustainability Transitions. Environ. Dev. Sustain. 2020, 22, 1693–1728. [Google Scholar] [CrossRef]
  2. Liu, X.; Chen, Y.; Liu, Y.; Wang, S.; Jin, J.; Zhao, Y.; Yu, D. A Framework Combining CENTURY Modeling and Chronosequences Sampling to Estimate Soil Organic Carbon Stock in an Agricultural Region with Large Land Use Change. Agronomy 2023, 13, 1055. [Google Scholar] [CrossRef]
  3. IPCC Longer Report. In Climate Change 2023: Synthesis Report; IPCC: Geneva, Switzerland, 2023.
  4. Wang, X.; Zheng, Z.; Jia, W.; Tai, K.; Xu, Y.; He, Y. Response Mechanism and Evolution Trend of Carbon Effect in the Farmland Ecosystem of the Middle and Lower Reaches of the Yangtze River. Agronomy 2024, 14, 2354. [Google Scholar] [CrossRef]
  5. Peigné, J.; Ball, B.C.; Roger-Estrade, J.; David, C. Is Conservation Tillage Suitable for Organic Farming? A Review. Soil Use Manag. 2007, 23, 129–144. [Google Scholar] [CrossRef]
  6. Morris, D.R.; Gilbert, R.A.; Reicosky, D.C.; Gesch, R.W. Oxidation Potentials of Soil Organic Matter in Histosols under Different Tillage Methods. Soil Sci. Soc. Am. J. 2004, 68, 817–826. [Google Scholar] [CrossRef]
  7. Sapkota, T.B.; Mazzoncini, M.; Bàrberi, P.; Antichi, D.; Silvestri, N. Fifteen Years of No till Increase Soil Organic Matter, Microbial Biomass and Arthropod Diversity in Cover Crop-Based Arable Cropping Systems. Agron. Sustain. Dev. 2012, 32, 853–863. [Google Scholar] [CrossRef]
  8. Holland, J.M. The Environmental Consequences of Adopting Conservation Tillage in Europe: Reviewing the Evidence. Agric. Ecosyst. Environ. 2004, 103, 1–25. [Google Scholar] [CrossRef]
  9. Akbarnia, A.; Farhani, F. Study of Fuel Consumption in Three Tillage Methods. Res. Agric. Eng. 2014, 60, 142–147. [Google Scholar] [CrossRef]
  10. Diacono, M.; Ciaccia, C.; Canali, S.; Fiore, A.; Montemurro, F. Assessment of Agro-Ecological Service Crop Managements Combined with Organic Fertilisation Strategies in Organic Melon Crop. Ital. J. Agron. 2018, 13, 172–182. [Google Scholar] [CrossRef]
  11. USDA Cover Crops for Climate Resilience. Available online: https://www.climatehubs.usda.gov/hubs/international/topic/cover-crops-climate-resilience#:~:text=Cover%20crops%20can%3A,and%20mitigate%20some%20greenhouse%20gases (accessed on 10 October 2024).
  12. Martin, G.A.; Sahoo, C. Cover Crops and Green Manure Crops. In Sustainable Crop; Panotra, N., Salgotra, R.K., Sharma, M., Gupta, V., Eds.; ND Global Publication: Delhi, India, 2024. [Google Scholar]
  13. Riemens, M.; Sønderskov, M.; Moonen, A.-C.; Storkey, J.; Kudsk, P. An Integrated Weed Management Framework: A Pan-European Perspective. Eur. J. Agron. 2022, 133, 126443. [Google Scholar] [CrossRef]
  14. Kornecki, T.S.; Kichler, C.M. Effectiveness of Cover Crop Termination Methods on No-Till Cantaloupe. Agriculture 2022, 12, 66. [Google Scholar] [CrossRef]
  15. Frasconi, C.; Martelloni, L.; Antichi, D.; Raffaelli, M.; Fontanelli, M.; Peruzzi, A.; Benincasa, P.; Tosti, G. Combining Roller Crimpers and Flaming for the Termination of Cover Crops in Herbicide-Free No-till Cropping Systems. PLoS ONE 2019, 14, e0211573. [Google Scholar] [CrossRef]
  16. Delate, K.; Cwach, D.; Chase, C. Organic No-Tillage System Effects on Soybean, Corn and Irrigated Tomato Production and Economic Performance in Iowa, USA. Renew. Agric. Food Syst. 2012, 27, 49–59. [Google Scholar] [CrossRef]
  17. Pearsons, K.A.; Chase, C.; Omondi, E.C.; Zinati, G.; Smith, A.; Rui, Y. Reducing Tillage Does Not Affect the Long-Term Profitability of Organic or Conventional Field Crop Systems. Front. Sustain. Food Syst. 2023, 6, 1004256. [Google Scholar] [CrossRef]
  18. O’Reilly, K.A.; Lauzon, J.D.; Vyn, R.J.; Van Eerd, L.L. Nitrogen Cycling, Profit Margins and Sweet Corn Yield under Fall Cover Crop Systems. Can. J. Soil. Sci. 2012, 92, 353–365. [Google Scholar] [CrossRef]
  19. Ding, G.; Liu, X.; Herbert, S.; Novak, J.; Amarasiriwardena, D.; Xing, B. Effect of Cover Crop Management on Soil Organic Matter. Geoderma 2006, 130, 229–239. [Google Scholar] [CrossRef]
  20. Severini, S.; Castellari, M.; Cavalli, D.; Pecetti, L. Economic Sustainability and Riskiness of Cover Crop Adoption for Organic Production of Corn and Soybean in Northern Italy. Agronomy 2021, 11, 766. [Google Scholar] [CrossRef]
  21. Belfry, K.D.; Trueman, C.; Vyn, R.J.; Loewen, S.A.; Van Eerd, L.L. Winter Cover Crops on Processing Tomato Yield, Quality, Pest Pressure, Nitrogen Availability, and Profit Margins. PLoS ONE 2017, 12, e0180500. [Google Scholar] [CrossRef]
  22. Abou Chehade, L.; Antichi, D.; Frasconi, C.; Sbrana, M.; Tramacere, L.G.; Mazzoncini, M.; Peruzzi, A. Legume Cover Crop Alleviates the Negative Impact of No-Till on Tomato Productivity in a Mediterranean Organic Cropping System. Agronomy 2023, 13, 2027. [Google Scholar] [CrossRef]
  23. Council Regulation (EC) No 834/2007 of 28 June 2007 on Organic Production and Labelling of Organic Products and Repealing Regulation (EEC) No 2092/91. Available online: https://eur-lex.europa.eu/legal-content/EN/TXT/HTML/?uri=CELEX:32007R0834 (accessed on 2 October 2024).
  24. Frasconi, C.; Martelloni, L.; Raffaelli, M.; Fontanelli, M.; Abou Chehade, L.; Peruzzi, A.; Antichi, D. A Field Vegetable Transplanter for Use in Both Tilled and No-Till Soils. Trans. ASABE 2019, 62, 593–602. [Google Scholar] [CrossRef]
  25. ISMEA ISMEA Mercati. Available online: https://www.ismeamercati.it/flex/cm/pages/ServeBLOB.php/L/IT/IDPagina/1881 (accessed on 11 September 2024).
  26. ENEA Potere Calorifico. Available online: https://www.efficienzaenergetica.enea.it/glossario-efficienza-energetica/lettera-p/potere-calorifico.html (accessed on 30 September 2024).
  27. European Commission COMMISSION DELEGATED REGULATION (EU) 2023/1185 of 10 February 2023. Supplementing Directive (EU) 2018/2001 of the European Parliament and of the Council by Establishing a Minimum Threshold for Greenhouse Gas Emissions Savings of Recycled Carbon Fuels and by Specifying a Methodology for Assessing Greenhouse Gas Emissions Savings from Renewable Liquid and Gaseous Transport Fuels of Non-Biological Origin and from Recycled Carbon Fuels. Off. J. Eur. Union 2023, L 157, 20–33.
  28. Gagliardi, L.; Sportelli, M.; Fontanelli, M.; Sbrana, M.; Luglio, S.M.; Raffaelli, M.; Peruzzi, A. Effects of Conservation Agriculture Practices on Tomato Yield and Economic Performance. Agronomy 2023, 13, 1704. [Google Scholar] [CrossRef]
  29. Hobbs, P.R. Conservation Agriculture: What Is It and Why Is It Important for Future Sustainable Food Production? J. Agric. Sci. 2007, 145, 127–137. [Google Scholar] [CrossRef]
  30. Sainju, U.M.; Singh, B.P.; Whitehead, W.F. Comparison of the Effects of Cover Crops and Nitrogen Fertilization on Tomato Yield, Root Growth, and Soil Properties. Sci. Hortic. 2001, 91, 201–214. [Google Scholar] [CrossRef]
  31. Dalbianco, A.B.; Santi, A.; Oliveira, R.C.D.; Borges, C.V.; Daniel, D.F.; Trento, D.A.; Dipple, F.L.; Dallacort, R.; Seabra Júnior, S. Can Soil Cover Affect the Performance, Yield, and Quality of Creeping Fresh Market Tomato Hybrids? Horticulturae 2023, 9, 574. [Google Scholar] [CrossRef]
  32. Muchanga, R.A.; Hirata, T.; Uchida, Y.; Hatano, R.; Araki, H. Soil Carbon and Nitrogen and Tomato Yield Response to Cover Crop Management. Agron. J. 2020, 112, 1636–1648. [Google Scholar] [CrossRef]
  33. Du, C.; Li, L.; Effah, Z. Effects of Straw Mulching and Reduced Tillage on Crop Production and Environment: A Review. Water 2022, 14, 2471. [Google Scholar] [CrossRef]
  34. Mallory, E.B.; Posner, J.L.; Baldock, J.O. Performance, Economics, and Adoption of Cover Crops in Wisconsin Cash Grain Rotations: On-Farm Trials. Am. J. Altern. Agric. 1998, 13, 2–11. [Google Scholar] [CrossRef]
  35. Clark, C.A. The Important Role of Soil Texture on Water; University of Wisconsin-Madison, Crops and Soils, Division of Extension: Madison, WI, USA, 2024. [Google Scholar]
  36. Wagner, K.; Cardon, G. Gardening in Sandy Soils. Utah State University. Yard and Garden Extension. 2015. Available online: https://digitalcommons.usu.edu/extension_curall/731/ (accessed on 30 September 2024).
  37. Igoni, A.H.; Ekemube, R.A.; Nkakini, S.O. Tractor Fuel Consumption Dependence on Speed and Height of Ridging on a Sandy Loam Soil. J. Eng. Technol. Res. 2020, 12, 47–54. [Google Scholar]
  38. Kim, W.-S.; Baek, S.-M.; Baek, S.-Y.; Jeon, H.-H.; Siddique, M.A.A.; Kim, T.-J.; Lim, R.-G.; Kim, Y.-J. Evaluation of Exhaust Emissions of Agricultural Tractors Using Portable Emissions Measurement System in Korean Paddy Field. Sci. Rep. 2024, 14, 3491. [Google Scholar] [CrossRef] [PubMed]
  39. Stošić, M.; Ivezić, V.; Tadić, V. Tillage Systems as a Function of Greenhouse Gas (GHG) Emission and Fuel Consumption Mitigation. Environ. Sci. Pollut. Res. 2021, 28, 16492–16503. [Google Scholar] [CrossRef] [PubMed]
  40. Melland, A.R.; Antille, D.L.; Dang, Y.P. Effects of Strategic Tillage on Short-Term Erosion, Nutrient Loss in Runoff and Greenhouse Gas Emissions. Soil Res. 2017, 55, 201. [Google Scholar] [CrossRef]
  41. Datta, A.; Knezevic, S.Z. Chapter Six—Flaming as an Alternative Weed Control Method for Conventional and Organic Agronomic Crop Production Systems: A Review. In Advances in Agronomy; Sparks, D.L., Ed.; Elsevier: Amsterdam, The Netherlands, 2013; Volume 118, pp. 399–428. [Google Scholar]
Figure 1. View of the experimental area.
Applsci 15 01883 g001
Figure 2. Effect of different soil coverage on Gross Salable Production during 2020. Means denoted by different letters are significantly different at p < 0.05 (LSD test). LCL (Lower Confidence Limit) and UCL (Upper Confidence Limit) are reported. C—Clover; Mix—Mixture; NC—No cover crop; R—Rye.
Applsci 15 01883 g002
Figure 3. Effect of different soil coverage on Gross Income during 2020. Means denoted by different letters are significantly different at p < 0.05 (LSD test). LCL (Lower Confidence Limit) and UCL (Upper Confidence Limit) are reported. C—Clover; Mix—Mixture; NC—No cover crop; R—Rye.
Applsci 15 01883 g003
Figure 4. Effect of different soil coverage on gross salable production during 2021. Means denoted by different letters are significantly different at p < 0.05 (LSD test). The LCL (Lower Confidence Limit) and UCL (Upper Confidence Limit) are reported. C—Clover; Mix—Mixture; NC—No cover crop; R—Rye.
Applsci 15 01883 g004
Figure 5. Effect of different soil coverage on Gross Income during 2021. Means denoted by different letters are significantly different at p < 0.05 (LSD test). LCL (Lower Confidence Limit) and UCL (Upper Confidence Limit) are reported. C—Clover; Mix—Mixture; NC—No cover crop; R—Rye.
Applsci 15 01883 g005
Figure 6. Effect of the two tillage technical itineraries (Reduced Tillage—RT and No-Tillage—NT) on Gross Salable Production (GSP) and Gross Income (GI) during 2021. The LCL (Lower Confidence Limit) and UCL (Upper Confidence Limit) are reported.
Applsci 15 01883 g006
Figure 7. Estimation of CO2 emissions for each strategy tested in 2020. NT + Cover—No-Tillage + Cover crop; NT + no Cover—No-Tillage + no Cover crop; RT + Cover—Reduced Tillage + Cover crop; RT + no Cover—Reduced Tillage + no Cover crop.
Applsci 15 01883 g007
Figure 8. Estimation of CO2 emissions for each strategy tested in 2021. NT + Cover—No-Tillage + Cover crop; NT + no Cover—No-Tillage + no Cover crop; RT + Cover—Reduced Tillage + Cover crop; RT + no Cover—Reduced Tillage + no Cover crop.
Applsci 15 01883 g008
Table 1. Technical itinerary’s main aspects.
Reduced-Tillage Management System (RT)No-Till Management System (NT)
Type of cover cropCover crop (Squarrose clover (RT-C); Rye (RT-R); Mixture (RT-Mix); No cover crop (RT-NC) 1Cover crop (Squarrose clover (NT-C); Rye (NT-R); Mixture (NT-Mix); No cover crop (NT-NC) 1
Cover crop managementGreen manureDead mulch
TransplantTransplanting on tilled soilTransplanting on dead mulch
Weed controlPrecision hoeingShredding
Hand weedingHand weeding
1 Regarding the management of NC, both in the RT and NT itineraries, the spontaneous cover was buried with the soil refinement intervention with rotary harrow, carried out after the primary tillage, and conducted, in these cases, at the time at which in the other itineraries green manure or the dead-mulch were obtained.
Table 2. Range values of working speed measured during the trial.
MachinesValues
(km/h)
Combined cultivator 4.82–7.03
Rotary harrow 3.20–4.73
Mulcher4.91–6.57
Roller crimper5.61–8.18
Flaming machine2.43–3.58
Transplanter1.67–2.43
Sprayer3.64–5.31
Precision weeder2.81–4.16
Table 3. Average fuel consumption values, field time, and labor costs per hectare of each itinerary tested.
Fuel Consumption (kg/ha)Field Time (h/ha)Labor Cost (EUR/ha)
2020RT + C202.75146.312926.26
2020RT + noC39.2092.791855.79
2020NT + C52.29143.312866.25
2020NT + noC22.1069.511390.14
2021RT+ C127.67209.624434.94
2021RT + noC29.5974.541490.75
2021NT + C107.16217.934358.59
2021NT + noC31.0669.381387.69
RT + C—Reduced Tillage + Cover crop; RT + noC—Reduced Tillage + no Cover crop; NT + C—No-Tillage + Cover crop; NT + noC—No-Tillage + no Cover crop.
Table 4. Results of three-way ANOVA testing the effects of year, cover crop type, technical itinerary, and their interaction on gross salable production (GSP) and gross income (GI).
SourceGSP GI
Year******
CC******
TI******
CC × YearNSNS
TI × Year******
CC × TINSNS
CC × TI × YearNSNS
CC—Cover crop; TI—Technical itinerary; p < 0.001 “***”; Not Significant “NS”.
Table 5. Results of two-way ANOVA testing the effects of cover crop type, technical itinerary, and their interaction on gross salable production (GSP) and gross income (GI) in 2020.
SourceGSP GI
CC**
TINSNS
CC × TINSNS
CC—Cover crop; TI—Technical itinerary; p < 0.05 “*”; Not Significant “NS”.
Table 6. Results of two-way ANOVA testing the effects of cover crop, technical itinerary, and their interaction on gross salable production (GSP) and gross income (GI) in 2021.
SourceGSP GI
CC****
TI******
CC × TINSNS
CC—Cover crop; TI—Technical itinerary; p < 0.001 “***”; p < 0.01 “**”; NS: Not Significant.
Disclaimer/Publisher’s Note: The statements, opinions and data contained in all publications are solely those of the individual author(s) and contributor(s) and not of MDPI and/or the editor(s). MDPI and/or the editor(s) disclaim responsibility for any injury to people or property resulting from any ideas, methods, instructions or products referred to in the content.

