Abstract
The optimal selection of high-arch dam construction schemes involves multi-dimensional indicators. In addition to clear one-way optimization indicators such as construction period and cost, there are also indicators with ambiguous optimization directions. Such indicators are influenced by factors like actual engineering conditions and experience from similar projects, and they have an optimal interval for their value range, which is referred to as “moderate indicators”. However, in most comprehensive evaluation models, the standardization of such indicators is plagued by overly simplistic processing methods and excessive subjective factors. To address the interval optimality of moderate indicators, this paper proposes the concepts of “optimal interval” and “tolerance interval”. By analyzing the distribution characteristics of indicators and combining them with the characteristics of construction simulation calculations, the quartile method and comprehensive weighting method are adopted to determine the subjective and objective interval ranges. Based on the concept of relative membership degree, these intervals are processed as standardized results and incorporated into the comprehensive evaluation system. Accordingly, a multi-attribute decision-making model for high arch dams considering moderate indicators is proposed. This method was verified in the decision-making process for the construction scheme of the TR Double Curved Arch Dam project. Compared with the traditional Ranking Alternatives by Distance from Average Solution (RADAR) method that adopts the vector normalization method, this model enhances the anti-interference ability against the volatility of moderate indicators, improves the accuracy of scheme optimization, and obtains the priority ranking of each alternative scheme.
1. Introduction
The selection of high-arch dam construction schemes is a multi-objective comprehensive evaluation and decision-making problem involving qualitative and quantitative indicators and fuzzy and uncertain information, as well as multiple factors and dimensions [1,2,3]. In the early days, the determination of construction schemes for large-scale water conservancy projects was generally based on previous engineering experience or experts’ decision-making preferences when selecting from a limited number of schemes. With the development of computer simulation technology, construction parties can obtain a large number of feasible schemes in the project’s early stage and modify relevant parameters according to engineering requirements to obtain full-process simulation information [4]. This brings about the decision-making problem of determining the optimal scheme. Selecting the optimal construction scheme can ensure the efficient use of equipment, materials, and funds; guarantee the construction period and quality; and improve the technical and economic benefits of water conservancy and hydropower projects [5,6]. However, the high-arch dam construction system is a complex system affected by multiple factors in time and space, with strong dynamics. The construction and comparison of construction schemes in design and decision-making must comprehensively consider various boundary conditions and engineering operation characteristics [7,8]. As a complex framework for comprehensively ranking the evaluated objects based on objective reality and subjective needs, the comprehensive evaluation system provides strong support for the comparison and selection of multiple schemes in water conservancy and hydropower projects [9,10]. Among them, the comprehensive evaluation index is one of the most important elements in the comprehensive evaluation system, and the accuracy of its standardization directly affects the accuracy of the system [11,12].
Ekhtiari, M. et al. proposed an integrated decision-making approach combining an interval group decision-making trial and evaluation laboratory (IGDEMATEL), nadir compromise programming (NCP), and stochastic programming, which considers sustainability and technical indicators to optimize dam site selection under certainty, uncertainty, and hybrid conditions, and was verified in its effectiveness through a case study in Iran’s Hamun-e Hirmand basin [13]. Song Z. et al. proposed a Decision-Making Framework (DMF) enhanced by Mutual Inspection (MI), which integrates Monte Carlo Simulation (MCS) for diversion risk assessment and multiple Multi-Attribute Decision-Making (MADM) methods (e.g., TOPSIS and ELECTRE I) to select the optimal first-stage dam construction diversion scheme by considering factors such as diversion risk, costs, social attitudes and duration [14]. Liu, D. et al. proposed a multi-attribute group decision-making method integrating regret theory, negotiation gathering theory, and Monte Carlo Simulation to effectively solve the selection problem of construction diversion schemes for hydropower projects, which was verified as reliable through its application in the Jinping I Hydropower Station [5]. Seyed Ali Jozi et al. conducted an environmental risk assessment for the under-construction Balarood Dam in Iran using the Delphi method to identify risk-generating factors, prioritized them via the AHP (Analytic Hierarchy Process) and TOPSIS (Technique for Order Preference by Similarity to Ideal Solution) methods, and proposed an integration method combining Mean-Rank, Borda, and Copeland to unify conflicting results, ultimately identifying cut and fill, explosion, and drilling as the key risks [15]. Iván Zamarrón-Mieza et al. conducted a systematic review on the application of Multi-Criteria Decision Analysis (MCDA) in dam management from 1992 to 2015, focusing on its application scenarios, related techniques, and trends in the operational phase of aging dams. They found that the AHP was the most widely used technique among single methods and hybridization and fuzzification were the main development trends, and proposed that the combination of the Analytic Network Process (ANP) and Benefit–Opportunity–Cost–Risk (BOCR) analysis could be a research direction for future aging dam management [16].
Two conclusions can be drawn from the extensive studies mentioned above: first, multi-attribute decision-making methods have been widely applied in the field of water conservancy and hydropower engineering, covering various aspects such as dam site selection decision-making, diversion risk analysis in the early construction stage, construction decision-making, and operation and maintenance in the later construction stage. Second, many of the above research cases focus more on the current field knowledge and develop multi-attribute decision-making methods that are more suitable for this field, while neglecting the basic step of constructing a multi-attribute decision-making model, namely the in-depth exploration of evaluation indicators. Particularly after the qualitative classification of indicators, the standardization of moderate-type indicators generally combines the standardization methods of the other two types of indicators, resulting in problems such as an overly simplified quantification process, a lack of dynamic adjustment capabilities, and insufficient consideration of the integration of subjectivity and objectivity. Based on the above two conclusions, this paper focuses on the handling of evaluation indicators, which is of great research value when applied in the field of water conservancy and hydropower engineering. Moreover, it can improve the accuracy and rationality of the multi-attribute comprehensive evaluation system to a certain extent. The specific research contents are as follows:
This paper sorts the types of indicators in the comprehensive evaluation system and conducts standardized quantification for different indicator types; at the same time, considering the interval characteristics of moderate-type indicators, it uses the quartile method and weight assignment method to divide intervals, and proposes the concepts of “optimal interval” and “tolerance interval”. Focusing on the membership relationship between actual engineering indicators and the optimal interval as well as the tolerance interval, this paper constructs an improved multi-attribute decision-making model for indicator quantification based on the quantification of relative membership degree. This model enhances the accuracy of the multi-attribute decision-making model and can, to a certain extent, reduce engineering losses and improve engineering efficiency.
2. Decision Indicators for High-Arch Dam Pouring Schemes
There are a large number of indicators in the decision-making of high-arch dam construction schemes, which can generally be divided into qualitative and quantitative categories according to their nature [17]. Among quantitative indicators, according to the optimization direction, they can be divided into cost-type indicators, benefit-type indicators, and interval-type indicators with unclear optimization directions, which are referred to as moderate indicators in this paper. In practical engineering, these three categories of indicators are interspersed in various aspects such as scheme decision-making, economic optimization, and environmental protection. Among these, due to the uncertainty of moderate indicators, their engineering significance is the most complex.
Cost-type indicators [18], also known as minimum-type indicators, are expected to be as small as possible in engineering projects to achieve greater engineering benefits, such as the construction period, unevenness of cable crane pouring operations, and input cost. Benefit-type indicators [19], also known as maximum-type indicators, are expected to be as large as possible in engineering projects, such as the average monthly lifting height and monthly output value. Moderate indicators differ from the previous two types, which have one-way optimality. Their optimality is reflected in a certain interval range, and the indicator values should not be too large or too small, but should be moderate. In actual projects, such indicators often account for the largest proportion, such as pouring intensity, cable crane utilization rate, and number of pouring bins.
Taking the cable crane utilization rate as an example, unlike in simple small-scale engineering projects, a higher cable crane utilization rate in large-scale projects reflects a higher degree of mechanical utilization, indicating high current construction intensity and helping to shorten the construction period to a certain extent. In large-scale water conservancy and hydropower projects, cable cranes are responsible for multiple tasks. They not only need to hoist and transport concrete, but also convey construction machinery and materials, and perform tasks such as defect elimination. Additionally, they require necessary maintenance time. In the construction design scheme, an excessively high utilization rate of cable cranes for concrete pouring means a lack of time margin to deal with other businesses, resulting in a decrease in the feasibility of the cable crane operation scheme; a too low utilization rate leads to insufficient use of cable cranes, slow construction, and a delayed construction period. The multi-attribute decision-making index system for high-arch dam construction schemes is shown in Figure 1.
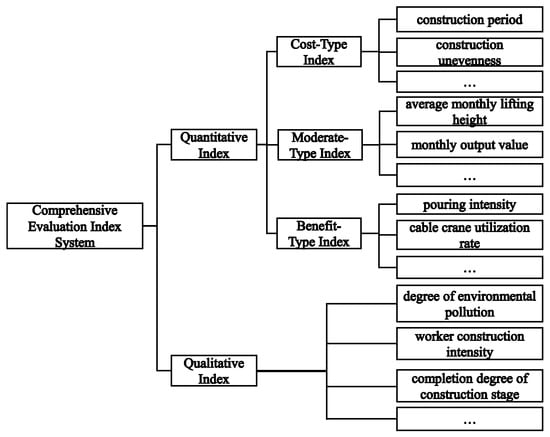
Figure 1.
Comprehensive evaluation index system for high-arch dam construction schemes.
3. Moderate Decision Indicators Processing
The fundamental reason why moderate indicators are difficult to handle is that they have no definite optimization direction, only a “moderate interval”. Therefore, when processing indicators, it is necessary to first clarify the optimization interval range of the indicator values.
The interval division of moderate indicators is affected by the overall distribution of the data source itself; that is, the interval where “most” data are concentrated can reflect the optimal trend of the indicator to a certain extent. Therefore, the meanings of three types of intervals are defined: “optimal interval” means that if the indicator value falls within this interval, it can be considered optimal, meeting better engineering benefits; “tolerance interval” means that if the indicator value falls within this interval, it can produce certain engineering benefits, but the engineering benefits will gradually decrease when approaching the interval boundary. It should be noted that in mathematical terms, the optimal interval must be a subinterval of the tolerance interval. Therefore, in engineering calculations, the optimal interval needs to be excluded, and the remaining intervals are uniformly defined as “invalid intervals”, indicating that indicator values falling within these intervals are not conducive to the optimization of the engineering scheme.
3.1. Data Distribution of Moderate Indicators
Common numerical distribution types include a normal distribution [13], uniform distribution [20], skewed distribution [21], and other types. The selection of multiple schemes can be regarded as multiple repeated experiments. Therefore, we focus on the central position of the data, the degree of dispersion of the distribution, and the symmetry of the distribution. Generally, the skewness coefficient SK and the coefficient of variation CV are calculated to judge, and their calculation formulas are shown in Formulas (1) and (2).
where m represents the number of schemes; represents the sample of moderate indicators; is the mean value of the indicators; and s is the standard deviation of the indicator samples.
When SK = 0, the indicator conforms to the normal distribution; when SK > 0, the data exhibits a right skew; when SK < 0, the data exhibits a left skew. When CV < 15%, it can be considered that the data fluctuation is small and the distribution is relatively scattered, and it can be considered to conform to the uniform distribution.
Generally, multiple construction simulation calculations can be regarded as multiple independent repeated experiments [22,23]. The simulation calculation of the previous scheme will not affect the result of the next scheme, and each indicator is independent and has the same distribution. However, when formulating construction schemes manually, decision-makers continuously learn and adjust appropriate construction parameters. This causes the indicator values to fluctuate significantly initially and then concentrate near a certain value, exhibiting an obvious local concentration trend. In other words, there is a certain correlation between various schemes, as shown in Figure 2. This paper mainly conducts multi-attribute decision-making and selection from the perspective of high-arch dam construction simulation calculation, so the following discusses the interval division of moderate indicators in line with the characteristics of uniform distribution.
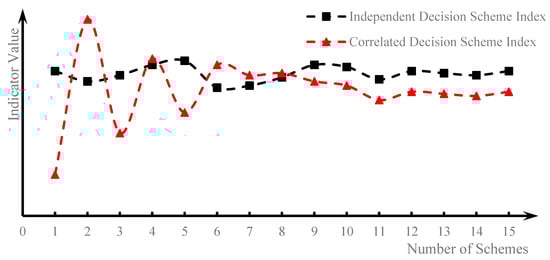
Figure 2.
Distribution characteristics of index values for different scheme types.
3.2. Interval Division of Moderate Indicators
It is not sufficient to divide the optimal and tolerance intervals solely based on data distribution characteristics. To avoid the final quantification error caused by source data inaccuracies, it is also necessary to correct deviations through subjective judgment. This judgment is based on the combination of decision-makers’ preferences and experience of similar projects, which can improve the accuracy of interval division to a certain extent. Therefore, the determination of the interval range is a process combining subjectivity and objectivity.
When the moderate indicator conforms to the uniform distribution, the quartile method can be used to calculate the objective optimal interval and objective tolerance interval through the objective structure of the data. The quartile method is shown in Formulas (3) and (4).
where are the first, second, and third quartiles, respectively. The scheme indicator values are arranged in ascending (descending) order, located at the 25%, 50%, and 75% positions of the ordered array, respectively; IQR is the interquartile range, which is equal to and reflects the central concentrated area of the data; is the interval coefficient, which can be set to 0.3. The interval coefficient can be reduced or increased to adapt to more strict or looser problem scenarios.
The subjective optimal interval and tolerance interval can be obtained through engineering case records, expert experience, and construction simulation calculations. Thus, the subjective optimal and tolerance intervals based on decision-makers’ experience and the objective optimal and tolerance intervals based on objective data are initially obtained. The weighted comprehensive method is adopted to combine the two. The comprehensive method, taking the lower limit of the optimal interval a as an example, is shown in Formula (5).
where is the subjective weight. A larger value indicates more trust in subjective judgment, which can be taken as 0.7. The solution methods for other interval boundaries are similar to Formula (5) and will not be repeated.
4. Scheme Evaluation Framework Based on Relative Membership Degree
4.1. Index Standardization Processing
The general model of multi-attribute decision-making problems can be described as follows: there are m schemes , each with n decision indicators [24]. The decision attributes are expressed as , and the multi-attribute decision matrix can be expressed as shown in Formula (6).
As mentioned above, the indicators include three types, and there are issues such as different dimensions and different optimization directions between various indicators, which makes it difficult to directly compare them [25]. Therefore, when constructing the decision model, it is necessary to eliminate the impacts of the above factors on the decision results and standardize the indicators, generally mapping each indicator value to the range [0, 1].
Due to the clear quantification directions of cost-type indicators and benefit-type indicators, which are universally recognized in calculation, the Range Method [26] or vector normalization method [27] can generally be adopted for their processing. Geometrically, vector normalization treats each data point as a vector and then normalizes its magnitude to 1. It can effectively reflect the relative distance between a scheme and the ideal solution in multi-attribute decision-making. However, its meaning is less intuitive than that of the extreme value method, and it is mostly used in specific multi-objective decision-making models such as TOPSIS. This paper adopts the latter to standardize the maximum-type and minimum-type indicators. For more vague moderate indicators, quantification can be carried out through the membership degree of the indicator value to the interval range, that is, the relative membership degree [28].
Membership degree is the core concept that describes the degree to which an element belongs to a specific fuzzy set. It breaks through the “either-or” binary division in classical set theory and allows elements to belong to a specific set to varying degrees. The value range of the membership degree is [0, 1]. There are typical problem characteristics in actual engineering, so a more objective function construction method is adopted to solve the membership degree as a result of standardization. The common membership functions include the triangular membership function [29], trapezoidal membership function [30], Gaussian membership function [31], etc. Due to the variability of engineering parameters in high-arch dam projects, this paper adopts the trapezoidal membership function to quantify moderate indicators. The quantification of the three types of indicators is shown in Formulas (7)–(9).
- (1)
- Maximum-type indicators.
After processing, for the indicator , but this processing method is nonlinear, with the minimum value not reaching 0 and a maximum value that does not reach 1.
- (2)
- Minimum-type indicators.
When dealing with minimum-type indicators, it is necessary to align the optimization direction (typically, the larger the value, the better). Therefore, when the indicator value is non-zero, its reciprocal is often used for transformation.
After processing, for the indicator , the smaller the original value, the closer the standardized value is to 1.
- (3)
- Moderate indicators.
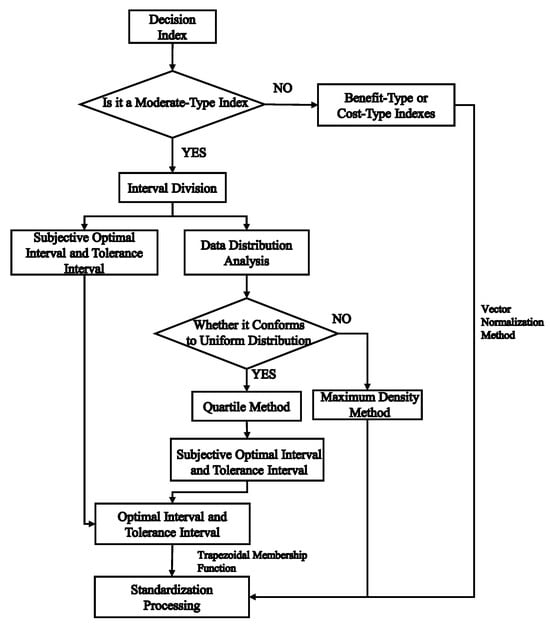
Figure 3.
Flowchart for index processing in the comprehensive evaluation system.
4.2. Multi-Attribute Decision-Making Method Considering Moderate Indicators
Based on the standardized methods for the three types of indicators obtained from the above analysis and the relative membership degree, the TOPSIS method [32] is improved, and the calculation steps of the constructed multi-attribute decision-making method for high-arch dams are as follows:
Step 1: Standardize the three types of indicators through Formulas (6)–(8), and normalize the decision scheme attribute matrix to .
Step 2: Determine the weight matrix and calculate the weighted normalized matrix , where , and is the weight of the j-th indicator, .
Step 3: Determine the positive ideal solution and negative ideal solution. Let the positive ideal solution be , where . Similarly, for the negative ideal solution, , .
Step 4: Define the comprehensive weighted distance between the scheme and the positive ideal solution and negative ideal solution as Formula (10):
where is the Euclidean distance between the scheme and the ideal solution, and is the Euclidean distance between the scheme and the negative ideal solution.
Step 5: Solve the programming problem to minimize , and solve through Formula (11):
Step 6: Arrange the schemes in descending order of the order of superiority and inferiority of the schemes.
5. Case Analysis
The TR arch dam is planned to be built in the southwest region of China and serves as a key hydropower hub project in the cascade development of the Yalong River. This arch dam is characterized by complex geological conditions, a large project scale, high resource consumption, insufficient construction conditions, and an extremely high difficulty of engineering construction. Therefore, it is necessary to use computer simulation technology to analyze the dam’s pouring intensity, lifting speed, and pouring duration. Through a large number of simulation calculations, multiple construction simulation schemes that meet the construction requirements can be obtained; to further screen out the scheme with the optimal engineering benefits, it is also necessary to conduct multi-attribute decision-making analysis on these schemes.
In the early stage of the project construction, initial discussions were held on whether to build a bottom outlet for diversion, the start time of construction, the block height of the dam, and the number of cable cranes. Through computer simulation technology, five schemes were efficiently calculated, and the corresponding parameters are shown in Table 1. The construction of a multi-attribute comprehensive evaluation system can recommend the optimal scheme, which has a very important impact on improving project benefits.

Table 1.
Simulation parameters for TR arch dam construction simulation schemes.
5.1. Multi-Attribute Decision-Making Method Considering Improved Quantification of Moderate-Type Indicators
The selection of comprehensive evaluation indicators should meet the six basic principles of purposefulness, completeness, operability, independence, significance, and dynamics, to ensure that the selected indicator system can comprehensively represent the characteristics of each scheme.
This paper selects the construction period (s1), the monthly peak pouring intensity (s2), the maximum pouring intensity of a single cable crane (s3), the average number of pouring bins (s4), the maximum utilization rate of cable cranes (s5), and the standard deviation of the pouring intensity unevenness coefficient (s6) to construct a comprehensive evaluation system.
The construction period is one of the most important indicators in decision-making, as it directly reflects the overall progress of the project. The maximum pouring intensity indicates whether the production capacity of the current concrete mixing system meets the project’s production requirements. As the primary equipment for dam pouring, the cable crane’s maximum pouring intensity can reflect whether the current cable crane transportation system can match the concrete mixing intensity and pouring intensity. The number of pouring blocks reflects the overall formwork erection status for dam pouring. The cable crane utilization rate reflects the utilization of cable cranes in undertaking concrete transportation functions. The standard deviation of the pouring intensity non-uniformity coefficient reflects the non-uniformity of the entire project pouring process; a larger value indicates greater monthly pouring fluctuations, which is not conducive to the full utilization of resources. The calculation formulas for the standard deviation of monthly pouring intensity are shown in Formulas (12) and (13).
where represents the monthly pouring intensity non-uniformity coefficient; represents the pouring intensity in the i-th month; represents the total pouring volume; n represents the total number of construction months; and and respectively represent the calendar days and effective construction days in the i-th month.
The monthly pouring intensity is presented in Figure 4, with the pouring data of Scheme 1 taken as an example
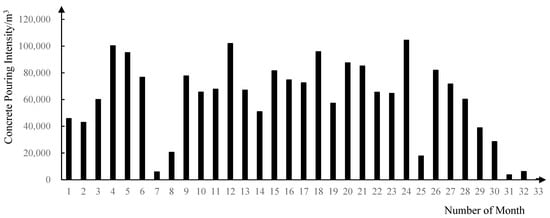
Figure 4.
Monthly concrete pouring intensity chart.
The initial decision matrix for the scheme attributes is presented in Table 2.
Table 2.
Initial decision matrix and index information of TR arch dam.
The tolerance intervals and optimal intervals of the moderate indicators (s2, s3, s4, s5) in the above table are divided using the previous formulas, and the tolerance interval coefficient in the formula is 0.5, the subjective weight = 0.65, and the interval division is shown in Table 3 and Table 4.
Table 3.
Subjective and objective boundaries of moderate indicators for TR arch dam.
Table 4.
Optimal and tolerance intervals of moderate indicators for TR arch dam.
The indicators are standardized through Formulas (7)–(9), and the calculation results after assigning weights are shown in Formula (14)
According to Formulas (9) and (10), the relative membership degrees of each scheme are calculated as u1 = 0.875, u2 = 0.342, u3 = 0.725, u4 = 0.849, u5 = 0.072, u6 = 0.812, and the comprehensive ranking result of the schemes is . Therefore, it is recommended to adopt Scheme 1, which involves no bottom outlets, starts construction on 1 April of the fifth Construction Year, has a lifting height of 4.5 m (with a lifting height of 3.0 m in the foundation constraint zone), uses three cable cranes, and has a secondary cooling time of 135 days.
5.2. RADAR Multi-Attribute Decision-Making Method Based on Vector Normalization
In this paper, the RADAR method based on vector normalization is introduced to construct a decision-making model, so as to verify the advancement of the method proposed in this paper, and the proposed method is applied in practical engineering. To avoid interference from other factors, the initial values of decision indicators and indicator weights are kept unchanged. The general steps of the RADAR decision-making method based on vector normalization are introduced as follows:
Step 1. The unified quantification direction is set to “the larger the better”; therefore, cost-type indicators require special handling. Cost-type indicators are converted into benefit-type data using the formula “maximum value minus original value”, as shown in Formula (15).
In the formula, represents the initial value of the decision indicator after unifying the quantification direction, and the meanings of the other variables are the same as those mentioned above.
Calculate the modulus of the converted data of all schemes under this indicator, as shown in Formula (16).
where denotes the data modulus of the j-th indicator. The standardized result is obtained by dividing the converted data by the modulus, which is expressed as .
Step 2. Standardization of moderate-type indicators: Subjectively determine an optimal value for the indicator . Typically, this optimal value is the median or mean. First, calculate the deviation of each scheme from the optimal value, and then convert it into inverse data where “the smaller the deviation, the larger the value”, as shown in Formula (17).
where represents the absolute deviation of the j-th indicator from the optimal value, and denotes the maximum deviation of the j-th indicator from the optimal value.
The subsequent standardization process is consistent with Step 1 and will not be repeated here.
Step 3. Calculate the weighted normalized matrix. , where , and is the weight of the j-th indicator, .
Step 4. Calculate the ranking index and sum the weighted values of all indicators for each scheme to obtain the ranking index, as shown in Equation (18).
Step 5. Sort the ranking indices in descending order; a larger ranking index indicates a better comprehensive performance of the scheme under multiple indicators, and the scheme ranked first is the optimal recommended scheme.
In this case, the optimal values of the moderate-type indicators are determined based on subjective judgment. , , , . The normalized matrix calculated is shown in Formula (19).
Calculate the weighted matrix .
The ranking indices are calculated. , , , , , . The priority ranking of the schemes is obtained as follows: . Under this method, Scheme 4 is recommended for consideration: it adopts a bottom outlet dam type, with construction scheduled to start on 1 April in the fifth year of the construction period. The lifting height is 3.0 m, the total duration of the second-phase cooling is 120 days, and three cable cranes will be put into production.
6. Discussion
Both multi-attribute decision-making models successfully identified optimal solutions within their respective frameworks, but their practical performance and theoretical robustness differ significantly. The comparative model, despite passing initial rationality checks, exhibited critical limitations in real-world engineering applications—specifically, slow construction progress and inefficient utilization of engineering resources. This shortcoming can be traced to its failure to account for the dynamic fluctuations of moderate-type indicators; it treated such indicators as static values, leading to a disconnect between the derived scheme and on-site realities, such as mismatched resource allocation with project phases and delayed responses to unexpected changes in construction conditions. In contrast, the model proposed in this study, integrated with the improved standardization method for moderate-type indicators, fully accounts for the volatility of such indicators in practical scenarios—for example, adjusting for subtle variations in material supply cycles or environmental factors that affect the performance of moderate-type indicators—and proactively incorporates the potential for future engineering development, such as reserving flexibility for subsequent process optimizations. This not only enhances the accuracy of decision-making results by reducing deviations between theoretical calculations and actual operations but also ensures better alignment with on-site construction needs, effectively avoiding bottlenecks in progress and resource waste.
From the perspective of comprehensive verification that combines theoretical analysis and engineering practice, the decision-making scheme derived from the model in this study (Scheme 1: no bottom outlets; construction commencing on April 1st of the fifth Construction Year; a lifting height of 4.5 m with a foundation constraint zone of 3.0 m; adoption of three cable cranes; and a secondary cooling period of 135 days) features simpler construction procedures, as there is no need to consider the installation of diversion bottom outlets in the early and middle stages of the project. This simplicity facilitates construction organization and management. Additionally, the dam adopts a high lifting height, resulting in more compact overall concrete placement and a reduced number of formworks used—this lowers the labor costs invested in formwork removal and installation. Although the secondary cooling period is slightly extended, the sufficient time allocated for cooling ensures better structural reliability. In summary, the scheme recommended based on the research method of this study demonstrates superior adaptability and practical value, and serves as a more reliable recommended scheme for guiding the subsequent implementation of the project.
7. Conclusions and Prospects
7.1. Conclusions
The selection of high-arch dam construction schemes is affected by many factors, and the indicator attributes of the schemes are complex. It is difficult to select the optimal scheme through subjective screening. The comprehensive evaluation system has become the main technical means for selecting schemes in complex projects. Among them, index quantification and the construction of evaluation models hold significant research value. Starting from the quantification of decision indicators in the high-arch dam construction system, this paper discusses the standardization of moderate indicators with unclear optimization directions and summarizes the research findings into the following conclusions:
- (1)
- The engineering significance of moderate indicators is systematically defined. Aiming at their interval optimality, the definitions of “optimal interval”, “tolerance interval”, and “invalid interval” are proposed. The moderate indicators are intervalized, and the concept of relative membership degree is matched with the standardized results, yielding more accurate standardized results.
- (2)
- A multi-attribute decision-making model for the selection of high-arch dam pouring schemes considering moderate-type indicators is constructed. The TOPSIS is adopted to determine the ideal optimal (positive ideal) scheme and the worst (negative ideal) scheme, and the relative proximity of each scheme to the positive ideal scheme is calculated. Furthermore, a comparison is made with the traditional standardized multi-attribute decision-making model (the RADAR multi-attribute decision-making model based on vector normalization). Combined with theoretical analysis and practical engineering application, the accuracy of the proposed model is verified, and it exhibits strong adaptability. By performing subjective and objective optimization on moderate-type indicators, the results of the final evaluation model are rendered more reasonable.
- (3)
- The optimization model is applied to the multi-attribute decision-making of the construction simulation schemes for the TR arch dam. Six indicators are taken into account, including dam type, construction start time, dam lifting height, and the number of cable cranes used, among which four are moderate decision indicators. The application of this model verifies the applicability of the optimal selection model.
7.2. Prospects
This study focuses on the core pain points in multi-attribute decision-making for high-arch dam construction schemes, systematically defining the three-dimensional boundaries of “optimal interval–tolerance interval–invalid interval” for moderate indicators. It innovatively addresses the problems of the insufficient integration of subjectivity and objectivity and neglect of interval characteristics in the quantification process of such indicators, and successfully constructs a multi-attribute decision-making model based on relative membership degree, providing a reliable technical framework for the scientific comparison and selection of high-arch dam pouring schemes.
However, due to the complexity of such indicators, there is still room for further research in the future. Machine learning methods (such as Long Short-Term Memory (LSTM) networks, Gradient Boosting Regression Trees (GBRT), and deep learning models driven by attention mechanisms) can be considered for adoption. Based on real-time monitoring data throughout the construction process, these methods can accurately fit the dynamic volatility of moderate indicators, reduce the computational load of recalculations, realize real-time adjustment of schemes in line with construction progress, and solve the problem of poor timeliness of traditional static models.
Furthermore, it is possible to combine the latest fuzzy mathematics theories (such as interval-valued hesitant fuzzy sets, extended forms of Pythagorean fuzzy numbers, and neutrosophic fuzzy theory). Aiming at the particularities of different engineering application scenarios, more comprehensive multi-attribute decision-making models can be constructed to match various engineering application scenarios. At the same time, by integrating subjective requirements such as engineering risk preferences and multi-objective priorities, the models can be accurately adapted to diverse actual engineering scenarios, further expanding the application boundary and promotion value of this research achievement.
Author Contributions
Data provision and writing—original draft, C.Z.; methodology, L.L.; research scheme design and review and editing, Q.L.; collecting the reference materials, L.C. and X.Z. All authors have read and agreed to the published version of the manuscript.
Funding
The work of Chao Zhang, Lei Li, and Quan Liu was supported in part by the Science and Technology Project of China Power Construction Group Chengdu Survey, Design and Research Institute Co., Ltd. (Grant No. P46020; Grant No. P65825).
Institutional Review Board Statement
Not applicable.
Informed Consent Statement
Not applicable.
Data Availability Statement
The original contributions presented in this study are included in the article. Further inquiries can be directed to the corresponding author.
Conflicts of Interest
The authors declare that they have no known competing financial interests or personal relationships that could have appeared to influence the work reported in this paper. Chao Zhang is employee of POWERCHINA Chengdu Engineering Co. Ltd, who provided funding and teachnical support for the work. The funder had no role in the design of the study, in the collection, analysis, or interpretation of data, in the writiing of the manuscript, or in the decision to publish the results.
Abbreviations
The following abbreviations are used in this manuscript:
| TR arch dam | TR Double Curved Arch Dam |
| RADAR | Ranking Alternatives by Distance from Average Solution |
| IGDEMATEL | Interval-Valued Pythagorean Fuzzy Numbers |
| NCP | Nadir Compromise Programming |
| DMF | Decision-Making Framework |
| MCS | Monte Carlo Simulation |
| MADM | Multi-Attribute Decision-Making |
| AHP | Analytic Hierarchy Process |
| TOPSIS | Technique for Order Preference by Similarity to Ideal Solution |
| MCDA | Multi-Criteria Decision Analysis |
| ANP | Analytic Network Process |
| BOCR | Benefit-Opportunity-Cost-Risk |
| SK | Skewness |
| CV | Coefficient of Variation |
| IQR | Interquartile Range |
References
- Liu, R.; Ma, G.; Xie, X.; Kong, F.; Xiong, K.; Wang, X. Uncertainty-Aware Hybrid Surrogate Model-Accelerated Constrained Multi-Objective Design of Arch Dam. Adv. Eng. Inform. 2025, 67, 103552. [Google Scholar] [CrossRef]
- Zhong, G.; Ren, B.; Tong, D. Study on Multi-Scheme Analysis and Evaluation Method for Concrete Sequence Placement of High Arch Dam. Sci. China Technol. Sci. 2011, 54, 47–53. [Google Scholar] [CrossRef]
- Liu, R.; Ma, G.; Kong, F.; Ai, Z.; Xiong, K.; Zhou, W.; Wang, X.; Chang, X. Pareto-Guided Active Learning for Accelerating Surrogate-Assisted Multi-Objective Optimization of Arch Dam Shape. Eng. Struct. 2025, 326, 119541. [Google Scholar] [CrossRef]
- Zhang, G.; Yi, L.; Zhang, L.; Peng, S.; Li, J.; Duan, N. New Development of Dam Construction Technology in China. In Proceedings of the 2018 International Conference on Computer, Communications and Mechatronics Engineering (CCME 2018), Shanghai, China, 22–23 December 2018; Destech Publications, Inc.: Shanghai, China, 2018; Volume 332, pp. 337–344. [Google Scholar]
- Liu, D.; Hu, Z.; Guo, W. Multi-Attribute Group-Decision on a Construction Diversion Scheme for Hydropower Projects Based on Perception Utility. Energies 2018, 11, 3027. [Google Scholar] [CrossRef]
- Huang, J. Research on Optimization of Water Conservancy Project Construction Schedule Control Based on Multi-Objective Genetic Algorithm. In Proceedings of the 2024 International Conference on Power, Electrical Engineering, Electronics and Control, PEEEC, Athens, Greece, 14–16 August 2024; IEEE Computer Society: Athens, Greece, 2024; pp. 1076–1081. [Google Scholar]
- Zhang, C.; Wang, H.; Cao, J.; Liu, Q.; Liu, F.; Wang, M. Type Selection between Arch Dam and Gravity Dam Based on Construction Simulation: A Case Study. Water 2023, 15, 1482. [Google Scholar] [CrossRef]
- Lan, T.; Xing, G.; Qin, G.; Li, Z.; Gao, R. Comparison and Selection of Multiple Construction Schemes for the Large-Span and Heavy-Load Transfer Truss. Buildings 2023, 13, 3056. [Google Scholar] [CrossRef]
- Cao, Z.; Lei, G.; Qiu, L.; Wang, W.; Yin, J.; Wang, H. Evaluation of Economic and Ecological Benefits of Reservoir Ecological Releases Based on Reservoir Optimization Operation. Appl. Sci. 2025, 15, 9441. [Google Scholar] [CrossRef]
- An, H.; Tang, S.; Wang, R. Application of Gray-Fuzzy Comprehensive Evaluation in Duration Risk Forecast of Hydropower Project. In Architecture, Building Materials and Engineering Management, PTS 1–4; Hou, H., Tian, L., Eds.; Trans Tech Publications Ltd.: Jinan, China, 2013; Volume 357–360, pp. 2434–2440. [Google Scholar]
- Ma, C.; Yang, J.; Cheng, L. New Methods and Technologies of Hydraulic Engineering Safety Assessment. Water 2025, 17, 1773. [Google Scholar] [CrossRef]
- Xu, B.; Xia, H.; Yao, Y. Quantitative and Comprehensive Evaluation of Qualitative Indices in Dam Safety Monitoring. In Advanced Measurement and Test, PTS 1–3; Esa, R., Wu, Y.W., Eds.; Trans Tech Publications Ltd.: Nanchang, China, 2011; Volume 301–303, pp. 924–931. [Google Scholar]
- Ekhtiari, M.; Zandieh, M.; Tirkolaee, E.B. Optimizing the Dam Site Selection Problem Considering Sustainability Indicators and Uncertainty: An Integrated Decision-Making Approach. J. Clean Prod. 2023, 428, 139240. [Google Scholar] [CrossRef]
- Song, Z.; Liu, Q.; Hu, Z. Decision-Making Framework, Enhanced by Mutual Inspection for First-Stage Dam Construction Diversion Scheme Selection. Water Resour. Manag. 2020, 34, 563–577. [Google Scholar] [CrossRef]
- Jozi, S.A.; Shoshtary, M.T.; Zadeh, A.R.K. Environmental Risk Assessment of Dams in Construction Phase Using a Multi-Criteria Decision-Making (MCDM) Method. Hum. Ecol. Risk Assess. 2015, 21, 1–16. [Google Scholar] [CrossRef]
- Zamarron-Mieza, I.; Yepes, V.; Maria Moreno-Jimenez, J. A Systematic Review of Application of Multi-Criteria Decision Analysis for Aging-Dam Management. J. Clean Prod. 2017, 147, 217–230. [Google Scholar] [CrossRef]
- Zhou, T.; Niu, X.; Ma, N.; Sun, F.; Gong, S. Deep Learning- and Multi-Point Analysis-Based Systematic Deformation Warning for Arch Dams. Infrastructures 2025, 10, 170. [Google Scholar] [CrossRef]
- Gu, Z.; Wang, Y.; Cao, L. Research on Supplier Selection Model Based on an Improved TOPSIS. In Proceedings of the 2016 International Conference on Advances in Management, Arts and Humanities Science (AMAHS 2016), Taichung, Taiwan, 10–11 December 2016; Kao, J., Sung, W.P., Eds.; Atlantis Press: Taichung, Taiwan, 2016; Volume 63, pp. 146–151. [Google Scholar]
- Berrouet, L.; Villegas-Palacio, C.; Botero, V. Vulnerability of Rural Communities to Change in an Ecosystem Service Provision: Surface Water Supply. A Case Study in the Northern Andes, Colombia. Land Use Policy 2020, 97, 104737. [Google Scholar] [CrossRef]
- Akdogan, Y.; Kus, C.; Asgharzadeh, A.; Kinaci, I.; Sharafi, F. Uniform-Geometric Distribution. J. Stat. Comput. Simul. 2016, 86, 1754–1770. [Google Scholar] [CrossRef]
- Chakraborty, S.; Hazarika, P.J.; Ali, M.M. A Multimodal Skew Laplace Distribution. Pak. J. Stat. 2014, 30, 253–264. [Google Scholar]
- Diakun, J. Calculation procedures—Simulation, optimization and design calculations. Polimery 1999, 44, 390–396. [Google Scholar] [CrossRef]
- Lian, J.J.; Yang, M.; Hu, M.G. The Hydroelastic Simulation and Calculation of High Arch Dam Vibration Induced by Flood Discharge Flow. In Hydraulics of Rivers Water Works and Machinery, Proceedings of the 21st Century: The New Era for Hydraulic Research and Its Applications, Beijing, China, 16–21 September 2001; Li, G., Ed.; Tsinghua University Press: Beijing, China, 2001; Volume II, pp. 902–909. [Google Scholar]
- Yang, A.; Wang, H. Multi-attribute Decision Making Based on Three-parameter Vague Sets. In Proceedings of the 29th Chinese Control Conference, Beijing, China, 28–31 July 2010; Chen, J., Ed.; IEEE: Beijing, China, 2010; pp. 5544–5548. [Google Scholar]
- Lotfi, F.H.; Fallahnejad, R. Imprecise Shannon’s Entropy and Multi Attribute Decision Making. Entropy 2010, 12, 53–62. [Google Scholar] [CrossRef]
- Ertanov, I.D. Expanding the Range of Unified Methods. Lab Delo 1987, 10, 784–786. [Google Scholar]
- Kim, D. Prediction Performance of Support Vector Machines on Input Vector Normalization Methods. Int. J. Comput. Math. 2004, 81, 547–554. [Google Scholar] [CrossRef]
- Fang, Y.; Zheng, X.; Peng, H.; Wang, H.; Xin, J. A New Method of the Relative Membership Degree Calculation in Variable Fuzzy Sets for Water Quality Assessment. Ecol. Indic. 2019, 98, 515–522. [Google Scholar] [CrossRef]
- Pedrycz, W. Why Triangular Membership Functions. Fuzzy Sets Syst. 1994, 64, 21–30. [Google Scholar] [CrossRef]
- Marchant, T. A Measurement-Theoretic Axiomatization of Trapezoidal Membership Functions. IEEE Trans. Fuzzy Syst. 2007, 15, 238–242. [Google Scholar] [CrossRef]
- Feng, S.; Li, H.; Hu, D. A New Training Algorithm for HHFNN Based on Gaussian Membership Function for Approximation. Neurocomputing 2009, 72, 1631–1638. [Google Scholar] [CrossRef]
- Opricovic, S.; Tzeng, G.H. Compromise Solution by MCDM Methods: A Comparative Analysis of VIKOR and TOPSIS. Eur. J. Oper. Res. 2004, 156, 445–455. [Google Scholar] [CrossRef]
Disclaimer/Publisher’s Note: The statements, opinions and data contained in all publications are solely those of the individual author(s) and contributor(s) and not of MDPI and/or the editor(s). MDPI and/or the editor(s) disclaim responsibility for any injury to people or property resulting from any ideas, methods, instructions or products referred to in the content. |
© 2025 by the authors. Licensee MDPI, Basel, Switzerland. This article is an open access article distributed under the terms and conditions of the Creative Commons Attribution (CC BY) license (https://creativecommons.org/licenses/by/4.0/).