Abstract
This study evaluates the effectiveness of Speed Safety Camera (SSC) deployments in reducing traffic speeds through four interstate work zones in Indiana in accordance with Indiana State Law House Enrolled Act (HEA) 1015. The initial deployment of SSC was along the interstate I-70 in August 2024, with deployments on I-69, I-465, and I-65 subsequently following in 2025. To evaluate the impact of SSC deployments in Indiana, connected passenger car and connected truck data were used to quantify the change in speed characteristics before and during the SSC deployments. Approximately 100 million passenger vehicle records and 3 million commercial truck records were analyzed. That Connected Vehicle data was used to count the number of spot speeds, at 0.1-mile intervals, that were 11 mph or more over the work zone speed limit over the entire work zone. The length of those study segments ranged from 3 to 10 miles. Across 443 SSC deployment days between 14 August 2024 and 11 July 2025, the study found 34% reductions on average in the percentage of passenger vehicle spot speeds exceeding the work zone speed limit by 11 mph or more on weekdays between 6 AM and 6 PM. For commercial trucks, there was a 41% reduction across the study sites.
1. Introduction
Safety in construction work zones is an area of national concern for all stakeholders. Speed was a factor in 34% of fatal work zone crashes nationwide in 2022, a 2% increase from 2021 [,]. Several studies have identified speeding as having a significant influence on the likelihood of and a contributing factor to the severity of work zone crashes [,]. Indiana alone reports 1750 injuries and 8285 total crashes in work zones in 2023 []. Automated enforcement [], visible law enforcement [], speed feedback displays [], and variable speed limits [] are some of the tools that agencies use to increase compliance with work zone speed limits and improve driver and worker safety.
A number of states, including Maryland, Oregon, Illinois, Washington, and Pennsylvania, are in the process of or already have piloted successful automated enforcement programs and have shown marked improvements in work zone safety. International evaluations have also shown significant speed reductions with the use of SSCs [,]. The Federal Highway Administration (FHWA) has identified Speed Safety Cameras (SSCs) as a safety countermeasure for improving roadway safety []. A 2022 study reports that as many as 20 states across the US have employed SSCs for reducing speeds in work zones and/or school zones []. A 2008 evaluation of speed photo enforcement by radar in Illinois work zones showed a 3.2 to 7.3 mph reduction in mean speeds [], with significant downstream effects as well []. Similarly, a 2006 study of automated speed enforcement in school zones in Oregon showed lasting residual effects on speed reductions even when SSC were not present []. SSCs in the city of Chicago, Illinois, have also been shown to reduce fatal and injury crashes by 12%, and fatal and severe injury crashes by 15% []. Practitioners have used a variety of techniques to evaluate the effectiveness of their work zone safety measure deployments, ranging from crash reports [,], monitoring with cameras, and speed monitoring devices []. Those evaluation efforts often require significant time and labor investment as well as extensive data collection periods. Furthermore, all prior evaluations of SSCs have focused on the SSC location and selected locations downstream to document halo effects; however, no study has as yet looked at the impact of SSCs throughout a worksite. Connected Vehicle (CV) data has the potential to provide such evaluations on a near real-time basis and is not spatially constrained. With the use of CV data, SSC evaluations no longer need to be constrained to a particular location but can instead be performed across the worksite and beyond.
The rest of this paper is organized as follows: the first section introduces the objective and provides a background on the Indiana Pilot Program. The second section covers the various data sources utilized, the study location, and a summary of deployments. The third section illustrates the processing methodology and evaluates the results of our analysis over hours of active SSC as well as all 24 h of the day. The fourth and fifth sections discuss and summarize these overall speed reduction results, as well as provide future research directions.
1.1. Paper Objective
The objective of this paper is to use CV data to monitor speed characteristics of work zones and assess the impact of SSC. CV data has been utilized over the past decade to conduct systematic evaluations on the effectiveness of a number of work zone safety countermeasures, including speed feedback displays [], queue warning trucks [], work zone geometry [], work zone message signs [], among others. Moreover, a 5-month analysis of automated enforcement of three work zones in Pennsylvania using CV data from passenger vehicles observed an increase in overall speed compliance in work zones with the presence of SSC [].
However, a systemwide long-term evaluation of a state’s SSC deployments using both passenger vehicle and commercial truck trajectory data has not yet been performed. In some cases, passenger vehicle speed trends may differ significantly from commercial truck speeds based on road geometry, differential truck speed limits, and the number of lanes, for example. This study was designed to provide a quantitative evaluation of the change in work zone speed characteristics with and without SSC over both time and location in the work zone.
1.2. Background on Indiana’s Pilot Program Deployment
Beginning in 2020, Indiana began looking at what other states were doing to manage work zone speeds and identified SSC as a technology to further investigate. Based on similar mature programs in Maryland (started in 2009) and Pennsylvania (started in 2020), INDOT colleagues met with their peers to learn how those systems were operated and managed.
The Indiana Legislature passed House Enrolled Act (HEA) 1015 of 2023 and was signed by Governor Holcomb in May 2023. This legislation authorized the Indiana Department of Transportation (INDOT) to develop, implement, and operate a five-year pilot for a Worksite Speed Control Program. Officially termed the Worksite Speed Control System (WSCS) program by INDOT, the program development began in July 2023. Test deployments started in July 2024, and a ‘pre-enforcement’ period where the program issued written Courtesy Notices began on 14 August 2024, and continued through to April 2025. Full program enforcement and issuance of actual violations began on 5 May 2025.
The program provides motorists with notice of enforcement locations through press releases prior to enforcing in a given worksite (WS), as well as both long-term and short-term signs at the actual enforcement location. Enforcement units (henceforth referred to as SSC units) are vehicle-based with speed detection and image capture LiDAR devices to measure vehicle speeds and capture images of vehicles traveling in excess of the threshold speed, which is 11 mph or more over the posted worksite speed limit. These images are then encrypted and transferred to the back office, where the images are reviewed, and the registered owner is sought. Once the registered owner is identified, a notice of violation is created and issued. The penalty structure for the program is a zero-fine warning for the first violation, a USD 75 civil penalty for the second violation, and a USD 150 civil penalty for the third and subsequent violations. The registered owner has the right to contest their liability for any SSC violation through established processes with the Office of Administrative Law Proceedings (OALP).
1.3. Placement of Advance Warning Signs in Advance of SSC
Figure 1a illustrates the location of the vehicle with the SSC (location i), the placement of an ‘ACTIVE’ sign provided as a courtesy to motorists (location ii), and an advance warning sign (location iii). Figure 1b provides a front view of the vehicle with the SSC used to obtain enforcement data. Figure 1c shows an image of the portable ‘ACTIVE’ sign, 4 FT wide by 4 FT tall, that is only placed during active deployments. Figure 1d shows a ground-mounted active warning sign, 4 FT wide by 5 FT tall, that is continuously visible to motorists. An additional advance warning sign—either a panel 9 FT wide by 7 FT tall or a smaller one that is 4 FT wide by 5 FT tall—is placed before the advance warning sign shown in location iii, also continuously visible to motorists.

Figure 1.
INDOT Safe Zones Worksite Speed Control Pilot Program []. (a) Active SSC on I-465 worksite; (b) SSC vehicle (callout i); (c) active SSC portable sign (callout ii); and (d) upstream fixed signs (callout iii).
2. Materials and Methods
2.1. Data Description
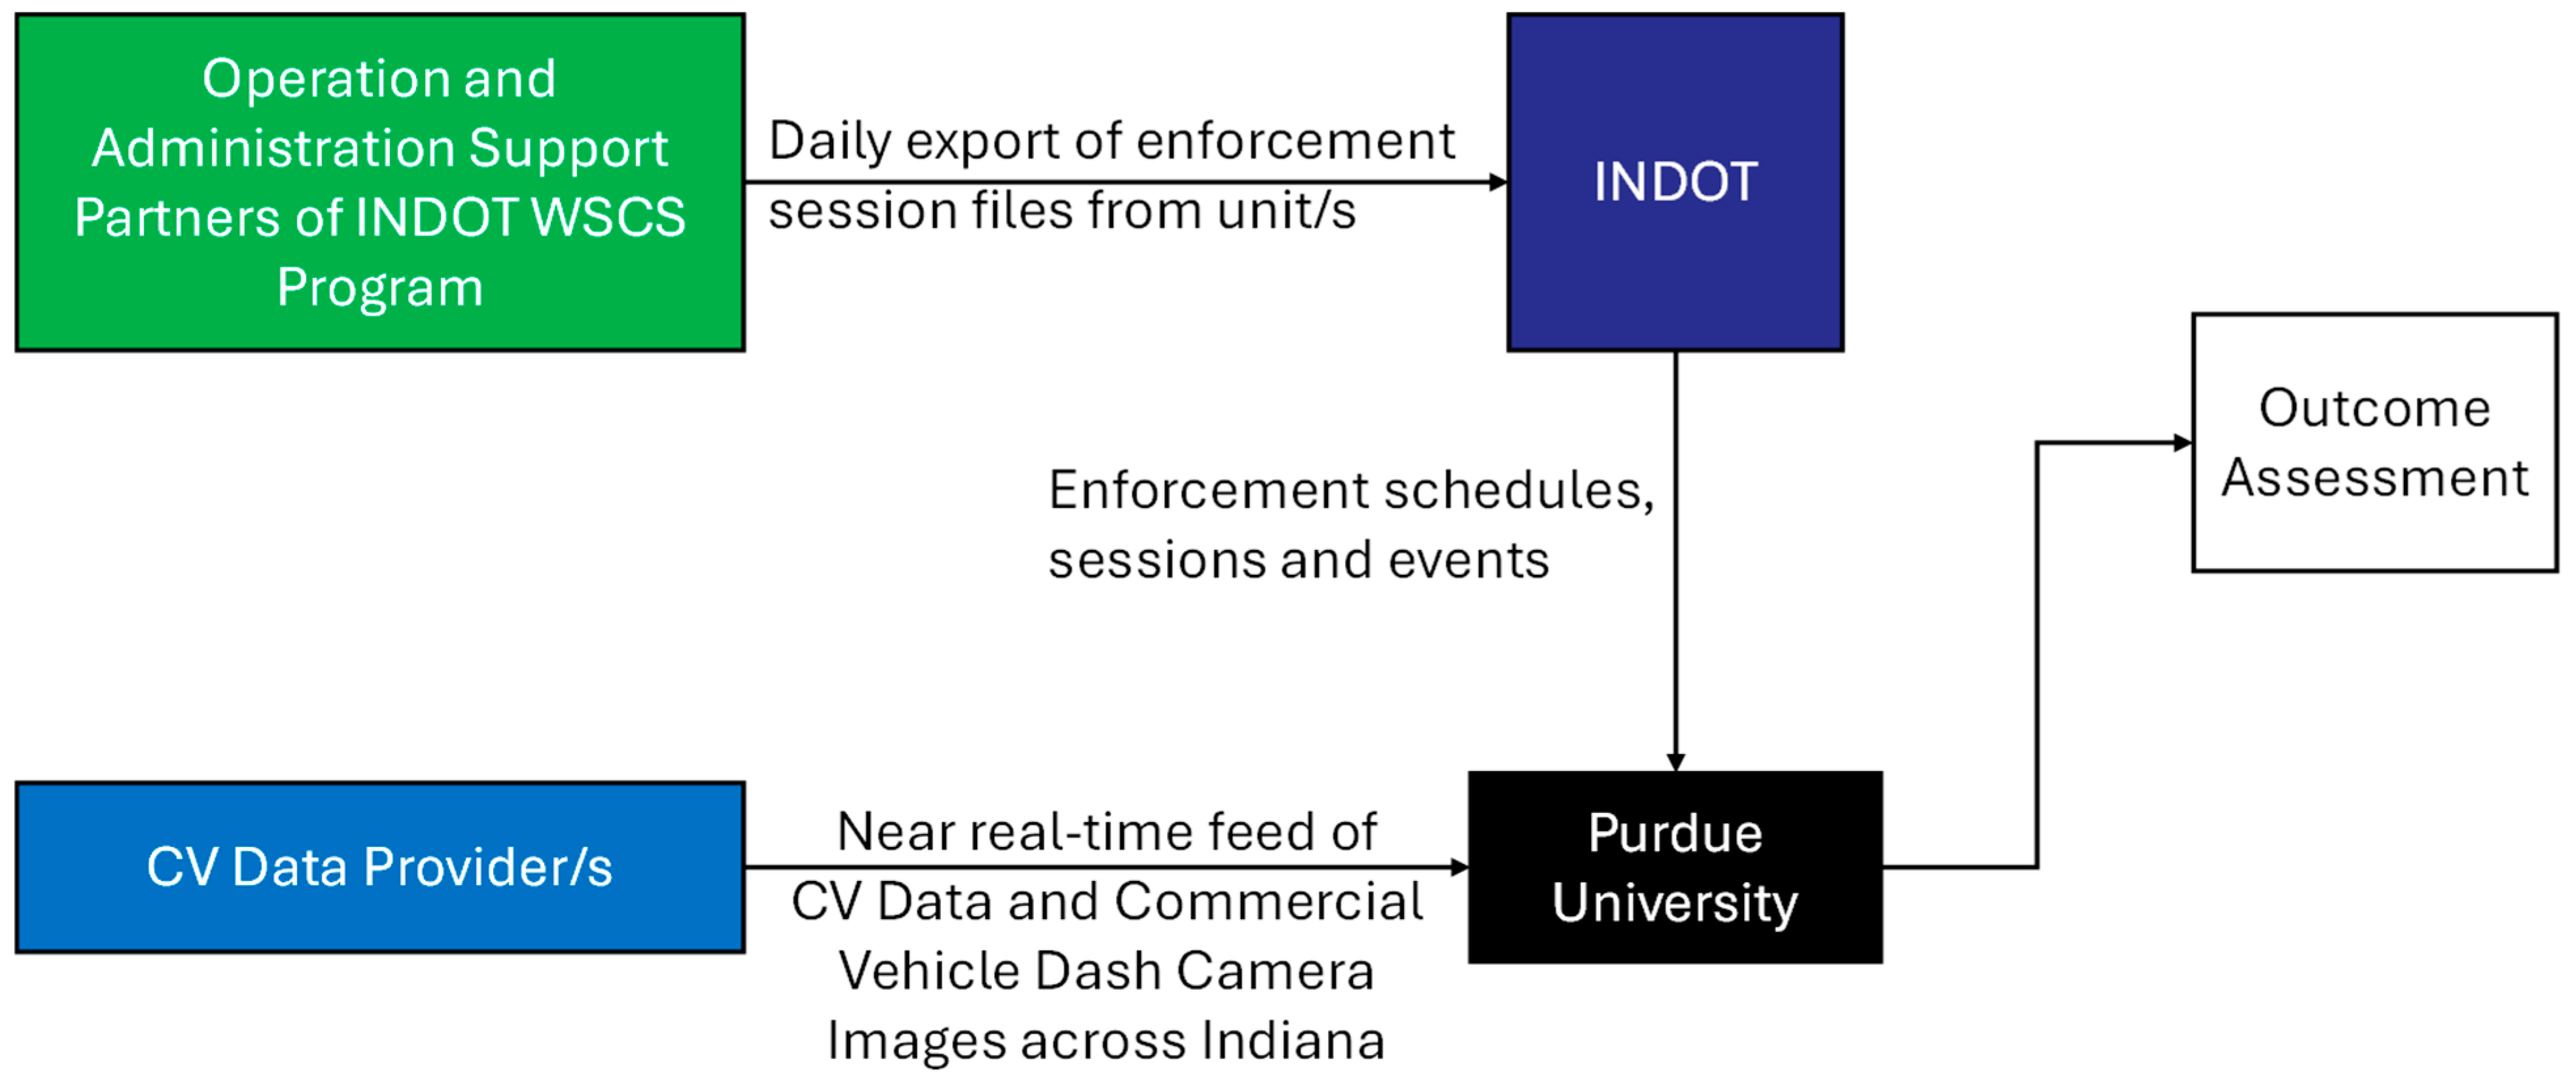
This section describes the data used to analyze approximately 100 million passenger vehicle records and 3 million commercial truck records to identify spot speed characteristics of those two classes of vehicles between August 2024 and July 2025. Details are explained on how spot speed proportions for 0.1-mile-long segments are computed. The evaluation focuses on summarizing the percentage of speed records exceeding the worksite speed limit by 11 mph or more by day by hour. This hourly data summary can then be used to compare speed characteristics during different periods of the day and assess the impact of SSC. The flow chart shown in Figure 2 provides an overview of the data flow and coordination among stakeholders.
Figure 2.
Data collection workflow.
2.1.1. Connected Vehicle Data
Anonymous Connected Vehicle (CV) data was obtained for this study from third-party providers covering both passenger cars as well as commercial trucks. Trajectory waypoints from passenger cars available at a 3 s frequency and those from commercial trucks available at 10–60 s frequencies were utilized for this analysis. Through spatial joining and linear referencing techniques described in the existing literature [], each such waypoint was linearly referenced to its corresponding mile marker (MM) location in its direction of travel. To filter any outlier speeds, reporting inaccuracies in the CV data, or slow-moving traffic due to incidents and recurring congestion, only speeds greater than 25 mph and lower than 120 mph were considered for this analysis. These CV data sources together approximately account for an overall penetration of 5–6% on non-interstate and interstate roads [], with commercial truck records providing higher visibility during overnight hours when there is naturally low passenger vehicle volume. Multiple studies have shown the generally viable spatial and temporal distribution of such CV data, and that CV data at these penetration rates is practical and usable in applications involving systematic performance assessment, traffic analytics, among others [,].
2.1.2. Deployment Logs
INDOT’s WSCS Program Vendor (PV) provides operational and administrative support to INDOT and provided Deployment Logs (DLs) used to identify analysis periods in this study. The DLs provide deployment information—specifically date, time, and precise location information where the SSC units were deployed. SSC deployment times provide context for before and after comparisons of speeds during active SSC deployments compared to pre-SSC-deployment construction times. SSC device geolocations were linearly referenced to match them to a corresponding MM and travel trajectory for a particular worksite. This information was used to identify the locations for performing an analysis of the impact of the SSC.
2.1.3. Fixed Panel Advance Warning Signs
In coordination with the agency and construction staff, installation dates and locations of fixed advance warning signs on each worksite were obtained. These installation dates helped the analysis in defining a ‘before’ control period where no signage pertinent to SSC was present within the worksite. Commercial vehicle dash camera images [] as well as field visits (video drive-throughs) of each worksite were used to validate and record these sign installation locations.
2.2. Study Location
Figure 3 shows a map view of the four worksites analyzed by this study along I-70 (callout A), I-69 (callout B), I-465 (callout C), and I-65 (callout D). The first three worksites were located in the greater Indianapolis area in Marion County and Hancock County, while the most recent I-65 worksite is located in northwest Indiana in Lake County. The I-70 worksite spanned 10 miles, followed by the I-465 worksite at 5 miles, the I-65 worksite at 3.8 miles, and the I-69 worksite at 3 miles. A 3-mile buffer was added both upstream and downstream of each worksite’s MM limits to capture spillover impacts in the immediate vicinity of the worksite as well.
Figure 3.
Map showing the four deployment locations for SSC in 2024 (A) and 2025 (B, C, and D).
2.3. Summary of SSC Deployments
Table 1 provides a chronological view of the four worksites and the order in which SSC units were deployed to each.
Table 1.
Chronological order of worksite deployment across pre-enforcement and SSC periods.
- The I-70 worksite (Figure 3, location A) was the first deployment with a pre-enforcement period from 14 August 2024 to 20 December 2024 in both directions of travel (eastbound and westbound).
- The subsequent I-69 deployments (Figure 3, Location B) were only deployed in the southbound direction, and assessment was performed from 15 January 2025 [] through 11 July 2025.
- The I-465 deployments (Figure 3, Location C) were deployed in both directions of travel (clockwise Inner Loop and counterclockwise Outer Loop) and assessed from 15 January 2025 through 11 July 2025.
- The most recent worksite I-65 deployments were in the southbound direction of travel and assessed from 7 July 2025 [] through 11 July 2025.
The WSCS program remains active beyond these reporting dates, but these dates were selected to provide time for analysis, reporting, and results within the evaluation project period. Consequently, the study period was limited to end on 13 July 2025, and the data and results reported herein are current as of that date.
The following section describes the SSC setup for the I-70 worksite in the eastbound direction of travel. The other worksites followed a similar setup. The I-69 and I-465 worksites had posted worksite speed limits of 45 mph, while I-70 and I-65 had posted worksite speed limits of 55 mph. Subsequent sections describe the speed analysis with and without SSC deployments.
2.4. I-70 EB Worksite Configuration and Segment Definitions
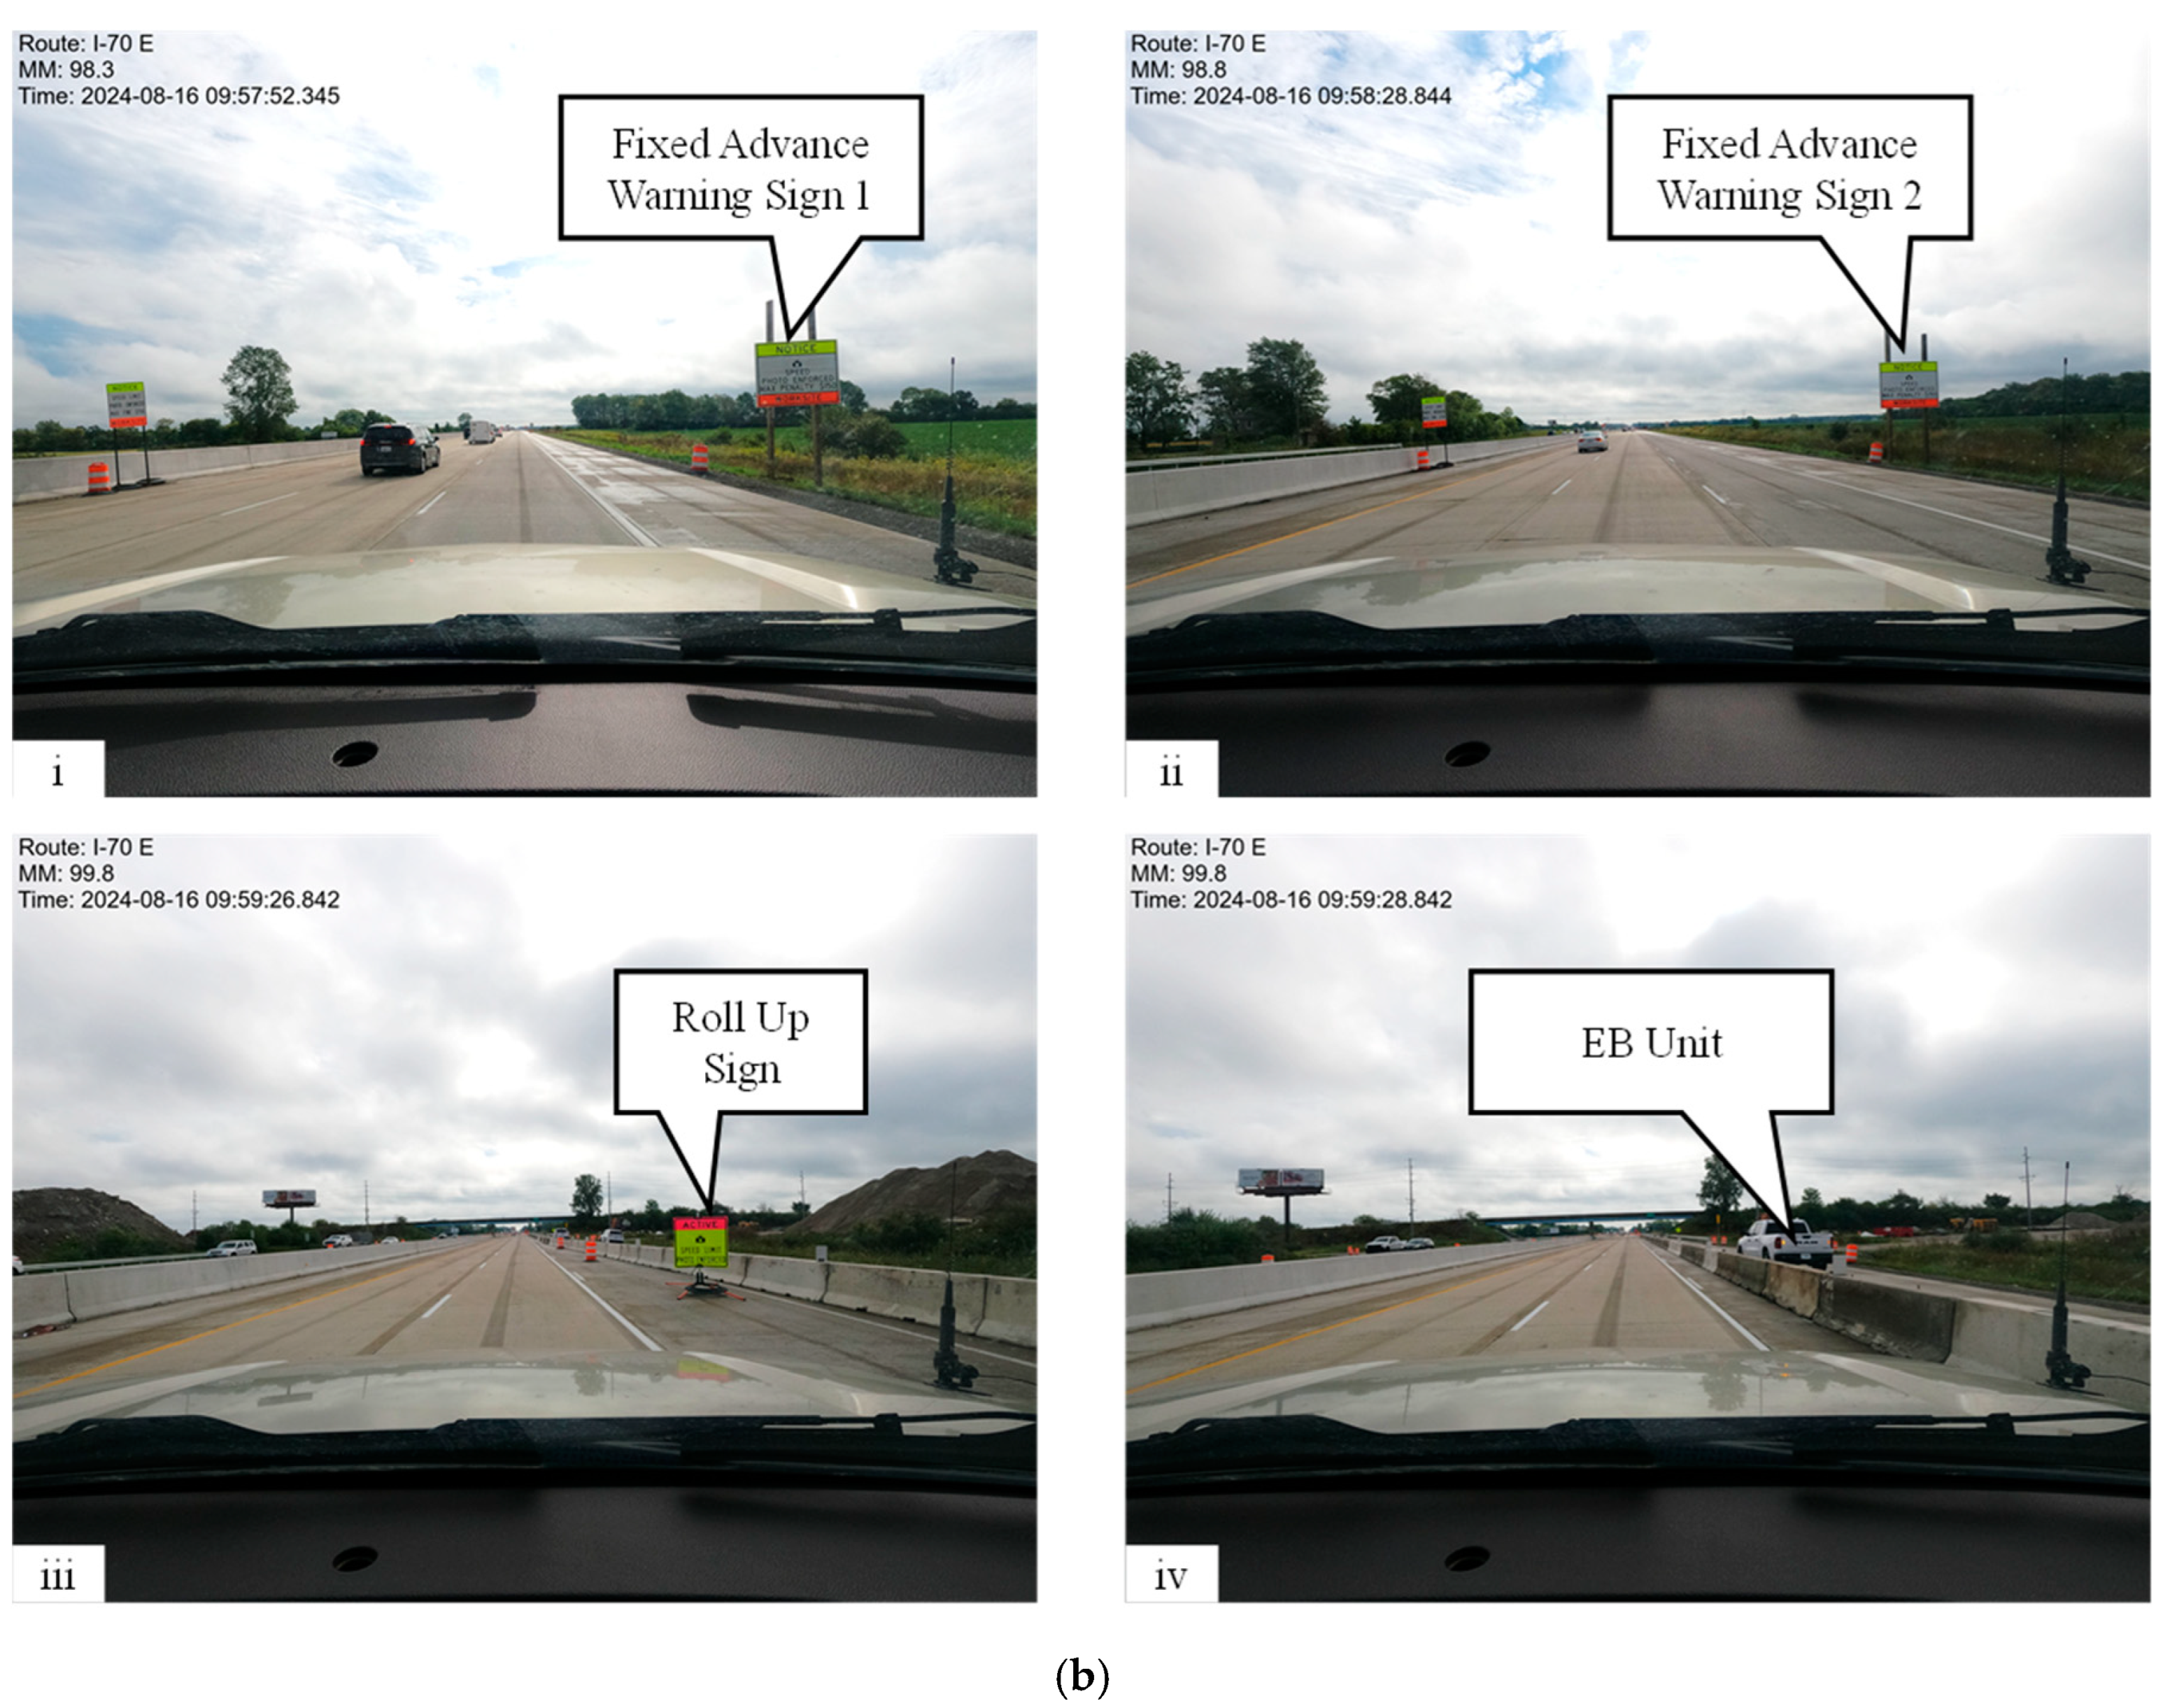
Figure 4a shows the linear definition of a 10-mile worksite with 3-mile buffers on each end on I-70 EB in Hancock County, Indiana. Figure 4b shows a corresponding windshield view from a vehicle. The first fixed advance warning (callout i) sign alerting motorists of SSC activity was placed 1.5 miles upstream of the SSC location. The second such advance warning sign (callout ii) was placed about 1 mile upstream of the SSC location. These two fixed advance warning signs carried the following message: ‘NOTICE|SPEED PHOTO ENFORCED MAX PENALTY $150|WORKSITE’, as shown by Figure 4b. Finally, a third portable temporary sign (callout iii) was placed in very close proximity upstream of the SSC unit (callout iv) at any time that the unit was active, with the following message to motorists: ‘ACTIVE|SPEED LIMIT PHOTO ENFORCED’.

Figure 4.
Advance warning signage on approach to I-70 EB Mount Comfort worksite MM 95-105: (a) I-70 EB MM 95-105 worksite location; (b) advance warning signs and unit setup for EB worksite.
2.5. Methodology for Processing CV Data
To systematically analyze the study area through manageable segments that are granular enough to capture the specific impacts of unit placement at an MM, while not being coarse enough to wash out localized impacts, a 0.1-mile segment resolution was chosen. CV speed records were linearly referenced and matched to the corresponding 0.1-mile segment they spatially lie within, and an MM was assigned to each CV waypoint, using well-established techniques in the prior literature []. This resulted in a linear referenced dataset of all relevant CV waypoints with an associated route, MM, and direction of travel assigned. This dataset can then be utilized to observe both spatial and temporal speed trends, for not only individual MMs but for the entire worksite as well.
For purposes of illustration, passenger vehicle CV data are utilized for the results presented in the following section. Summary statistics for commercial trucks are included at the end of the paper using this same methodology.
3. Results
3.1. Evaluating Speed Compliance over Hours of Active SSC
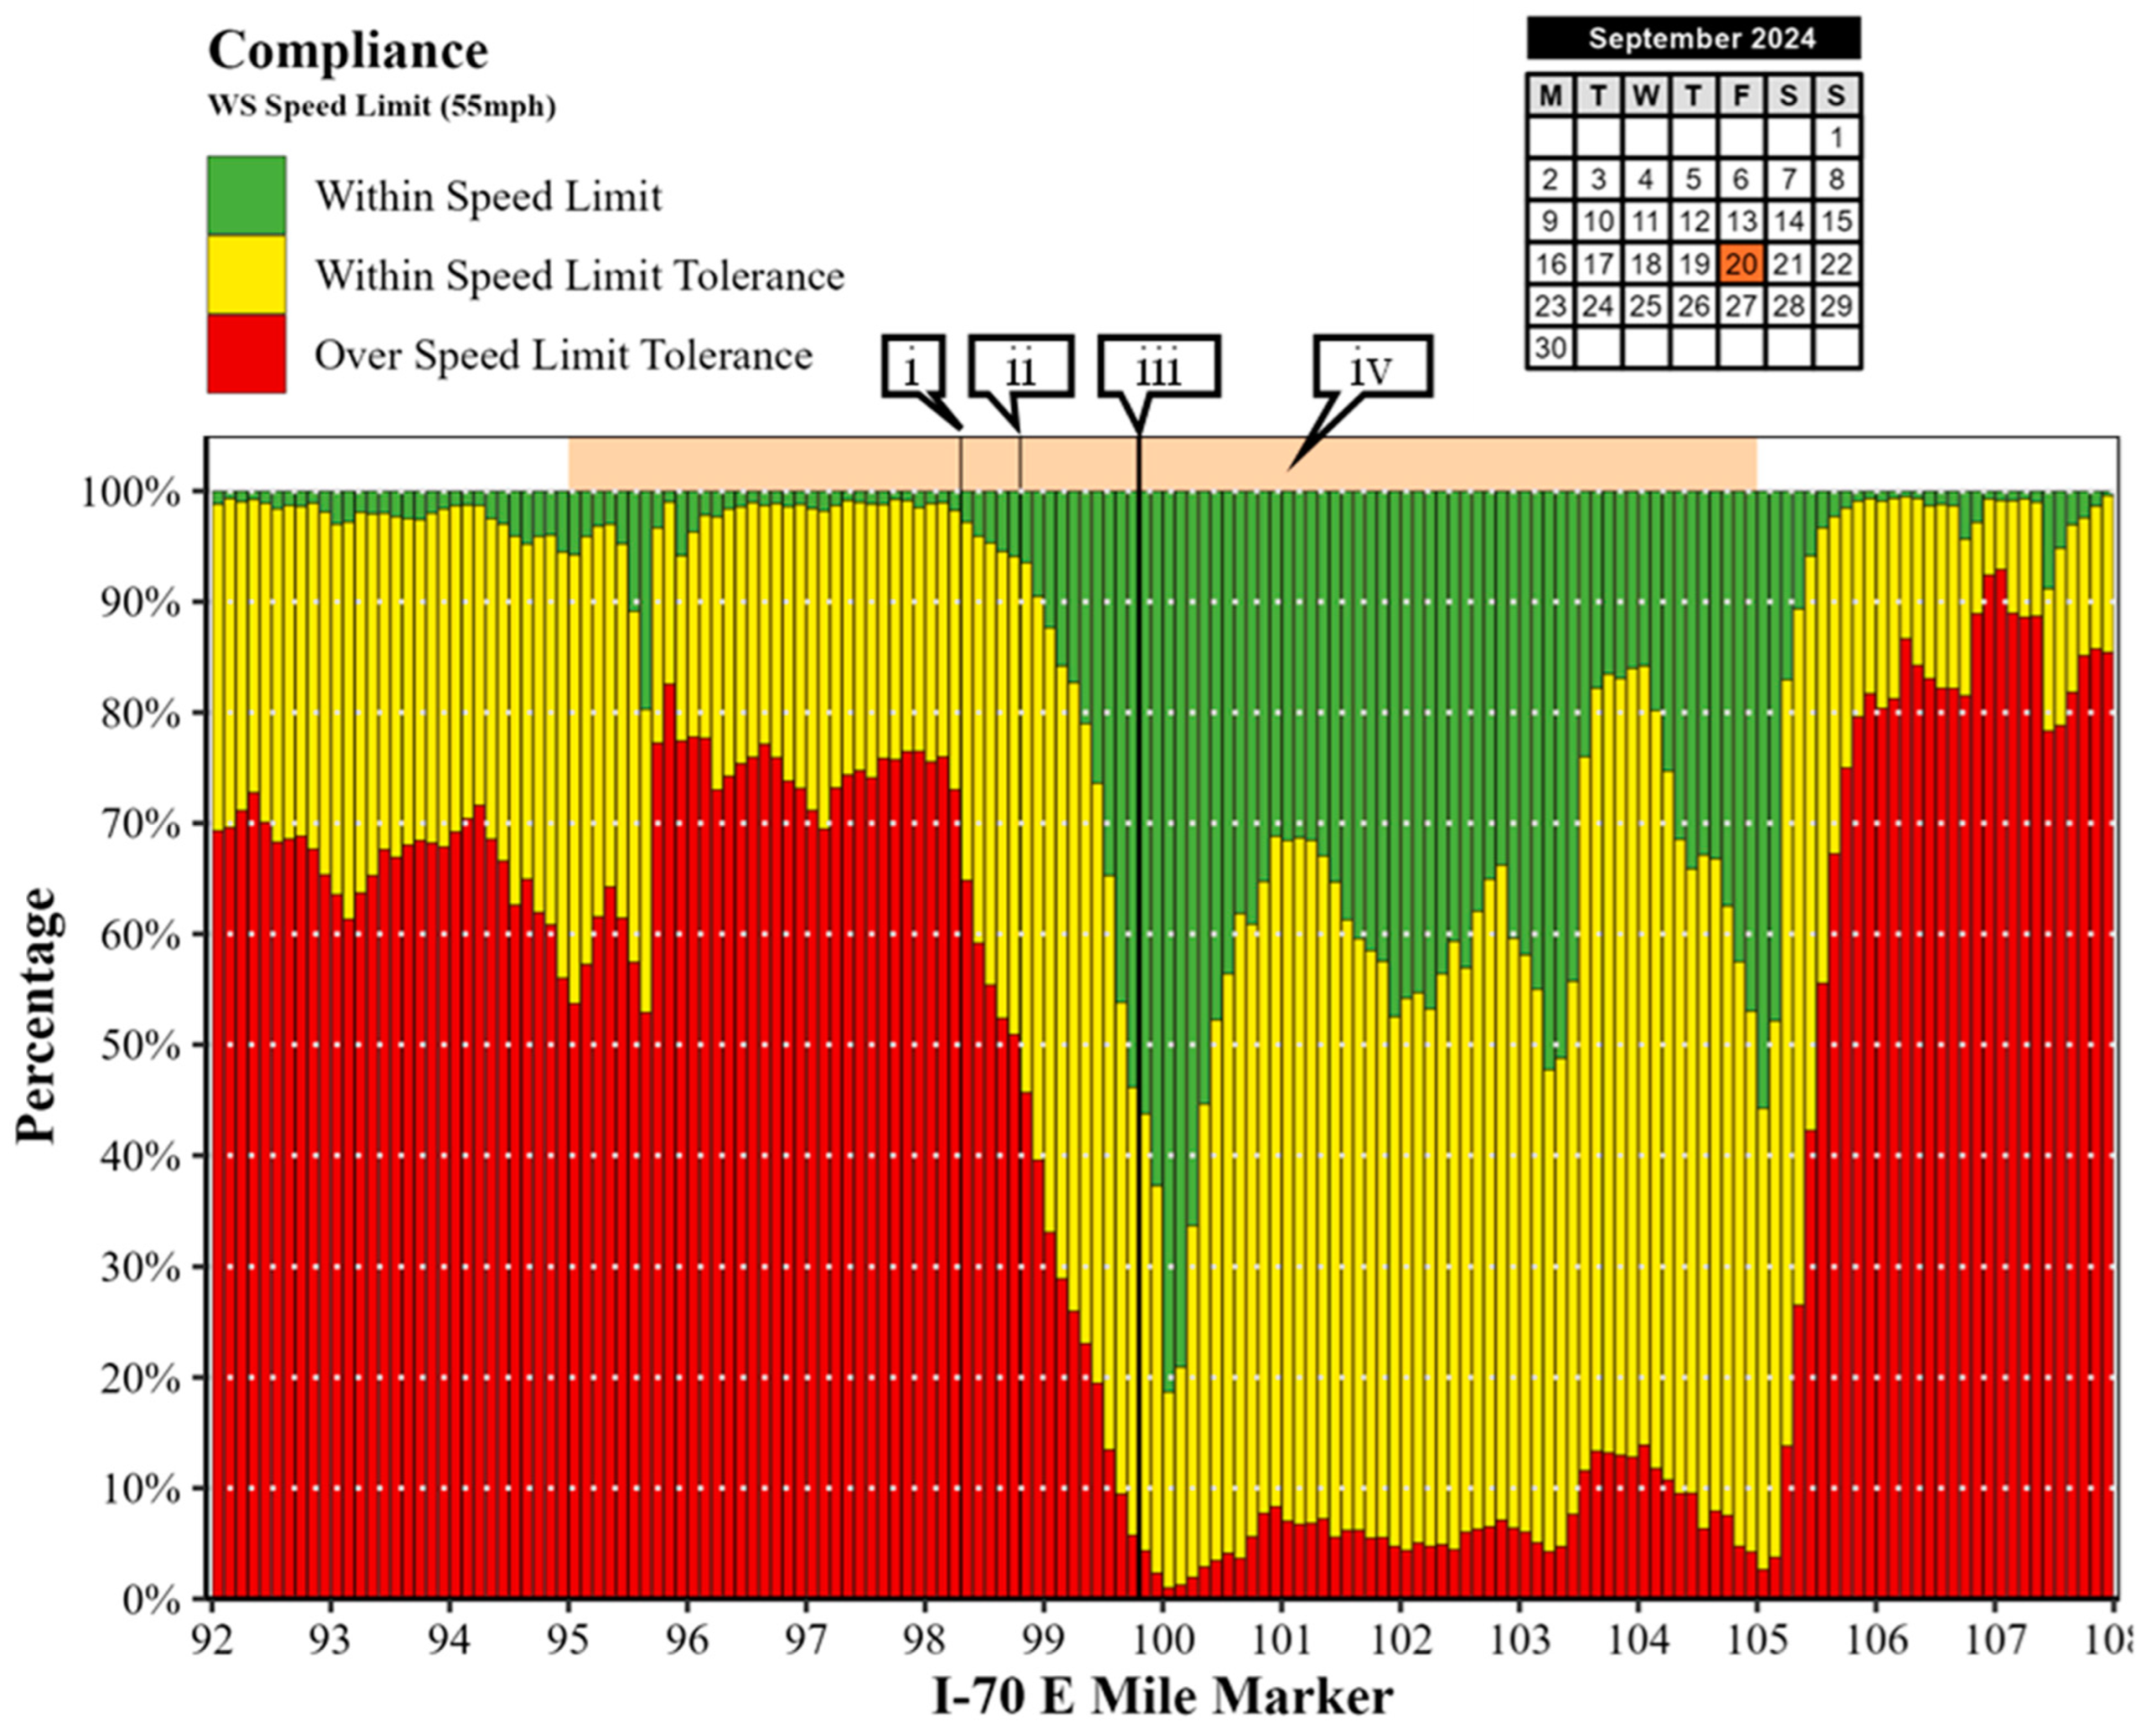
Figure 5 shows a speed proportion plot for the I-70 EB worksite for one active SSC day on Friday, 20 September 2024. The horizontal axis represents the mile marker location along the worksite, beginning from MM 92 to 108. Every 0.1-mile segment of roadway is represented by a 100% stacked bar chart made up of three categories of CV speed records, namely, within the worksite speed limit (≤55 mph), within the worksite speed limit tolerance (<66 mph), and over the worksite speed limit tolerance (≥66 mph). Each vertical column represents a stacked percentage of CV speeds in each of these three categories.
Figure 5.
Passenger car speed profiles for I-70 EB worksite (Friday, 20 September 2024).
Callouts i and ii represent the MM locations of the two fixed advance warning signs installed in this worksite. Callout iii represents the MM location of the temporary portable sign and the SSC unit. Callout iv indicates the actual worksite MM limits of MM 95-105, denoted by the shaded orange background. Thin vertical black lines denote the advance warning sign locations. The SSC unit’s location is similarly marked by a thick black vertical line on the diagram. CV speeds clearly show the highest compliance with WS speed limit tolerance as they approach the SSC unit location MM. This compliance is sustained for a significant portion of the work zone, with speeds increasing on entering the downstream 3-mile buffer. The trend in speeds over the WS speed limit tolerance decreasing appears to begin exactly at the MM location of the first advance warning sign at MM 98.3 and continues to decrease all the way until the SSC unit’s location.
The SSC unit was deployed on this date from about 8:19 AM to 3:32 PM Eastern Time. Approximately 181,000 CV speed records during this exact timeframe were extracted, aggregated, and plotted in Figure 5. At the exact location of the SSC unit MM 99.8, only 4.3% of CV speed records were observed to be 11 mph or higher than the WS speed limit (55 mph). Correspondingly, that percentage is as high as 64.8% at the location of the first fixed advance warning sign, MM 98.3, and 45.7% at the location of the second fixed advance warning sign, MM 98.8. This shows the gradual change in speed trends as motorists approach the first two fixed advance warning signs and eventually the SSC unit itself.
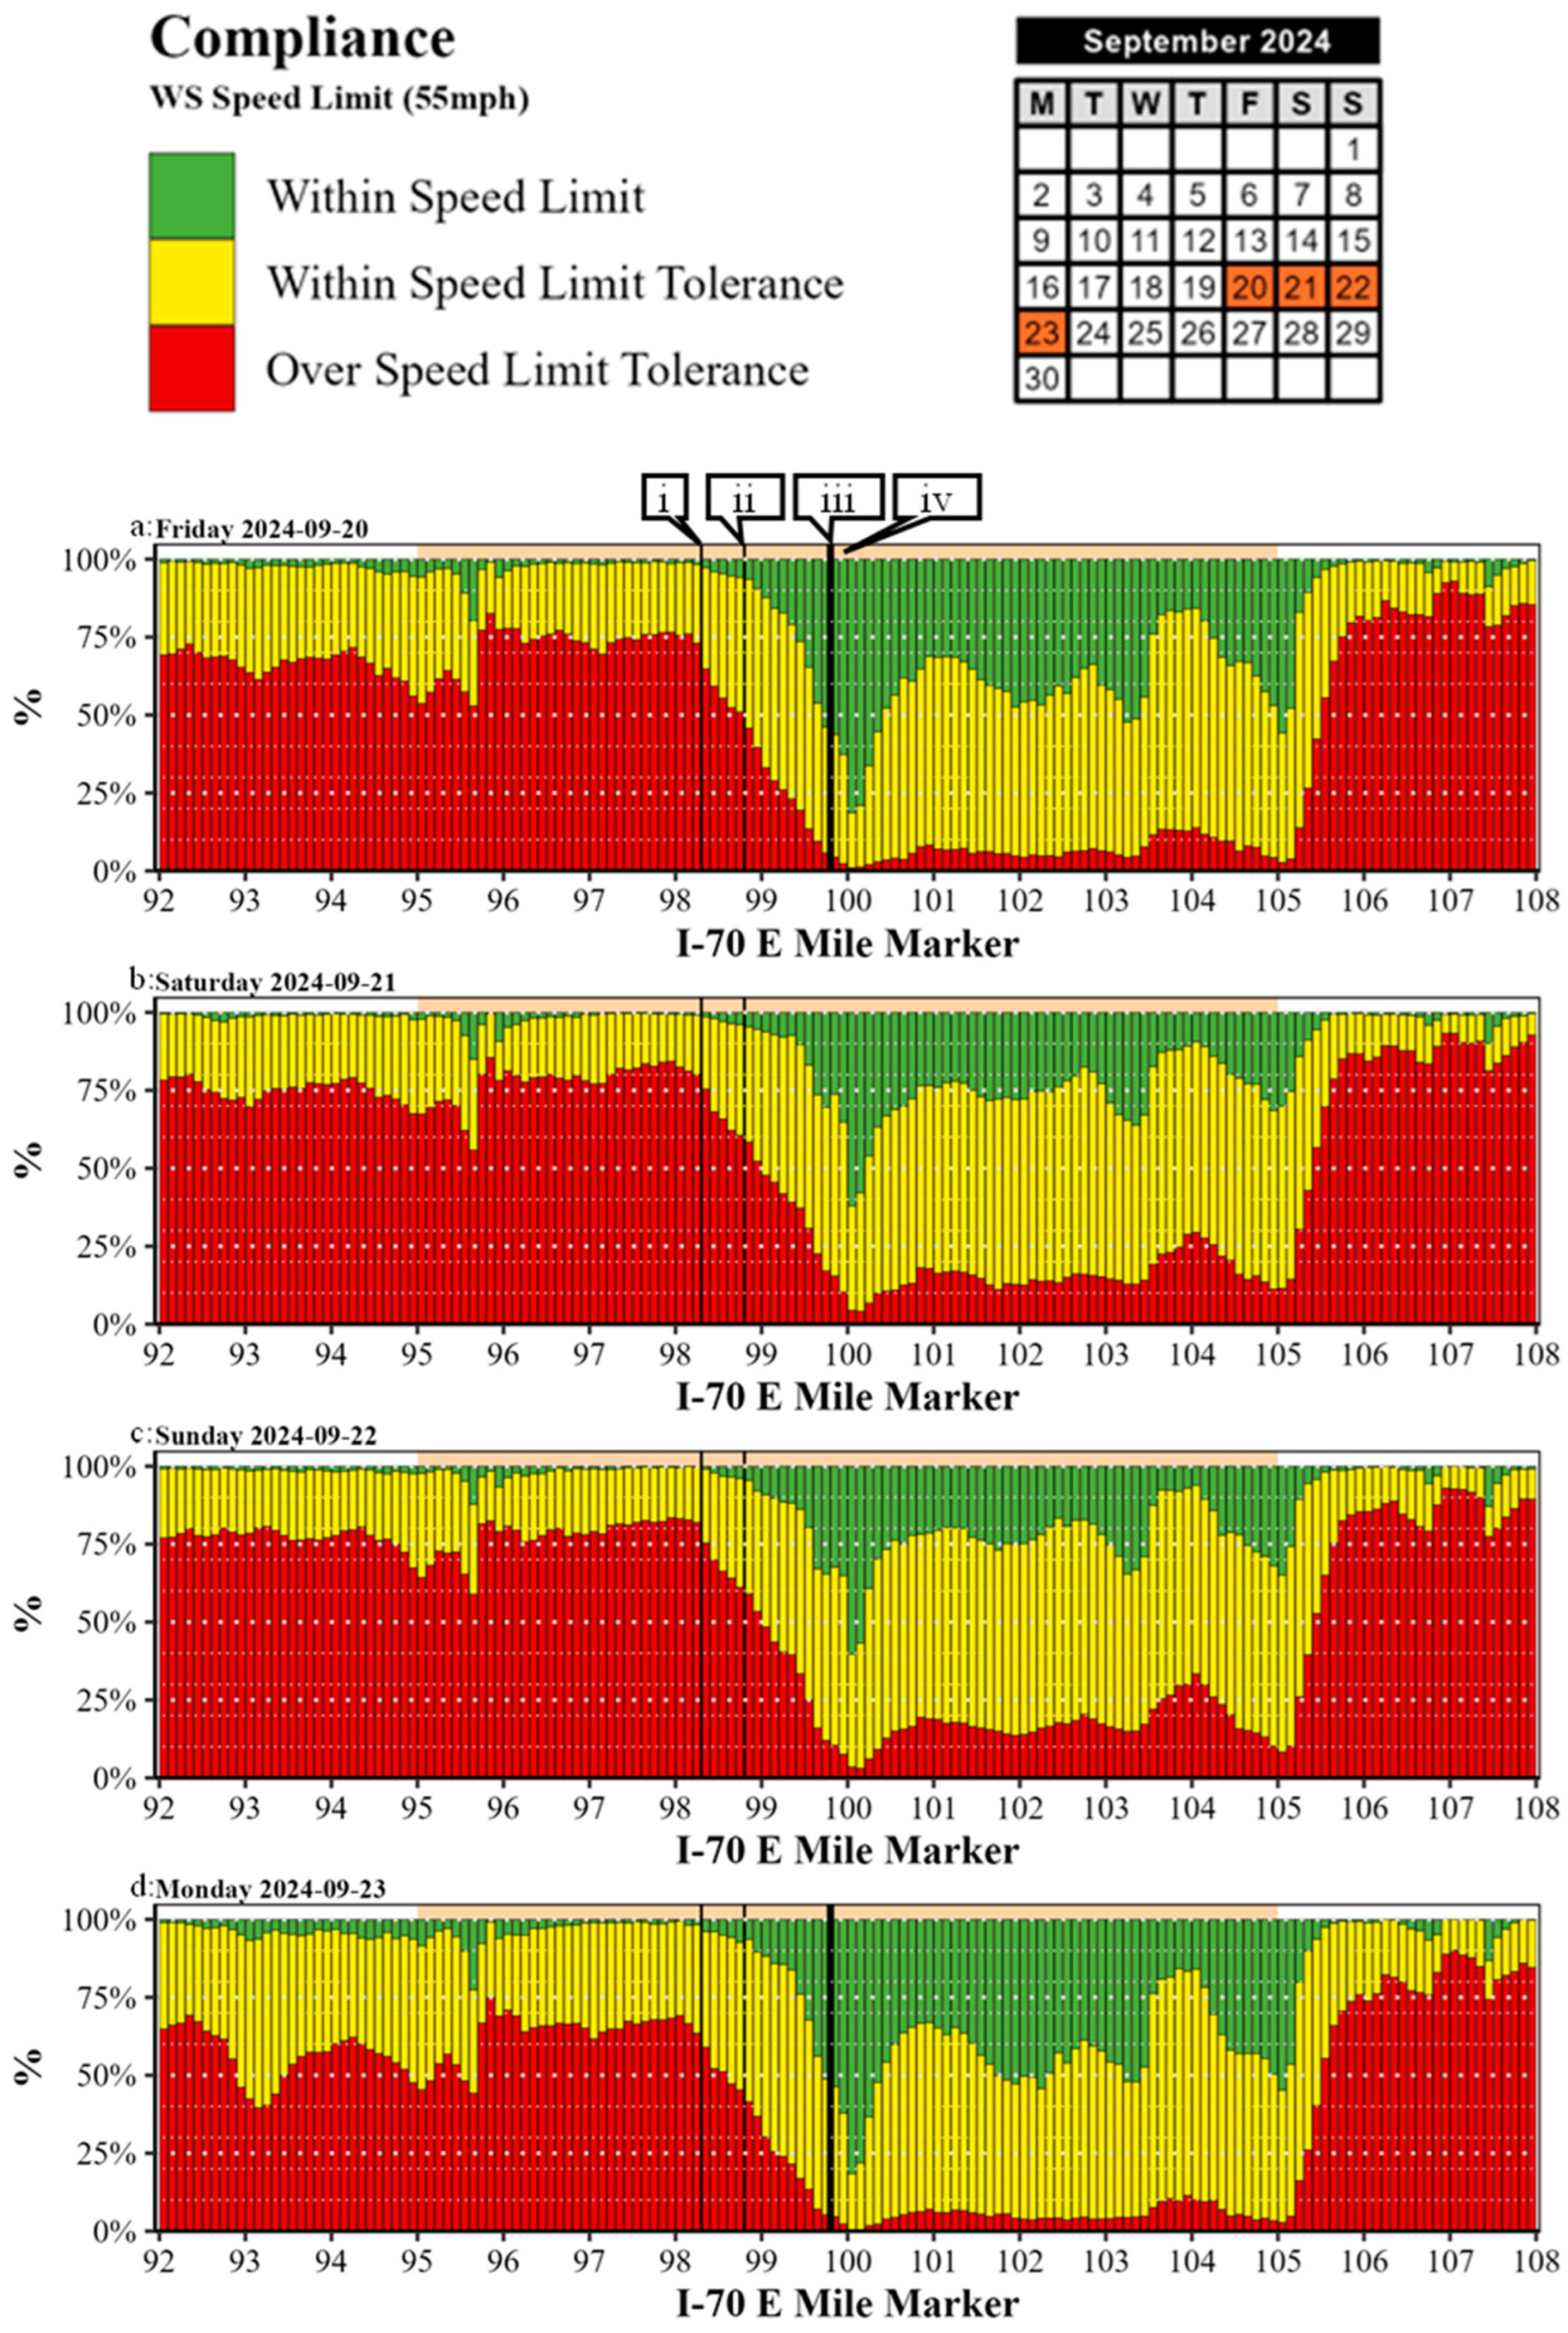
A 4-day speed compliance plot for the same worksite from Friday, September 20, through to Monday, 23 September 2024, is shown in Figure 6. For days with no active SSC, Saturday (b) and Sunday (c), similar time periods as the usual scheduled SSC times (8 AM–4 PM) are chosen for a more direct comparison of speed compliance. On days with active SSC, Friday (a) and Monday (d), the percentage of speeds exceeding the WS speed limit by 11 mph or more ranged from 4.3% to 4.6%. The same location witnessed percentages as high as 15.4% and 10.4% with no active SSC on Saturday (b) and Sunday (c), respectively, indicating a weekend rebound in speeds.
Figure 6.
Passenger car speed profiles for I-70 EB worksite (20–23 September 2024).
3.1.1. Longitudinal Trends in Speed Compliance at Sign and Unit Locations
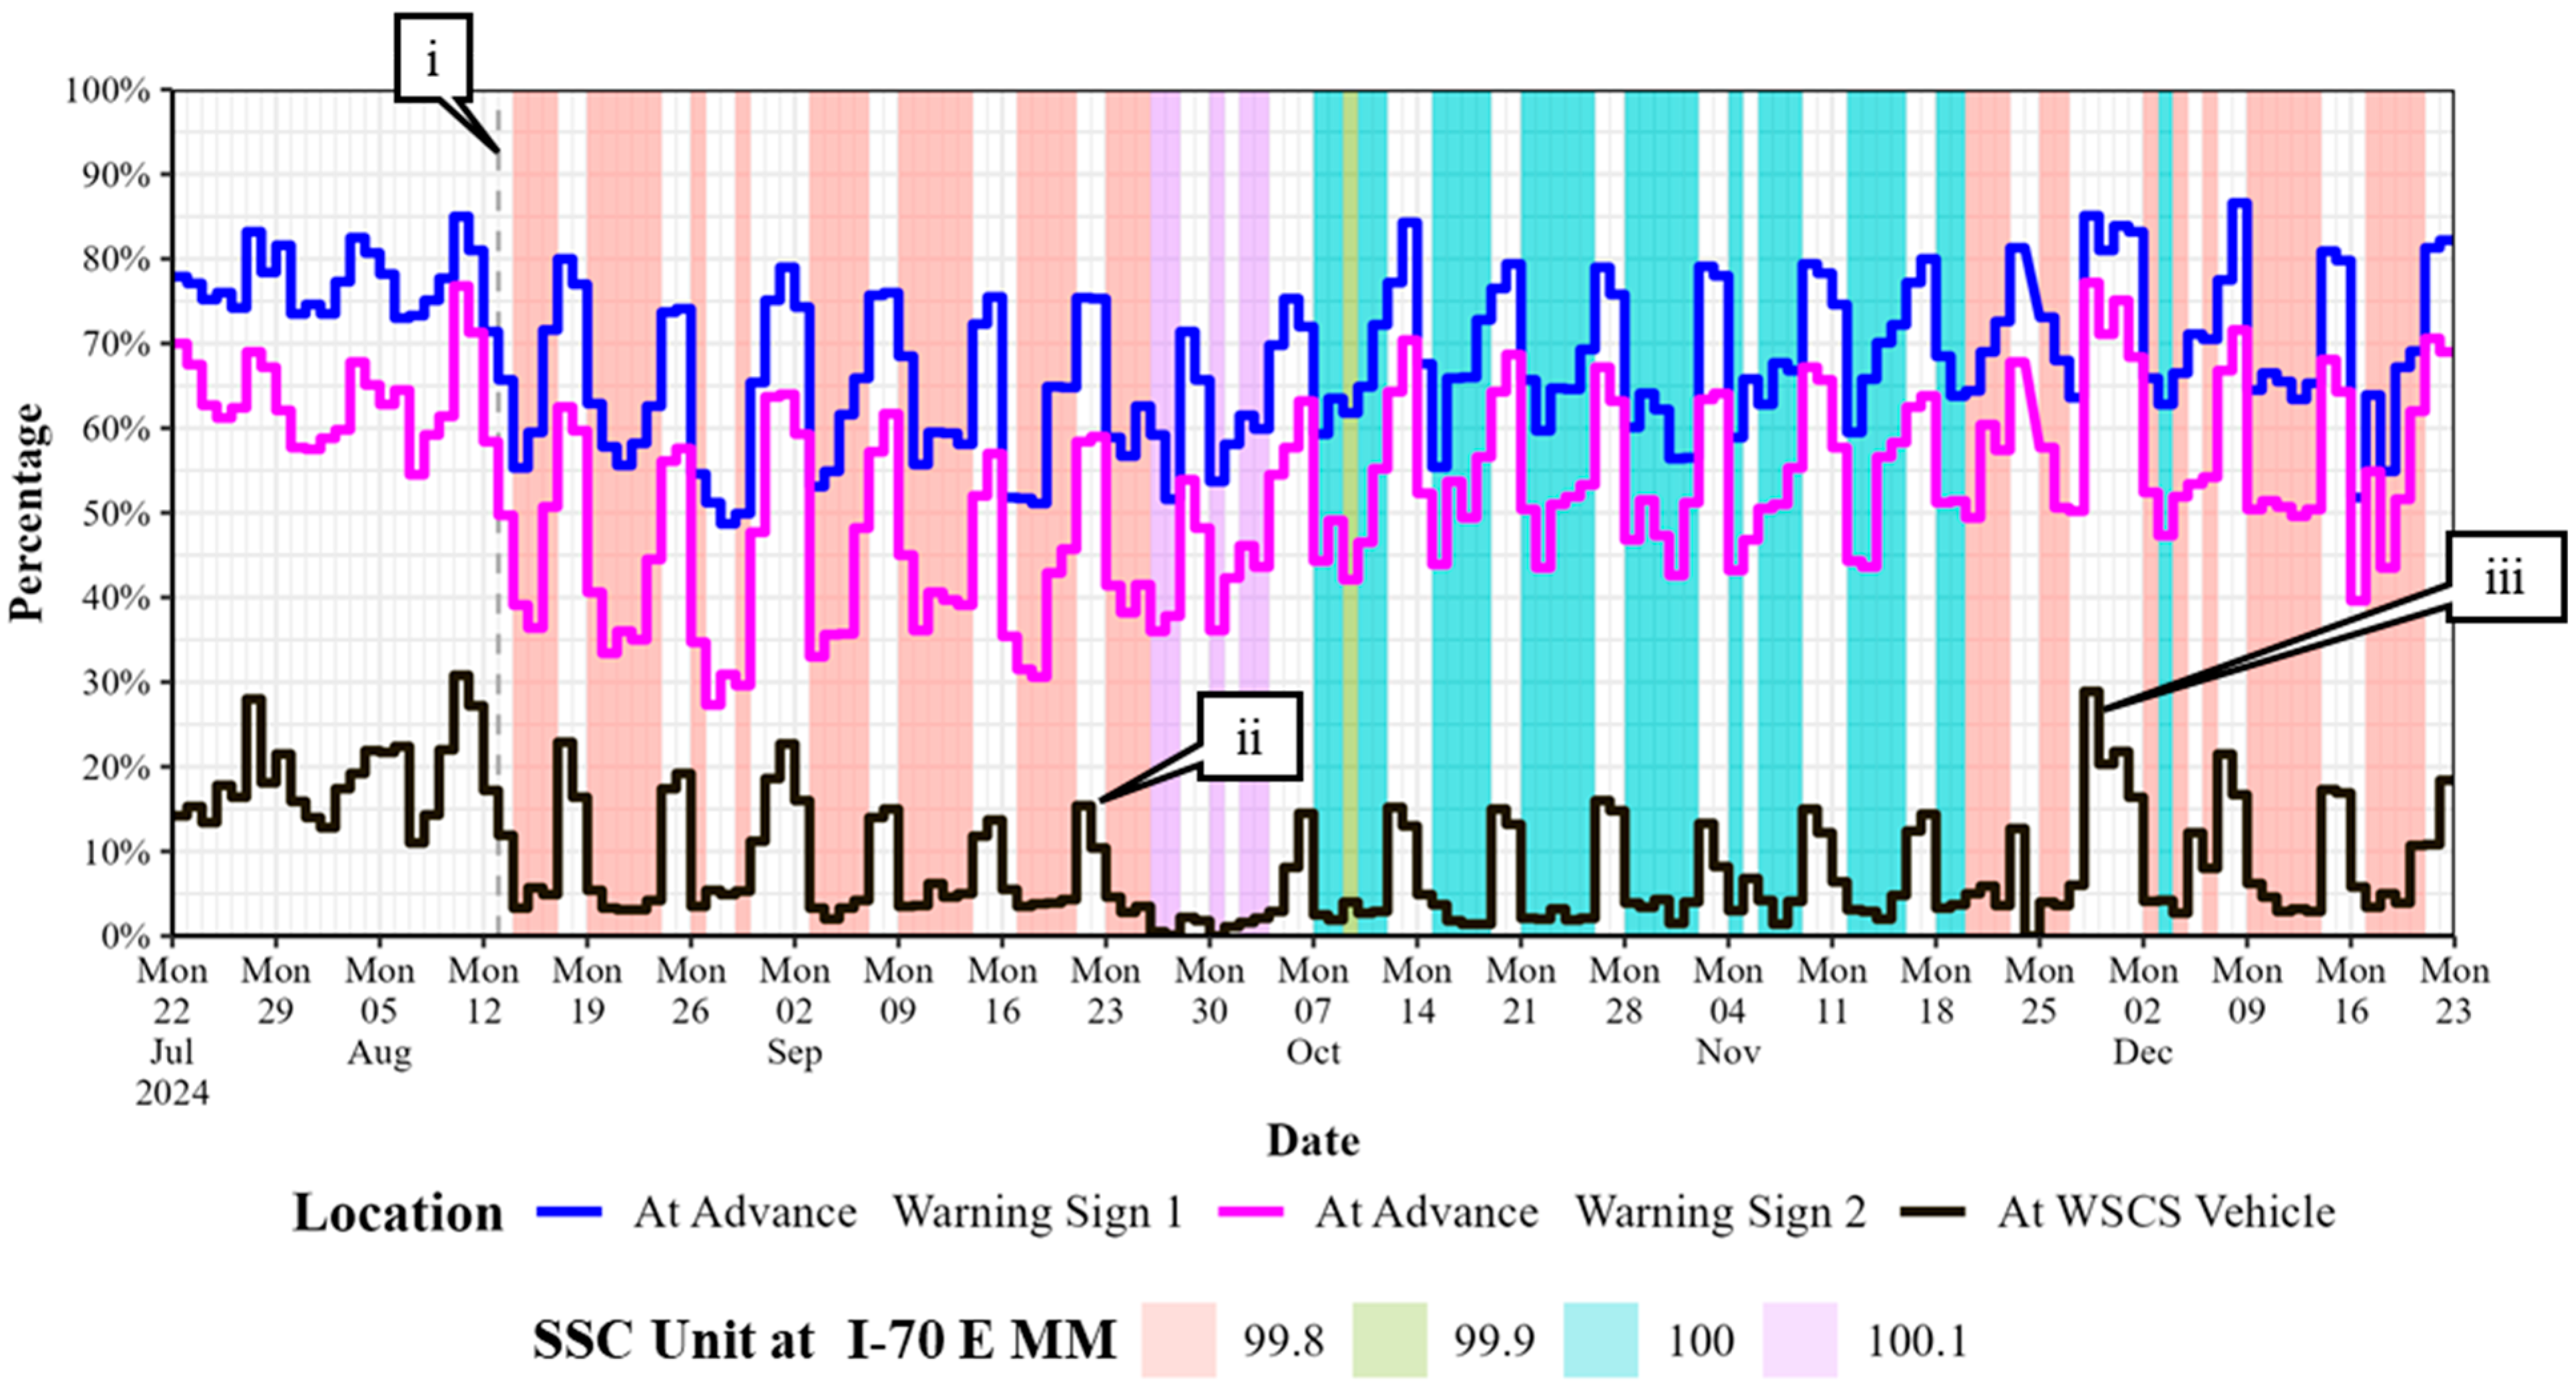
Similar analyses of speed compliance trends can be performed over a multi-week and even months-long time period to gain insights into longitudinal changes or patterns in speed compliance. Figure 7 shows a 5-month plot of speed compliance trends (% of speeds 11 mph or more over WS speed limit) at the MM locations of the two fixed advance warning signs, as well as the various MM locations along the WS where the SSC unit was deployed over the course of the pre-enforcement period.
Figure 7.
Longitudinal trends on speed compliance (% at or more than 11 mph of WS speed limit) at advance warning signs and SSC unit locations for I-70 EB worksite.
Callout i points to the date 13 August 2024, on which advance warning signs were installed on the worksite on I-70 EB in Hancock County, Indiana, with the first SSC session beginning the next day []. The solid black line indicates a daily value of the percentage of speed records detected in the SSC unit’s MM location that were 11 mph or more above the WS speed limit. Similarly, the solid blue and pink lines indicate this percentage of speed records at the MM location of the first and second fixed advance warning sign, respectively. Shaded regions of the plot indicate days on which active SSC was present, with the color of the shaded region representing one of four unique MM locations where the SSC unit was situated over this worksite’s 5-month study period.
Out of a total of 78 unique deployment days (81 sessions) on I-70 EB, the earliest recorded start time of a deployment was 7:54 AM, while the latest recorded end time of a deployment was 4:17 PM. A significant majority of the deployment sessions were nominally active in the 8 AM–3:30 PM timeframe. I-70 E witnessed active SSC for a total of 78 unique days in the period ranging from 14 August to 20 December 2024.
A decrease in the percentage of speeds (at or more than 11 mph above the WS speed limit) is evident on days of active SSC from Figure 7, with rebounds seen over the weekend (callout ii). Sustained periods of absence in active SSC led to a more significant rebound in the percentage of CV speed records at or more than 11 mph above the WS speed limit at the unit location (callout iii). Of particular note is the trend in decrease in speeds moving from the location of the first advance warning sign to the second and finally to the SSC unit location, highlighting the importance of positioning sufficient advance warning signage to give motorists enough notice to be able to reduce their speeds when entering a worksite.
3.1.2. Longitudinal Trends in Speed Compliance for Entire Worksite
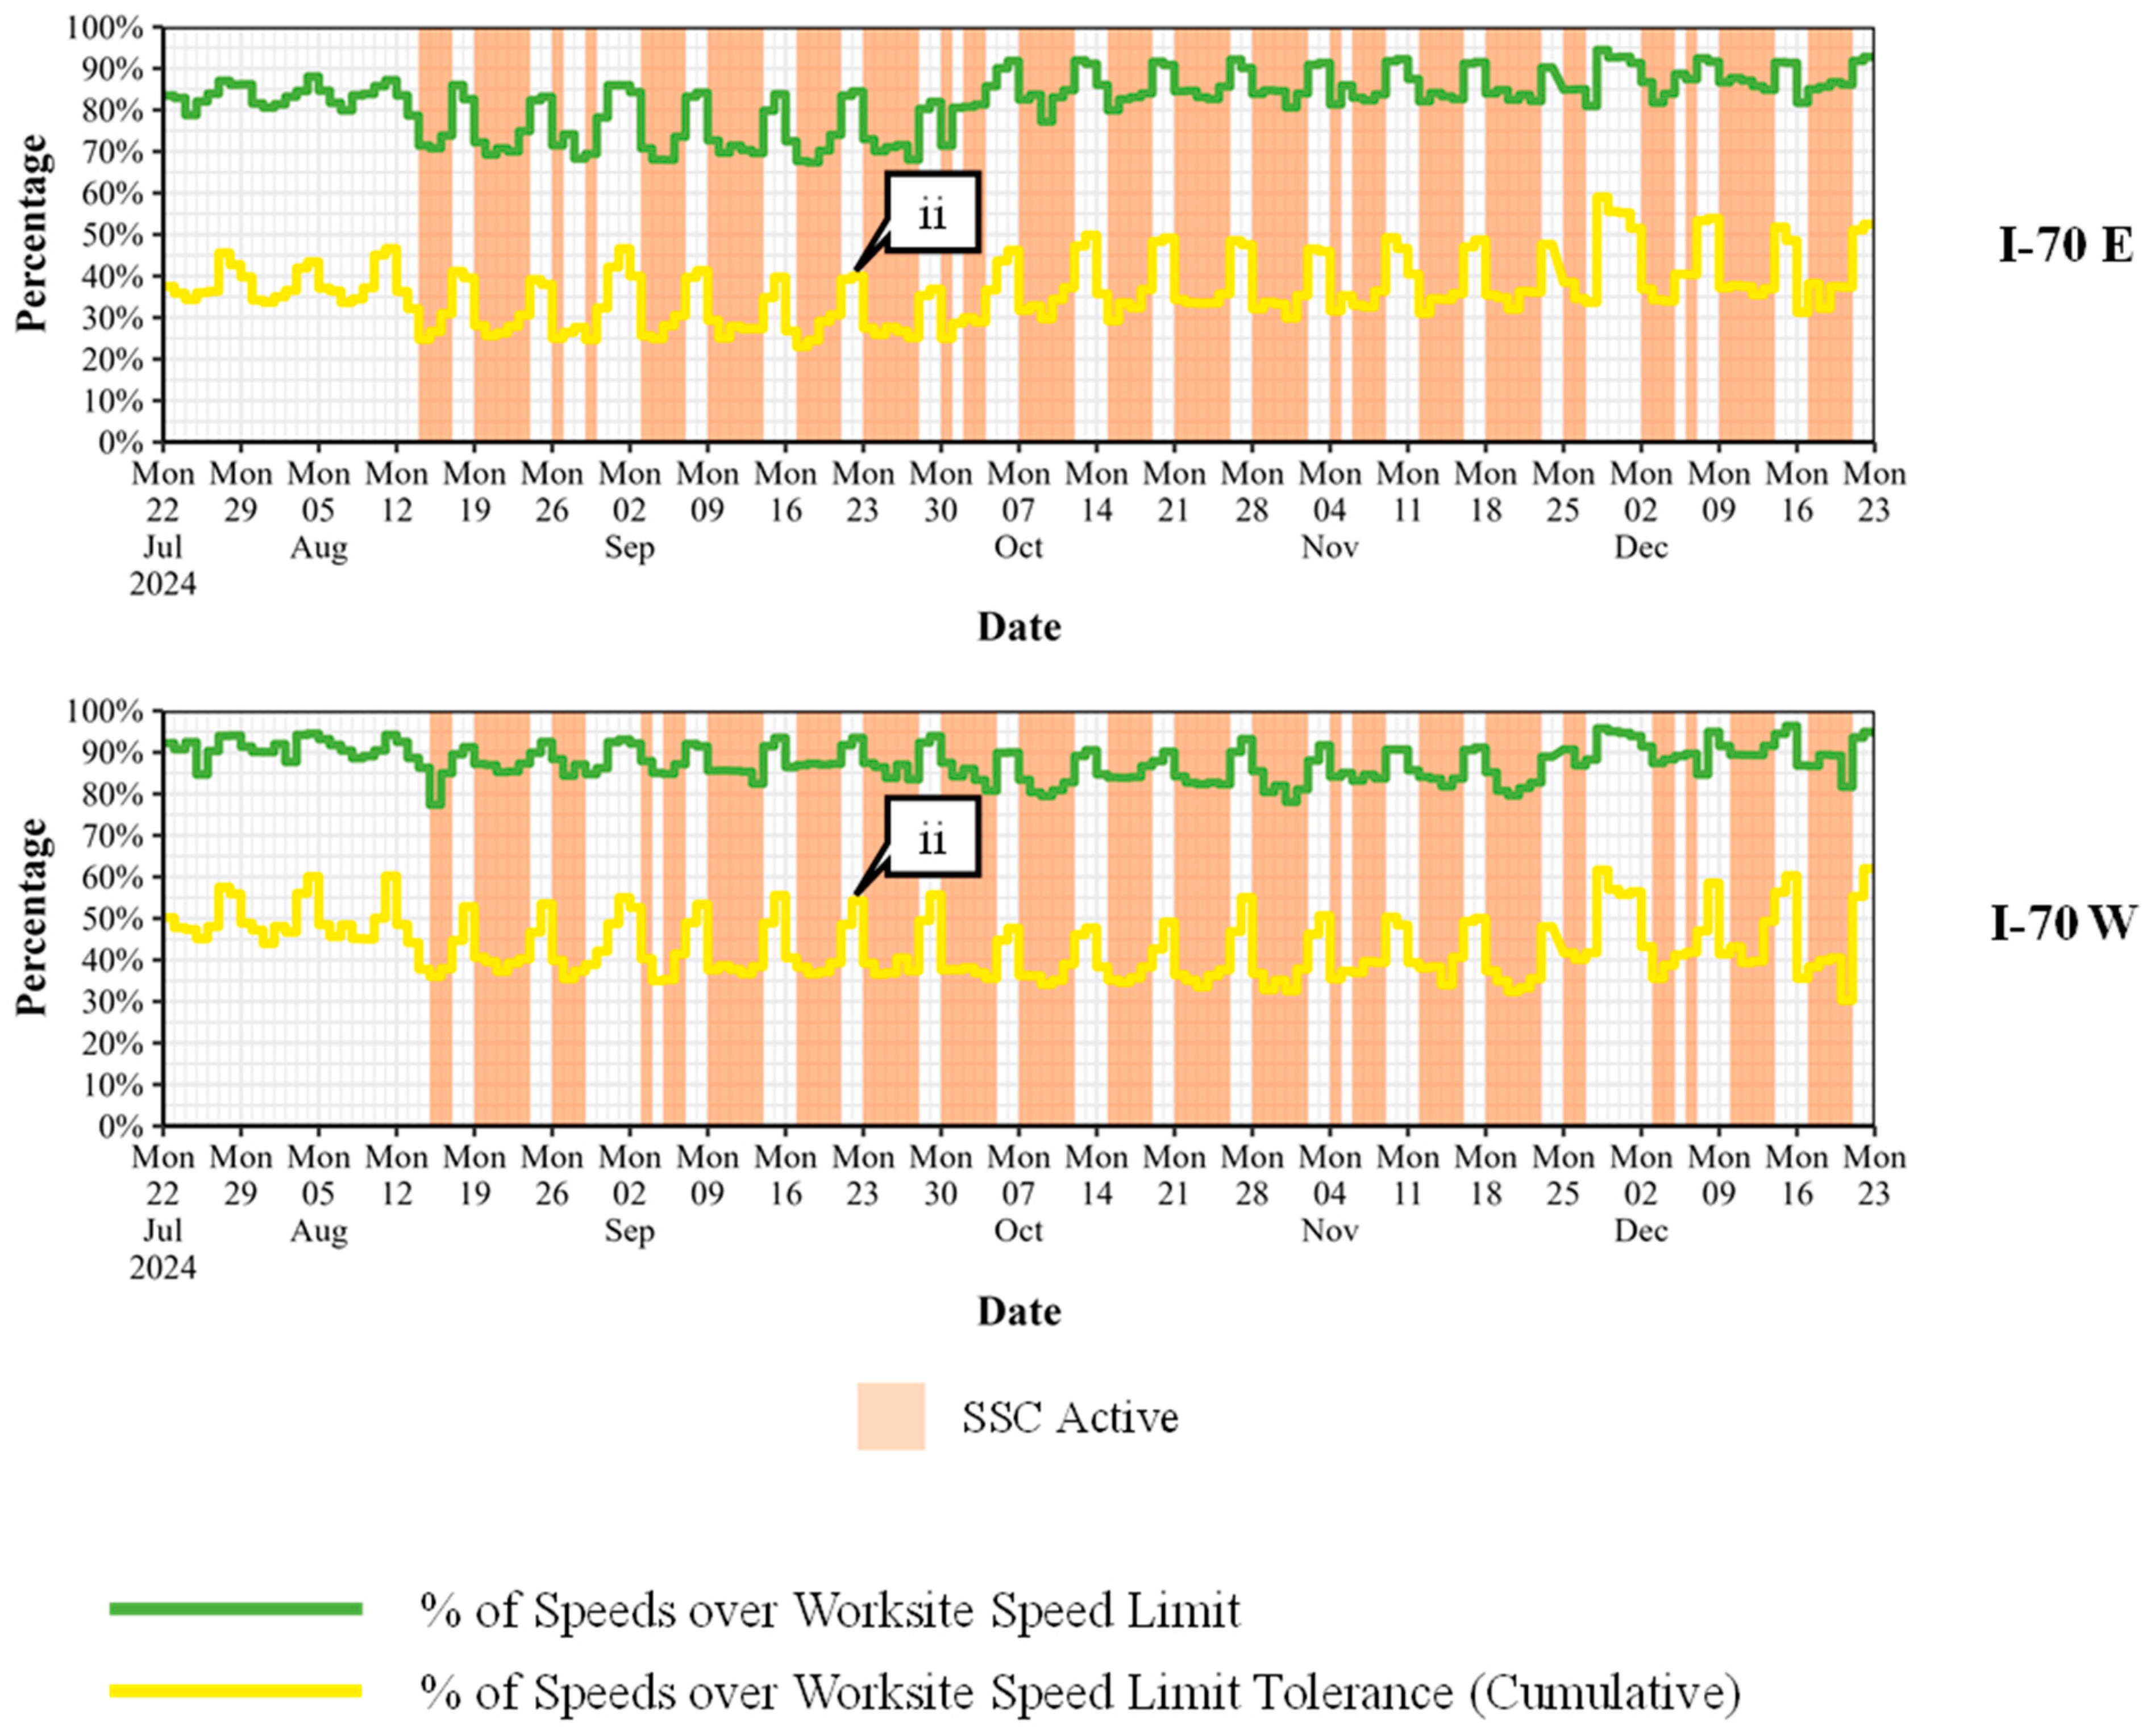
Figure 8 shows a similar visualization but considers all 10 miles of the I-70 worksite in each direction of travel for calculating daily percentages of CV speed records over the WS speed limit and over the WS speed limit tolerance. Similar rebounds over each weekend are seen in percentages of speeds higher than the tolerance, with numbers going down during days of active SSC. It is encouraging to see that the impact of SSC propagates to the entire worksite and is not spatially limited to the locations where the SSC unit is positioned. Callout ii points to the same weekend highlighted by the detailed speed proportion plots earlier in Figure 6.
Figure 8.
Longitudinal trends on speed compliance for entire I-70 worksite MM 95-105.
3.2. Evaluating Speed Compliance over All 24 Hours for Both Cars and Commercial Trucks
The preceding text showed detailed insights into the spatial and temporal impacts of SSC activity on the I-70 worksite during hours of active SSC. Widely available CV data can be utilized to document speed reductions across the entire worksite over all 24 h of the day to understand if the impacts of an SSC session spill over into the remaining miles of a worksite, and the remaining hours of a day when no SSC unit is present. As all SSC deployments were only carried out on weekdays when workers were present at the worksite, CV data from only weekdays is considered for this part of the analysis for a more direct before–after comparison.
In order to obtain a more holistic view of speed compliance trends within a worksite and an SSC unit’s impacts outside of actual SSC times, a 24 h analysis of speed compliance trends is presented in this section. Five different time periods are defined covering the 24 h timeframe: 12 AM–6 AM, 6 AM–10 AM, 10 AM–2 PM, 2 PM–6 PM, and 6 PM–12 AM. The first and final period witnessed no active SSC during the analysis period but served to provide a glimpse into the rollover impact, if any, of active SSC into the overnight hours. All SSC activities were performed in one or more of the middle three time periods from 6 AM to 6 PM.
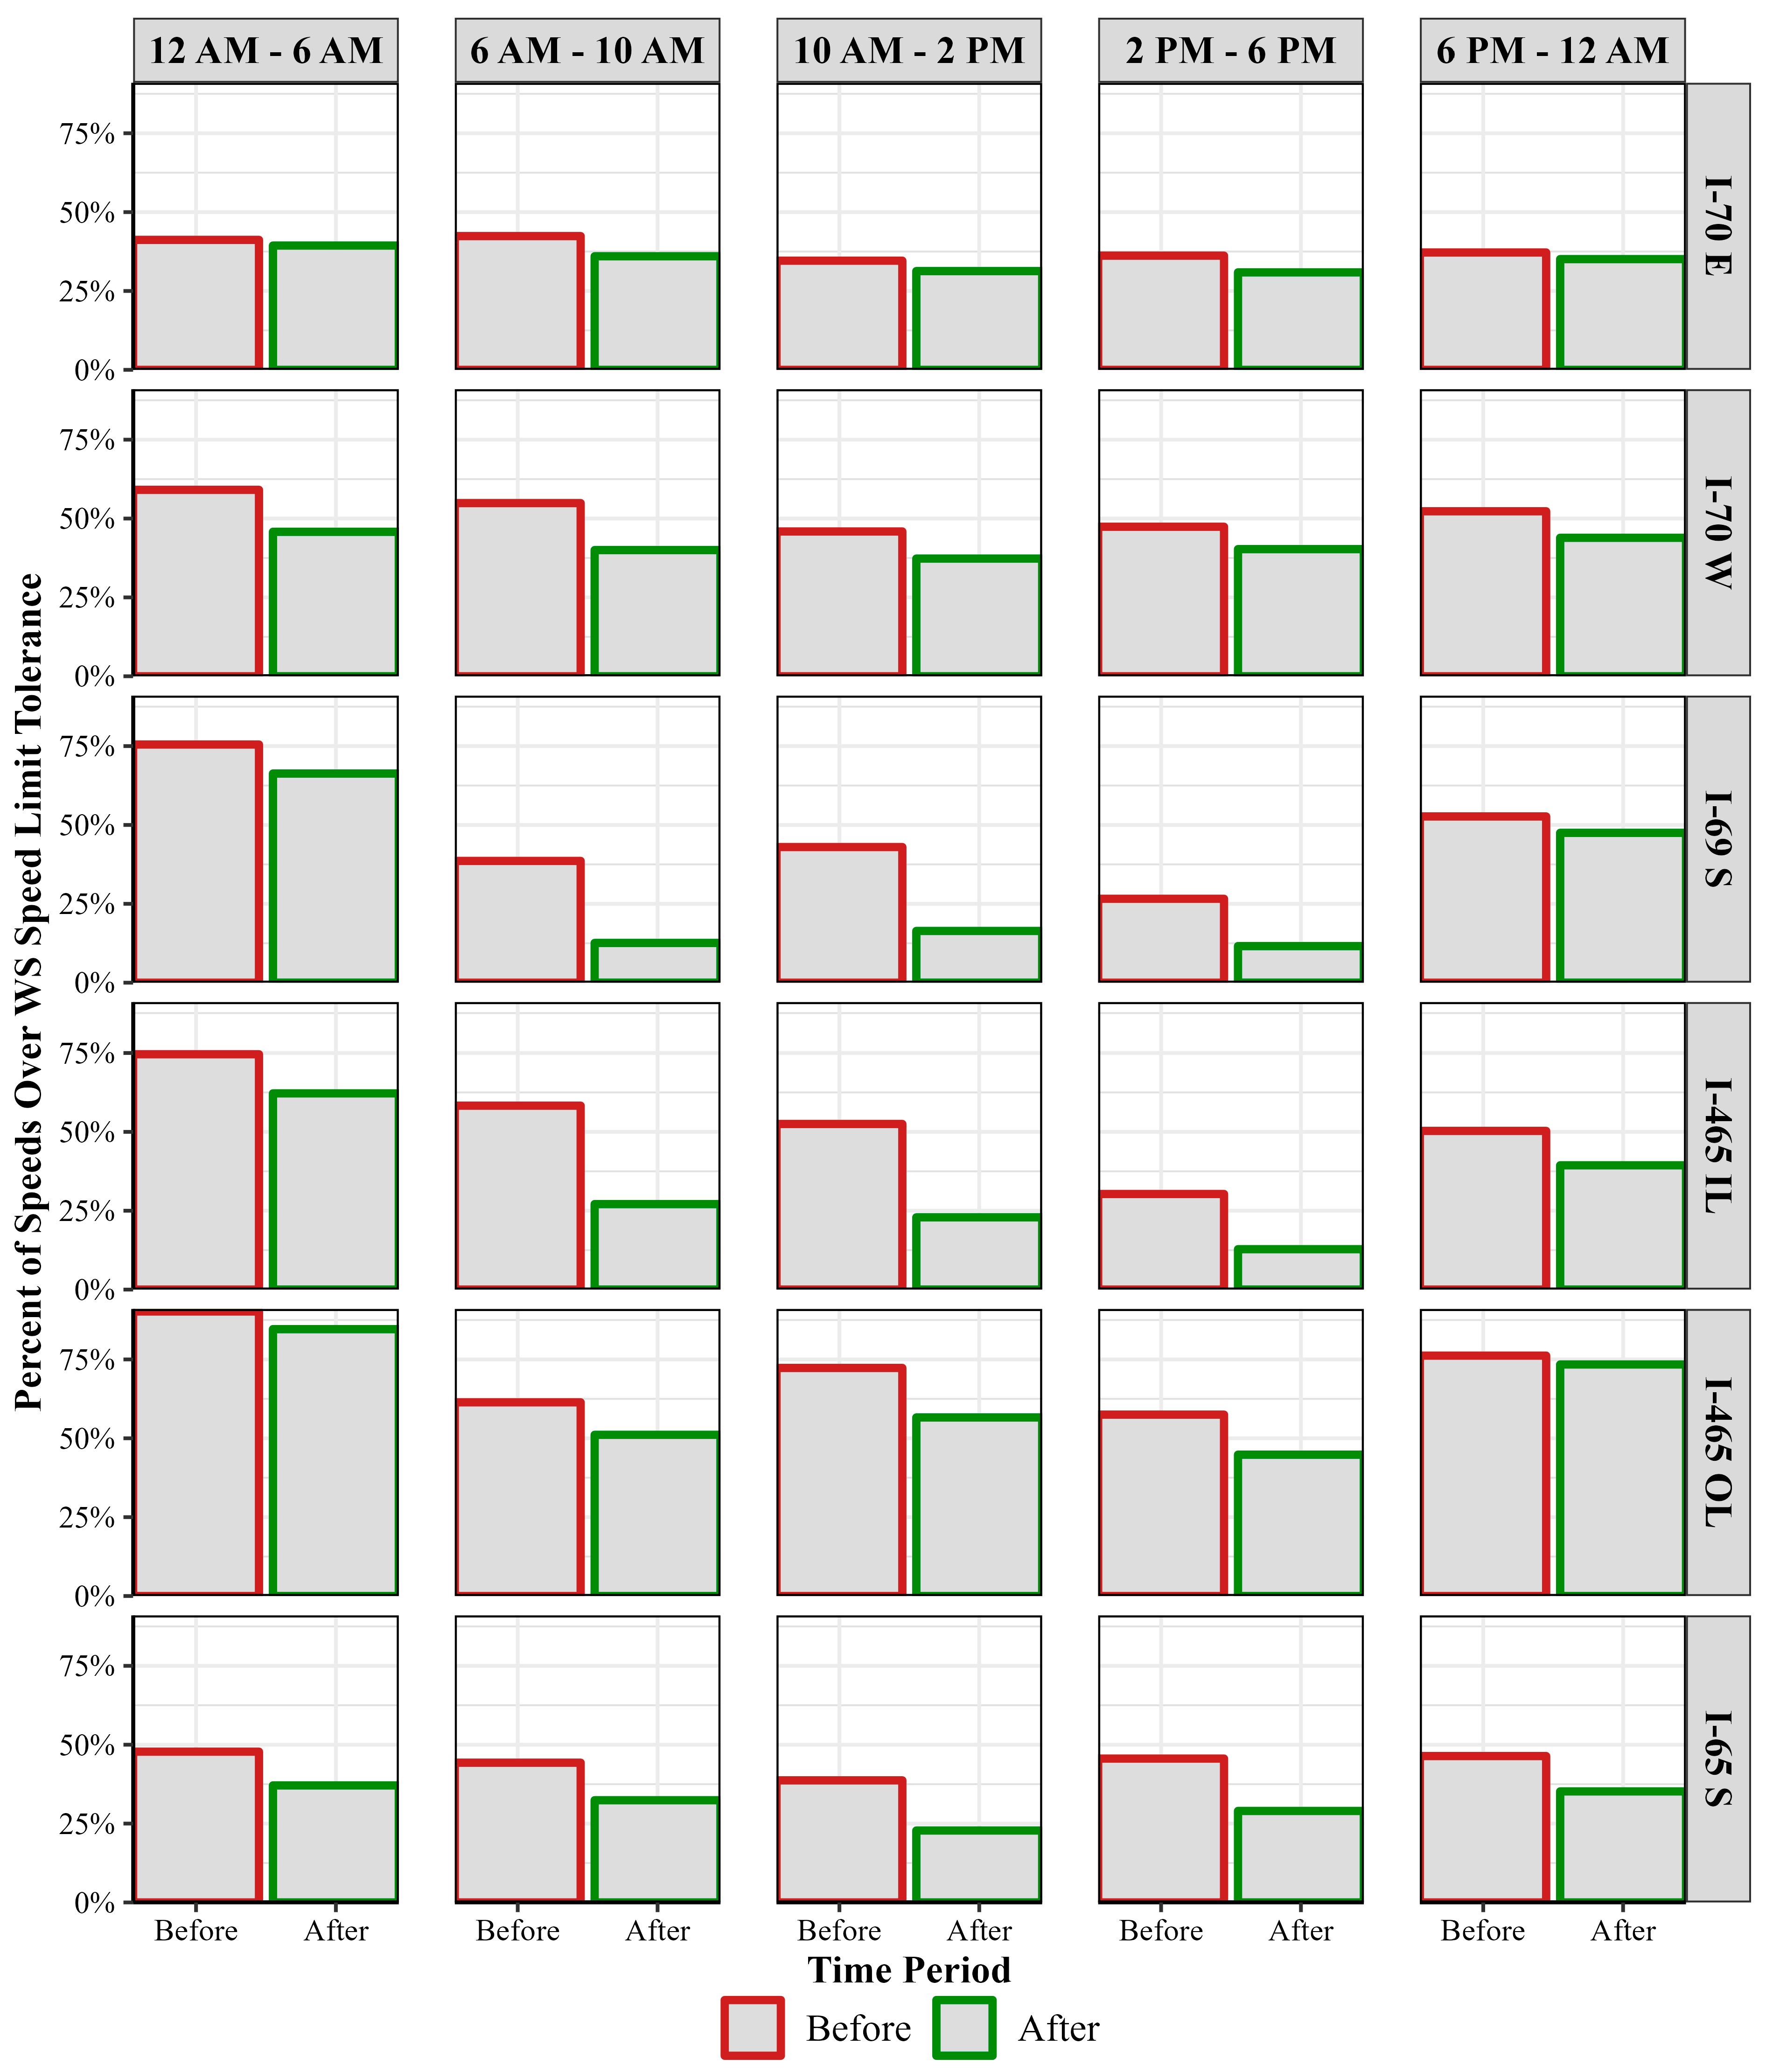
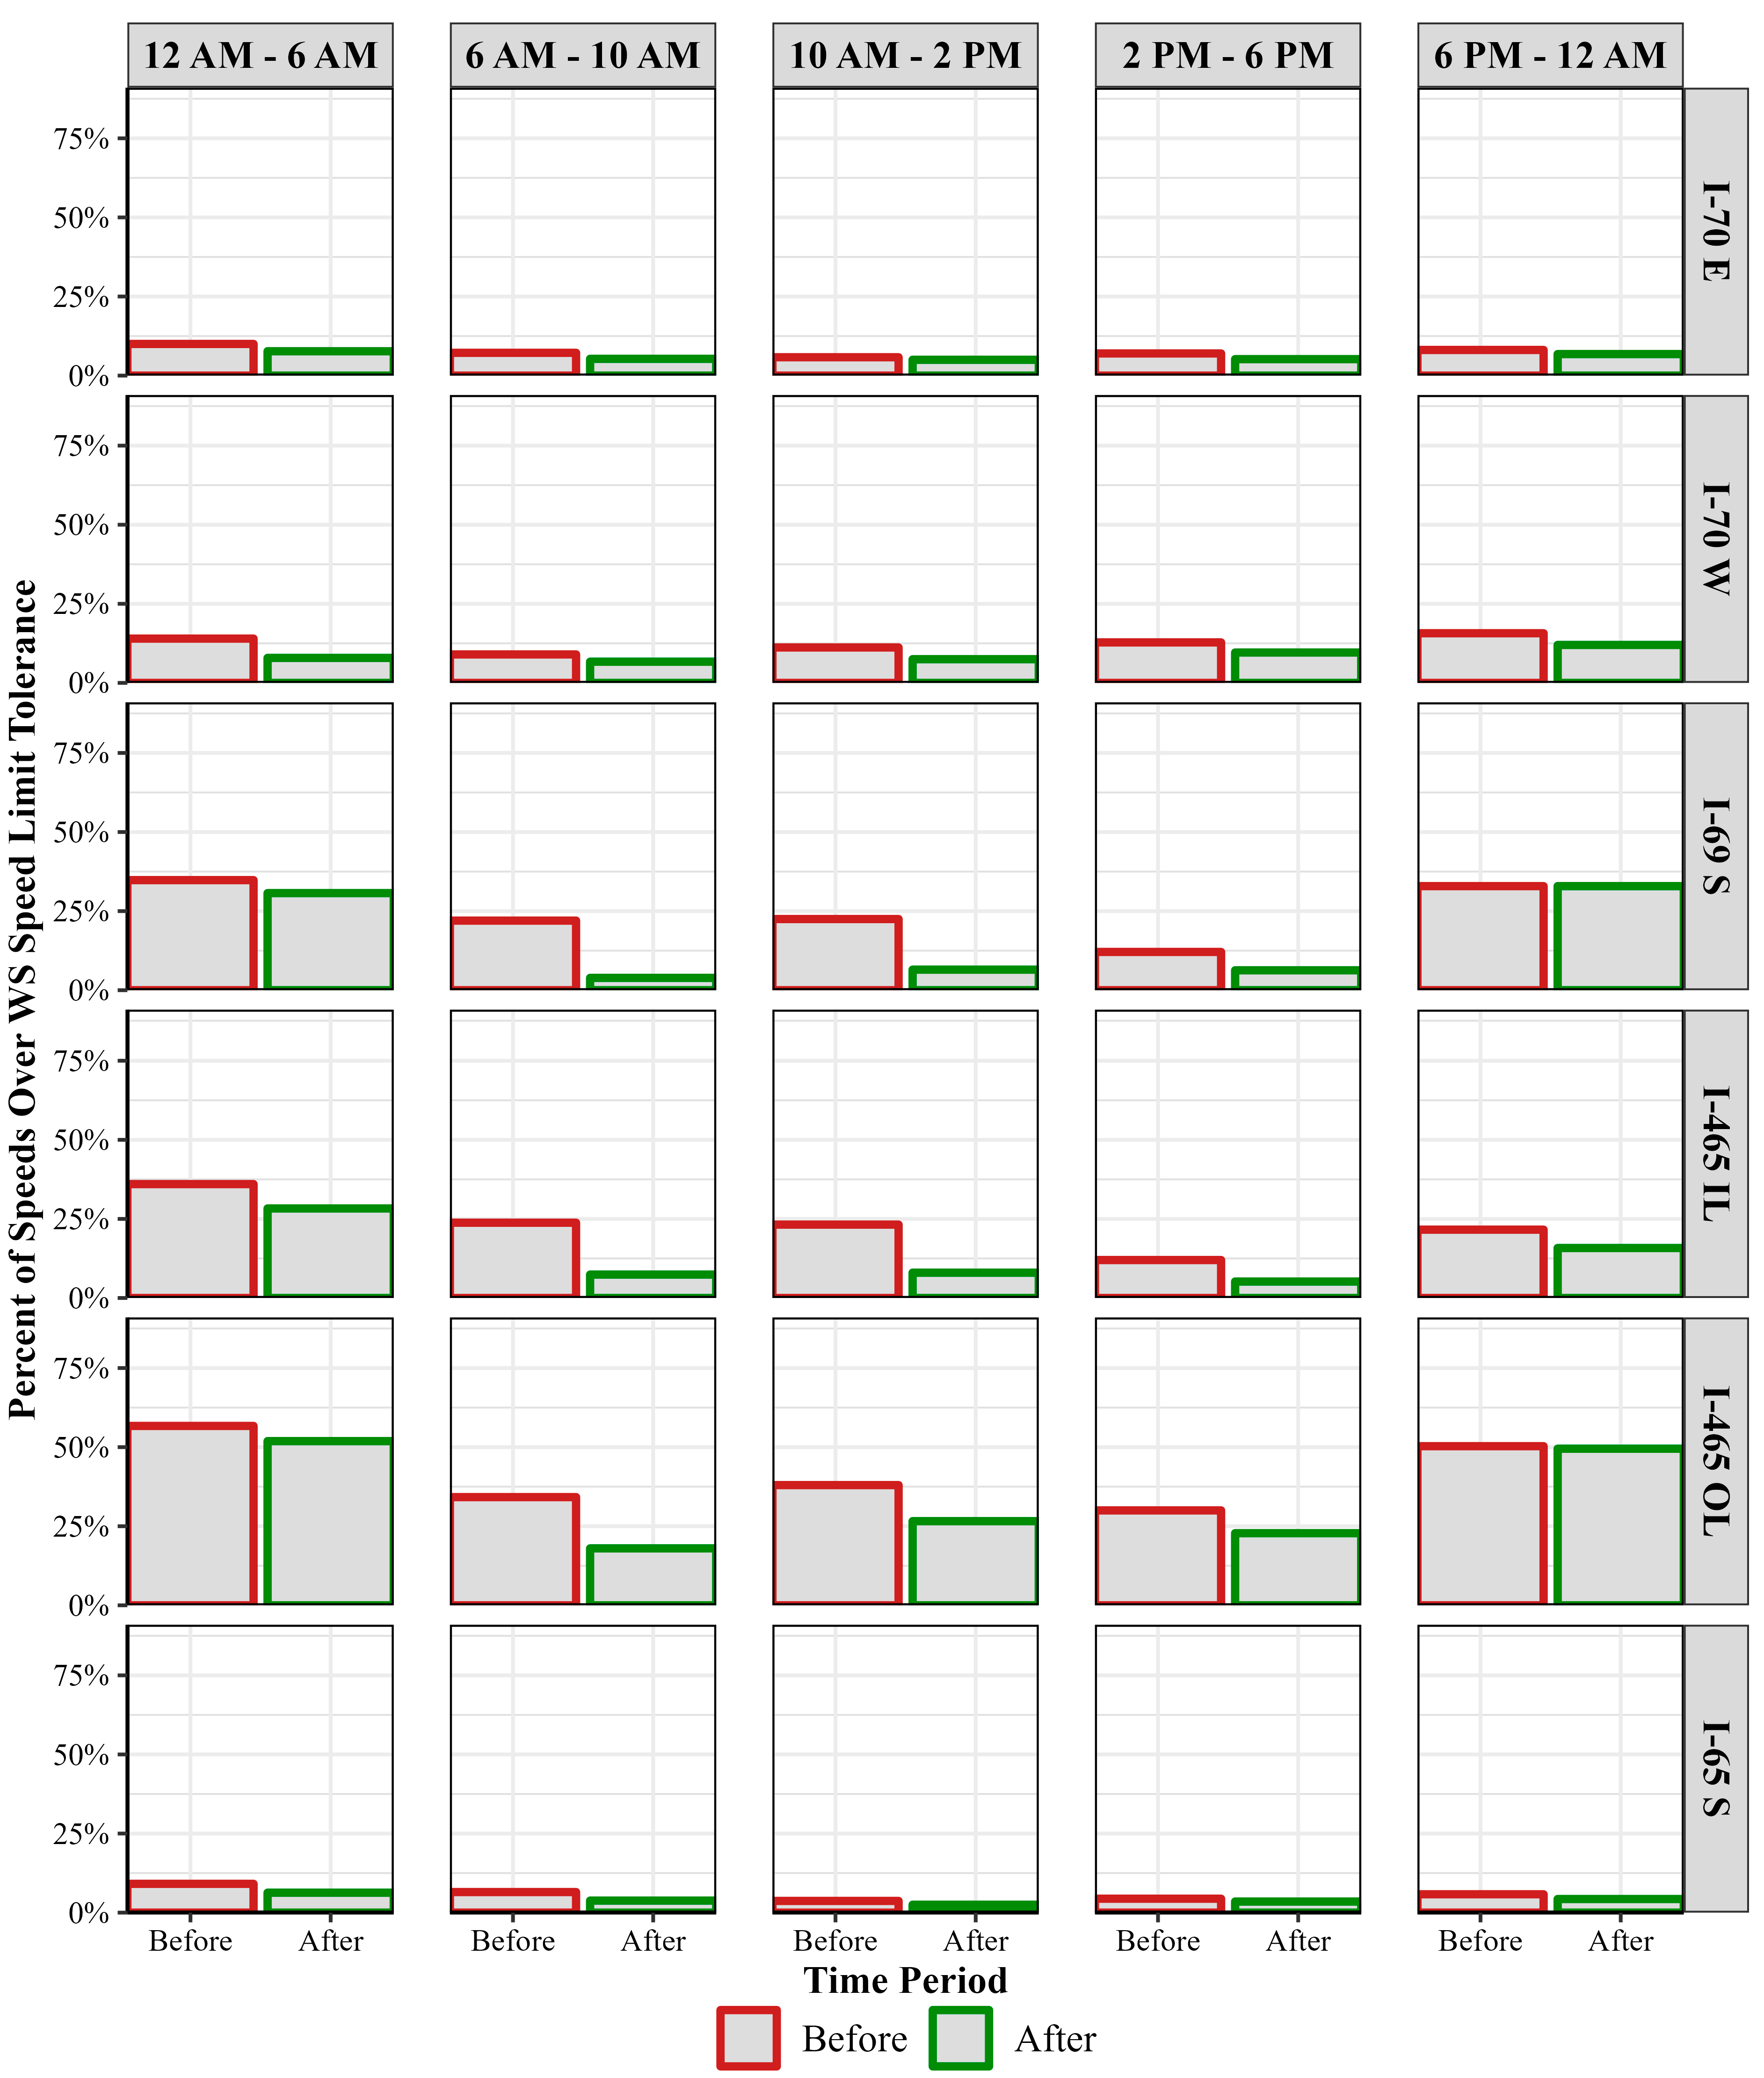
Similarly to the analysis presented in Figure 6, a more complete comparison can be conducted by pulling CV data for all 24 h within each worksite, categorizing them into the five time periods, and computing aggregate percentage values of the number of CV speed records that are 11 mph or more over the WS speed limit. These percentages for passenger vehicle speeds as well as commercial truck speeds are shown in Figure 9 and Figure 10, respectively.
Figure 9.
Percent of passenger vehicle speeds over WS speed limit tolerance for entire WS (weekdays).
Figure 10.
Percent of commercial truck speeds over WS speed limit tolerance for entire WS (weekdays).
The ‘Before’ time period in each case refers to weekdays before any fixed signs were installed and before any active SSC was begun in the worksite. The ‘After’ time period in each case refers to weekdays where active SSC was performed in the worksite with advance warning signs installed. The ‘Before’ period for each route includes data from 13 (I-65 S), 16 (I-70 E), 17 (I-70 W), and 20 (I-69 S, I-465 IL, I-465 OL) days, respectively. The ‘After’ period contains varying day counts based on the number of active deployments, as shown by the last column in Table 2 and Table 3. A total of 104 million passenger vehicle records and 3.3 million commercial truck records were utilized for this 24 h analysis across all worksites.
Among passenger vehicles, the percentage of CV speed records is 11 mph or greater than the WS speed limit prior to any sign installation, and SSC ranged from 41% to 65% on average across all worksites and time periods. Correspondingly, for days of active SSC, these numbers ranged on average from 28% to 56% across all worksites and time periods.
For passenger vehicles, the two largest absolute drops in percentage of speed records 11 mph or greater than the WS speed limit were seen on the I-465 IL worksite for the 6 AM–10 AM (drop from 58% to 27%) and 10 AM–2 PM (drop from 52% to 23%) time periods. Correspondingly, for commercial trucks, the two largest absolute drops were seen on the I-69 S worksite (drop from 22% to 4%) and the I-465 IL worksite (drop from 24% to 7%), both in the 6 AM–10 AM time period.
In each case, the most significant reductions are seen in the time periods from 6 AM to 6 PM, which is when 100% of the active SSC sessions took place.
In general, and as evidenced by Figure 9 and Figure 10, the percentage of commercial truck speeds 11 mph or more above the WS speed limit is significantly lower than that of passenger vehicles. On average across all worksites and time periods, the percentage of commercial truck speed records 11 mph or greater than the WS speed limit was 19.3% before, compared to 13.6% after. Correspondingly, for passenger vehicles, the percentages were 51.1% before and 38.9% after.
A one-tailed two-proportion Z-test was selected to compare the percentage of speed records greater than or equal to the WS speed limit + 11 mph in the before and after periods. The proportions in each period (Pb,Pa) and the null (H0) and alternative (Ha) hypotheses are defined below.
Pb: Percentage of speed records >= WS speed limit + 11 mph in the before period;
Pa: Percentage of speed records >= WS speed limit + 11 mph in the after period;
H0: Pb = Pa (no change in speed compliance);
Ha: Pb > Pa (increase in speed compliance in the after period).
4. Discussion
Table 2 and Table 3, respectively, present summary statistics on the percentage change in the percentage of speeds 11 mph or more over the WS speed limit on weekdays for passenger cars and commercial trucks shown in Figure 9 and Figure 10. The first column in each table lists the different worksites and direction of travel analyzed, along with the period of analysis. The middle columns indicate this observed percentage change for each of the five time periods that the analysis was categorized into. The final column lists the number of unique days where active SSC was present on each worksite. The I-70 worksite witnessed 78 days of active SSC in the Fall of 2024. I-69 and I-465 both observed more than 90 days of active SSC in the first half of 2025.
The time periods of 6 AM–6 PM on average showed the highest speed reductions for both passenger cars as well as commercial trucks. This is expected as all of the SSC deployments were within this time period. However, even though none of the SSC deployments were in either of the 12 AM–6 AM or 6 PM–12 AM time periods, there is still an observable impact and reduction in the percentage of speed records 11 mph or greater than the WS speed limit in those time periods. This illustrates the residual impacts of SSC activity even outside of active SSC times. For passenger vehicles, every single time period and worksite combination sees a reduction in the percentage of speed records 11 mph or greater than the WS speed limit on days with active SSC (Table 2).
A variety of factors may have influenced the variability in speed reductions across worksites as well as times of day, ranging from work zone characteristics, driver familiarity, commuter traffic, seasonality, to the spatial and temporal regularity and frequency of SSC deployment. This study was particularly aimed at performing a program-level systematic before–after evaluation of the impact of SSC on CV speeds. Future research may look towards identifying the impacts of each of the above, coupled with SSC, on traffic speeds.
As market penetration rates and OEM diversity for CV data providers continue to increase, the generalizability and repeatability of these results and methodologies will be similarly aided. Finally, the state’s annual report also documents a 10 to 19% reduction in crashes in worksites with active SSC [], showing the significant potential safety impacts of SSC.
Table 2.
Percentage change in passenger vehicle speeds over WS speed limit tolerance (weekdays).
Table 2.
Percentage change in passenger vehicle speeds over WS speed limit tolerance (weekdays).
| Route | Analysis Period | 12 AM–6 AM | 6 AM–10 AM | 10 AM–2 PM | 2 PM–6 PM | 6 PM–12 AM | Days with Active SSC |
|---|---|---|---|---|---|---|---|
| I-70 E | 22 July 2024–22 December 2024 | −4.5 | −15.1 | −9.6 | −14.7 | −5.5 | 78 |
| I-70 W | 22 July 2024–22 December 2024 | −22.4 | −26.8 | −18.5 | −14.4 | −16.1 | 77 |
| I-69 S | 9 December 2024–13 July 2025 | −12.1 | −67.4 | −61.8 | −56.3 | −9.9 | 98 |
| I-465 IL | 9 December 2024–13 July 2025 | −16.7 | −53.5 | −56.3 | −57.7 | −21.6 | 93 |
| I-465 OL | 9 December 2024–13 July 2025 | −6.2 | −16.7 | −21.8 | −22.2 | −3.7 | 92 |
| I-65 S | 28 April 2025–13 July 2025 | −22.5 | −26.8 | −41.1 | −36.5 | −24.1 | 5 |
Table 3.
Percentage change in commercial truck speeds over WS speed limit tolerance (weekdays).
Table 3.
Percentage change in commercial truck speeds over WS speed limit tolerance (weekdays).
| Route | Analysis Period | 12 AM–6 AM | 6 AM–10 AM | 10 AM–2 PM | 2 PM–6 PM | 6 PM–12 AM | Days with Active SSC |
|---|---|---|---|---|---|---|---|
| I-70 E | 22 July 2024–22 December 2024 | −23.2 | −26.7 | −14.4 | −26.5 | −16.5 | 78 |
| I-70 W | 22 July 2024–22 December 2024 | −42.4 | −24.9 | −32.6 | −23.5 | −21.8 | 77 |
| I-69 S | 9 December 2024–13 July 2025 | −11.8 | −82.4 | −71.0 | −48.2 | 0.1 | 98 |
| I-465 IL | 9 December 2024–13 July 2025 | −21.4 | −69.1 | −65.6 | −56.6 | −27.0 | 93 |
| I-465 OL | 9 December 2024–13 July 2025 | −8.5 | −47.3 | −30.1 | −24.1 | −1.6 | 92 |
| I-65 S | 28 April 2025–13 July 2025 | −30.6 | −41.7 | −32.3 | −20.5 | −26.1 | 5 |
5. Conclusions
Indiana deployed SSCs on 4 interstate construction zones and on approximately 443 deployment days over the past 13 months. To quantify the impact of this deployment, approximately 104 million passenger vehicle records and 3 million commercial truck records corresponding to these construction zones were analyzed. That Connected Vehicle data was used to count the number of spot speeds, linearly referenced to 0.1-mile intervals, that were 11 mph or more over the worksite speed limit over the entire worksite. The length of those worksite study segments ranged from 3 to 10 miles, with sites spread across 3 counties—Marion, Hancock and Lake.
Across 443 SSC deployment days between 14 August 2024 and 11 July 2025, the study found the following:
- Speed compliance gradually increased longitudinally from the location of the first fixed advance warning sign until the SSC unit’s location. This study documents the impact of advance warning signs on speed reduction.
- The analysis found a 34% reduction on average in the percentage of passenger vehicle speeds exceeding the worksite speed limit by 11 mph or more on weekdays between 6 AM and 6 PM (Table 2).
- For commercial trucks, there was a 41% reduction on average between 6 AM and 6 PM across the four study sites (Table 3).
- There were no deployments on any of the worksites from 12 AM to 6 AM or from 6 PM to 12 AM. Even so, there are clearly substantive impacts on the speeds even in periods where there is no visible SSC. For example, when looking at the I-465 Inner Loop, the 10 AM–2 PM time period observed 56% to 66% reductions in the percentage of speeds 11 mph or greater than the WS speed limit for passenger vehicles and commercial trucks, respectively, the 6 PM–12 AM hours still witnessed a 22% to 27% reduction in the percentage of speeds 11 mph or greater than the WS speed limit (Table 2 and Table 3)
- There was a significant increase in speed reductions when the Pilot Program moved from a pre-enforcement period to mailing warnings over the course of the past 13 months, as evidenced by the increasing percentage reductions seen in Table 2 and Table 3 from the I-70 E worksite to the most recent I-65 S worksite.
In summary, the analysis presented by this study provides practitioners with a scalable methodology and reporting framework to quantitatively evaluate the effectiveness of their SSC deployments with widely available CV data. The analysis examined speed compliance trends not just at the SSC location but throughout the entire worksite, for all 24 h of the day.
While this evaluation was focused on documenting changes in speed compliance trends, future evaluations may incorporate enhanced safety datasets, such as hard-braking and hard-acceleration, to also evaluate changes in safety performance with active SSCs. Secondly, future evaluations may also look at incorporating crash incident data, environmental factors, and work zone geometry, for example, to illustrate the impact of each on traffic speeds. Finally, the study team recommends longitudinally monitoring these speed trends over time to understand the long-term impacts of SSCs on driver behavior and the sustainability of reported speed reductions over time.
Author Contributions
Conceptualization, J.M., D.M.B., B.S., R.S.S. and J.D.; methodology, J.M., D.M.B., B.S., R.S.S. and J.D.; validation, J.M., D.M.B., B.S., R.S.S. and J.D.; formal analysis, D.M.B., R.S.S. and J.D.; investigation, J.M., D.M.B., B.S., R.S.S. and J.D.; resources, J.M., D.M.B., B.S., R.S.S. and J.D.; data curation, J.M., D.M.B., B.S., R.S.S. and J.D.; writing—original draft preparation, J.M., D.M.B., B.S., R.S.S. and J.D.; writing—review and editing, J.M., D.M.B., B.S., R.S.S. and J.D.; visualization, J.M., D.M.B., B.S., R.S.S. and J.D.; supervision, D.M.B.; project administration, D.M.B.; funding acquisition, D.M.B. All authors have read and agreed to the published version of the manuscript.
Funding
Project was funded via Joint Transportation Research Program Project SPR 4933, Sponsored by the Indiana Department of Transportation.
Institutional Review Board Statement
Not applicable.
Informed Consent Statement
Not applicable.
Data Availability Statement
The original contributions presented in this study are included in the article. Further inquiries can be directed to the corresponding author.
Acknowledgments
Connected Vehicle trajectory data used in this study were provided by Streetlight Data, Inc. Connected truck data used in this study were provided by Omnitracs. The Google Cloud Platform was utilized for cloud database warehousing and analytics. The contents of this paper reflect the views of the authors, who are responsible for the facts and the accuracy of the data presented herein, and do not necessarily reflect the official views or policies of the sponsoring organizations. These contents do not constitute a standard, specification, or regulation. The authors affirm that no AI or LLMs were used in any capacity in the drafting of the contents of this manuscript.
Conflicts of Interest
Author Benjamin Snyder was employed by the company RK&K. Author John McGregor was employed by the Indiana Department of Transportation. The remaining authors declare that the research was conducted in the absence of any commercial or financial relationships that could be construed as a potential conflict of interest.
Abbreviations
The following abbreviations are used in this manuscript:
| CV | Connected Vehicle |
| DL | Deployment Log |
| FHWA | Federal Highway Administration |
| HEA | House Enrolled Act |
| IL | Inner Loop |
| INDOT | Indiana Department of Transportation |
| MM | Mile Marker |
| OALP | Office of Administrative Law Proceedings |
| OL | Outer Loop |
| PV | Program Vendor |
| SSC | Speed Safety Cameras |
| WSCS | Worksite Speed Control System |
| WS | Worksite |
References
- FHWA Work Zone Facts and Statistics—FHWA Office of Operations. Available online: https://ops.fhwa.dot.gov/wz/resources/facts_stats.htm#ftnref5 (accessed on 21 July 2025).
- Fatality and Injury Reporting System Tool (FIRST). Available online: https://cdan.dot.gov/query (accessed on 21 July 2025).
- Li, Y.; Bai, Y. Highway Work Zone Risk Factors and Their Impact on Crash Severity. J. Transp. Eng. 2009, 135, 694–701. [Google Scholar] [CrossRef]
- Mohammed, H.J.; Chang, Y.I.; Schrock, S.D. Factors Associated with Work Zone Crashes. Transp. Res. Rec. 2023, 2677, 224–235. [Google Scholar] [CrossRef]
- INDOT Work Zone Safety. Available online: https://www.in.gov/indot/safety/work-zone-safety/ (accessed on 21 July 2025).
- Nnaji, C.; Gambatese, J.; Lee, H.W.; Zhang, F. Improving Construction Work Zone Safety Using Technology: A Systematic Review of Applicable Technologies. J. Traffic Transp. Eng. 2020, 7, 61–75. [Google Scholar] [CrossRef]
- Ravani, B.; Wang, C. Speeding in Highway Work Zone: An Evaluation of Methods of Speed Control. Accid. Anal. Prev. 2018, 113, 202–212. [Google Scholar] [CrossRef] [PubMed]
- Brewer, M.A.; Pesti, G.; SchneiderIV, W. Improving Compliance with Work Zone Speed Limits: Effectiveness of Selected Devices. Transp. Res. Rec. 2006, 1948, 67–76. [Google Scholar] [CrossRef]
- LIN, P.-W.; KANG, K.-P.; CHANG, G.-L. Exploring the Effectiveness of Variable Speed Limit Controls on Highway Work-Zone Operations. J. Intell. Transp. Syst. 2004, 8, 155–168. [Google Scholar] [CrossRef]
- Woo, T.H.; Ho, S.-M.; Chen, H.-L. Monitoring Displays Coupled with Speed Cameras: Effectiveness on Speed Reduction. Transp. Res. Rec. 2007, 2009, 30–36. [Google Scholar] [CrossRef]
- Soole, D.W.; Watson, B.C.; Fleiter, J.J. Effects of Average Speed Enforcement on Speed Compliance and Crashes: A Review of the Literature. Accid. Anal. Prev. 2013, 54, 46–56. [Google Scholar] [CrossRef] [PubMed]
- Speed Safety Cameras|FHWA. Available online: https://highways.dot.gov/safety/proven-safety-countermeasures/speed-safety-cameras (accessed on 21 July 2025).
- Speed Safety Cameras (SSC) Transportation Research Synthesis|MnDOT Digital Library. Available online: https://mdl.mndot.gov/items/TRS2303 (accessed on 21 July 2025).
- Benekohal, R.F.; Chitturi, M.V.; Hajbabaie, A.; Wang, M.-H.; Medina, J.C. Automated Speed Photo Enforcement Effects on Speeds in Work Zones. Transp. Res. Rec. 2008, 2055, 11–20. [Google Scholar] [CrossRef]
- Medina, J.C.; Benekohal, R.F.; Hajbabaie, A.; Wang, M.-H.; Chitturi, M.V. Downstream Effects of Speed Photo–Radar Enforcement and Other Speed Reduction Treatments on Work Zones. Transp. Res. Rec. 2009, 2107, 24–33. [Google Scholar] [CrossRef]
- Freedman, M.; De Leonardis, D.; Raisman, G.; InyoSwan, D.; Davis, A.; Levi, S.; Rogers, I.; Bergeron, E. Demonstration of Automated Speed Enforcement in School Zones in Portland, Oregon. Available online: https://rosap.ntl.bts.gov (accessed on 5 November 2025).
- Tilahun, N. Safety Impact of Automated Speed Camera Enforcement: Empirical Findings Based on Chicago’s Speed Cameras. Transp. Res. Rec. 2023, 2677, 1490–1498. [Google Scholar] [CrossRef]
- Guerra, E.; Puchalsky, C.; Kovalova, N.; Hu, Y.; Si, Q.; Tan, J.; Zhao, G. Evaluating the Effectiveness of Speed Cameras on Philadelphia’s Roosevelt Boulevard. Transp. Res. Rec. 2024, 2678, 452–461. [Google Scholar] [CrossRef]
- Shakir Mahmud, M.; Jashami, H.; Usamah Megat Johari, M.; Gupta, N.; Bamney, A.; Gates, T.J.; Savolainen, P. Effects of Speed Feedback Trailer Positioning and Police Enforcement on Vehicular Speeds in Freeway Work Zone Lane Closures. Transp. Res. Rec. 2024, 2678, 423–434. [Google Scholar] [CrossRef]
- Mathew, J.K.; Desai, J.; Li, H.; Bullock, D.M. Using Anonymous Connected Vehicle Data to Evaluate Impact of Speed Feedback Displays, Speed Limit Signs and Roadway Features on Interstate Work Zones Speeds. J. Transp. Technol. 2021, 11, 545–560. [Google Scholar] [CrossRef]
- Sakhare, R.S.; Desai, J.C.; Mahlberg, J.; Mathew, J.K.; Kim, W.; Li, H.; McGregor, J.D.; Bullock, D.M. Evaluation of the Impact of Queue Trucks with Navigation Alerts Using Connected Vehicle Data. J. Transp. Technol. 2021, 11, 561–576. [Google Scholar] [CrossRef]
- Mekker, M.M.; Lin, Y.-J.; Elbahnasawy, M.K.I.; Shamseldin, T.S.A.; Li, H.; Habib, A.F.; Bullock, D.M. Application of LiDAR and Connected Vehicle Data to Evaluate the Impact of Work Zone Geometry on Freeway Traffic Operations. Transp. Res. Rec. 2018, 2672, 1–13. [Google Scholar] [CrossRef]
- Day, C.M.; Okaidjah, D.; Knickerbocker, S.; Iowa State University Institute for Transportation. Usefulness and Reliability of Probe Data When Alerting Work Zone Message Signs; Iowa State University: Ames, IA, USA, 2024. [Google Scholar]
- Mathew, J.K.; Li, H.; Landvater, H.; Bullock, D.M. Using Connected Vehicle Trajectory Data to Evaluate the Impact of Automated Work Zone Speed Enforcement. Sensors 2022, 22, 2885. [Google Scholar] [CrossRef] [PubMed]
- SafeZonesIN|Indiana Safe Zones Program. Available online: https://www.safezonesin.com (accessed on 14 July 2025).
- Sakhare, R.S.; Hunter, M.; Mukai, J.; Li, H.; Bullock, D.M. Truck and Passenger Car Connected Vehicle Penetration on Indiana Roadways. JTTs 2022, 12, 578–599. [Google Scholar] [CrossRef]
- Kandiboina, R.; Knickerbocker, S.; Bhagat, S.; Hawkins, N.; Sharma, A. Exploring the Efficacy of Large-Scale Connected Vehicle Data in Real-Time Traffic Applications. Transp. Res. Rec. 2024, 2678, 651–665. [Google Scholar] [CrossRef]
- Dimitrijevic, B.; Zhong, Z.; Zhao, L.; Besenski, D.; Lee, J. Assessing Connected Vehicle Data Coverage on New Jersey Roadways. In Proceedings of the 2022 IEEE 7th International Conference on Intelligent Transportation Engineering (ICITE), Beijing, China, 11–13 November 2022; pp. 388–393. [Google Scholar]
- Sakhare, R.S.; Desai, J.; Mathew, J.K.; Bullock, D.M. Assessing the Interstate Coverage of Commercial Trucks Capable of Providing Roadway Imagery via On-Vehicle Dash Camera in the United States. IEEE Access 2024, 12, 173517–173529. [Google Scholar] [CrossRef]
- Craig, B. Safe Zones Pilot Program Moving to Clear Path Project in 2025. In Clear Path 465; 2024; Available online: https://clearpath465.com/safe-zones-in-2025/ (accessed on 21 July 2025).
- INDOT Announces Expansion of Worksite Speed Control Pilot. Available online: https://www.safezonesin.com/copy-of-press-release-4 (accessed on 21 July 2025).
- Press Releases. Available online: https://www.safezonesin.com/press-releases (accessed on 21 July 2025).
- Resources. Available online: https://www.safezonesin.com/resources (accessed on 4 November 2025).
Disclaimer/Publisher’s Note: The statements, opinions and data contained in all publications are solely those of the individual author(s) and contributor(s) and not of MDPI and/or the editor(s). MDPI and/or the editor(s) disclaim responsibility for any injury to people or property resulting from any ideas, methods, instructions or products referred to in the content. |
© 2025 by the authors. Licensee MDPI, Basel, Switzerland. This article is an open access article distributed under the terms and conditions of the Creative Commons Attribution (CC BY) license (https://creativecommons.org/licenses/by/4.0/).