Article

High-Power Laser Coherent Beam Combination Through Self-Imaging in Plasma Waveguides

State Key Laboratory of Precision Space-Time Information Sensing Technology, Department of Precision Instrument, Tsinghua University, Beijing 100084, China
*
Author to whom correspondence should be addressed.
Appl. Sci. 2025, 15(22), 12141; https://doi.org/10.3390/app152212141 (registering DOI)
Submission received: 17 October 2025 / Revised: 12 November 2025 / Accepted: 13 November 2025 / Published: 16 November 2025
(This article belongs to the Special Issue Advances in Fiber Lasers and Their Applications)

Abstract

A novel approach for laser coherent beam combination (CBC) utilizing the self-imaging effect in plasma waveguides is presented in this study, which enables the transmission of ultrashort laser pulses at intensities above the bulk damage threshold of conventional solid optical waveguides. The feasibility of self-imaging-based CBC in plasma waveguides was simulated and verified, demonstrating favorable combining efficiency and beam quality. This work explores the adaptive tuning of waveguide length via dynamic adjustment of plasma density, addressing the critical issue of fabrication tolerances in traditional waveguide systems. With CBC via plasma waveguide, this study offers support for the development of robust, high-power laser systems with enhanced beam quality and operational stability.

1. Introduction

Over the past five decades, fiber lasers have undergone continuous advancement, exhibiting distinctive advantages such as compact configuration, efficient thermal management, reliable beam quality, and low maintenance costs [1]. However, the output power of large mode fiber lasers is inherently limited by factors including transverse mode instability (TMI), nonlinear effects, thermal lensing, and pump brightness [2]. Laser Coherent Beam Combination (CBC) has emerged as a pivotal technique to transcend this power limitation, offering significant benefits in beam control and brightness enhancement. As a core approach to surpassing the power limitation of single-fiber systems and achieving high-power fiber laser output, CBC has become a major focus of contemporary research [2,3,4,5,6,7]. Traditional coherent beam combination methods mainly include Coherent Polarization Beam Combination (CPBC) and coherent beam combination based on Diffractive Optical Elements (DOEs). Among them, the CPBC method primarily relies on optical components such as polarization beam combiners and half-wave plates. It combines two laser beams with orthogonal polarization directions through a polarization beam combiner, and high beam combination efficiency can be achieved by precise adjustment of the optical components which causes the number of combined laser beams to be limitated. However, the coherent beam combination method based on DOEs is different: its beam combination principle is essentially based on the reversibility of the optical path, but the design and fabrication of DOE components are relatively complex. All the aforementioned methods utilize spatial optical paths. As the number of laser beams increases, the number of spatial optical components in the system increases accordingly, which raises the system complexity and thereby reduces the compactness and stability of the system.
To address the issues of high system complexity and low stability encountered by the above-mentioned traditional coherent beam combination methods, a coherent beam combination method based on waveguide self-imaging has been proposed. This type of method couples multiple laser beams into a single optical waveguide, which significantly reduces the system complexity. In 2010, Lockheed Martin demonstrated coherent combining of over 100 W using the self-imaging effect of strongly confined waveguides, achieving a combining efficiency of approximately 80%. [8]. However, this approach still faces critical limitations: as power levels increase, thermal effects at the output facets of individual laser channels and within the waveguide itself intensify, leading to structural deformation and local refractive index variations that degrade combining efficiency. Additionally, the fabrication of hollow-core waveguides imposes extremely stringent requirements—even minute structural defects or fabrication tolerances can result in a substantial drop in combining efficiency [8]. Bulk damage threshold of conventional optical waveguides are relatively low, severely restricting the further power scaling of self-imaging-based CBC.
To overcome these limitations, this study identifies plasma waveguides as a novel waveguide platform [9,10,11,12,13,14,15,16,17,18,19,20,21]. Plasma density can be dynamically tuned via adjustment of background gas density and discharge voltage, enabling adaptive compensation for structural imperfections and fabrication errors. The emerging field of plasma antennas has shown us that the key parameters of plasma can be dynamically regulated on millisecond time scales according to Magarotto et al. [22]. For example, Podolsky et al. [23] have found that increasing the excitation power can enhance the average plasma density in the column. These capabilities directly address the key challenges faced by self-imaging-based CBC. The operating principle of plasma waveguides relies on filling a capillary channel with plasma whose electron density exhibits a parabolic or step-like radial profile, generating a refractive index peak along the central axis. In 1996, Ehrlich et al. [24] first reported a hollow-capillary discharge plasma waveguide; a 1 cm-long polypropylene capillary with an inner diameter of 350 µm was mounted in a vacuum chamber, with electrodes connected to both ends and discharge triggered by a spark gap. In 2000, Spence and Hooker [25,26,27] proposed, for the first time, the use of a hydrogen-filled capillary discharge to generate plasma for laser guiding; a 5 mm-long sapphire capillary with an inner diameter of 300 µm was employed, and longitudinal interferometry confirmed the formation of an approximately parabolic radial electron density profile in the plasma. By optimizing the current-pulse parameters, Gonsalves et al. [28,29] increased the operating repetition rate of the waveguide while preventing plasma-induced erosion of the capillary walls, thereby advancing plasma waveguides toward practical application.
To date, however, no experimental or numerical studies have investigated the application of plasma waveguides in self-imaging or CBC. This paper therefore provides a numerical demonstration of self-imaging-based CBC using plasma waveguides. Through systematic parameter scanning, the intrinsic adaptive tuning capability of the plasma waveguide is illustrated. Comparative analyses reveal that, within the self-imaging framework, plasma waveguides exhibit significantly superior combining performance compared to conventional waveguide architectures. This work aims to overcome the long-standing limitations of traditional CBC schemes, namely excessive system complexity and low peak-power density thresholds of combined outputs.

2. Simulation Methods

For plasma waveguides, a refractive index model was established in COMSOL 6.3 based on the specific axial distribution of electron density. According to Spence et al. [26], when plasma is generated inside a capillary, electron density forms a parabolic distribution (lower at the center and higher at the edges) due to shell effects. In their work, interferometric measurements of radial electron density distribution were conducted for plasma formed in a 300 µm-diameter, 5 mm-long capillary at 60 ns post-discharge (with an initial hydrogen pressure of 67 mbar), yielding the following radial distribution equation for plasma electron density,
N e = N e 0 + Δ N e r 150 ( μ m ) 2 = 2.25 × 10 18 + 3.75 × 10 18 r 150 ( μ m ) 2 ( cm 3 )
To match the simulation model, the capillary was assumed to have a square cross-section, and the plasma distribution was described using a similar equation with the radial variable r replaced by the transverse coordinates x and y.
Based on this electron density distribution, key physical parameters of the plasma were calculated as follows.
Plasma Frequency,
ω p = e 2 N e ϵ 0 m e
where e denotes the electron charge, ϵ 0 the vacuum permittivity, and m e the electron mass.
Debye Length,
L d = ϵ 0 T e e 2 N e
where T e represents the electron temperature.
Plasma Collision Frequency,
ν = log ( 4 π N e L d 3 ) · ω p N e L d 3 · 1 8 π
Relative Permittivity of Plasma,
ε p = 1 ω p 2 ω 2 + ν 2
where, ω is the angular frequency of the laser, given by ω = 2 π c / λ (with c as the speed of light in vacuum and λ as the laser wavelength).
Given the cylindrically symmetric structure of the capillary, a two-dimensional simulation domain was established, with a length of 20 mm and a width of 300 µm. A 2850 µm-thick thin layer was added at the edge of the domain to simulate the capillary wall material ( Al 2 O 3 ). The boundary conditions of the simulation domain were set as follows, a perfect matched layer (PML) was applied at the waveguide output end to minimize reflection; laser beams were injected at the waveguide input end; impedance boundary conditions were applied to the waveguide sides to simulate an extended Al 2 O 3 region (though this had minimal impact due to the already large domain size). The wavelength of the laser in our article is 1064 nm. To simplify the complexity of the simulation and improve simulation efficiency, we consider adopting the beam envelope method. The beam envelope method is a numerical simulation method that efficiently simulates light propagation problems by decomposing the electromagnetic field into the product of a rapidly oscillating carrier wave and a slowly varying envelope function; in the time domain, it separates the slowly varying envelope function from the rapidly oscillating phase factor, such that the time dependence is fully contained in the preset phase factor while the envelope function to be solved is independent of time. This enables the beam envelope method to be competent for the simulation of long waveguide types where the beam propagation direction is known, the optical wave envelope varies slowly along the light propagation direction but drastically along the other direction. The above feature of the beam envelope method endows our simulation with generality in terms of laser pulse width. It should be noted that during the entire propagation of the wave in the waveguide, the optical wave frequency must remain constant—this implies that the pulse width of the laser must be at least sufficiently long to allow the pulse front to pass through the waveguide within the time span of its own pulse width. For this paper, this means that the laser pulse width must be at least on the order of ps (the length of the waveguide/the speed of light) or longer, and the generality of our research in terms of laser pulse width applies within the aforementioned range. The equation of the beam envelope method is,
i k 1 μ r 1 i k 1 × E k 0 2 ε r 1 i σ ω ε 0 E = 0
where k 1 is the beam wave number, while k 0 is the free space wave number μ r describes the relative permeability and ϵ r describes the relative permittivity as well as σ describes the electrical conductivity. The input electric field intensity of a single Gaussian beam is set to 5 × 10 6 V/m to simulate a power density of 6.63 × 10 10 W/m2.

3. Results and Discussions

Numerical simulations were conducted in four stages, single-beam propagation in a plasma waveguide; multi-beam combination to investigate the effect of input beam axial separation on combining efficiency; modeling of laser energy absorption induced by the plasma waveguide; exploration of adaptive tuning of self-imaging length via parameter scanning. The simulations revealed that high-peak-intensity CBC (up to 1 × 10¹² W/m2) can be achieved, and plasma density can be tuned to adapt to different waveguide lengths.

3.1. Single Beam Injection

A laser beam with a waist size W 0 = 5 µm (simulating direct coupling from a fiber) was incident from the left side of the simulation domain.
Figure 1 presents the electric field distribution along the waveguide. The characteristic self-imaging phenomenon was observed: as the beam propagated along the z-axis (propagation direction), its intensity pattern repeated at 8000 µm and 16,000 µm, indicating a Talbot distance of approximately 8000 µm for the waveguide.
For a waveguide with a graded refractive index profile, the self-imaging length can be determined theoretically. When the internal refractive index of the waveguide is axially symmetric and follows a square-law distribution (similar to graded-index fibers), solving the waveguide field equation yields the propagation constant,
β m n = n 1 k 0 1 2 2 Δ n 1 k 0 a ( 2 n + m + 1 )
where n 1 is the maximum refractive index of the waveguide core, k 0 = 2 π / λ , Δ = ( n 1 2 n 2 2 ) / ( 2 n 1 2 ) (with n 2 as the refractive index of the cladding), a is the core radius, and m , n are mode orders.
Expanding the propagation constant exponent,
exp i β m n z = exp i n 1 k 0 z 1 2 2 Δ n 1 k 0 a ( 2 n + m + 1 ) exp i n 1 k 0 z + i 2 Δ a ( 2 n + m + 1 ) z = exp i n 1 k 0 z exp i 2 Δ a ( 2 n + m + 1 ) z
The Talbot distance is thus derived as,
L = π a 2 Δ
The calculated Talbot distance (≈8190 µm) is in good agreement with the simulation result.

3.2. Multiple Beam Injection

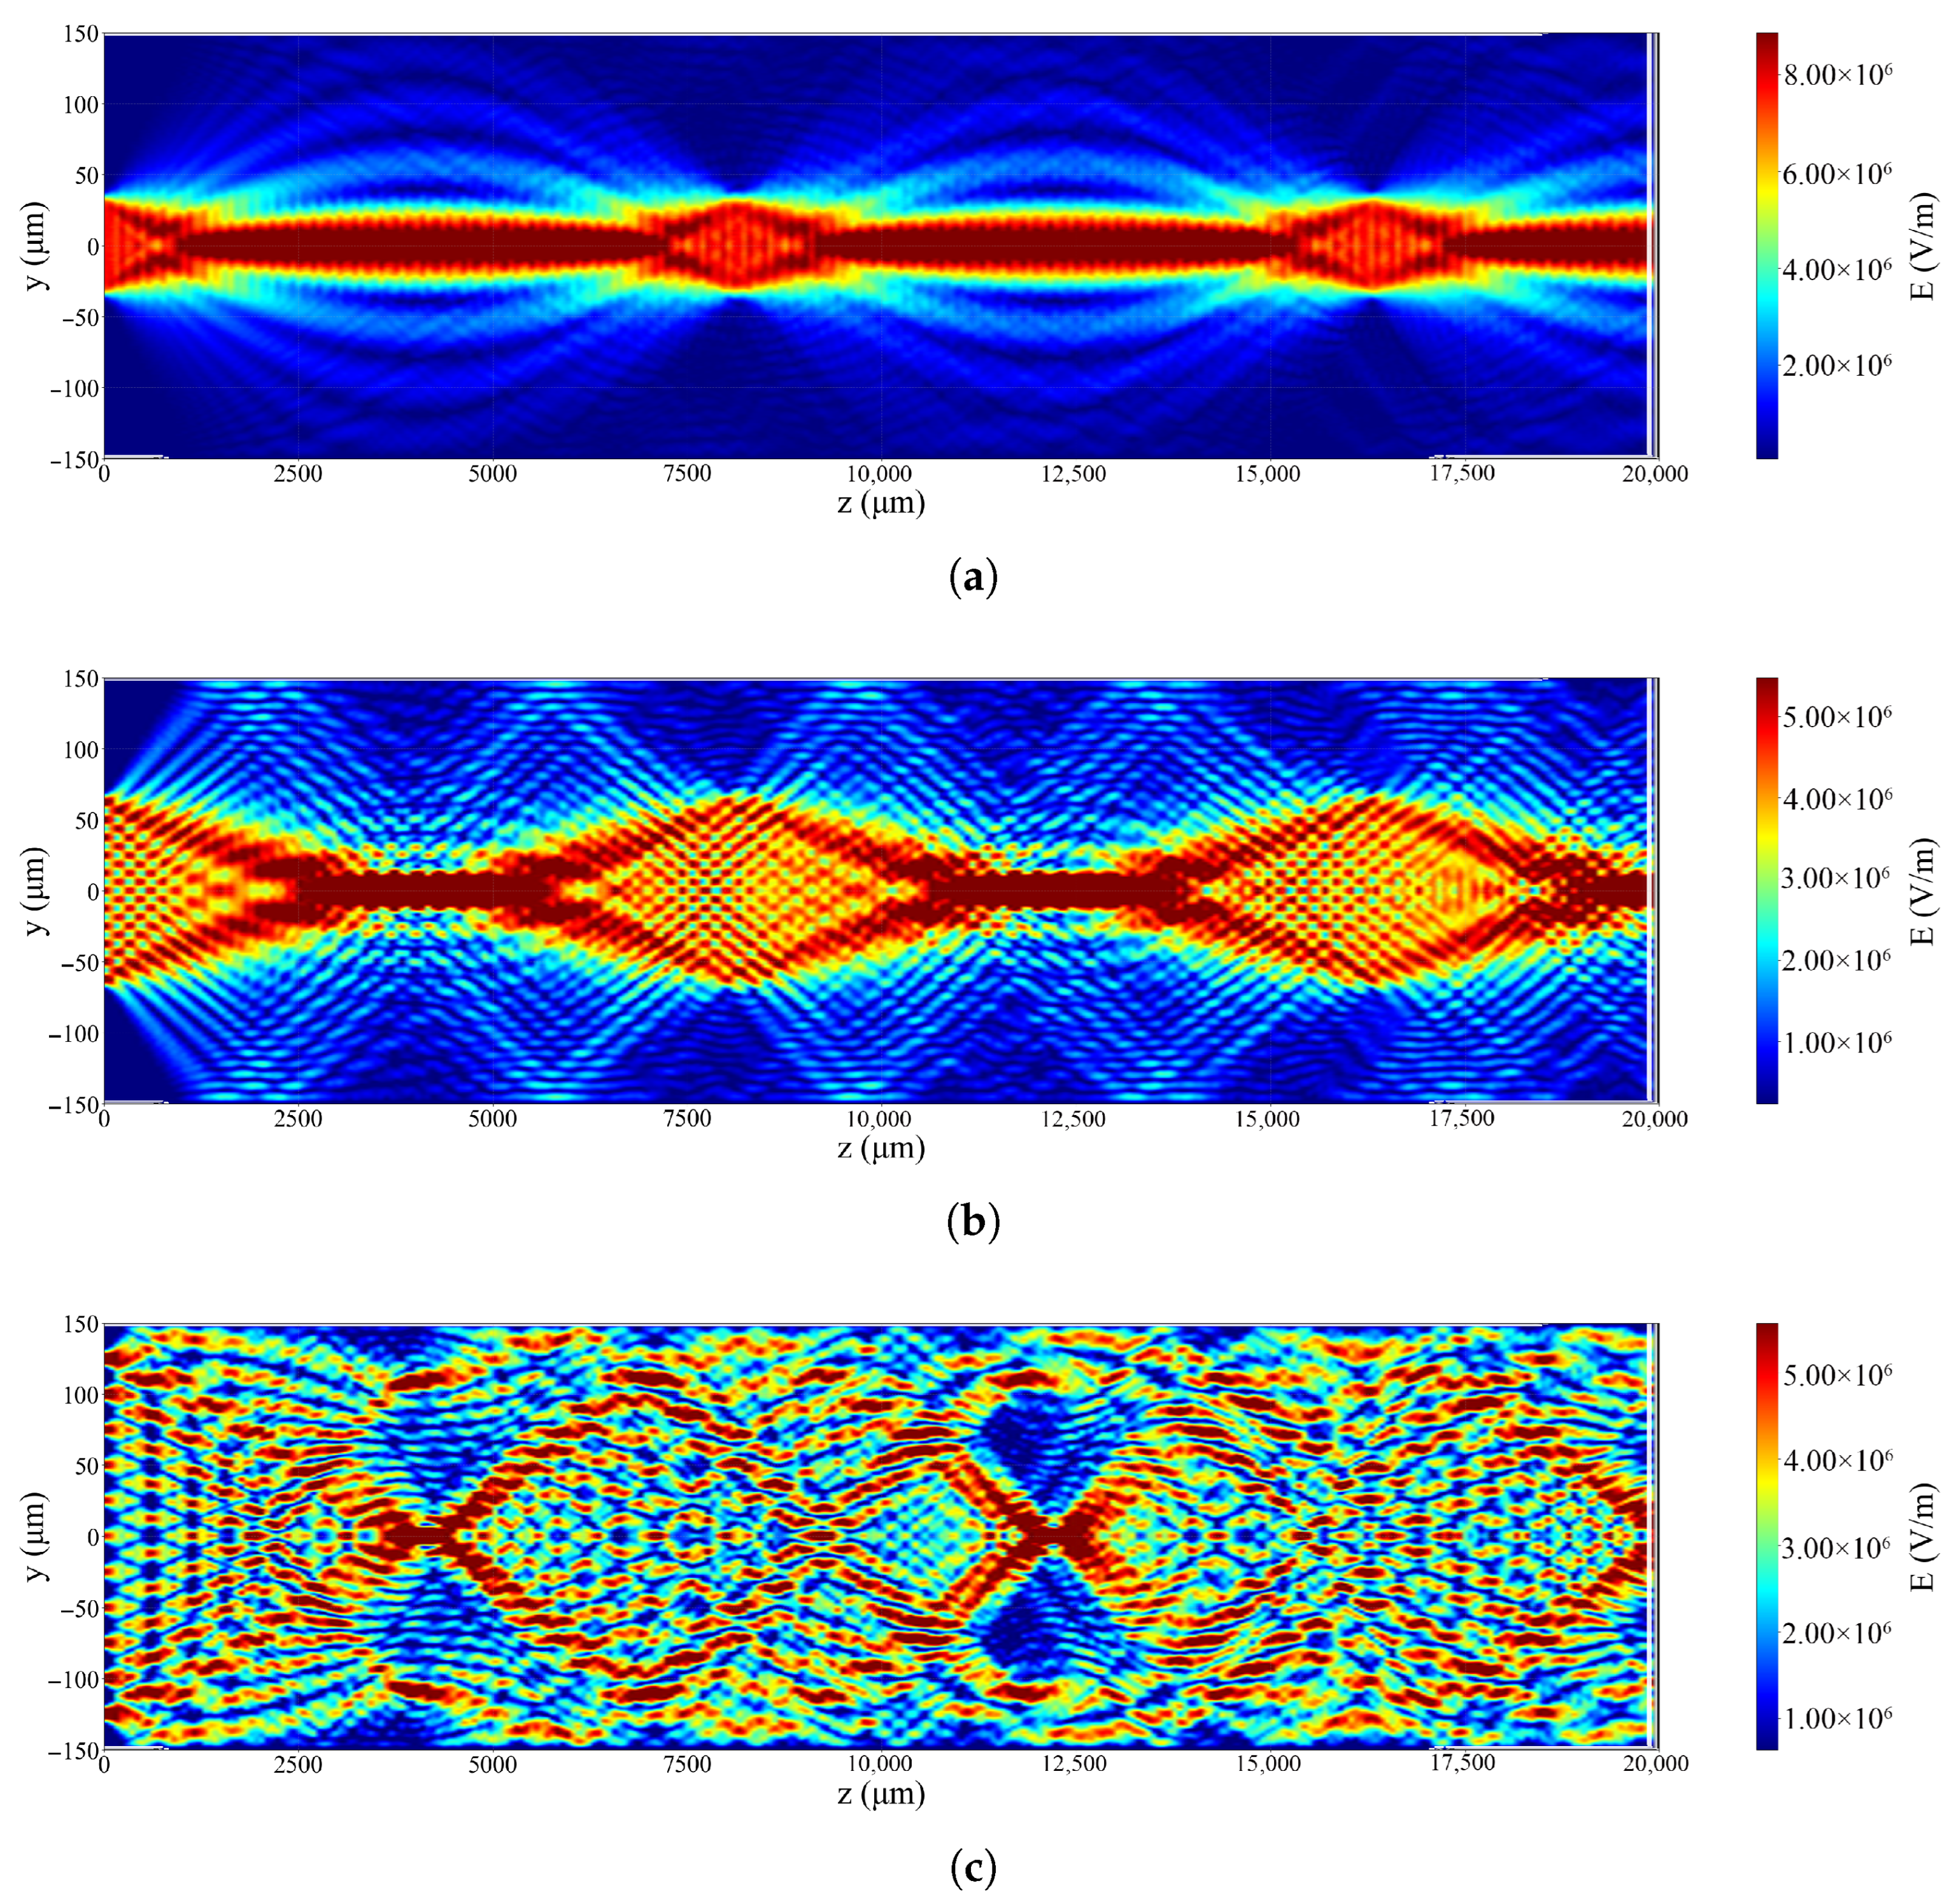
Multiple laser beams (each with W 0 = 5 µm) were incident from the left side of the domain, with axial separations of d = 1.25 W 0 , 2.5 W 0 , and 5 W 0 (simulating direct coupling from a fiber-optic microarray). Beams with the aforementioned characteristics are coupled into multiple optical fibers respectively. The aforementioned beam array first forms an 11 × 11 tiled aperture array via optical fibers, then incidents on the left end face of the waveguide.
Figure 2 shows the electric field distribution along the z-axis in the y-direction. At the Talbot distance (8000 µm), the intensity pattern repeated; however, optimal CBC was achieved at a position slightly before the Talbot distance. This is attributed to the parabolic electron density distribution of the plasma, which acts as a focusing lens—multiple beams are focused at a position just before the Talbot distance, enabling coherent combination.
The decision to position input beams in close proximity was driven by the following, if beams are separated by large distances during coupling, the focusing effect weakens, leading to a diffused output spot at the waveguide end. Notably, the optimal combination position remained consistent at x = 4200 µm across all separation distances.
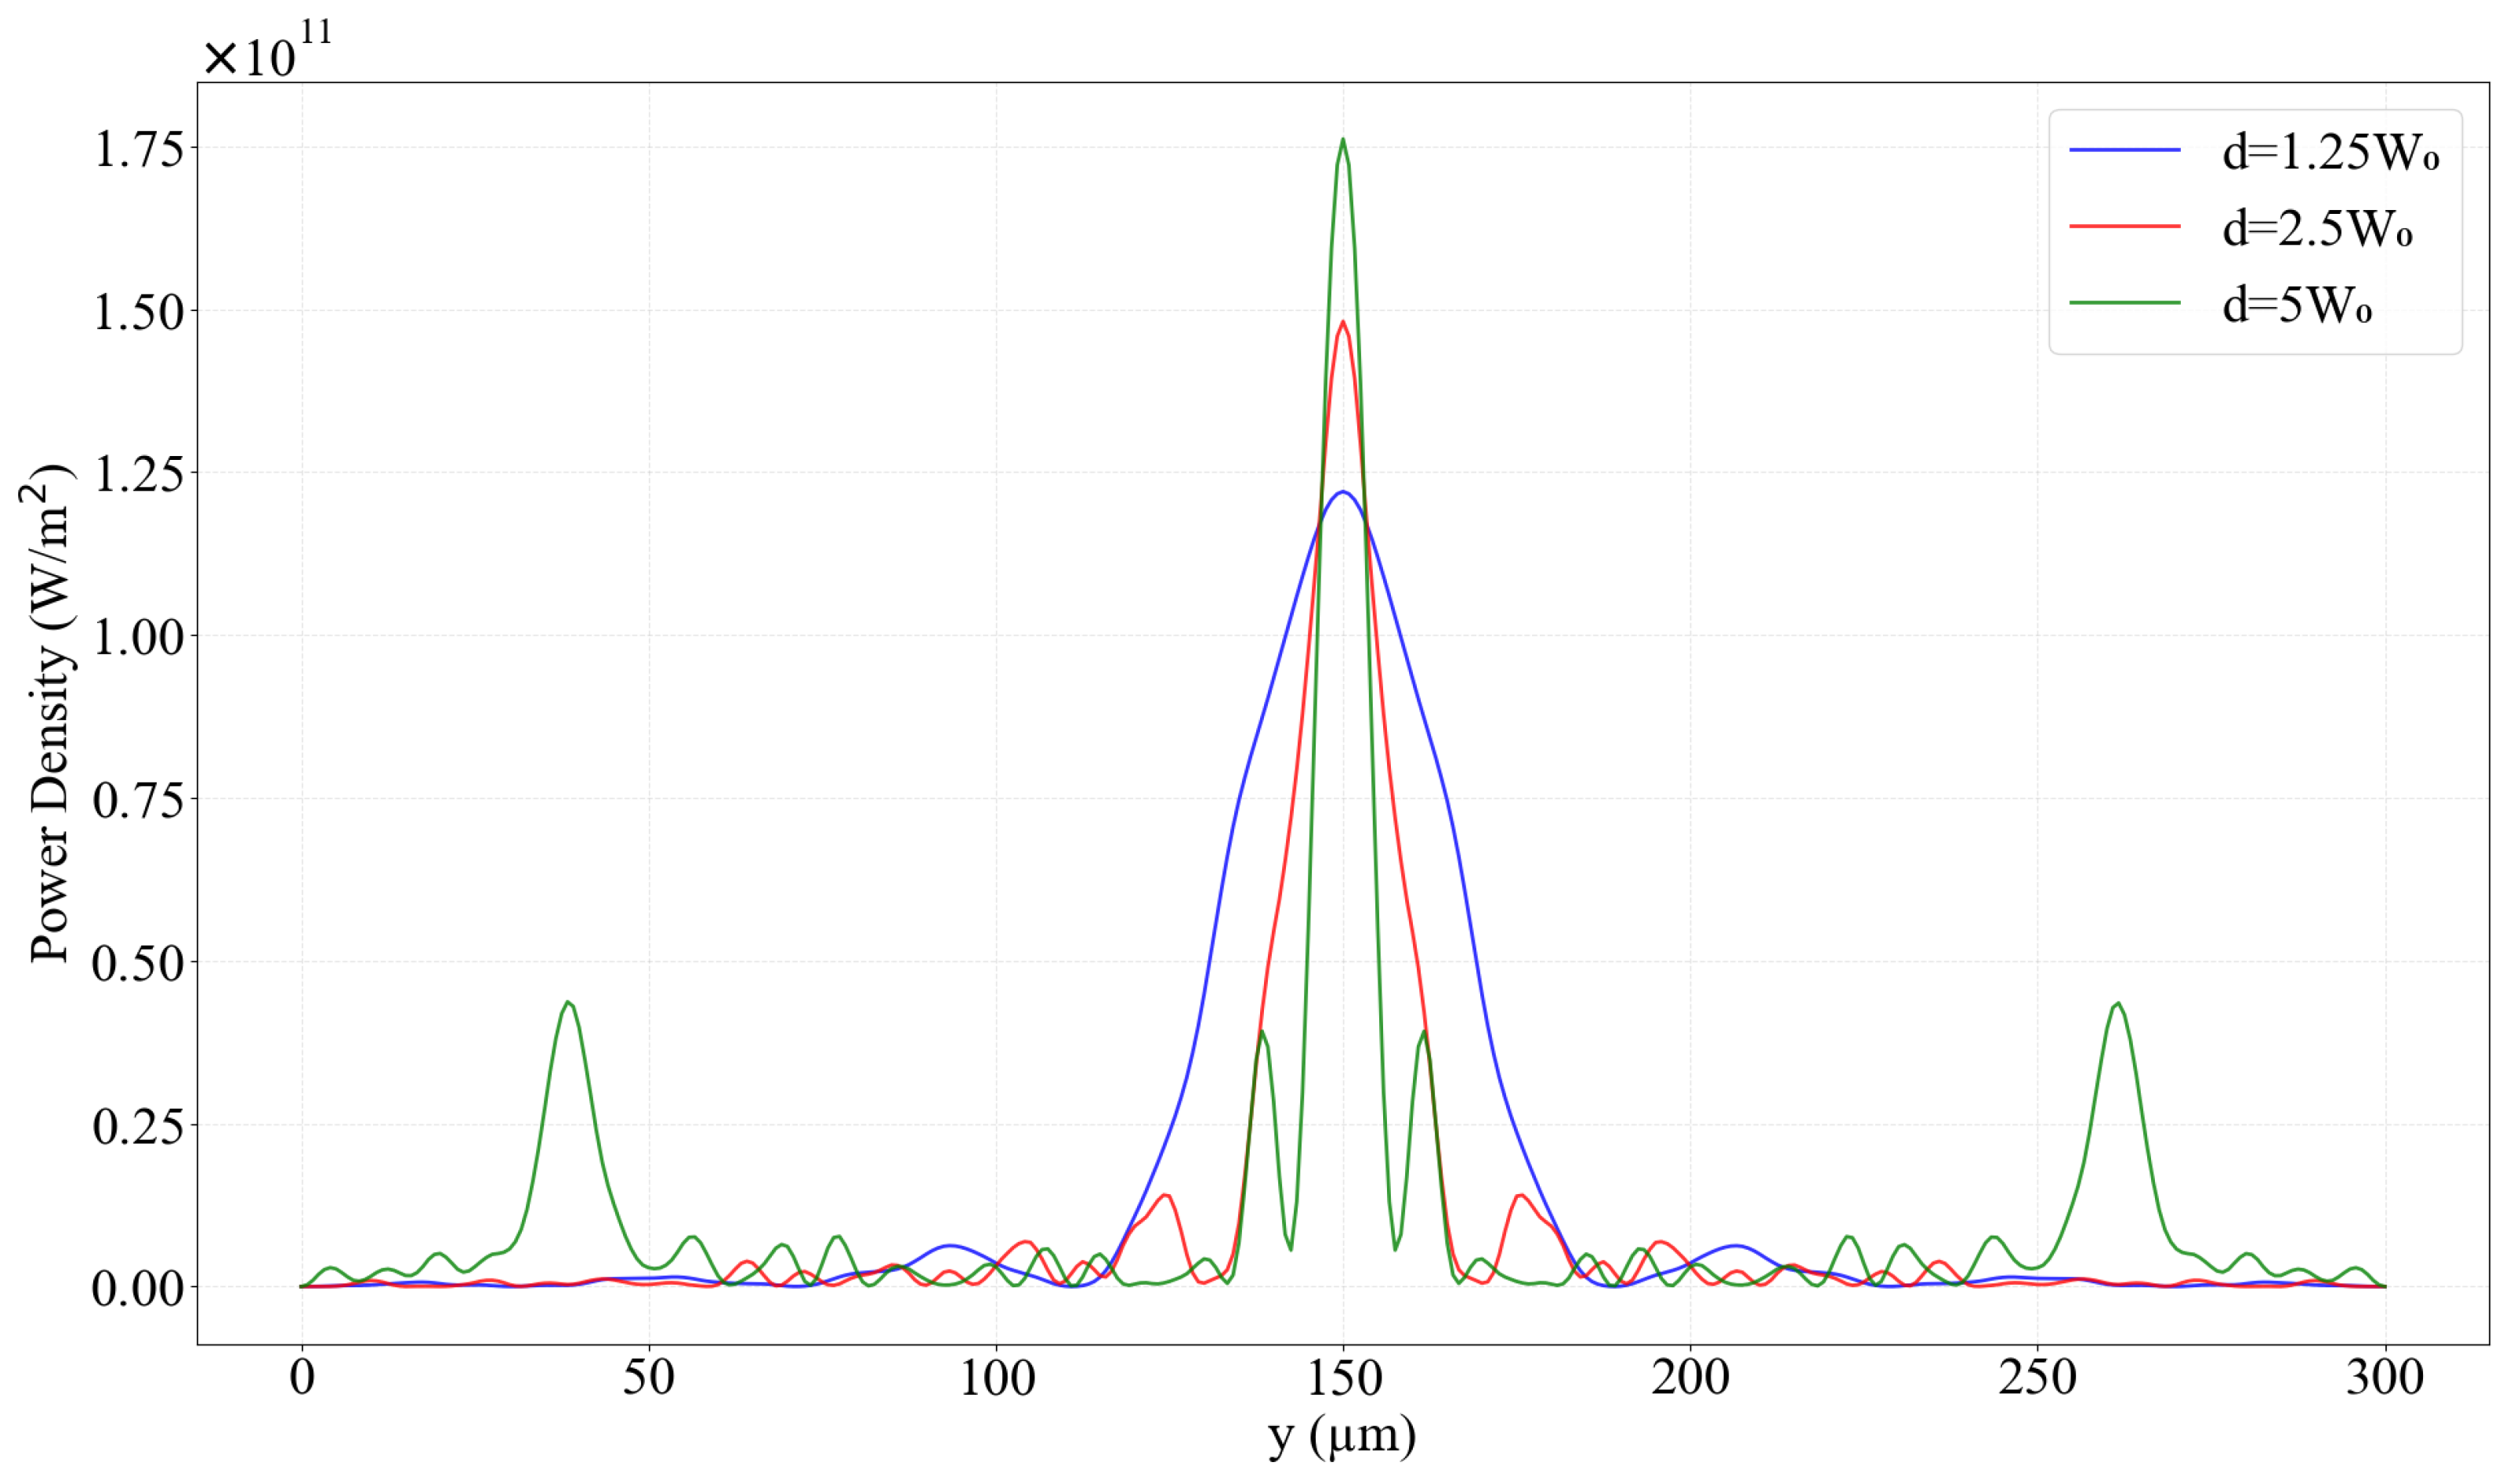
Figure 3 presents the output spot profiles for different beam separations. It is evident that smaller beam separations result in more centralized intensity distribution and improved beam quality. Extrapolating this trend, if beams were extremely closely spaced (forming a quasi-single beam), side lobes in the output spot could be completely eliminated; conversely, large separations would cause energy to transfer to side lobes, degrading beam quality.

3.3. Effects of Plasma Absorption

The permittivity of plasma exhibits an imaginary component. Based on the Drude model, the relative permittivity of plasma, including both its real and imaginary parts, is expressed as follows,
ε p = 1 ω p 2 ω 2 + ν 2 j ω p 2 ω 2 + ν 2 ν ω
here, the imaginary part characterizes the plasma’s absorption of the laser.
A simulation was conducted for the case of d = 1.25 W 0 , where 11 beams were coupled into the plasma waveguide. The results are presented in Figure 4.
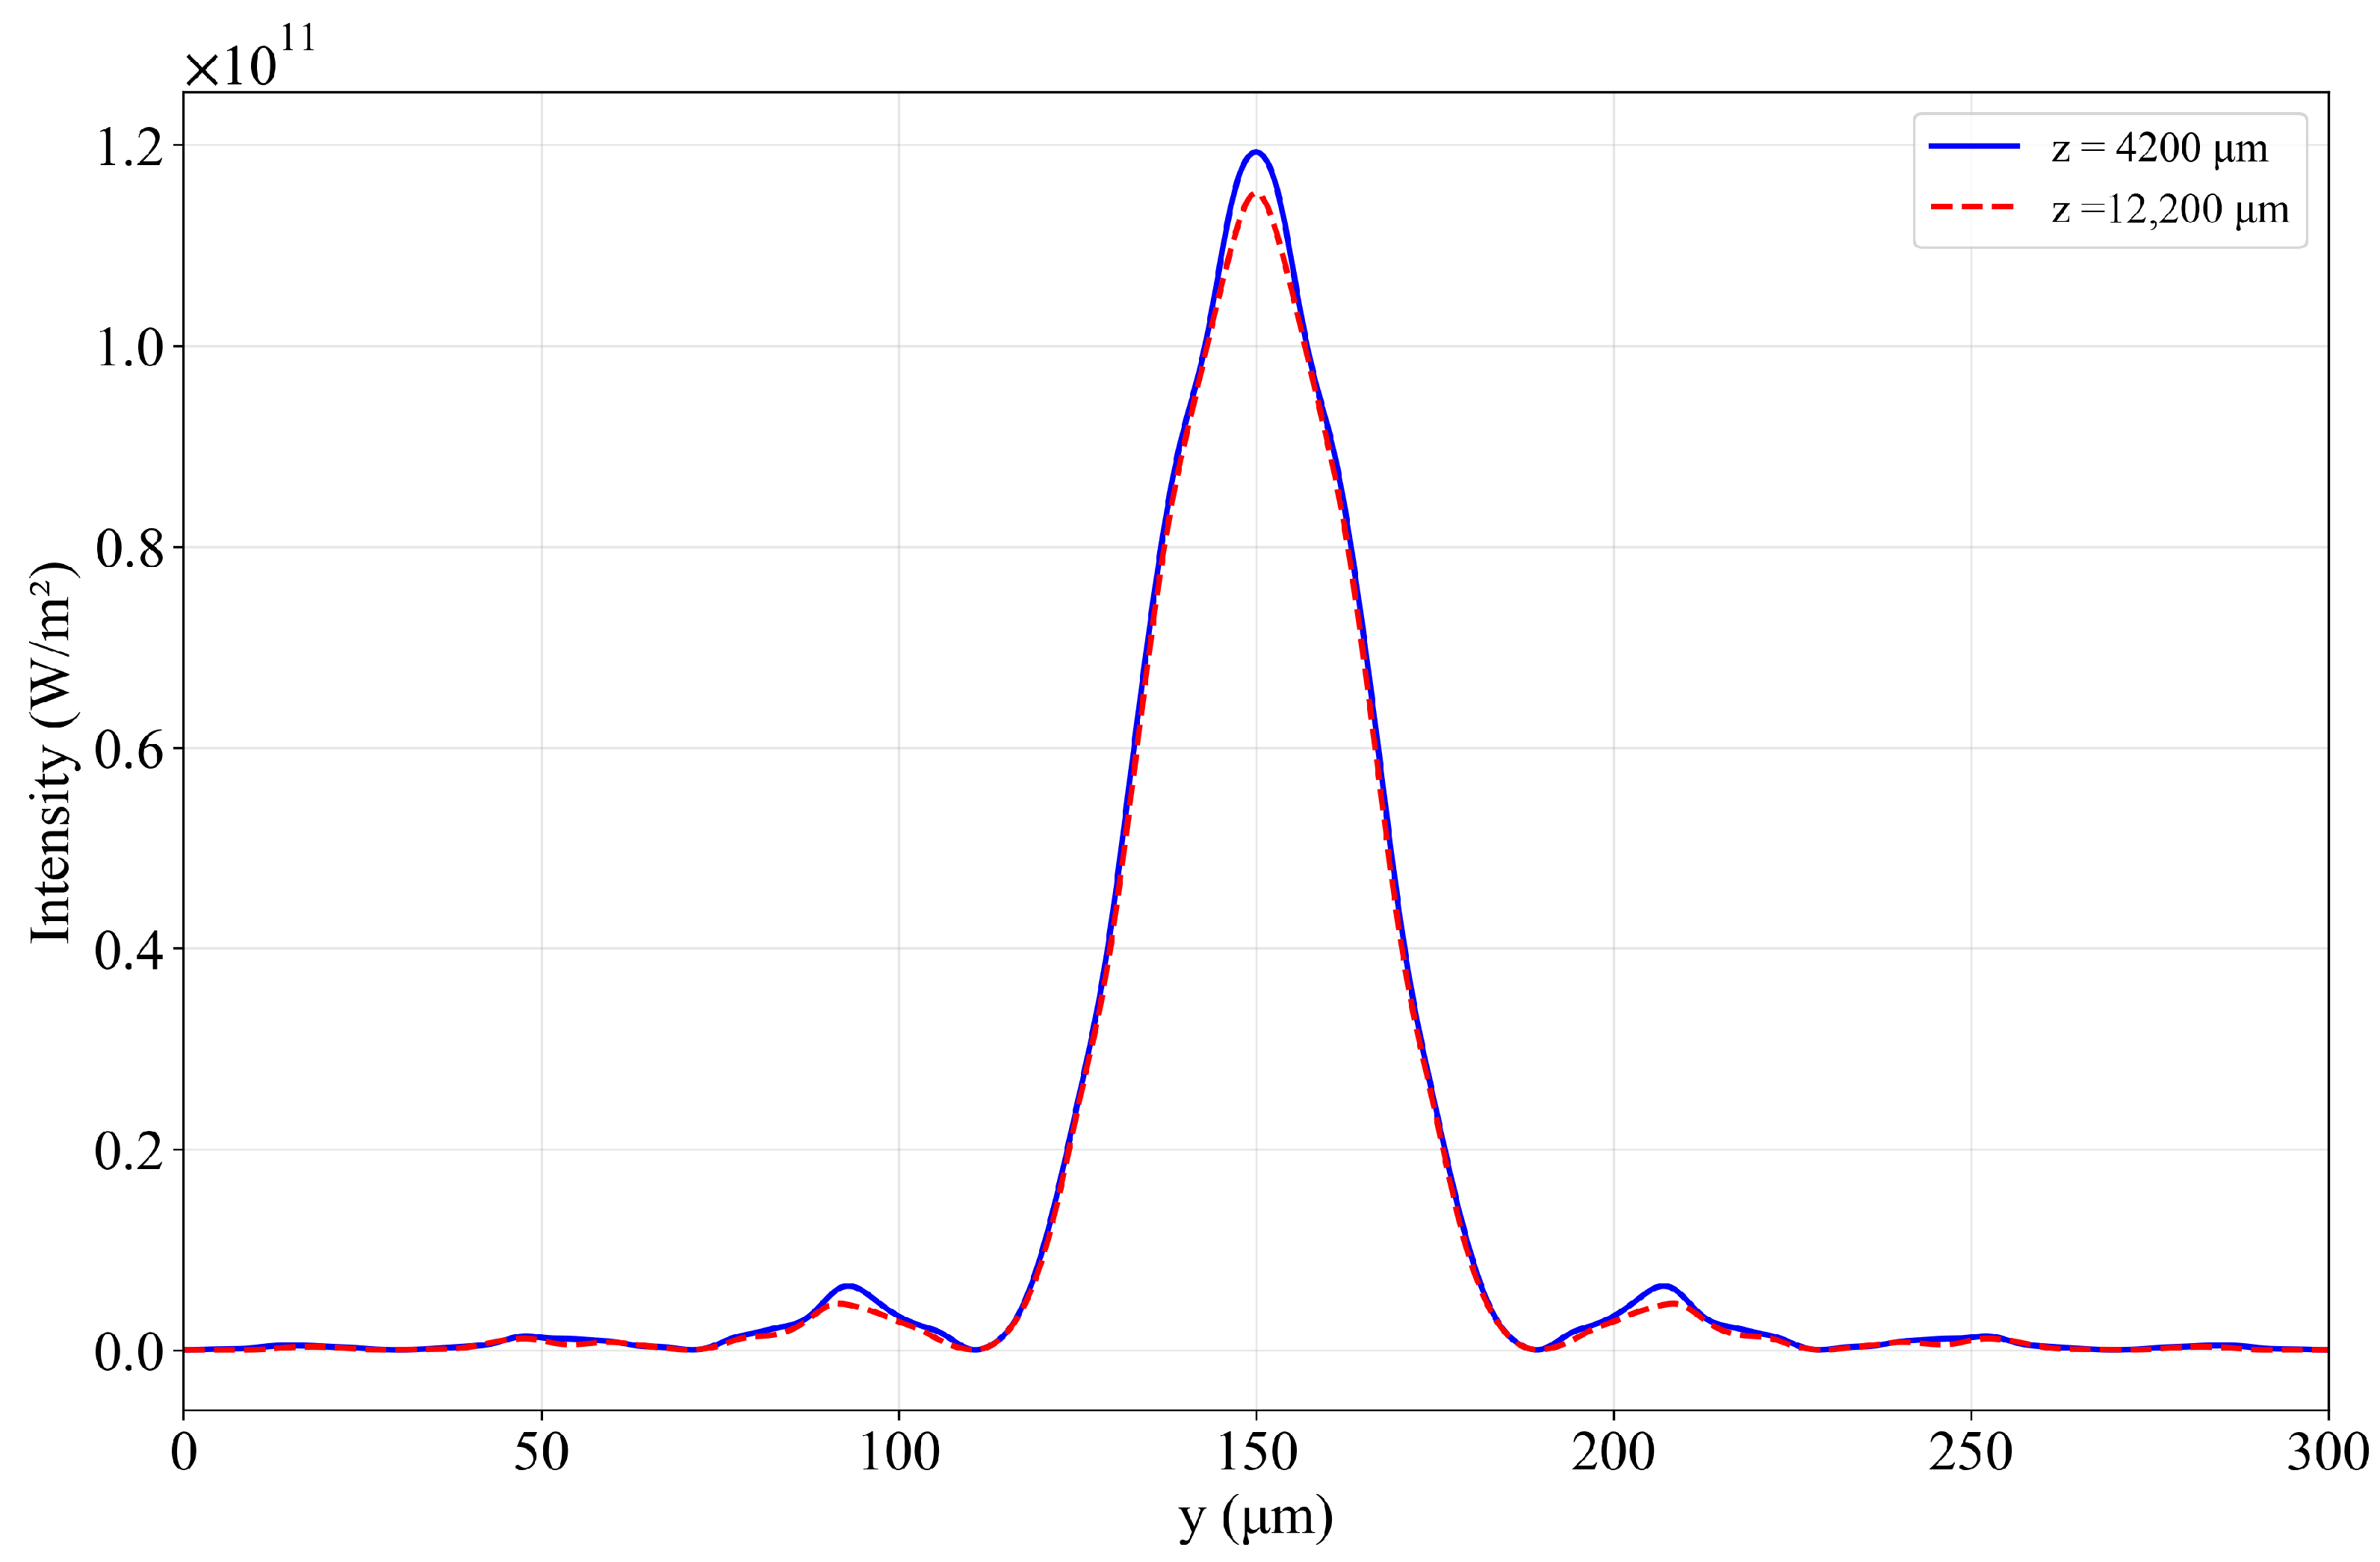
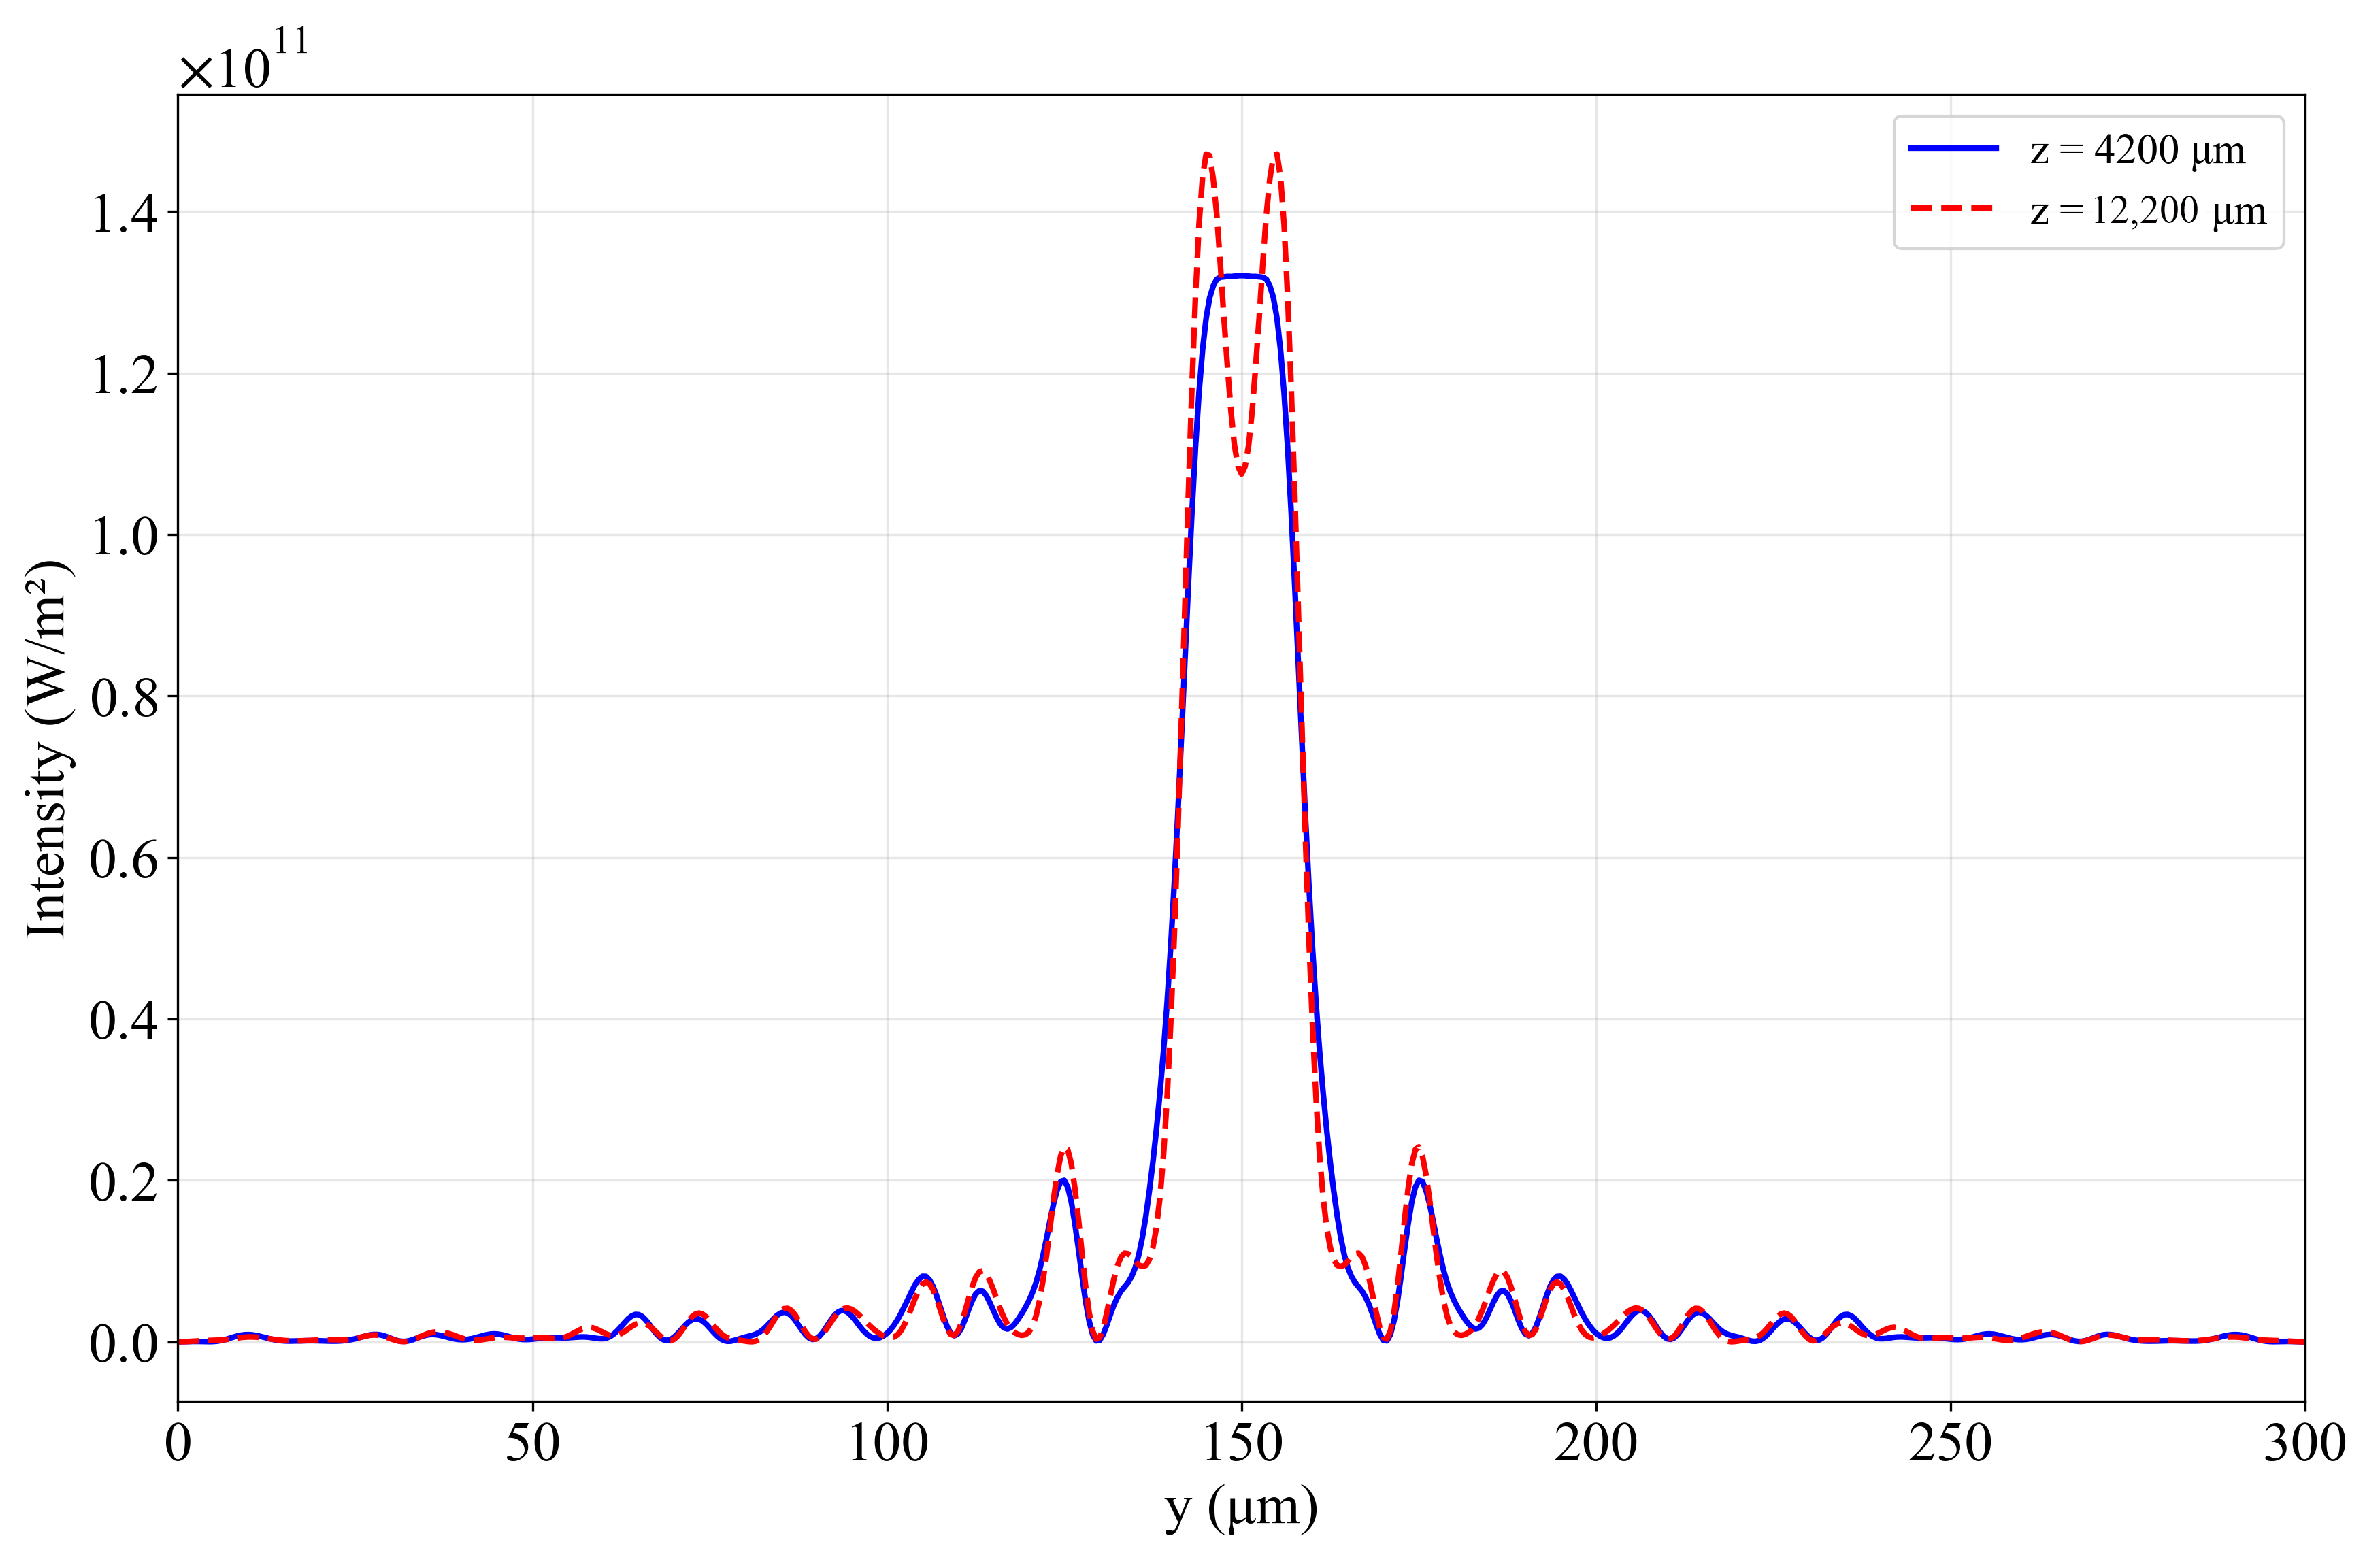
As the laser propagates along the z-axis, its energy gradually decreases. Laser spot profiles at different positions along the z-axis were extracted, as shown in Figure 5.
The shape of the laser spot remained nearly unchanged, while the peak intensity decreased by approximately 3.4%. This phenomenon is attributed to the absorption effect of the plasma.
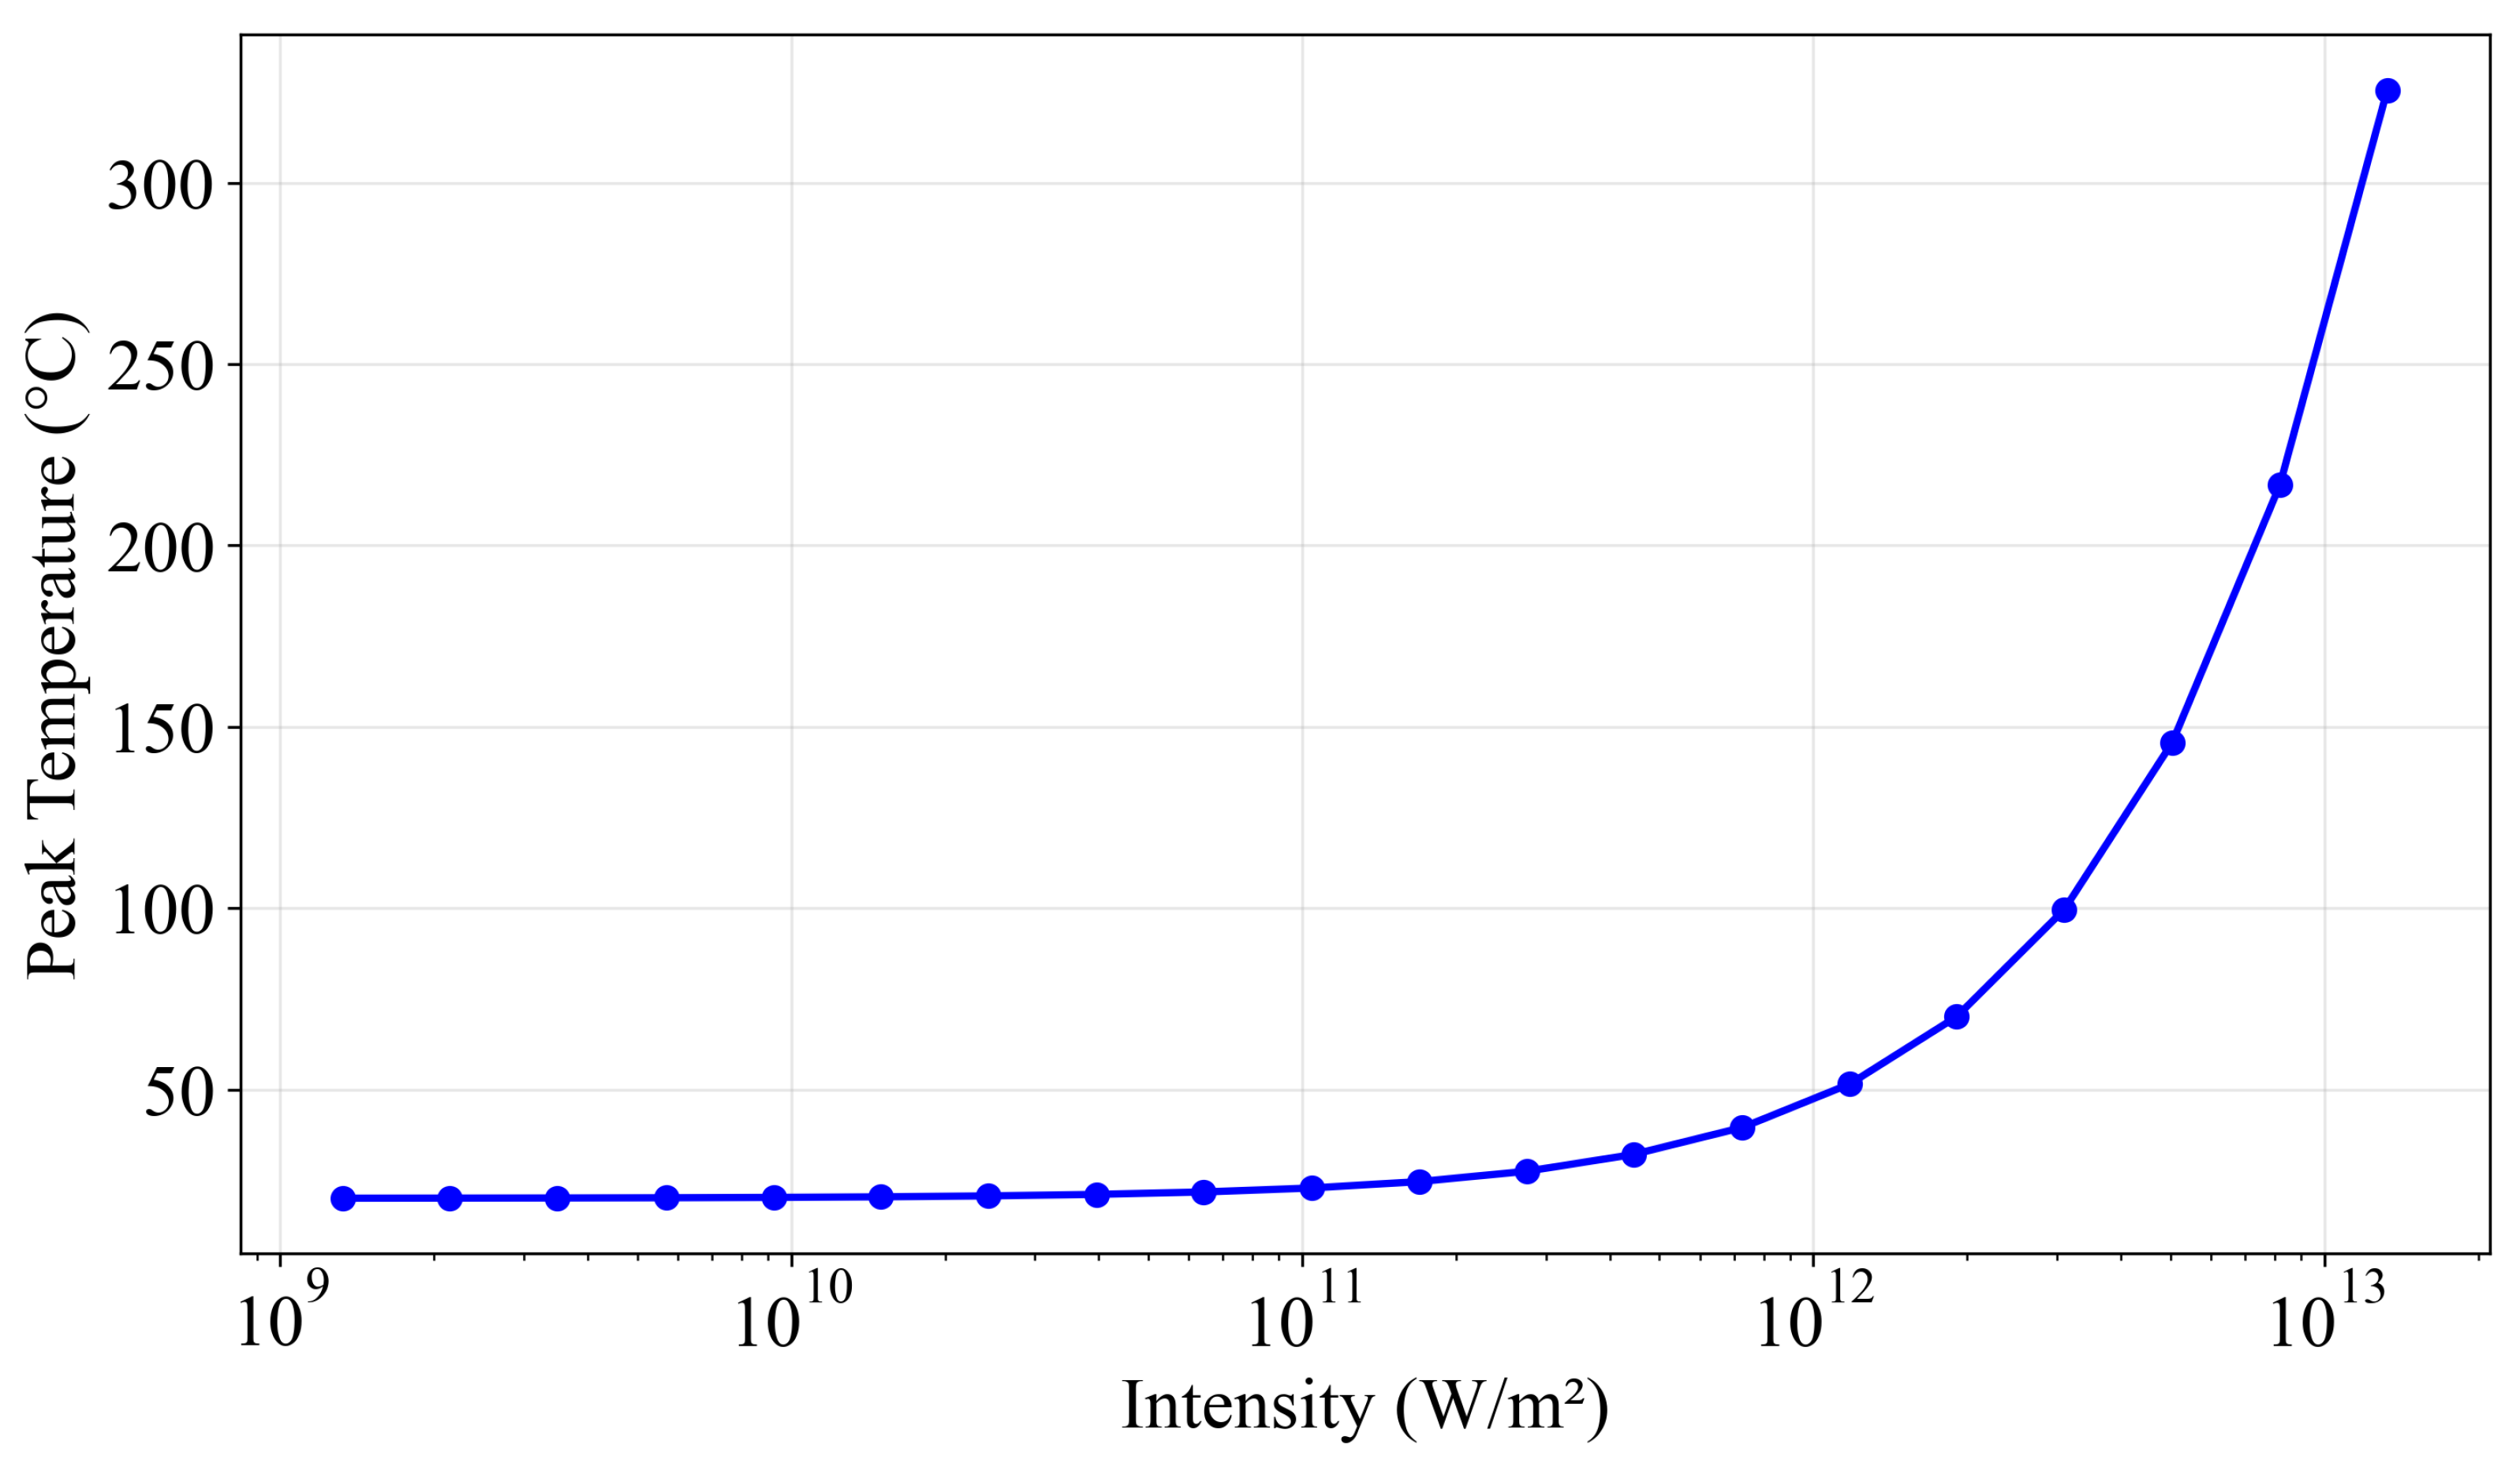
Plasma absorption of the laser also induces a temperature rise. To simulate the temperature distribution at the beam combination region, a multiphysics coupling calculation was performed using the Heat Transfer in Fluids module and the Beam Envelope module in COMSOL. The two ends of the capillary were set as open boundaries, and the capillary walls were cooled via convection. Since any practical CBC system requires an effective cooling subsystem, the heat transfer coefficient was set to 1000 W/(m2·K). The simulation results are displayed in Figure 6. It should be noted that the above physical model is simplified. This is because the laser energy is not directly absorbed by the background gas, but by the plasma—the plasma itself is heated by the laser and then in turn heats the background gas. In fact, regardless of which of the two is intensely heated, it is destructive to the plasma waveguide. Heating the plasma leads to a sharp rise in the local plasma temperature, disrupting the equilibrium established in the plasma waveguide and causing drastic changes in the plasma density distribution—this will render our waveguide inoperative. Heating the hydrogen gas, on the other hand, results in its thermal expansion, which also disturbs the plasma density distribution. To establish an accurate model for predicting plasma density, it may be necessary to consider complex nonlinear processes such as multiphoton ionization induced by excessive laser energy, which is beyond the scope of this article. Therefore, we may treat hydrogen gas and plasma as an integrated system assuming that this integrated system has the specific heat capacity of hydrogen gas, thereby maintaining consistency with our simplified model.
As illustrated in Figure 6, when the combined laser intensity reaches 5 × 10 12 W/m2, the temperature begins to increase abruptly. Such temperature rising indicates that the cooling system can no longer balance the heat generated by laser absorption, which predicts the peak temperature of the system. Thus, it can be concluded that the threshold peak power density for this CBC scheme is on the order of 1 × 10 12 W/m2. It should be noted that the power density obtained from the aforementioned simulations is derived by solving the steady-state solution in COMSOL, indicating that the power density threshold mentioned in this paper refers to the average power density. The threshold of the transient peak power density is not discussed herein, as the beam envelope method employed in this work solves the frequency-domain solution, which cannot simulate the laser–plasma interaction within the time scale of ps or shorter pulse widths. However, Spence et al. [26] have demonstrated that when the transient peak power density during transmission reaches 10 20 W/m2, the aforementioned waveguide can still achieve a transmission efficiency of 96 ± 2%. This confirms that the threshold of the transient peak power density is greater than 10 20 W/m2.
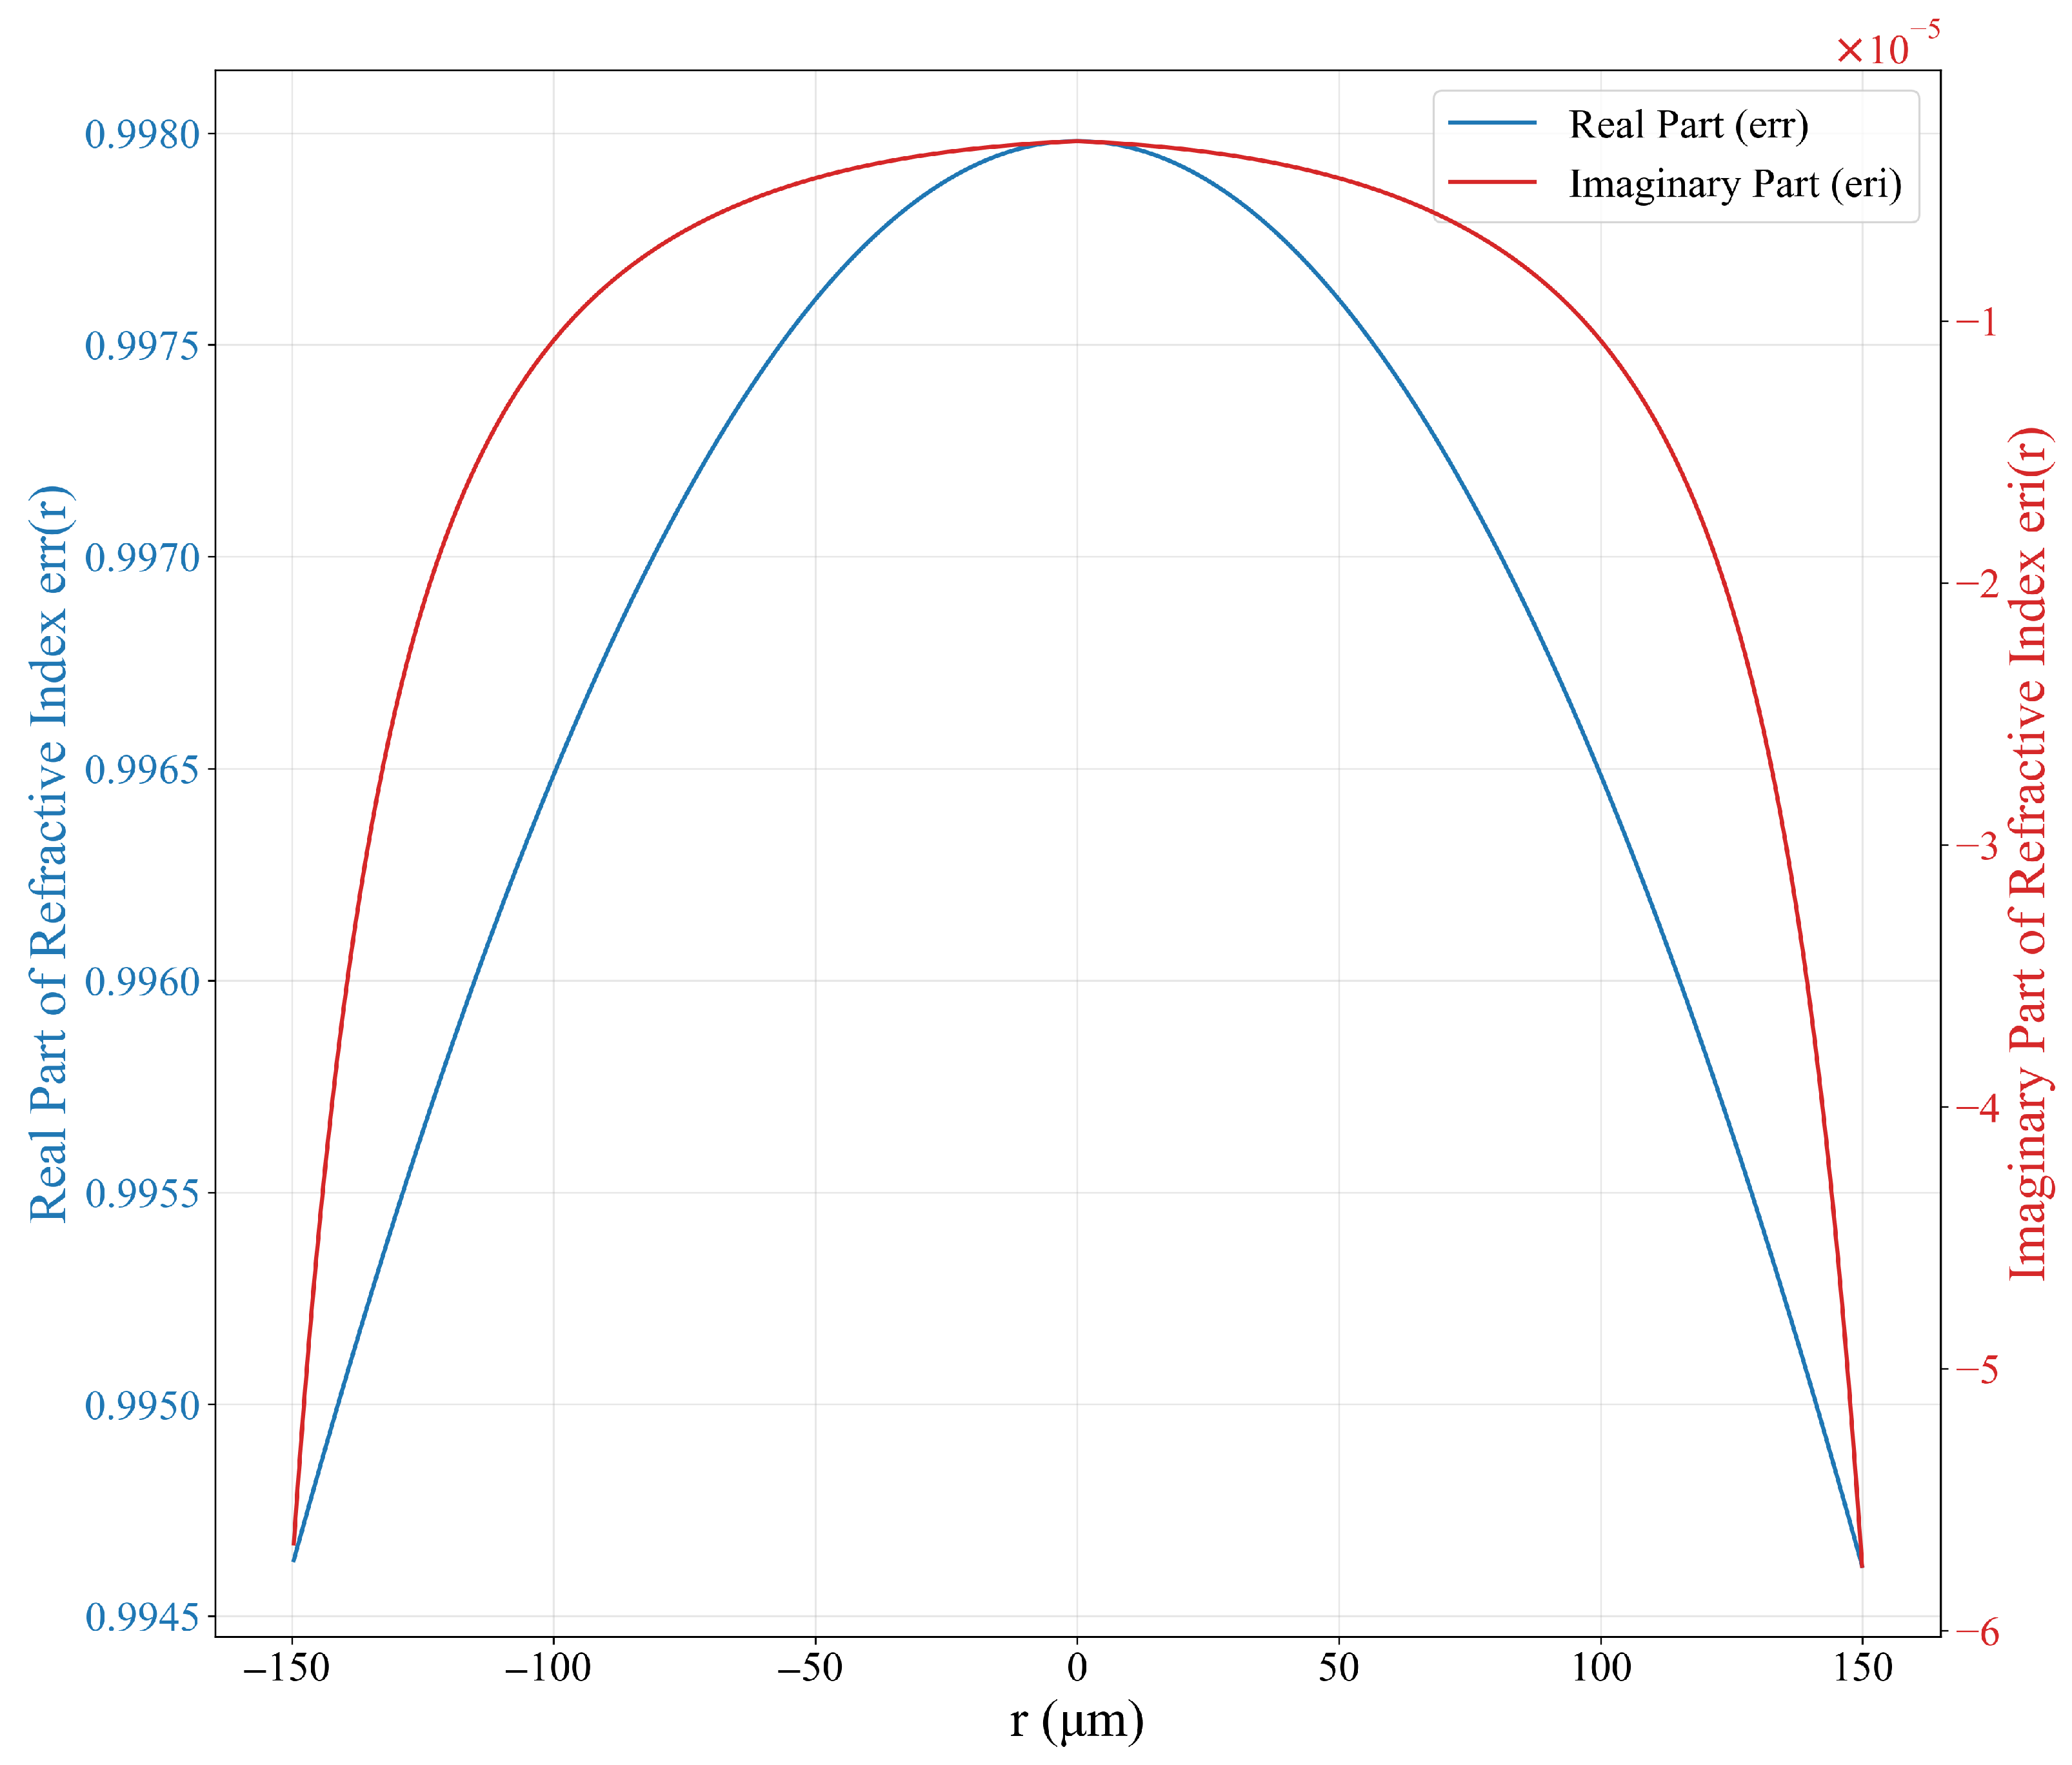
Plasma absorption also provides additional advantages. The imaginary part of the plasma refractive index is correlated with the plasma density. Due to the parabolic distribution of the plasma density, the absolute value of this imaginary part is significantly larger at the edges of the plasma than at its center. Consequently, the plasma waveguide absorbs the side lobes of the laser beam much more strongly than the central main lobe, thereby improving the beam quality. The distribution of the imaginary part of the refractive index is shown in Figure 7.
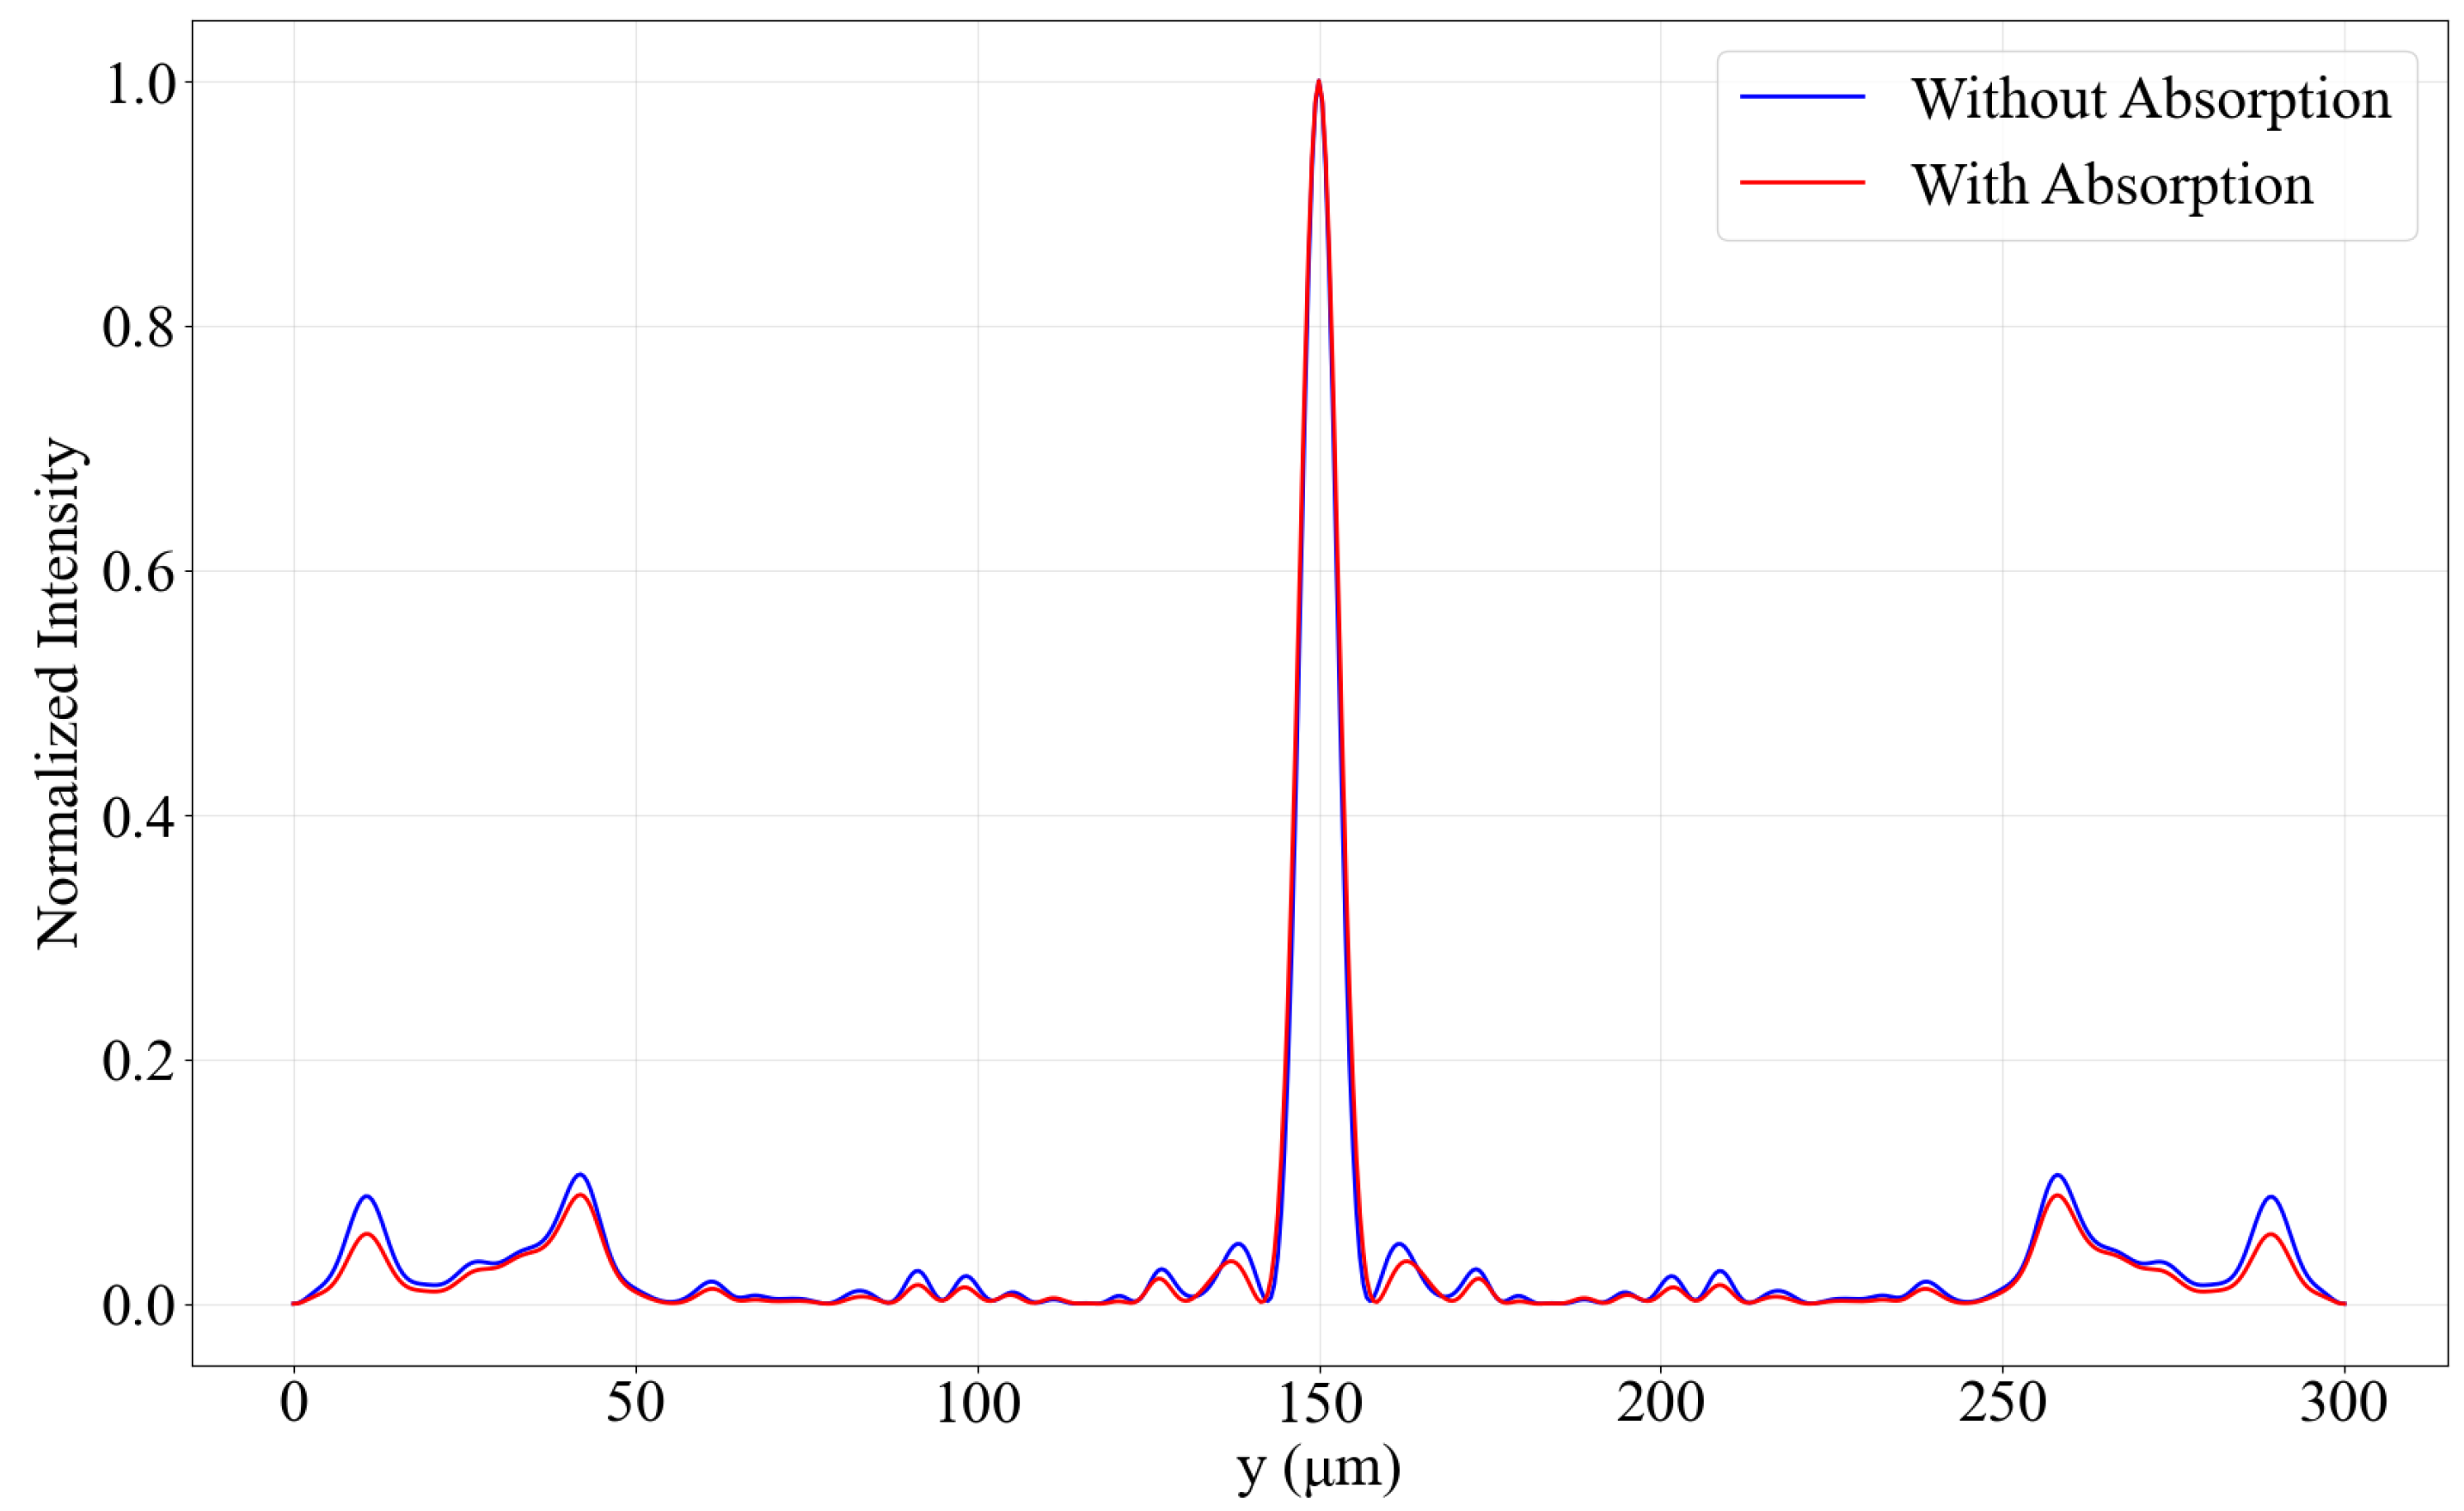
To further illustrate this effect, a simulation was also conducted for the case of d = 5 W 0 with the results presented in Figure 8 and Figure 9.
As the beam propagates along the z-axis, the side lobes are gradually weakened. The plasma waveguide effectively optimizes the beam quality, albeit at the cost of energy loss in the side lobes. The Strehl ratio without plasma absorption is 0.8239, whereas with absorption, it increases to 0.9022—representing an improvement of 9.50%. This phenomenon bears similarities to the self-cleaning effect observed in graded-index fibers; however, the underlying mechanisms are fundamentally different. The self-cleaning effect in graded-index fibers involves energy transfer between different modes, with the total energy remaining constant. In contrast, the “self-cleaning effect” reported in this study arises from the differential energy dissipation between the side lobes and the central main lobe, leading to a reduction in the total energy within the waveguide.

3.4. Waveguide Length Self-Adaptation

In CBC systems based on self-imaging, both the waveguide length and any profile errors are critical factors that directly influence the combining efficiency and beam quality. Taking the previous simulation for d = 2.5 W 0 as an example, the results are shown in Figure 10.
As depicted in Figure 10, a mere 50 µm deviation in the waveguide length results in a dramatic difference in beam quality. At 4150 µm, the on-axis intensity is significantly lower and the side-lobe energy is substantially higher than at 4200 µm, leading to a marked degradation in coherent combining performance. This high sensitivity highlights the need for self-adaptive adjustment of the waveguide length to maintain optimal combining efficiency. Plasma waveguides offer a distinct advantage in the regard that by dynamically tuning the plasma density, the refractive index profile (and thus the self-imaging length) can be actively controlled, enabling real-time, self-adaptive correction of minute length errors.
By systematically varying the parameters N e 0 and Δ N e in Equation (3) (which describes the plasma density profile), a logarithmic-coordinate scan was performed to analyze the relationship between the beam combining position and these two parameters. The curve of electric field variation along the line y = 0 was extracted and then the maximum electric field intensity point was identified from the curve. The resulting map is shown in Figure 11. As shown in Figure 11, the output position X decreases monotonically with increasing Δ N e , while it remains nearly constant (with only a slight upward trend) as N e 0 increases. The underlying physical mechanism is as follows. Δ N e determines the curvature of the refractive index profile—larger Δ N e leads to a steeper curvature, stronger focusing (and thus a shorter self-imaging length), and consequently a smaller X. In contrast, N e 0 sets the background plasma density; increasing N e 0 reduces the relative influence of Δ N e , weakens the focusing effect, and tends to increase X. However, since N e 0 only acts as an offset, its impact on X is much smaller than that of Δ N e . There are some abnormal points in the figure. This is because adjusting the fineness of grid division causes the maximum point to shift while maintaining the original trend—attributed to the beam envelope method adopted in this paper, which is suitable for simulating long waveguides with relatively low computational resources. This method separates the rapidly oscillating propagation constant term of the light beam along its propagation direction from its amplitude term, allowing a relatively large grid step size in the propagation direction. In wave optics, however, the grid step size must be at least smaller than the wavelength of light. This sacrifices the computational accuracy along the propagation axis, resulting in jittery results on the y = 0 axis (as shown in Figure 8b). Such jitter tends to stabilize with the refinement of grid division; yet, when the grid step size is larger than the light wavelength, changing the grid causes the position of the maximum point to drift, and thus the abnormal points in the figure arise. In subsequent research, when more sufficient computational resources are available, the more accurate finite-difference time-domain (FDTD) algorithm and finer grid division will be adopted to simulate the propagation process of light in the waveguide. This will enable better acquisition of the exit position of the light spot and the numerical relationship between N e 0 and Δ N e .
By densely scanning N e 0 and Δ N e , a complete 3D map of X( N e 0 , Δ N e ) can be constructed. This dataset can then be used to train a regression model (or a more flexible lightweight machine learning surrogate), yielding an inverse model that can real-time predict the required ( N e 0 , Δ N e ) pair for any measured length error. Closed-loop control can then be implemented, length errors are measured via interferometry, the inverse model predicts the corrective plasma density parameters, and the plasma source can be adjusted with microsecond latency. This effectively endows the plasma waveguide with self-adaptive length correction capabilities, enabling tolerance to fabrication errors down to the micrometer scale.

3.5. Further Experimental Setup Discussion

The planned experimental setup comprises seven major modules: the Laser Seed Module, composed of a single-frequency narrow-linewidth fiber seed laser that outputs a 1064 nm wavelength laser with a waist spot size W 0 = 5 µm to match the simulation parameters; the Laser Beam Splitting and Amplification Module, including a fiber beam splitter and a Yb-doped fiber amplifier as well as phase control devices; the Laser-Plasma Waveguide Coupling Module, constructed with a microlens array and a six-dimensional adjustment stage to control the axial spacing of laser beams for tight coupling; the Plasma Capillary Gas Cell Module, consisting of a capillary featuring an inner diameter of 300 µm alongside a gas cell; the Plasma Control Module, formed by a high-power high-voltage pulse power supply and discharge electrodes; the Plasma Waveguide Self-Imaging CBC Module, with the capillary fixing base as its core component; and the Plasma Waveguide Self-Imaging Length Feedback Control Module, incorporating a high-resolution pixel CCD, an attenuation sheet, and a data processing unit to monitor spot morphology and Strehl ratio in real time.
The coordination process of each module proceeds as follows, shown in Figure 12: following beam splitting and amplification as well as phase synchronization, the seed laser is collimated and coupled into the plasma waveguide inside the capillary gas cell by the Laser-Plasma Waveguide Coupling Module, while the Plasma Control Module generates a parabolic electron density distribution through discharge; the Plasma Waveguide Self-Imaging CBC Module utilizes this distribution to achieve coherent combination of laser beams, and the Plasma Waveguide Self-Imaging Length Feedback Control Module captures the output spot and combining efficiency in real time while jointly adjusting the parameters of each module to maintain optimal performance.
The core logic for real-time adjustment of plasma parameters is based on the dynamically tunable characteristics of plasma and closed-loop feedback control as specified in the document. Firstly, plasma density can be dynamically adjusted by varying background gas density and discharge voltage, which provides a physical basis for parameter adjustment; furthermore, the CCD of the feedback module collects images of the combined laser spot in real time, and the data processing unit calculates the Strehl ratio and combining efficiency—when combining efficiency is detected below the threshold or spot quality degrades, the system invokes the Talbot distance scanning model based on N e 0 and Δ N e , where N e 0 denotes central electron density and Δ N e represents density gradient. This model demonstrates that with N e fixed, the Talbot distance decreases monotonically as Δ N e increases, while N e 0 can be used for fine-tuning, and the required N e 0 and Δ N e are predicted via the inverse model; subsequently, the plasma control module responds to adjustment commands: to increase Δ N e , the discharge voltage can be raised to enhance the plasma density gradient, and for fine-tuning of N e 0 , the hydrogen pressure in the gas cell is adjusted by a gas mass flow controller to alter the background gas density, thereby modifying the central electron density. Meanwhile, since plasma parameter adjustment can achieve millisecond-level response, combined with a feedback circuit with microsecond-level delay, the entire adjustment process can be completed within the millisecond order—this effectively compensates for self-imaging length deviation caused by waveguide fabrication errors or environmental disturbances, ensuring the plasma waveguide consistently maintains optimal self-imaging conditions and enables long-term stable coherent combination of high-power lasers.

4. Conclusions

In summary, this study successfully demonstrates a novel approach to coherent beam combining (CBC) using the self-imaging phenomenon in plasma waveguides, providing a promising alternative to traditional CBC methods, as well as presenting a feasible experimental setup. Simulations conducted in this work robustly confirm the feasibility of this technique, validating both the self-imaging effect and effective beam combination—particularly when the constituent beams are closely spaced. By tightly coupling the beams into the plasma waveguide, this system addresses the issue of excessive complexity in traditional CBC methods. While plasma absorption introduces a moderate energy loss (limiting the threshold peak intensity to approximately 1 × 10 12 W/m2), it also contributes to improved beam quality by suppressing side lobes—representing a favorable trade-off. This confirms the feasibility of achieving relatively high output intensities using this method. Crucially, this study identifies a viable pathway for real-time, self-adaptive control of the waveguide length by dynamically tuning the plasma density profile. The intrinsic flexibility of plasma waveguides to actively adjust their refractive index provides an unprecedented advantage, enabling precise compensation for minute length errors and ensuring optimal coherent combining efficiency. This work lays a solid foundation for the development of robust, high-power laser systems with enhanced beam quality and stability, paving the way for advancements in applications ranging from industrial processing to scientific research.

Author Contributions

Conceptualization, Y.H. (Yixuan Huang) and H.Z.; methodology, Y.H. (Yixuan Huang) and Z.Y.; software, Y.H. (Yixuan Huang); validation, Y.H. (Yixuan Huang), Z.Y. and Y.H. (Yihang Huang); formal analysis, Z.Y.; investigation, X.L. and J.C.; resources, H.Z. and Y.W.; data curation, Y.H. (Yixuan Huang); writing—original draft preparation, Y.H. (Yixuan Huang); visualization, Y.H. (Yixuan Huang); supervision, H.Z., X.L. and Z.Y.; project administration, H.Z.; funding acquisition, H.Z. All authors have read and agreed to the published version of the manuscript.

Funding

This study was financially supported by Sichuan Science and Technology Program (No. 2024YFHZ0002) and the Open Foundation of the State Key Laboratory of Precision Space-time Information Sensing Technology (No. STSL2025-B-04-01(L)).

Institutional Review Board Statement

Not applicable.

Informed Consent Statement

Not applicable.

Data Availability Statement

The data presented in this study are available on request from the corresponding author. The data are not publicly available due to the data form part of an ongoing study.

Conflicts of Interest

The authors declare no conflicts of interest.

References

  1. Shi, W.; Schulzgen, A.; Amezcua, R.; Zhu, X.; Alam, S.-U. Fiber lasers and their applications: Introduction. J. Opt. Soc. Am. B 2017, 34, FLA1. [Google Scholar] [CrossRef]
  2. Yan, Y. Research on Key Technologies of All-fiber Coherent Beam Combination System. Ph.D. Thesis, Tsinghua University, Beijing, China, 2023. [Google Scholar]
  3. Müller, M.; Aleshire, C.; Klenke, A.; Haddad, E.; Légaré, F.; Tünnermann, A.; Limpert, J. 10.4 kW coherently combined ultrafast fiber laser. Opt. Lett. 2020, 45, 3083. [Google Scholar] [CrossRef]
  4. Liu, B.; Huang, Z.; Zhang, F.; Xia, H.; Zhou, D.; Li, J.; Zheng, J.; Zhang, R.; Li, P.; Peng, Z.; et al. Recent progress of temporal coherent combination of chirped pulses in fiber lasers. High Power Laser Part. Beams 2023, 35, 5–20. [Google Scholar] [CrossRef]
  5. Yang, B.; Wu, Y.; Song, Y.; Zhang, Z. Temporal Coherent Combination of 256 Femtosecond Pulses. Chin. J. Lasers 2024, 51, 118–124. [Google Scholar]
  6. Zhang, X.; Gao, Y.; Geng, Y.; Wang, Y.; Zhou, Z. Study on coherent combined beam quality with fixed polarization laser arranged along Fermat spiral. Laser J. 2025, 46, 17–23. [Google Scholar] [CrossRef]
  7. Shi, Z.; Chang, H.; Wang, D.; Guo, H.; Dong, Z.; Du, Z.; Liang, C.; Li, C.; Zhou, P.; Wei, Z.; et al. High power and high energy four-channel coherent combining femtosecond laser system based on Yb-doped rod fiber. Acta Phys. Sin. 2025, 74, 124–131. [Google Scholar] [CrossRef]
  8. Uberna, R.; Bratcher, A.; Alley, T.G.; Sanchez, A.D.; Flores, A.S.; Pulford, B. Coherent combination of high power fiber amplifiers in a two-dimensional re-imaging waveguide. Opt. Express 2010, 18, 13547–13553. [Google Scholar] [CrossRef]
  9. Yan, Y.; Yang, T.; Guo, Z.; Cheng, H.; Li, Y.; Fang, Y.; Xia, Y.; He, Q.; Li, C.; Lin, C.; et al. Application of ionized capillary plasma in laser acceleration. Chin. Sci. Bull. 2023, 68, 2058–2069. [Google Scholar] [CrossRef]
  10. Butler, A.; Spence, D.J.; Hooker, S.M. Guiding of High-Intensity Laser Pulses with a Hydrogen-Filled Capillary Discharge Waveguide. Phys. Rev. Lett. 2002, 89, 185003. [Google Scholar] [CrossRef]
  11. Kaiser, J.; Liška, M.; Samek, O.; Egri, T.; Ritucci, A.; Reale, A.; Tomassetti, G.; Reale, L.; Palladino, L.; Kukhlevsky, S.V.; et al. Non-ablative capillary z-pinch for plasma-based waveguide. Czech. J. Phys. 2005, 55, 35–44. [Google Scholar] [CrossRef]
  12. Dong, K.; Wu, Y.; Zheng, W.; Zhu, B.; Cao, L.; He, Y.; Ma, Z.; Liu, H.; Hong, W.; Zhou, W.; et al. Density measurement and magnetohydrodynamic simulation of gas-filled discharge capillary. Acta Phys. Sin. 2011, 60, 015201. [Google Scholar]
  13. Jang, D.G.; Kim, M.S.; Nam, I.H.; Uhm, H.S.; Suk, H. Density evolution measurement of hydrogen plasma in capillary discharge by spectroscopy and interferometry methods. Appl. Phys. Lett. 2011, 99, 141502. [Google Scholar] [CrossRef]
  14. Higashiguchi, T.; Hikida, M.; Terauchi, H.; Bai, J.X.; Kikuchi, T.; Tao, Y.; Yugami, N. Characterization of the plasma parameters of a capillary discharge-produced plasma channel waveguide to guide an intense laser pulse. Rev. Sci. Instrum. 2010, 81, 046109. [Google Scholar] [CrossRef]
  15. Terauchi, H.; Bobrova, N.; Sasorov, P.; Kikuchi, T.; Sasaki, T.; Higashiguchi, T.; Yugami, N.; Kodama, R. Observation and numerical analysis of plasma parameters in a capillary discharge-produced plasma channel waveguide. J. Appl. Phys. 2011, 109, 053304. [Google Scholar] [CrossRef]
  16. Antsiferov, P.S.; Akdim, M.R.; van Dam, H.T. Direct measurement of the matched spot size in a slow capillary discharge optical waveguide. Rev. Sci. Instrum. 2007, 78, 123107. [Google Scholar] [CrossRef]
  17. Liu, J.; Li, W.; Liu, J.; Qin, Z.; Wang, W.; Qi, R.; Zhang, Z.; Yu, C.; Fang, M.; Feng, K.; et al. Measurement of the matched spot size in a capillary discharge waveguide with a collimated laser. AIP Adv. 2018, 8, 105204. [Google Scholar] [CrossRef]
  18. Qin, Z.; Li, W.; Liu, J.; Liu, J.; Yu, C.; Wang, W.; Qi, R.; Zhang, Z.; Fang, M.; Feng, K.; et al. Optimization of a hydrogen-filled quartz capillary discharge waveguide for high-energy laser wakefield acceleration. Plasma Phys. 2018, 25, 043117. [Google Scholar] [CrossRef]
  19. Abuazoum, S.; Wiggins, S.M.; Issac, R.C.; Welsh, G.H.; Vieux, G.; Ganciu, M.; Jaroszynski, D.A. A high voltage pulsed power supply for capillary discharge waveguide applications. Rev. Sci. Instrum. 2011, 82, 063505. [Google Scholar] [CrossRef] [PubMed]
  20. Woolley, C.J.; O’Keeffe, K.; Chung, H.K.; Hooker, S.M. Time-resolved plasma temperature measurements in a laser-triggered hydrogen-filled capillary discharge waveguide. Plasma Sources Sci. Technol. 2011, 20, 055014. [Google Scholar] [CrossRef]
  21. Bobrova, N.A.; Sasorov, P.V.; Benedetti, C.; Bulanov, S.S.; Geddes, C.G.R.; Schroeder, C.B.; Esarey, E.; Leemans, W.P. Laser-heater assisted plasma channel formation in capillary discharge waveguides. Phys. Plasmas 2013, 20, 020703. [Google Scholar] [CrossRef]
  22. Magarotto, M.; Sadeghikia, F.; Schenato, L.; Rocco, D.; Santagiustina, M.; Galtarossa, A. Plasma Antennas: A Comprehensive Review. IEEE Access 2024, 12, 80468–80490. [Google Scholar] [CrossRef]
  23. Podolsky, V.; Semnani, A.; Macheret, S.O. Experimental and numerical studies of a tunable plasma antenna sustained by RF power. IEEE Trans. Plasma Sci. 2020, 48, 3524–3534. [Google Scholar] [CrossRef]
  24. Ehrlich, Y.; Cohen, C.; Zigler, A.; Krall, J.; Sprangle, P.; Esarey, E. Guiding of high intensity laser pulses in straight and curved plasma channel experiments. Phys. Rev. Lett. 1996, 77, 4186–4189. [Google Scholar] [CrossRef] [PubMed]
  25. Spence, D.J.; Hooker, S.M. Investigation of a hydrogen plasma waveguide. Phys. Rev. E 2000, 63, 015401. [Google Scholar] [CrossRef] [PubMed]
  26. Spence, D.J.; Butler, A.; Hooker, S.M. First demonstration of guiding of high-intensity laser pulses in a hydrogen-filled capillary discharge waveguide. J. Phys. B At. Mol. Opt. Phys. 2001, 34, 4103–4112. [Google Scholar] [CrossRef]
  27. Hooker, S.M.; Spence, D.J.; Smith, R.A. Investigation of a discharge-ablated capillary waveguide for high-intensity laser pulses. In Proceedings of the Conference on Lasers and Electro-Optics (CLEO), Baltimore, MD, USA, 23–28 May 1999. [Google Scholar]
  28. Gonsalves, A.J.; Rowlands-Rees, T.P.; Broks, B.H.; van der Mullen, J.J.; Hooker, S.M. Transverse Interferometry of a Hydrogen-Filled Capillary Discharge Waveguide. Phys. Rev. Lett. 2007, 98, 025002. [Google Scholar] [CrossRef]
  29. Gonsalves, A.J.; Liu, F.; Bobrova, N.A.; Sasorov, P.V.; Pieronek, C.; Daniels, J.; Antipov, S.; Butler, J.E.; Bulanov, S.S.; Waldron, W.L.; et al. Demonstration of a high repetition rate capillary discharge waveguide. J. Appl. Phys. 2016, 119, 033302. [Google Scholar] [CrossRef]
Figure 1. Simulation on Electric Field Distribution along the waveguide under Single Beam Incidence.
Applsci 15 12141 g001
Figure 2. Simulation on Electric Field Distribution along the waveguide under Multiple Beam Incidence (a) d = 1.25 W 0 (b); d = 2.5 W 0 (c); d = 5 W 0 .
Applsci 15 12141 g002
Figure 3. Comparison of Power Density Distribution along the y-axis under different separation distances considering Multiple Beam Incidence.
Applsci 15 12141 g003
Figure 4. Simulation on Electric Field Distribution along the waveguide under Multiple Beam Incidence considering absorption, d = 1.25 W 0 .
Applsci 15 12141 g004
Figure 5. The comparison of the spot profile at z = 4200 µm and z = 12,200 µm under Multiple Beam Incidence considering absorption, d = 1.25 W 0 .
Applsci 15 12141 g005
Figure 6. Temperature arise caused by absorption of different average laser power density under Multiple Beam Incidence, d = 5 W 0 .
Applsci 15 12141 g006
Figure 7. Dielectric constant distribution of Plasma Waveguide.
Applsci 15 12141 g007
Figure 8. (a) Electric Field Distribution along the waveguide under Multiple Beam Incidence considering absorption, d = 5 W 0 ; (b) Electric Field varying along y = 0 line.
Applsci 15 12141 g008
Figure 9. The Comparison between Output spot profiles at different place on z-axis, d = 5 W 0 , x = 12,200 µm.
Applsci 15 12141 g009
Figure 10. The comparison between Output spot profiles at different place on z-axis, d = 2.5 W 0 .
Applsci 15 12141 g010
Figure 11. Scanning results of the Talbot distance with respect to N e 0 and Δ N e , d = 5 W 0 .
Applsci 15 12141 g011
Figure 12. The experimental setup and flow chart.
Applsci 15 12141 g012
Disclaimer/Publisher’s Note: The statements, opinions and data contained in all publications are solely those of the individual author(s) and contributor(s) and not of MDPI and/or the editor(s). MDPI and/or the editor(s) disclaim responsibility for any injury to people or property resulting from any ideas, methods, instructions or products referred to in the content.