Feature Importance Ranking Using Interval-Valued Methods and Aggregation Functions for Machine Learning Applications
Abstract
1. Introduction
2. Interval Methods and Aggregation Functions
3. Algorithm and Experimental Details
3.1. Interval-Valued Weighted Feature Ranking
| Algorithm 1: IVWFR: Interval-based Weighted Feature Ranking and Selection |
 |
3.2. Cross-Validation and Importance Interval Estimation
3.3. Interval-Valued Aggregation, Normalization, and Feature Scoring
- Step 1: Calculate the width of each interval
- Step 2: Determine the representative value for each interval
- Lower bound: ;
- Upper bound: ;
- Midpoint: .
- Step 3: Calculate the weight for each interval
- Step 4: Normalize the weights
- Step 5: Calculate the resulting interval
3.4. Feature Selection and Final Model Training
- Step 1: Interval Center and Width Calculation
- Step 2: Normalization of Center and Width
- Step 3: Score Calculation
- Weighted arithmetic mean
- Weighted geometric mean
- Weighted harmonic mean
- Arithmetic mean—provides a linear balance between importance and stability.
- Geometric mean—exhibits higher sensitivity to smaller values (a near-zero value in either component will significantly lower the score).
- Harmonic mean—amplifies the impact of small values even further than the geometric mean, making it suitable when low stability or importance will drastically reduce the score.
- Step 4: Feature Ranking
3.5. Hyperparameters and Their Optimization Using Optuna
- n_splits—number of folds for stratified k-fold cross-validation.
- fold_size—desired proportion of the dataset used for each training fold.
- random_state—seed for the random number generator, ensuring reproducibility.
- selection_method—method for selecting the features mean and median.
- alpha—weight given to interval’s center in feature score (average importance).
- representative—representative point in interval: left, right or center.
- mean_type—type of mean to combine center and width: arithmetic, geometric or harmonic.
3.6. Performance Metrics
4. Datasets
5. Results
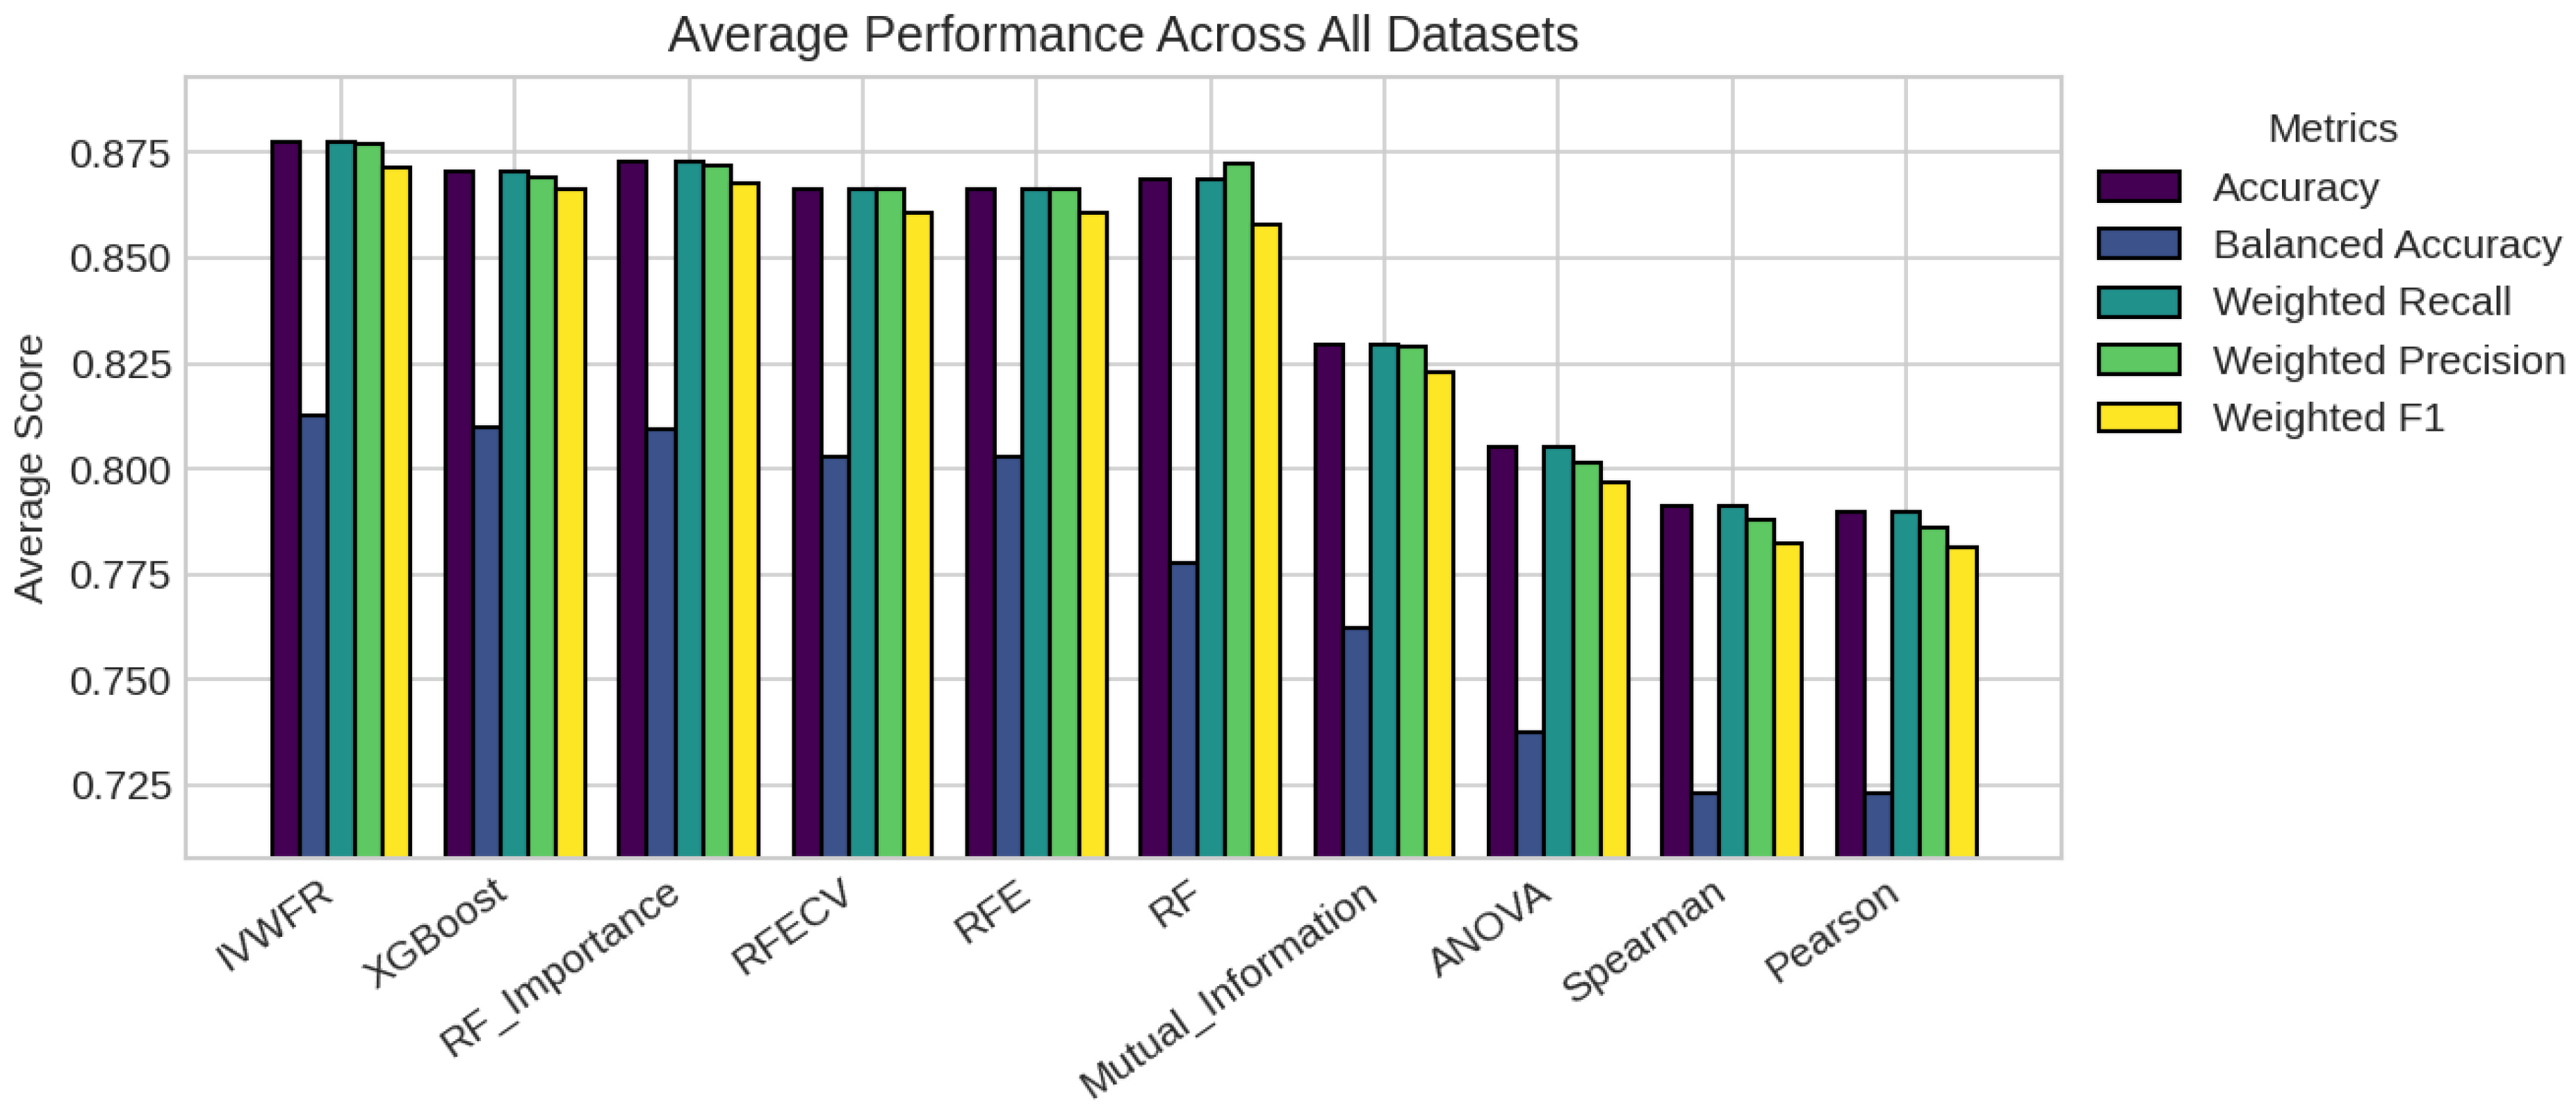
5.1. Performance Analysis
5.2. Statistical Significance and Discussion
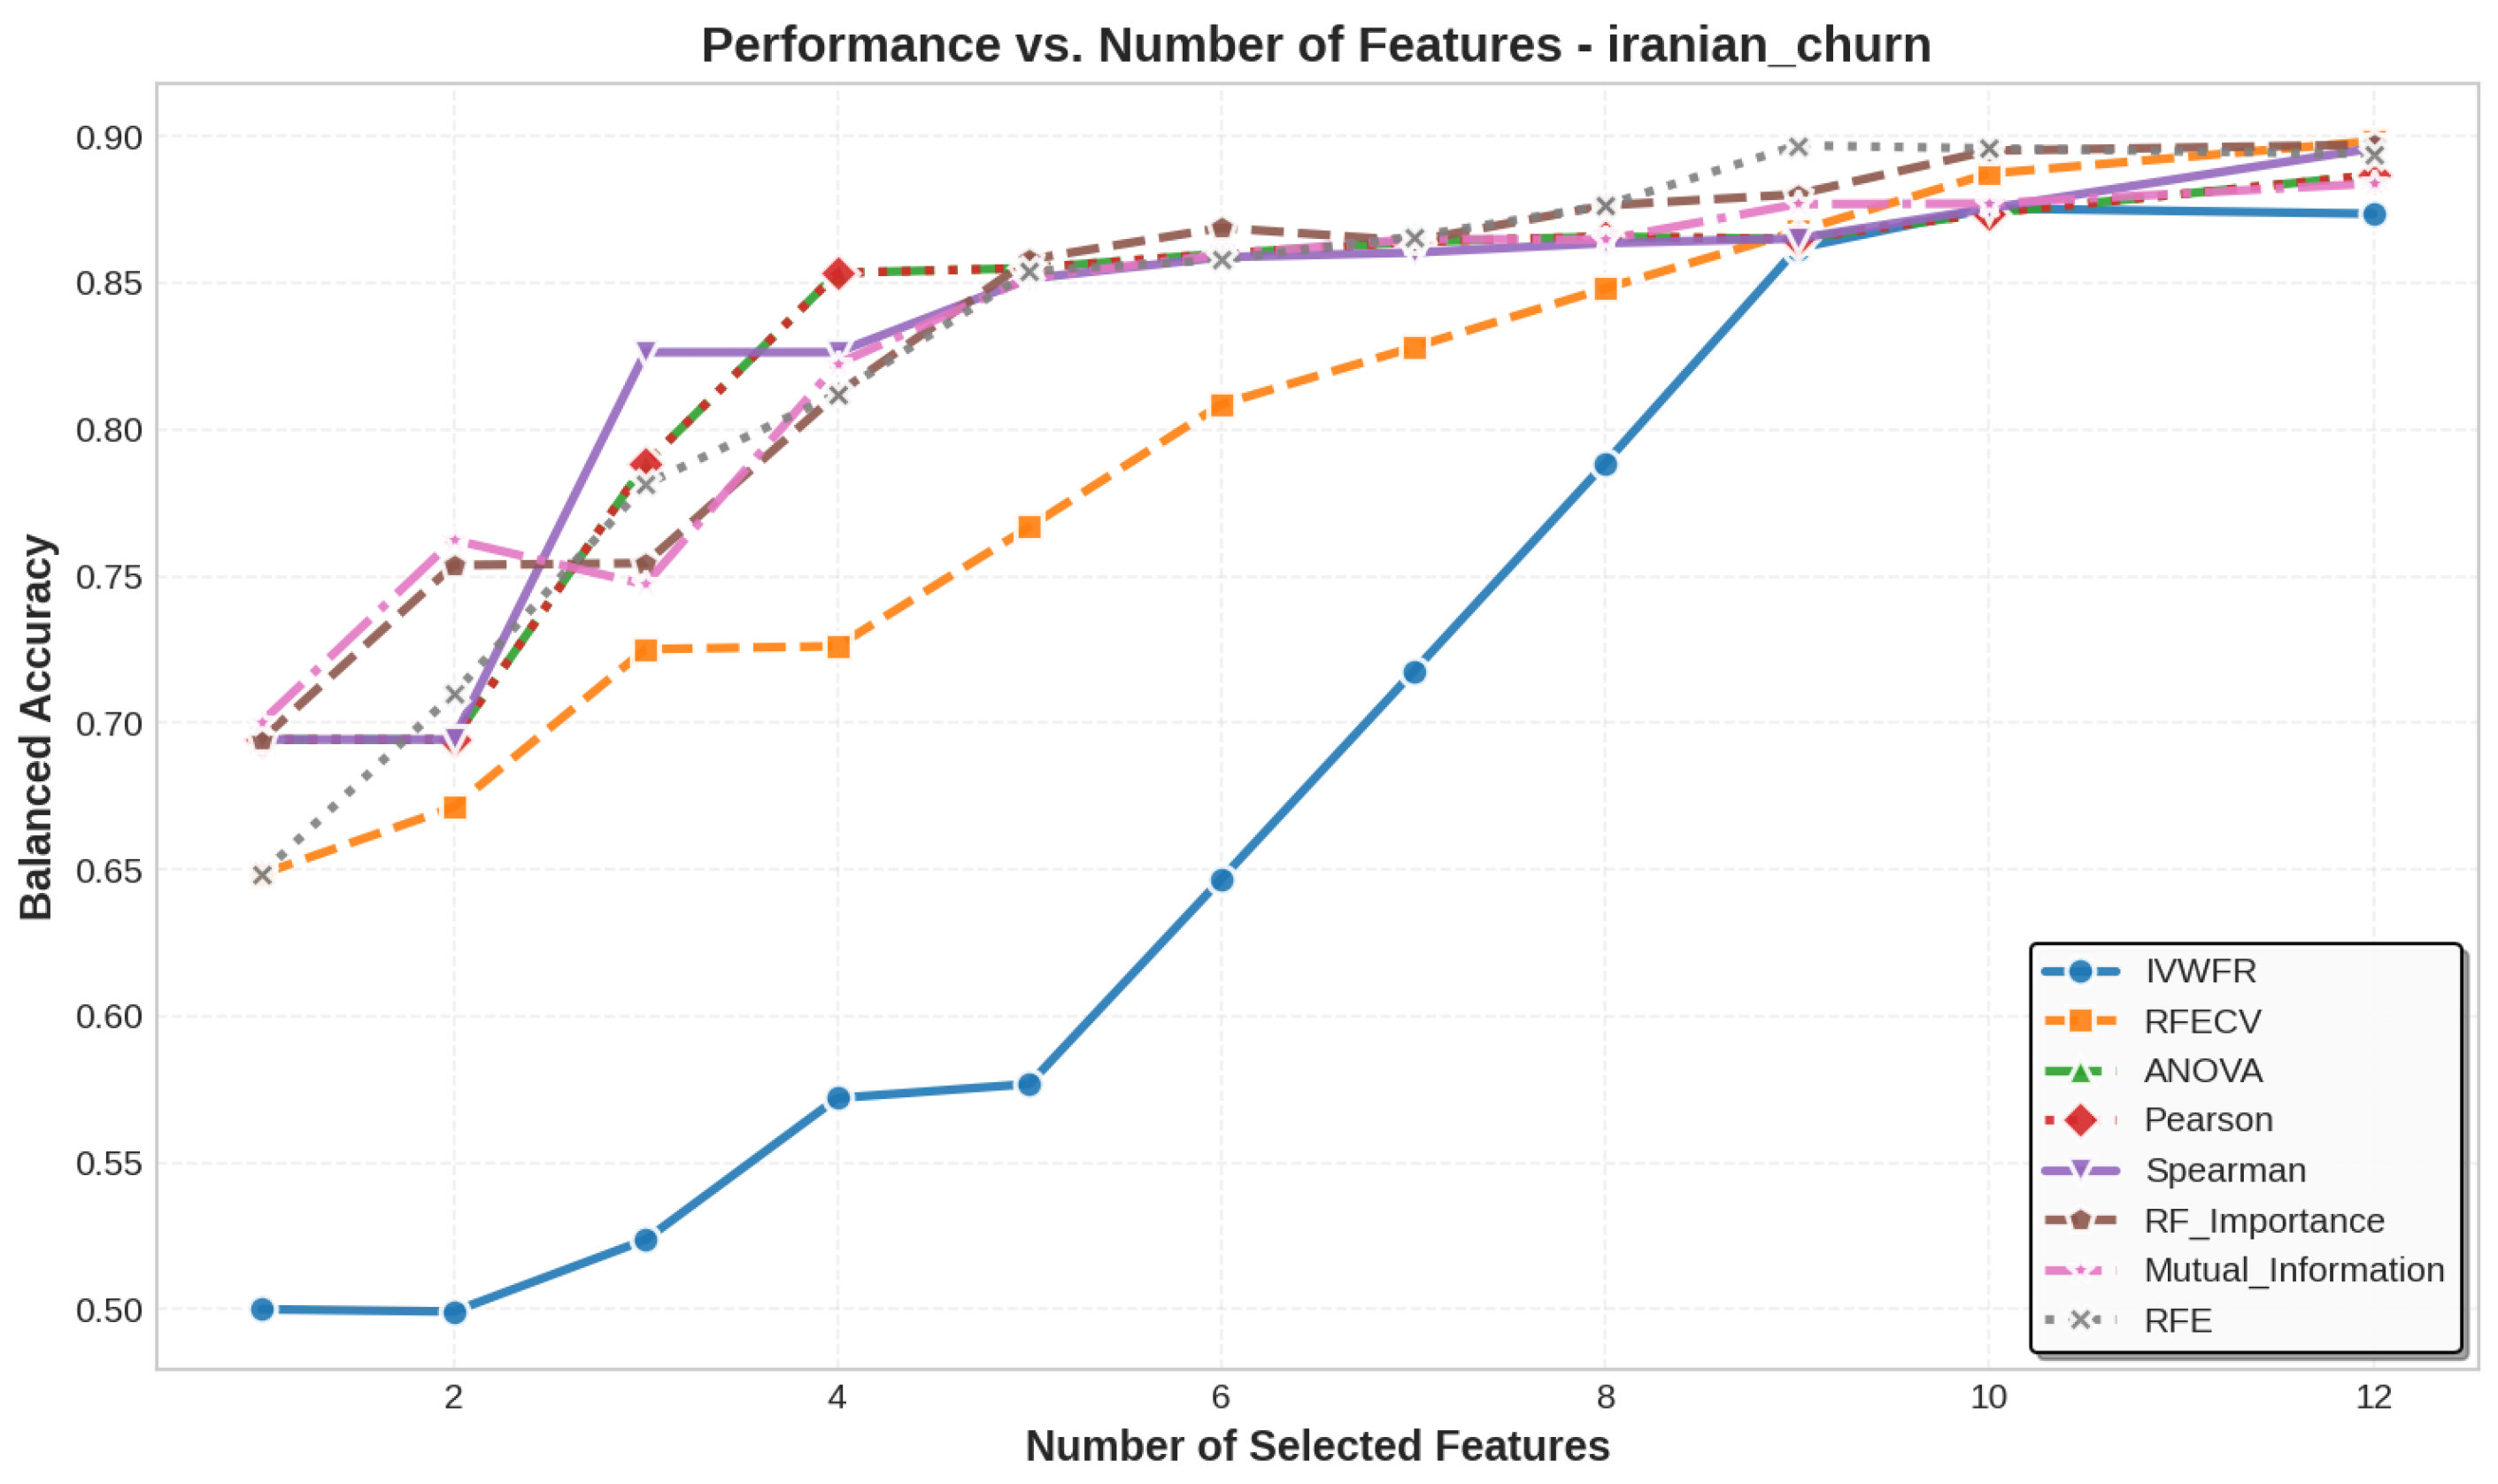
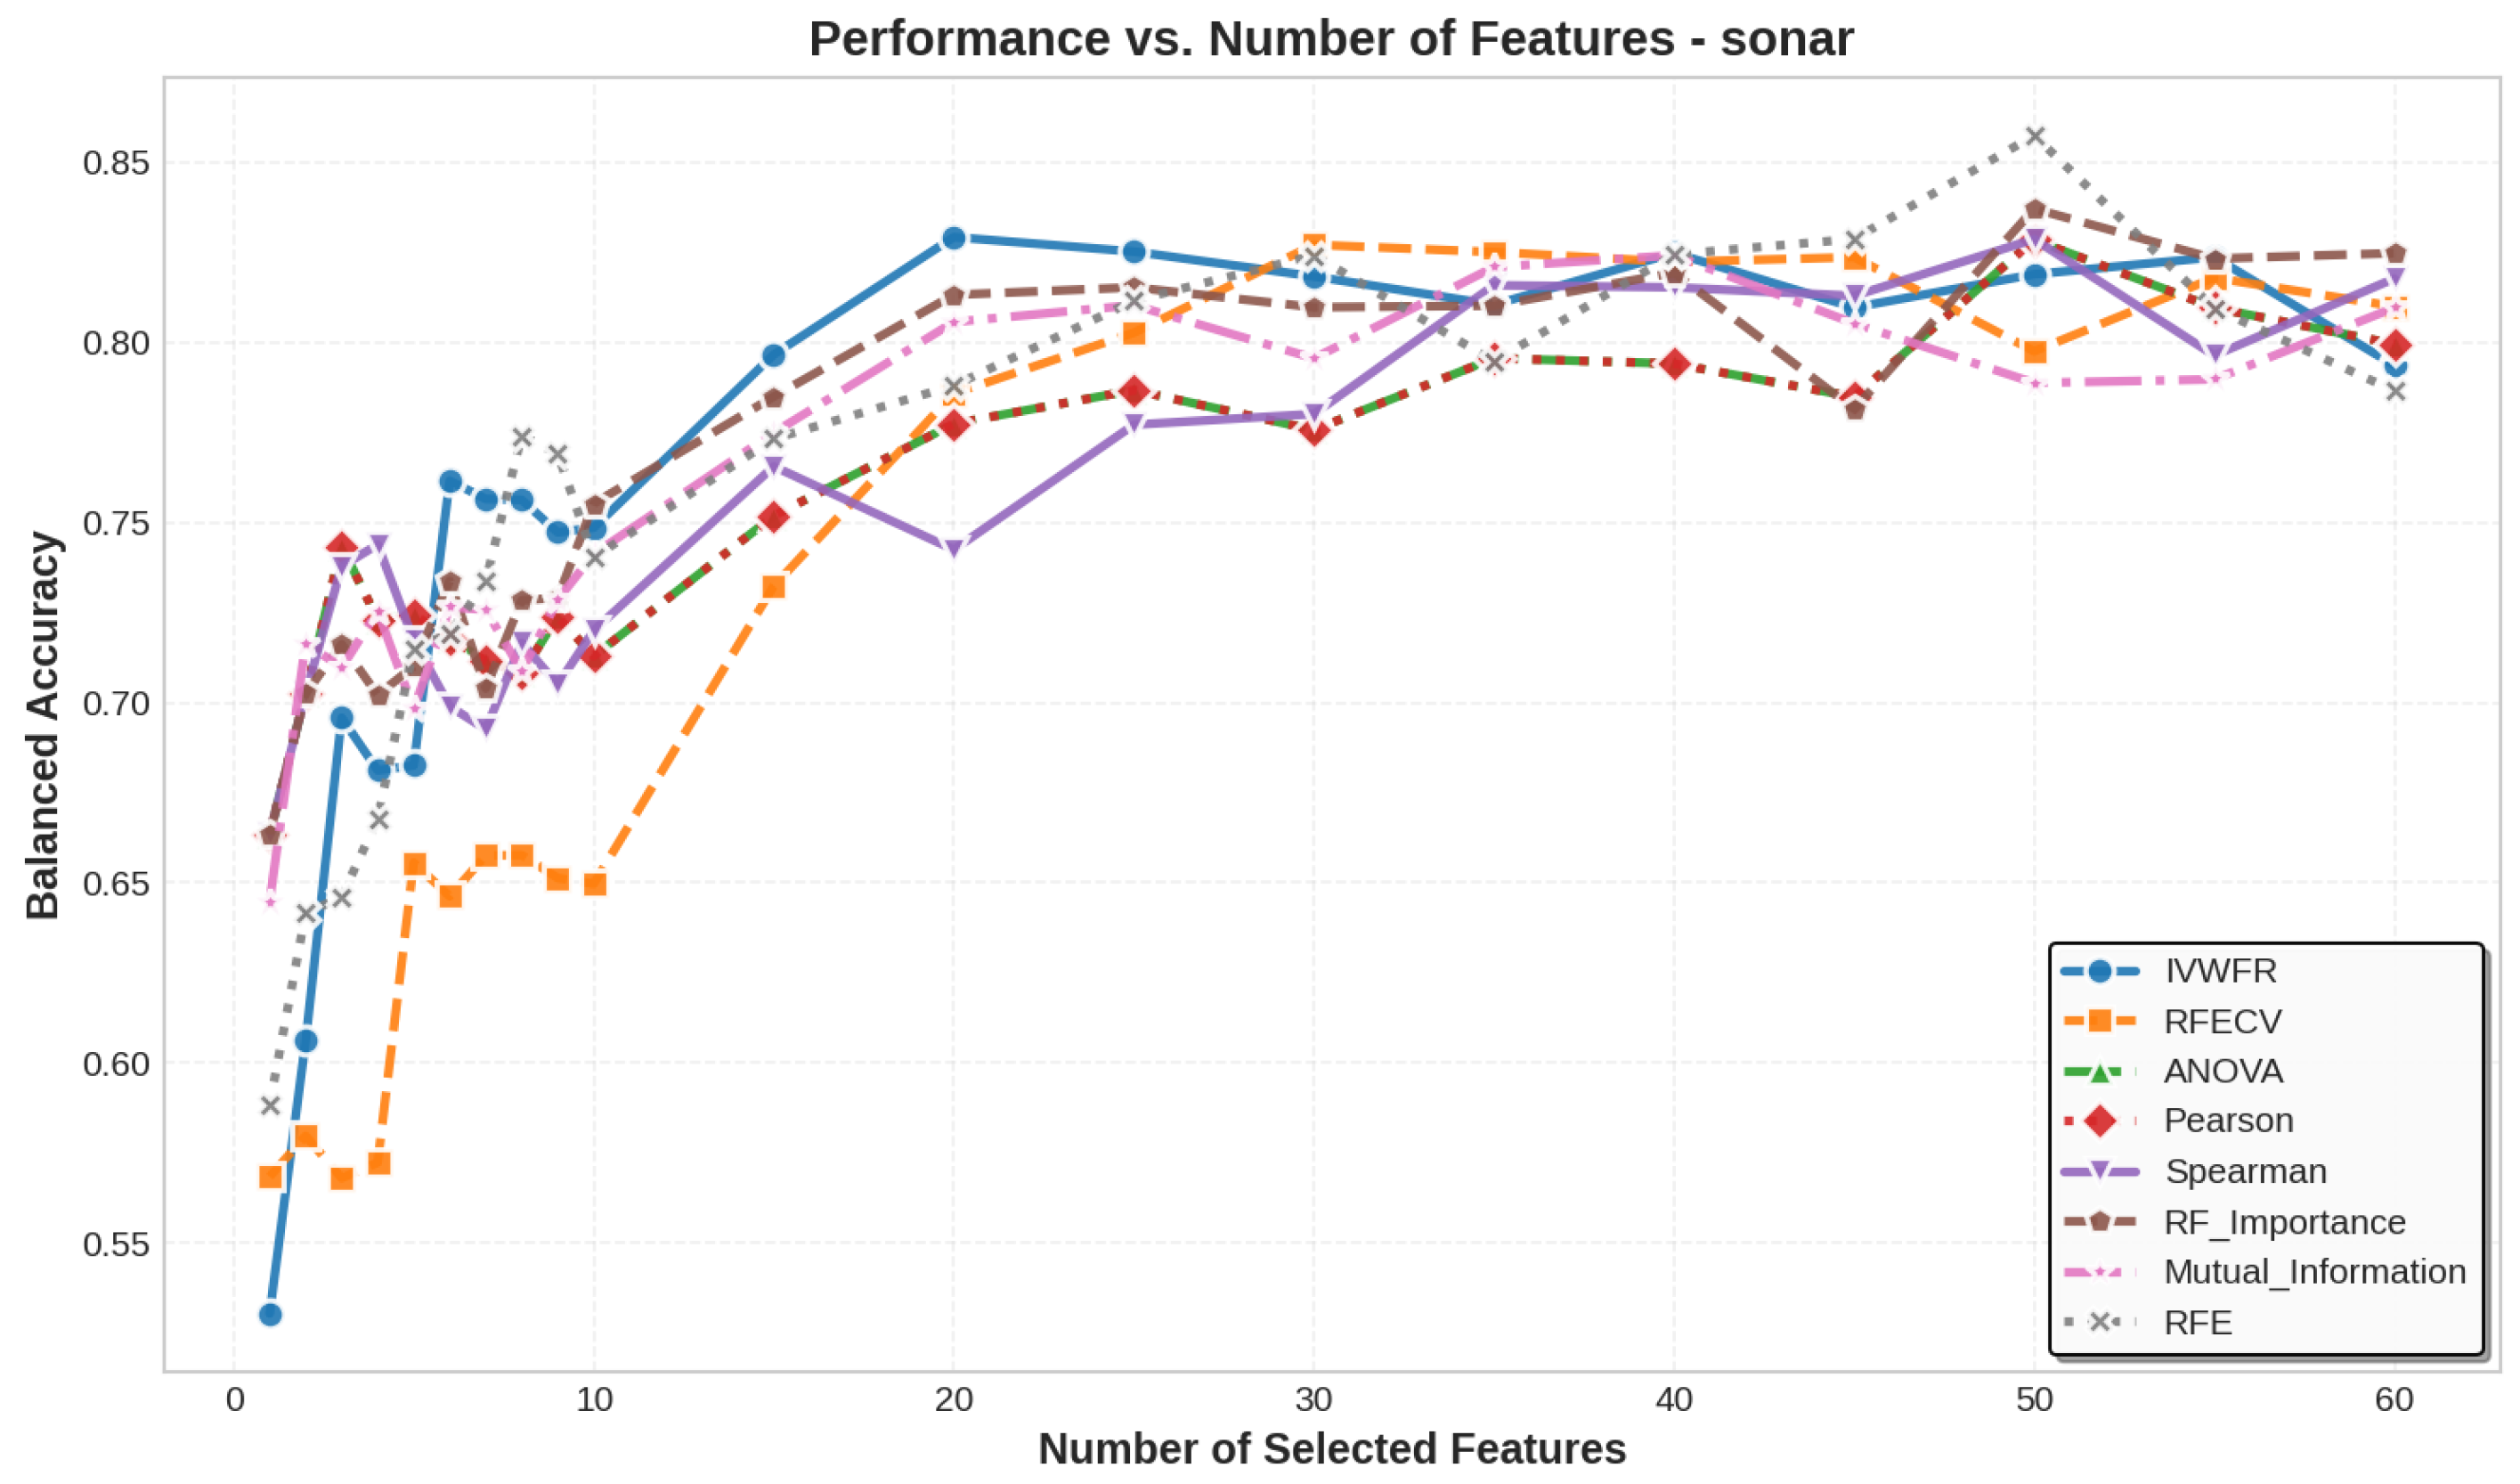
5.3. Number of Features Selected
5.4. Feature Selection Overlap Analysis
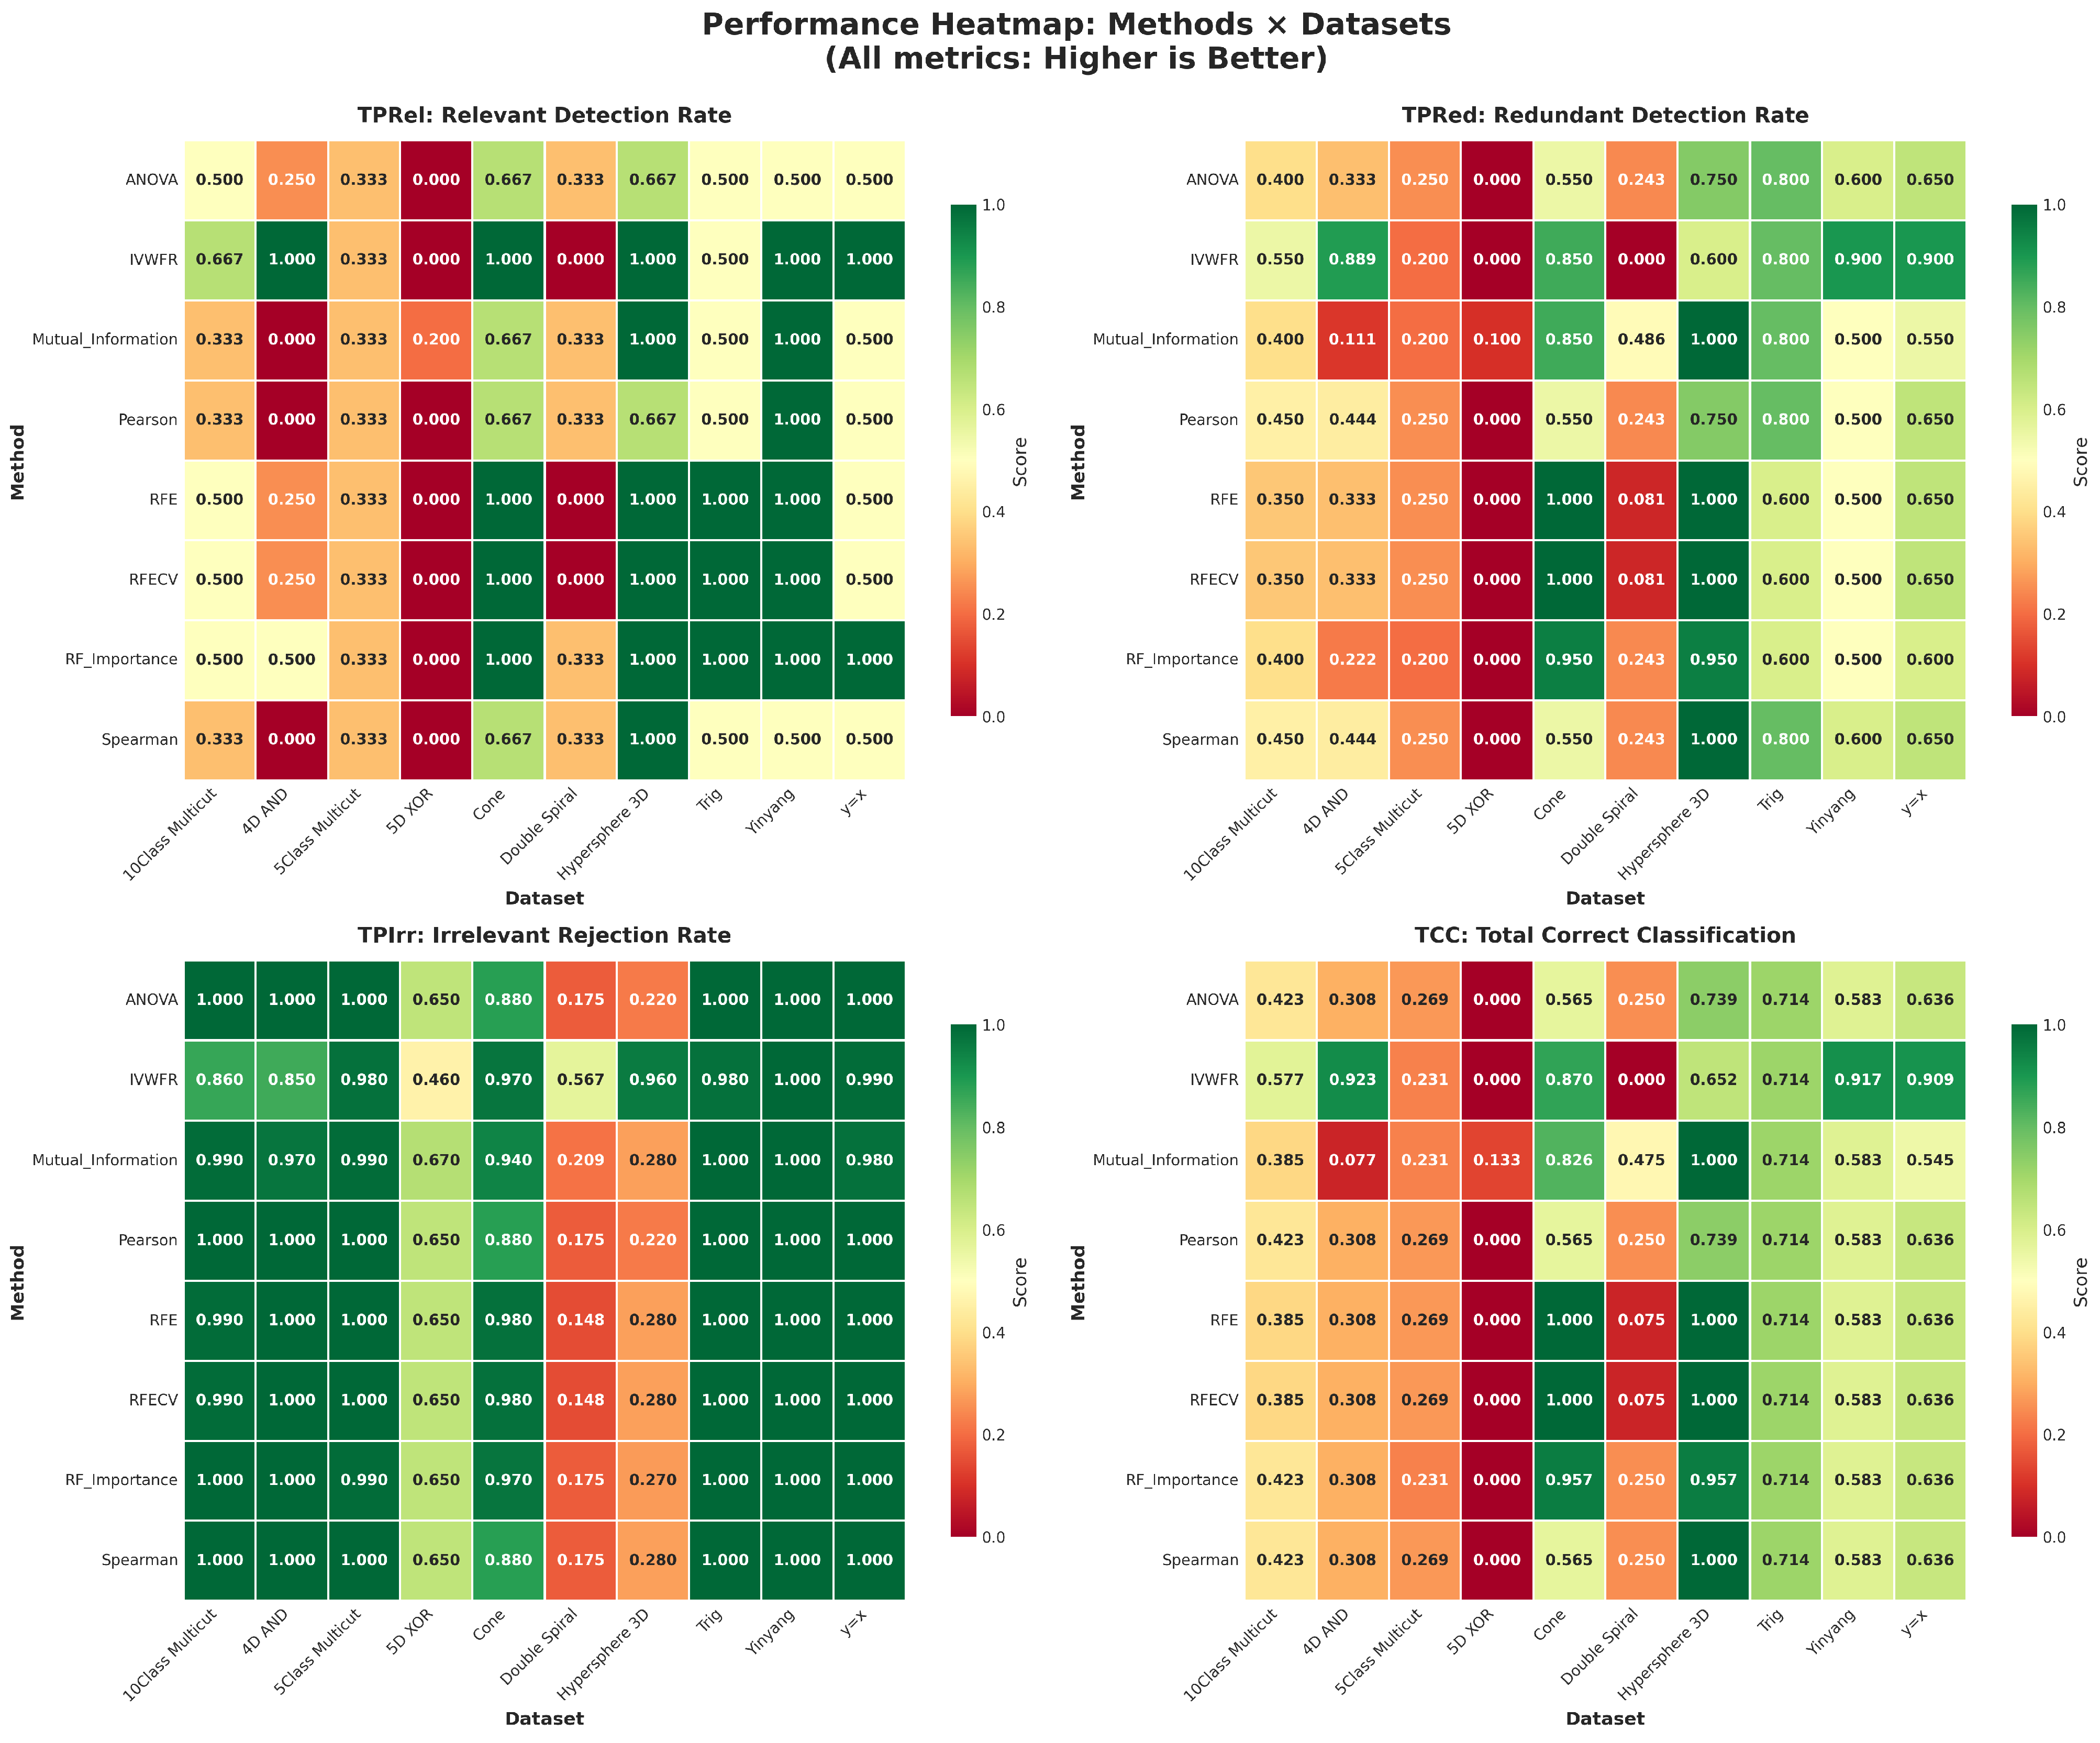
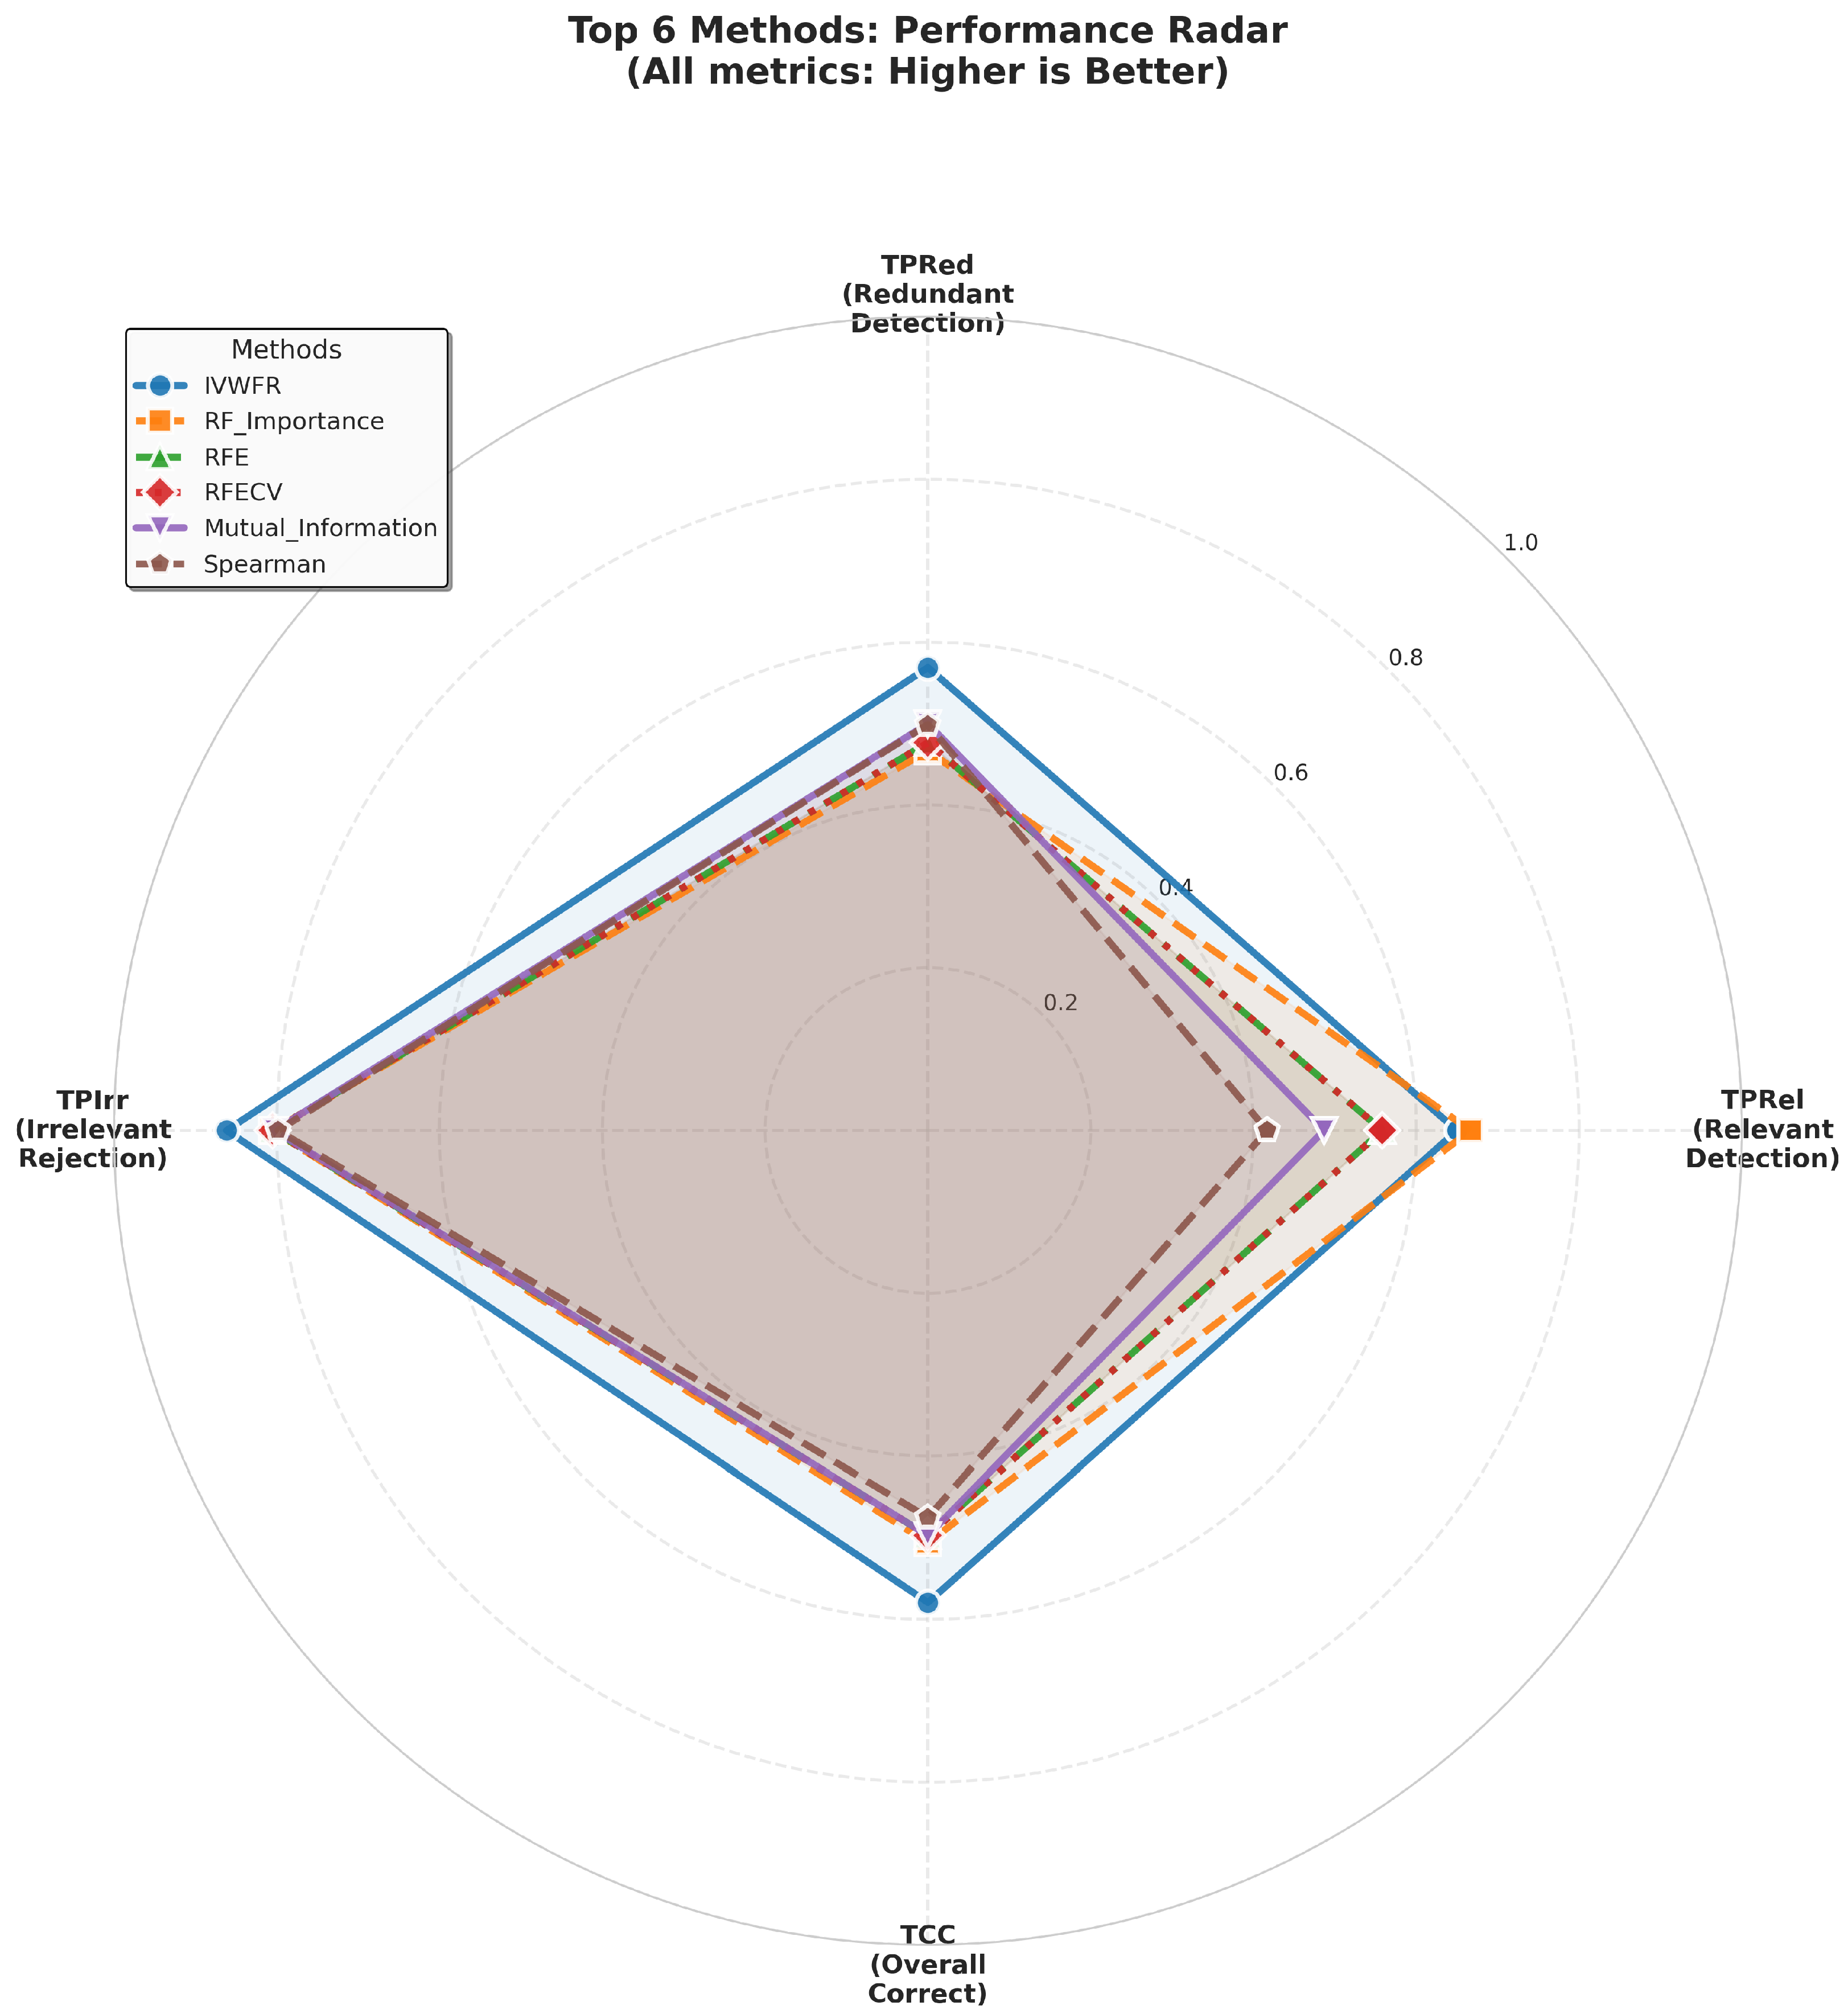
5.4.1. Overlap on Synthetic Datasets
5.4.2. Overlap on Real Datasets
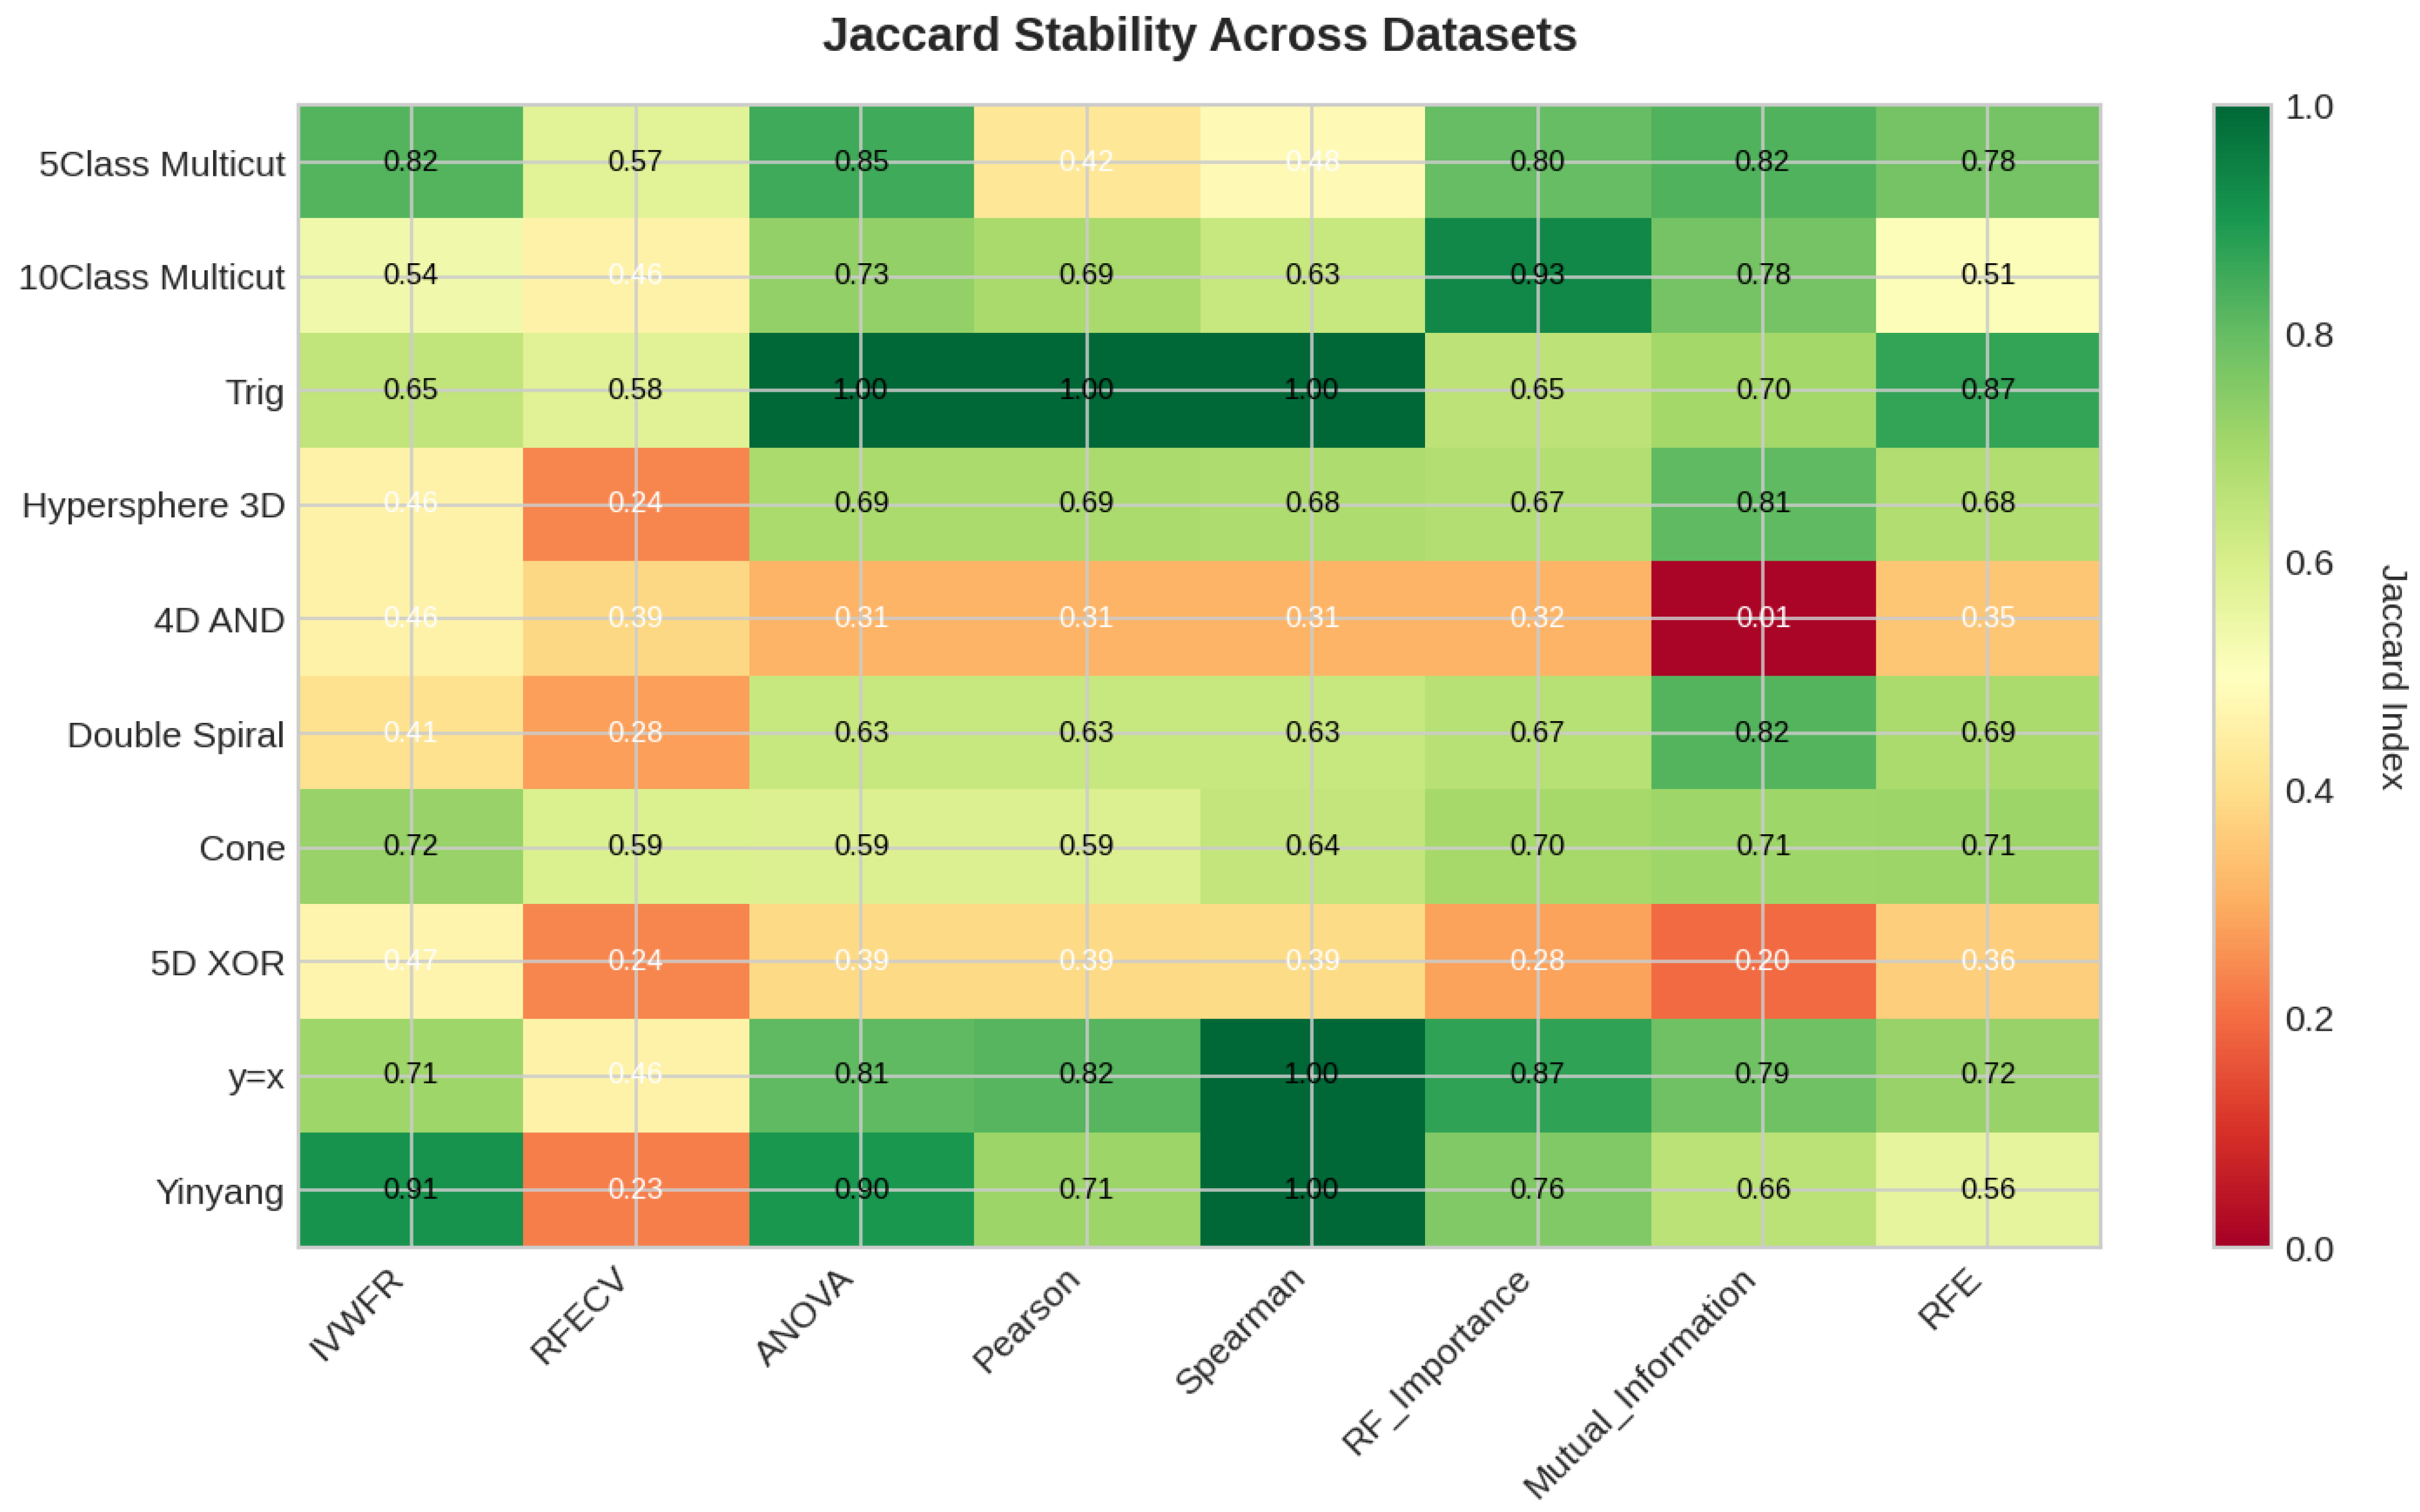
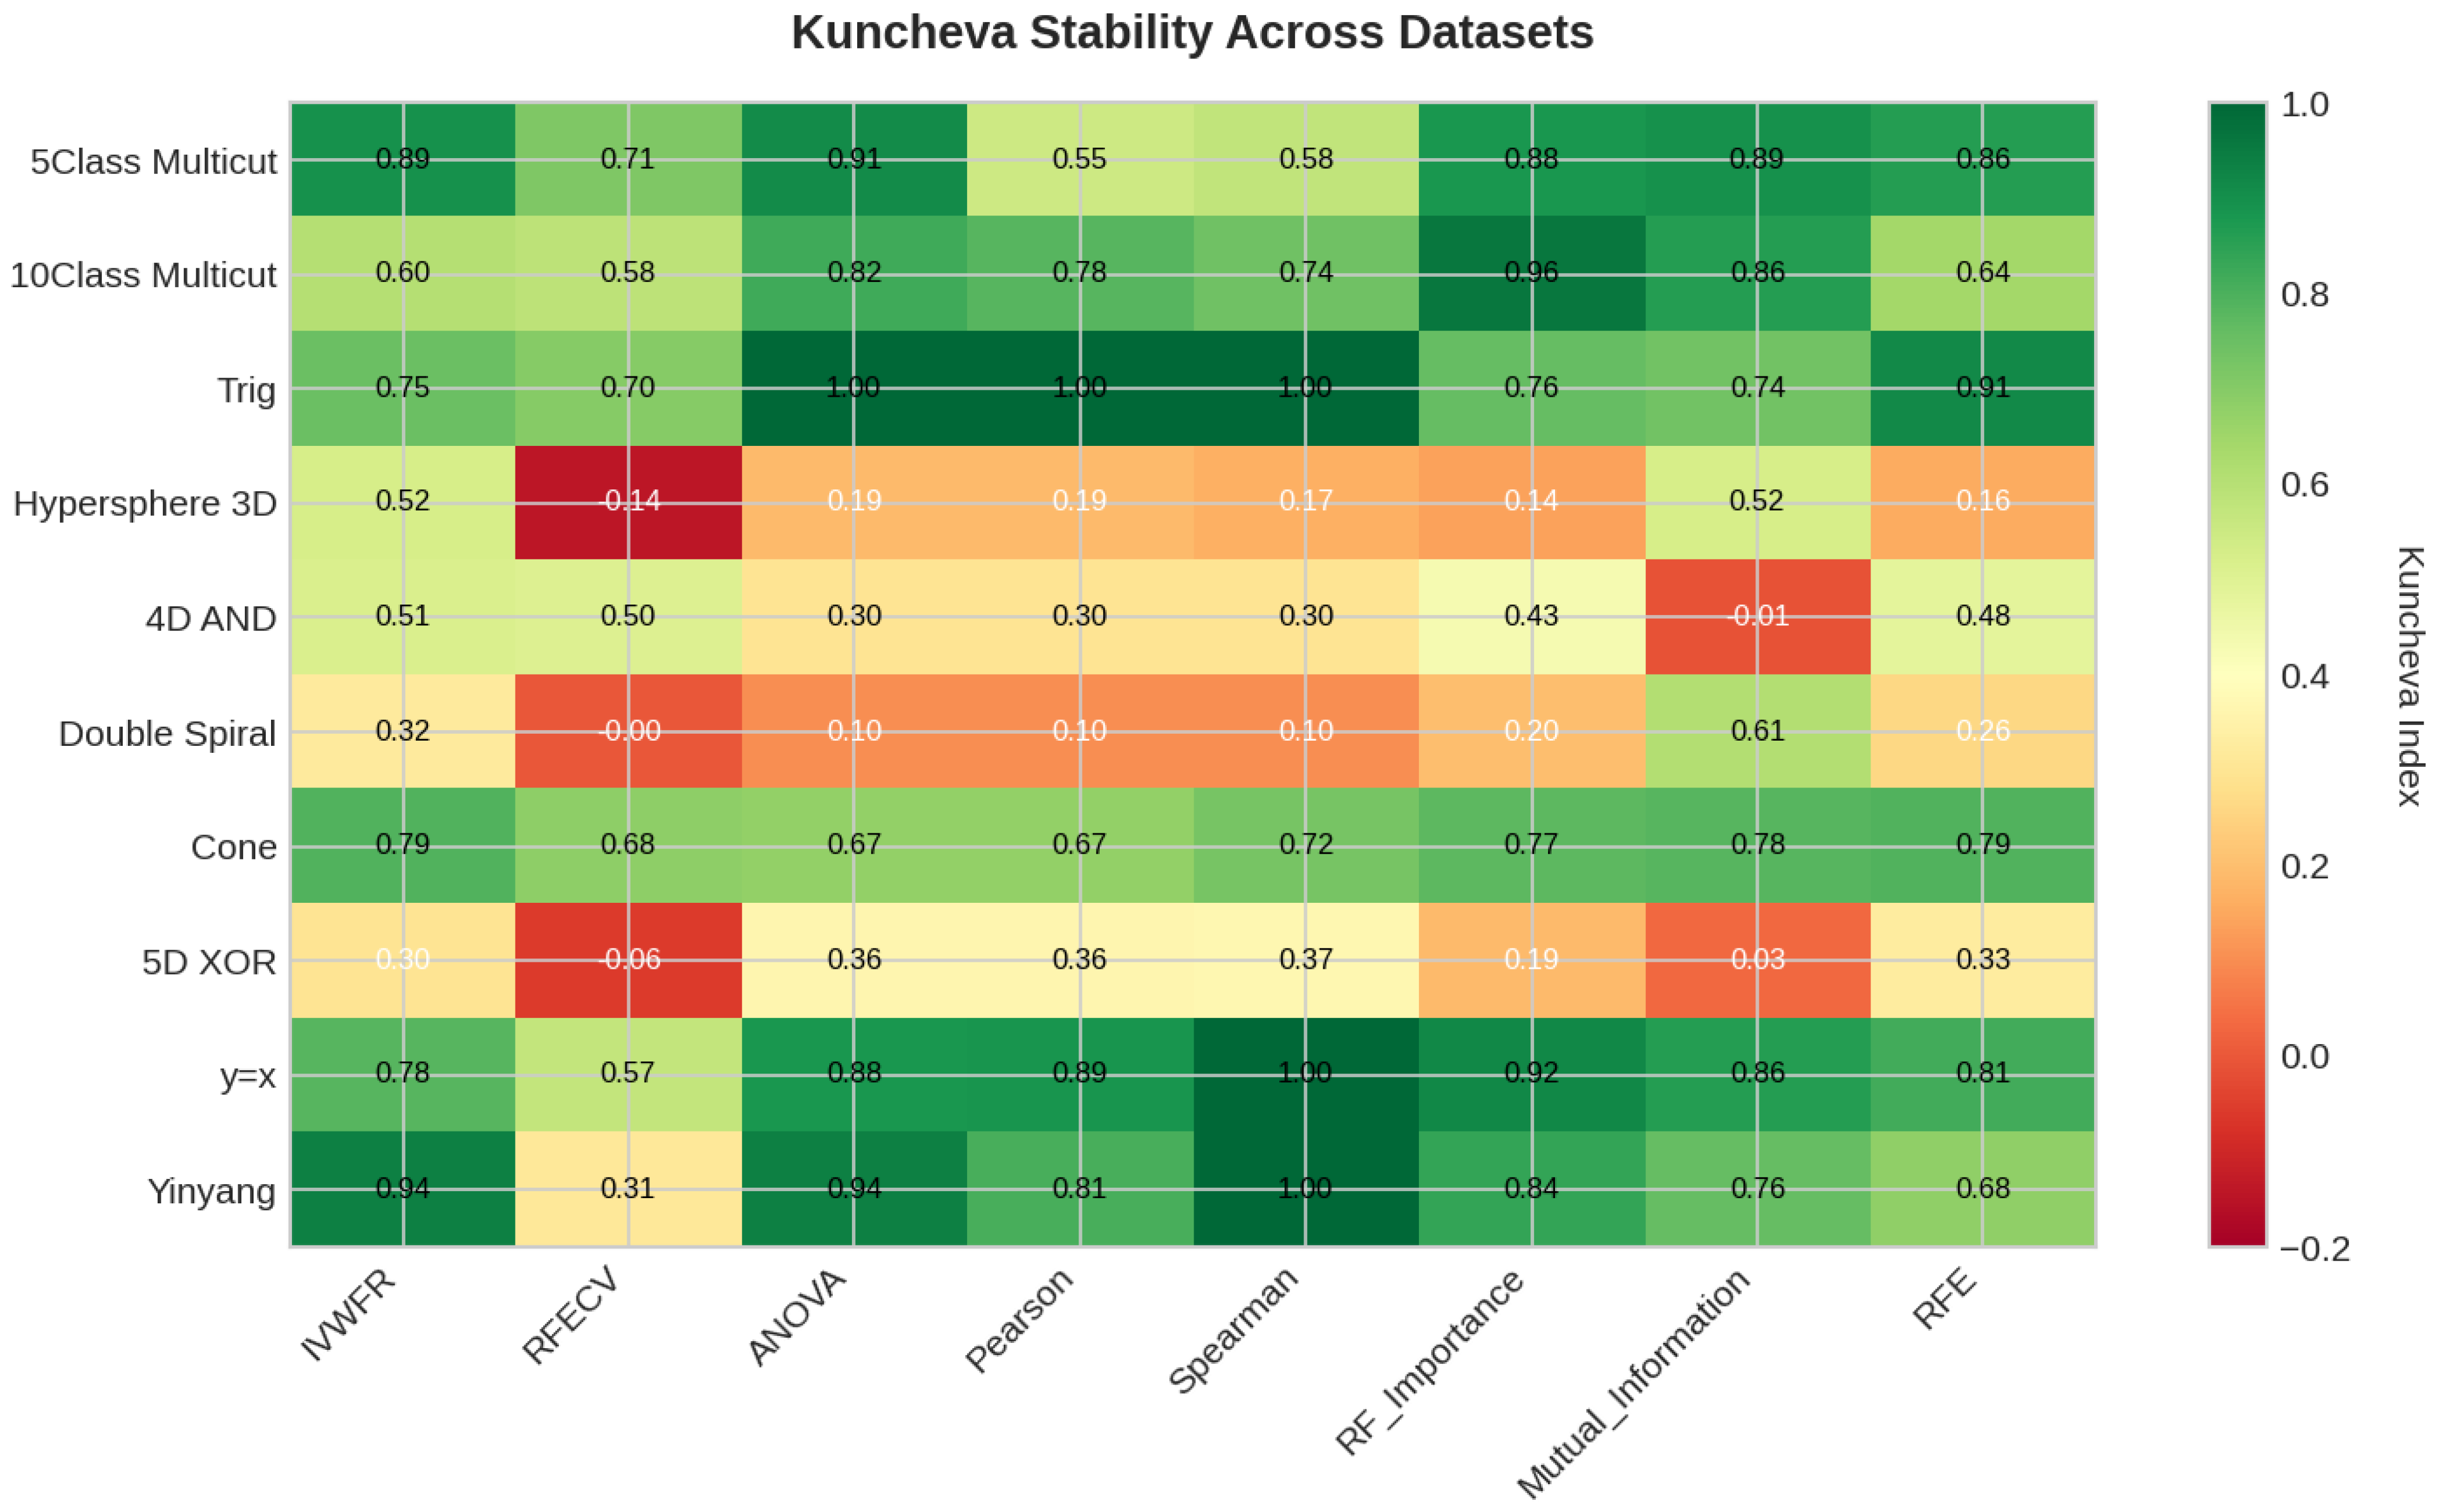
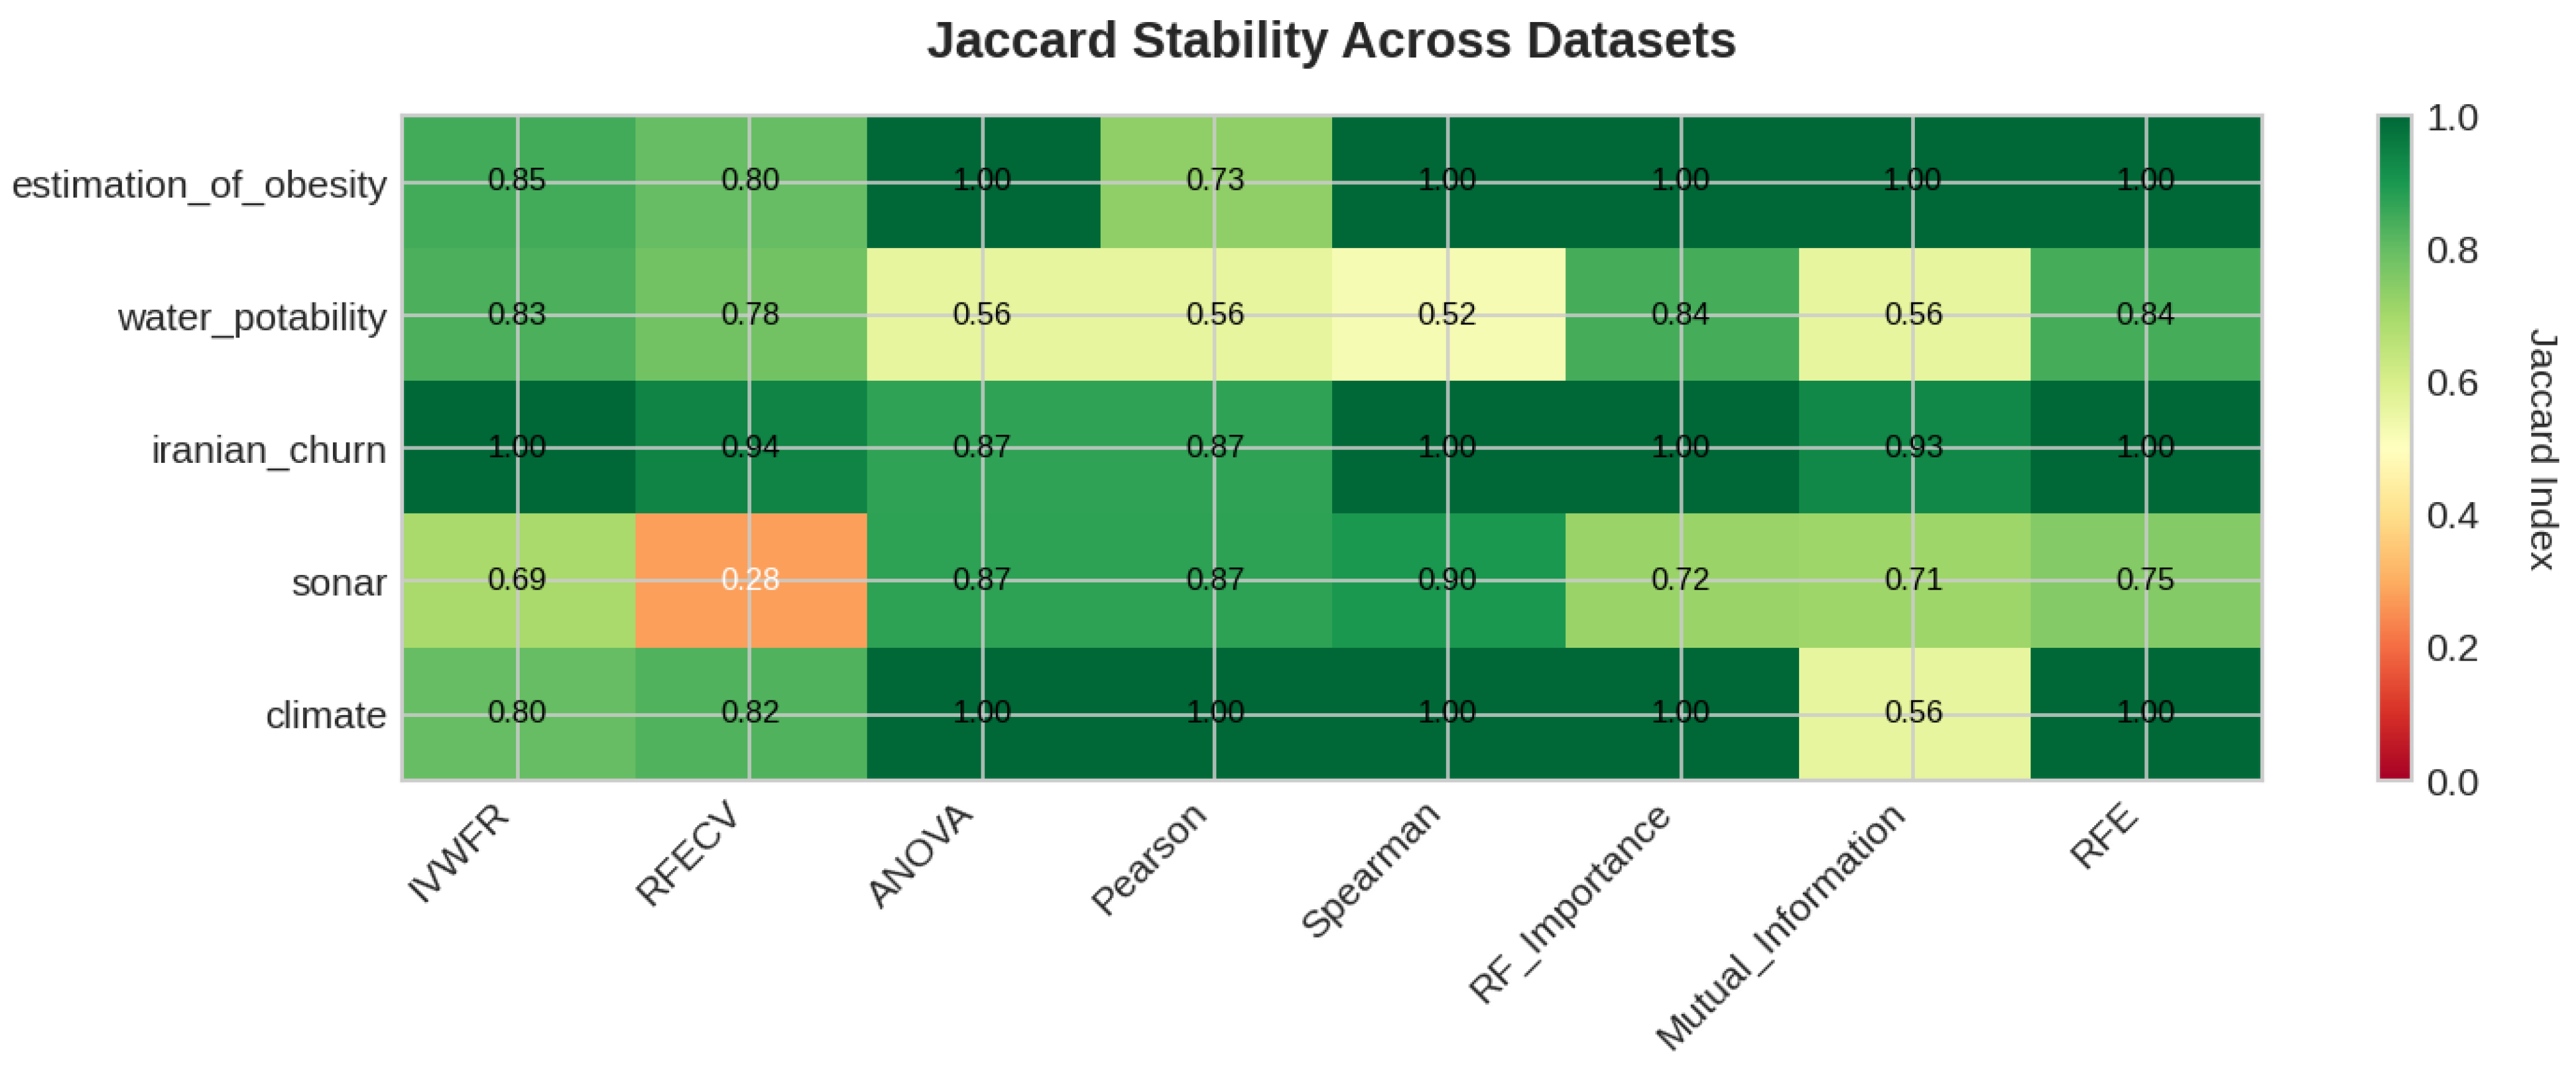
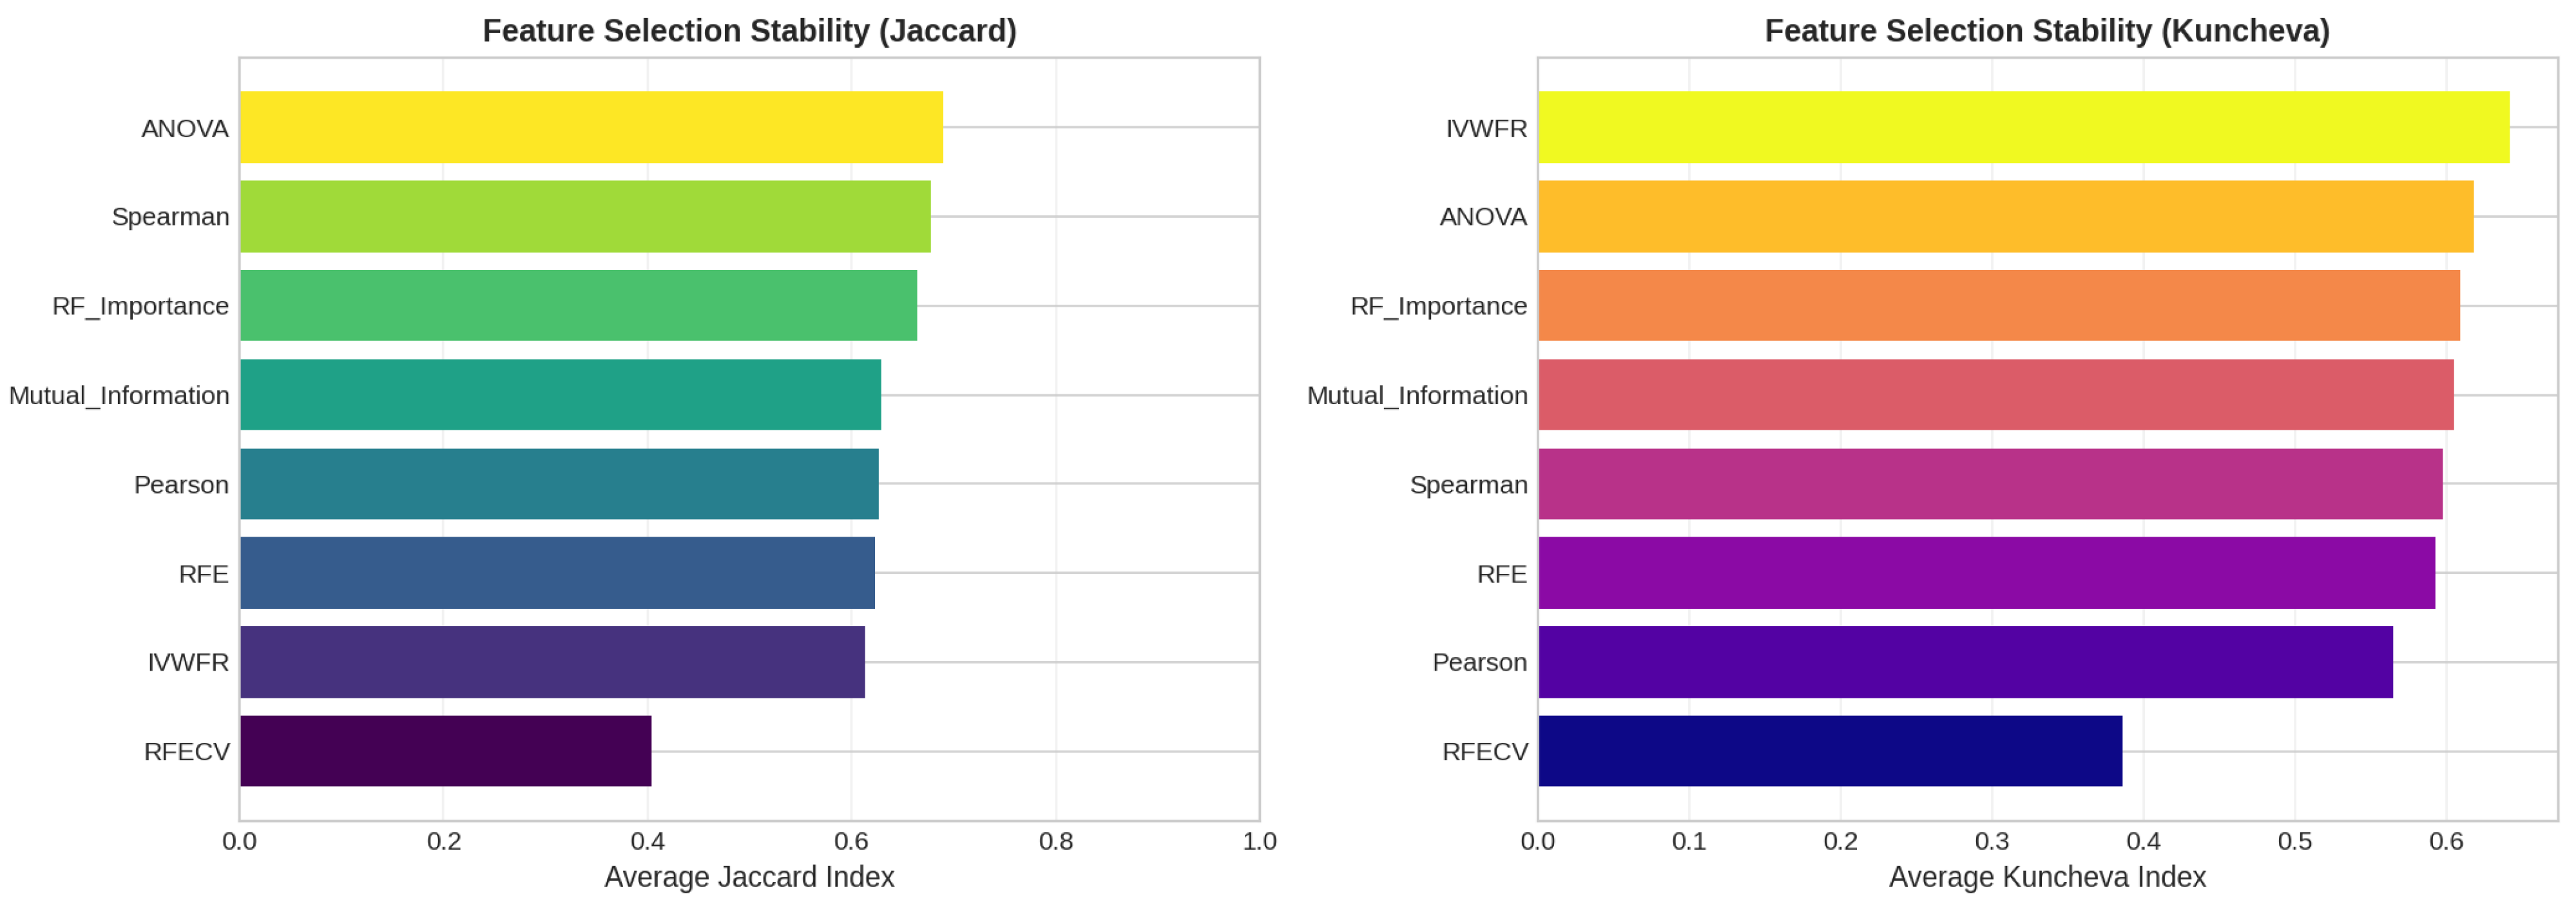
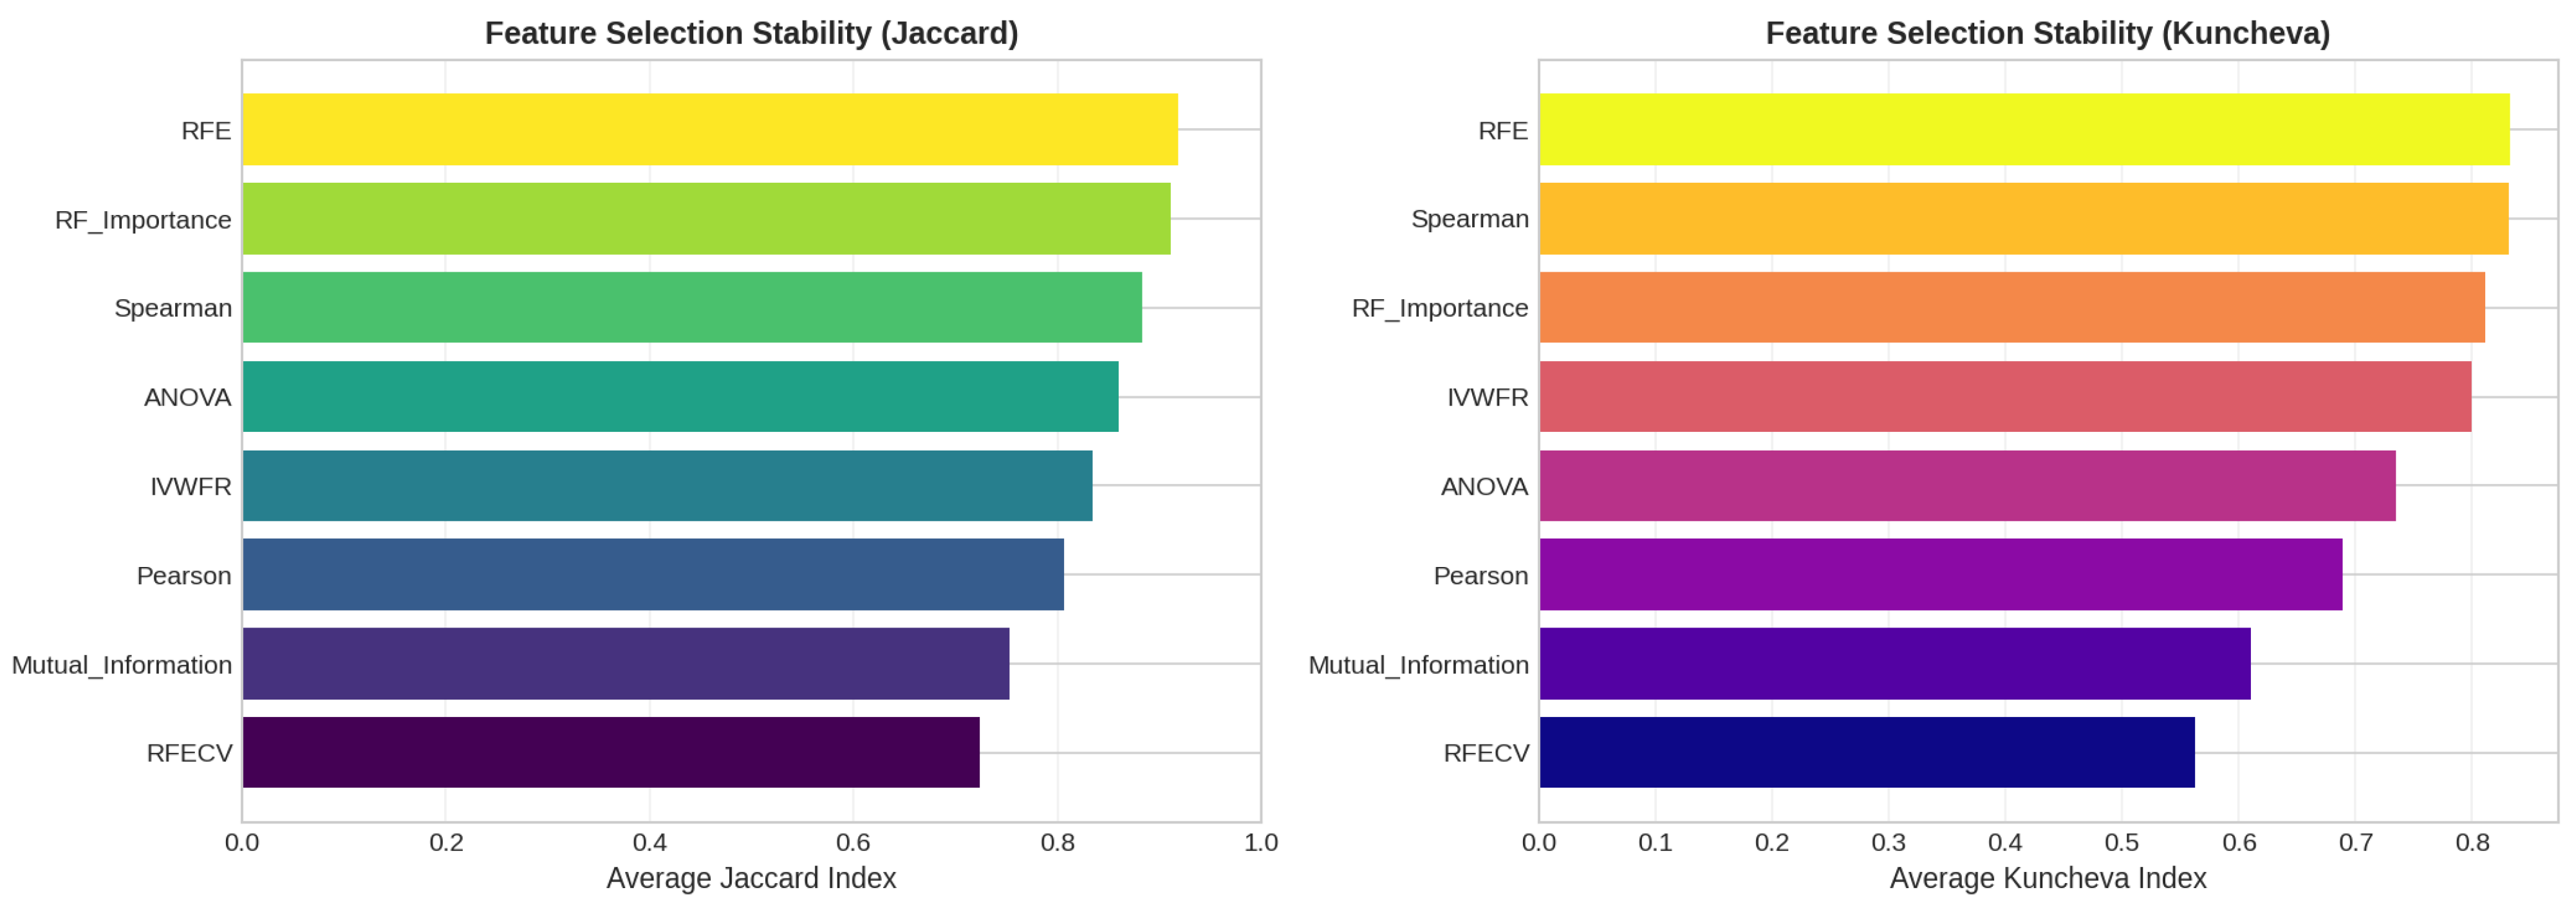
5.4.3. Feature Importance Stability Analysis
- Jaccard Similarity Index (J):where and denote the sets of selected features obtained in two independent folds. The Jaccard index measures the proportion of common features between two selections and ranges from 0 (no overlap) to 1 (identical feature subsets).
- Kuncheva Index ():where N is the total number of available features and d is the number of features selected. The Kuncheva index corrects for random overlap between subsets, providing a more conservative estimate of stability.
6. Discussion
Author Contributions
Funding
Institutional Review Board Statement
Informed Consent Statement
Data Availability Statement
Acknowledgments
Conflicts of Interest
Appendix A

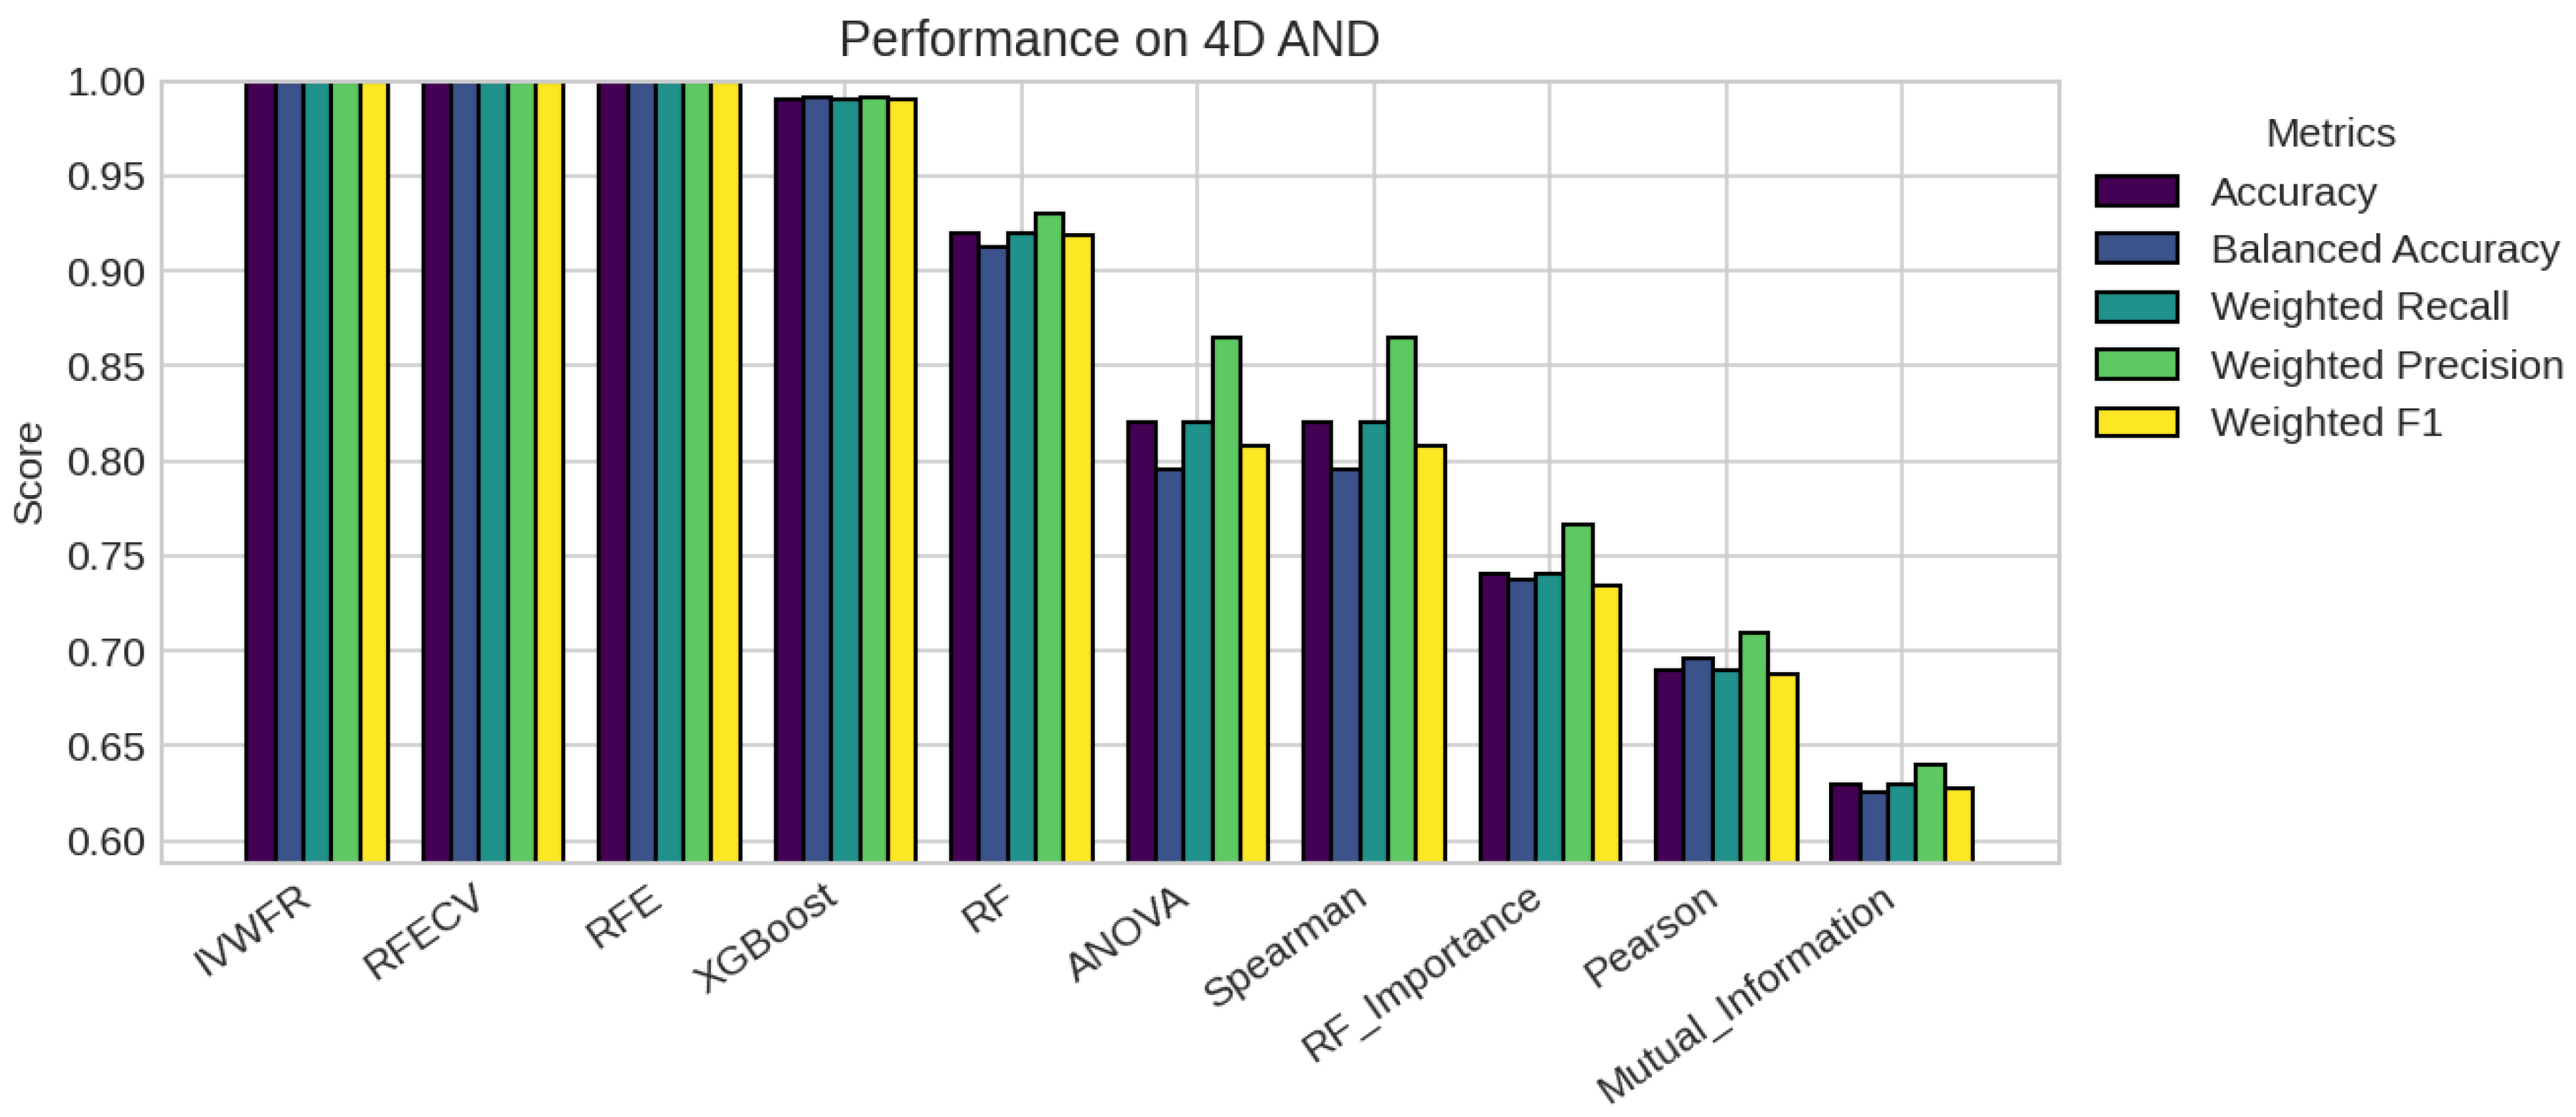
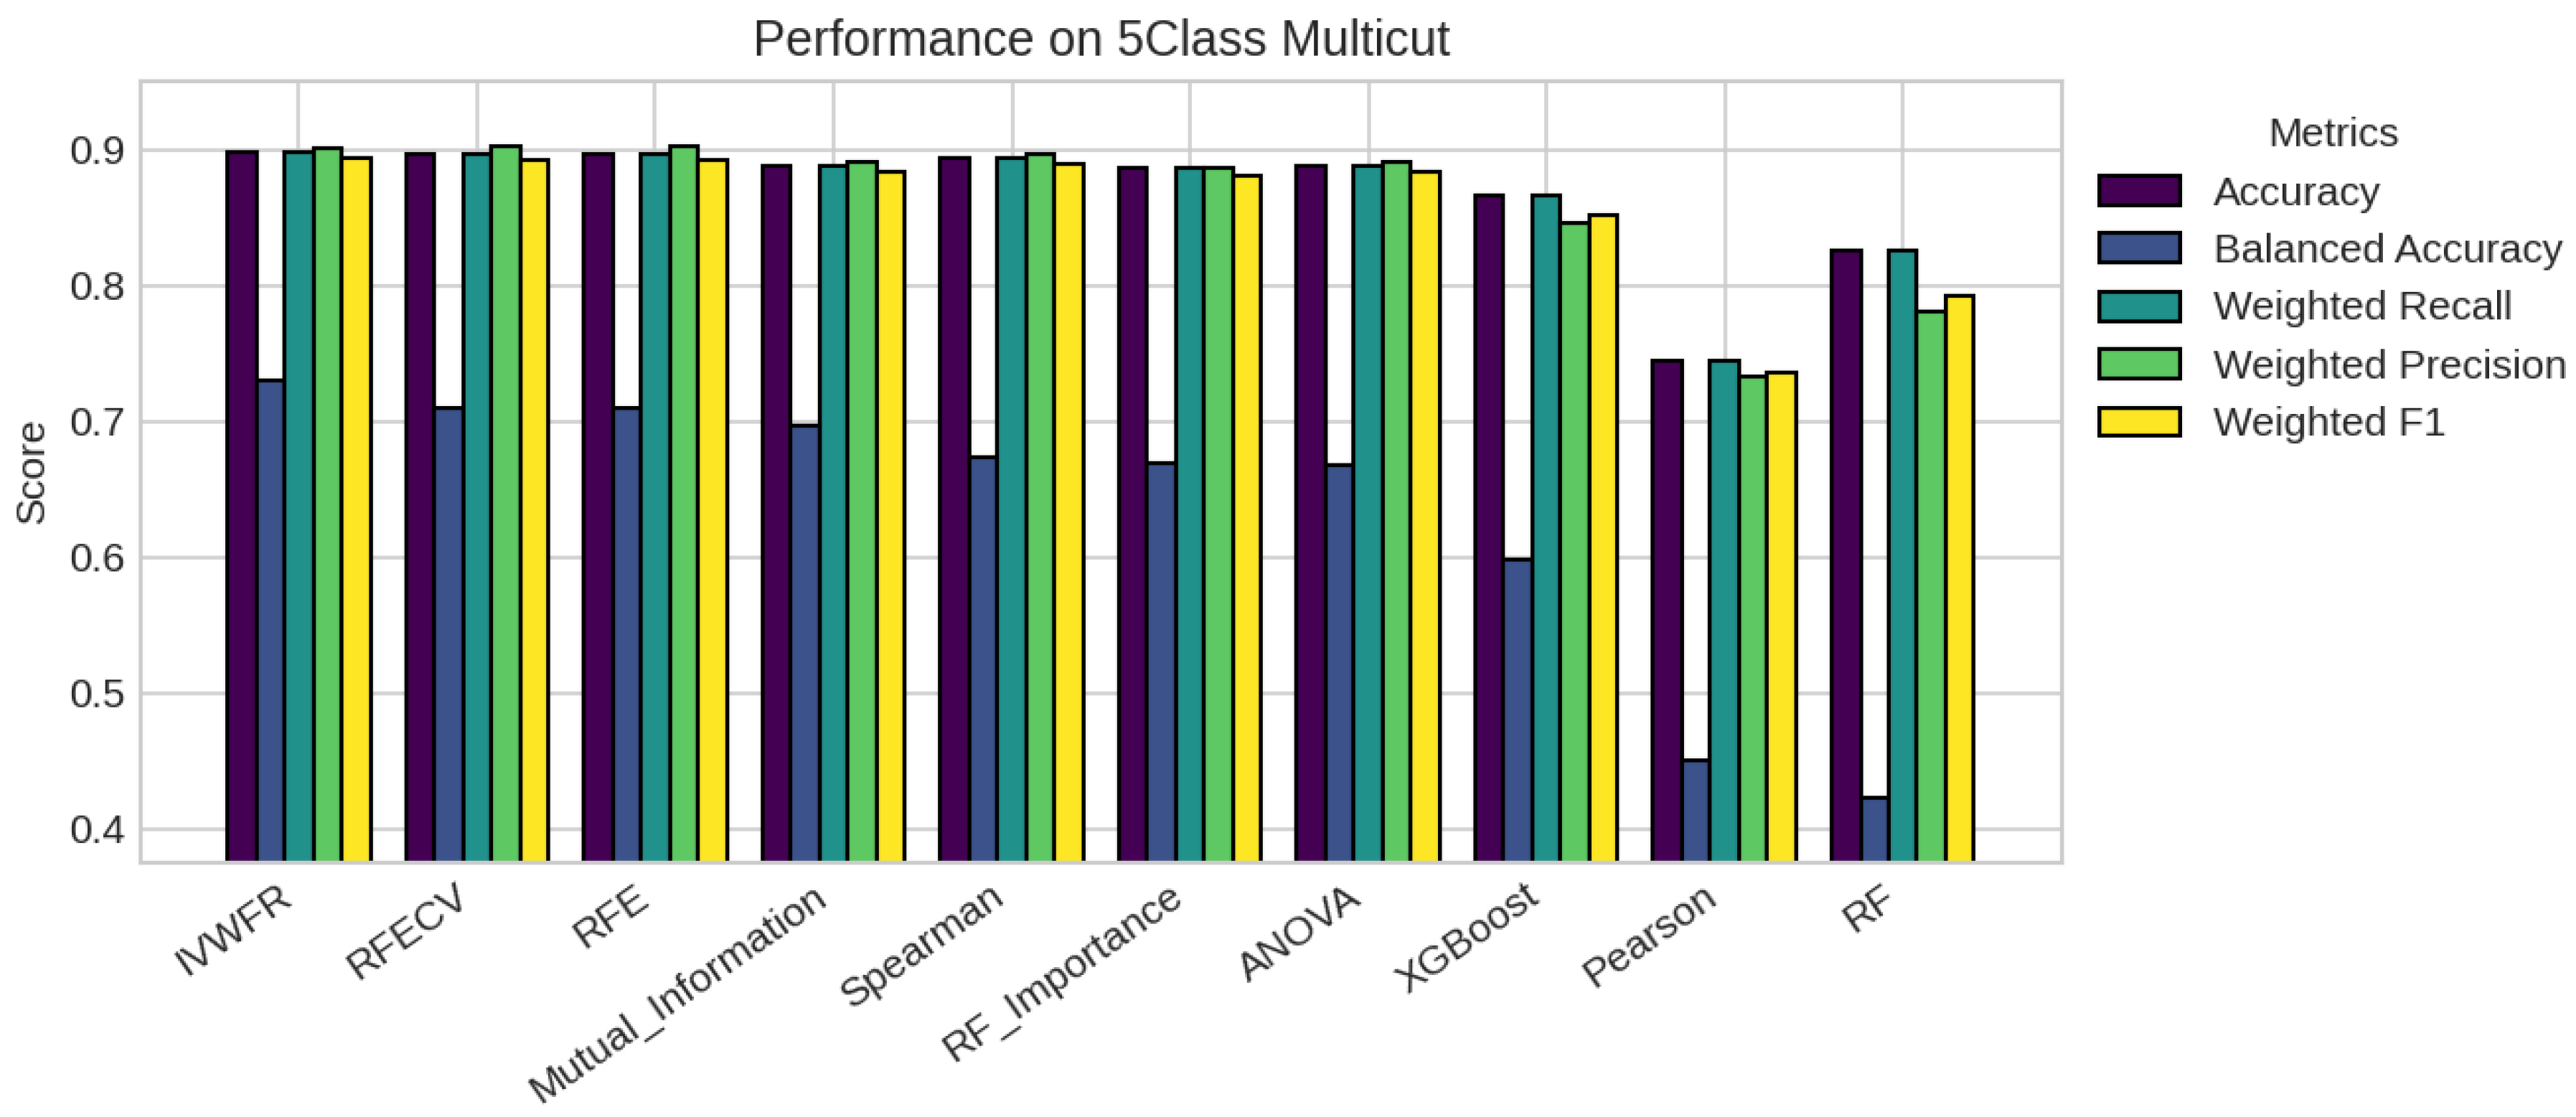
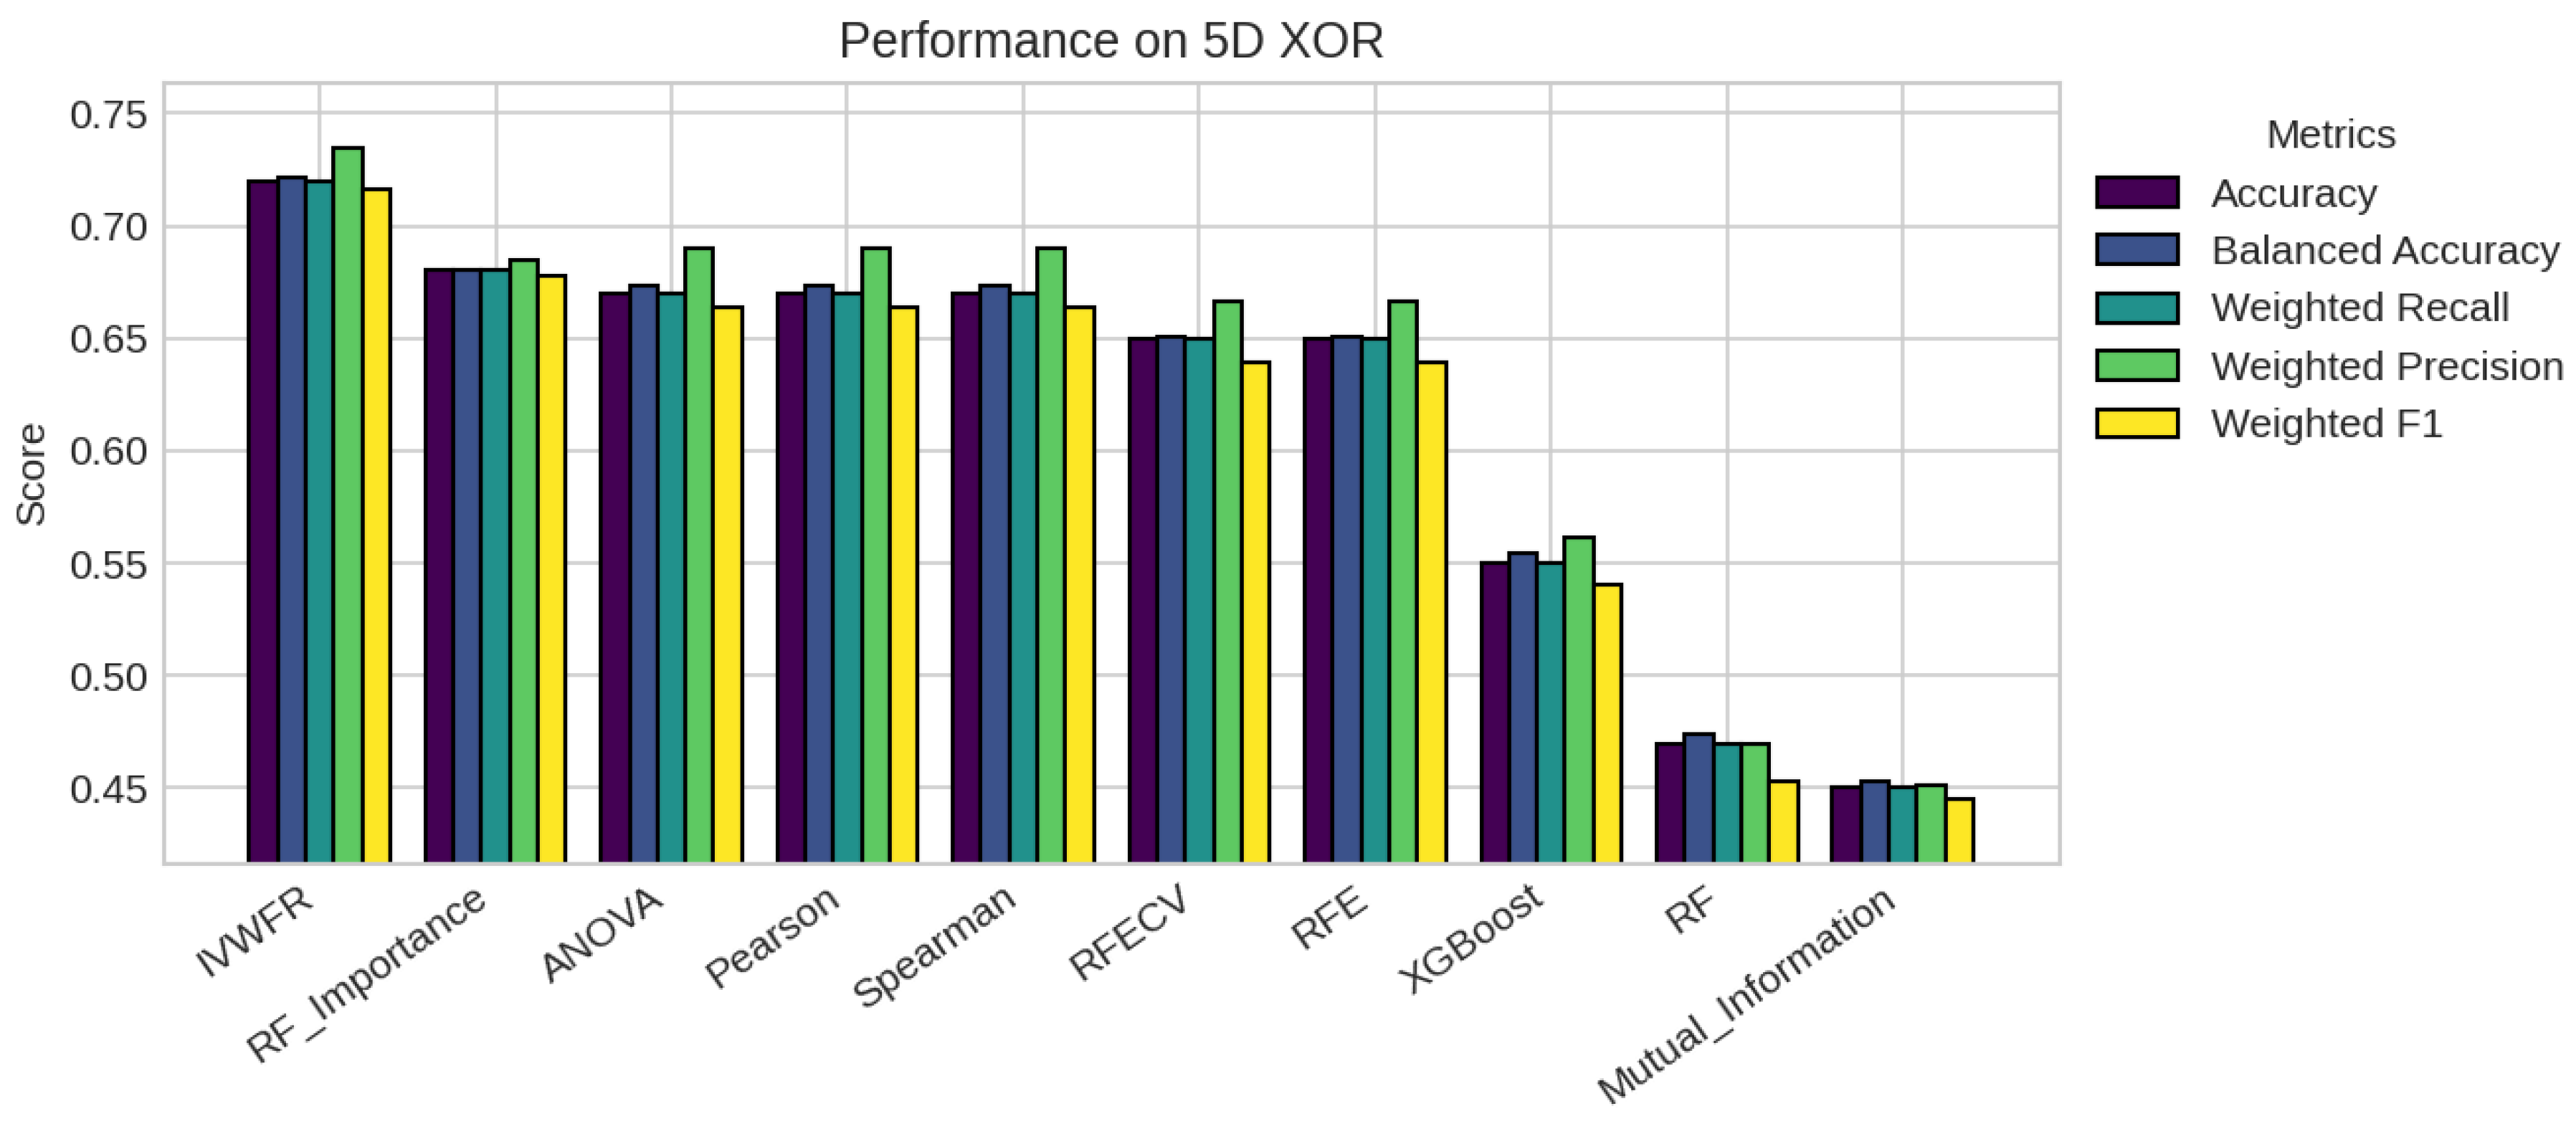
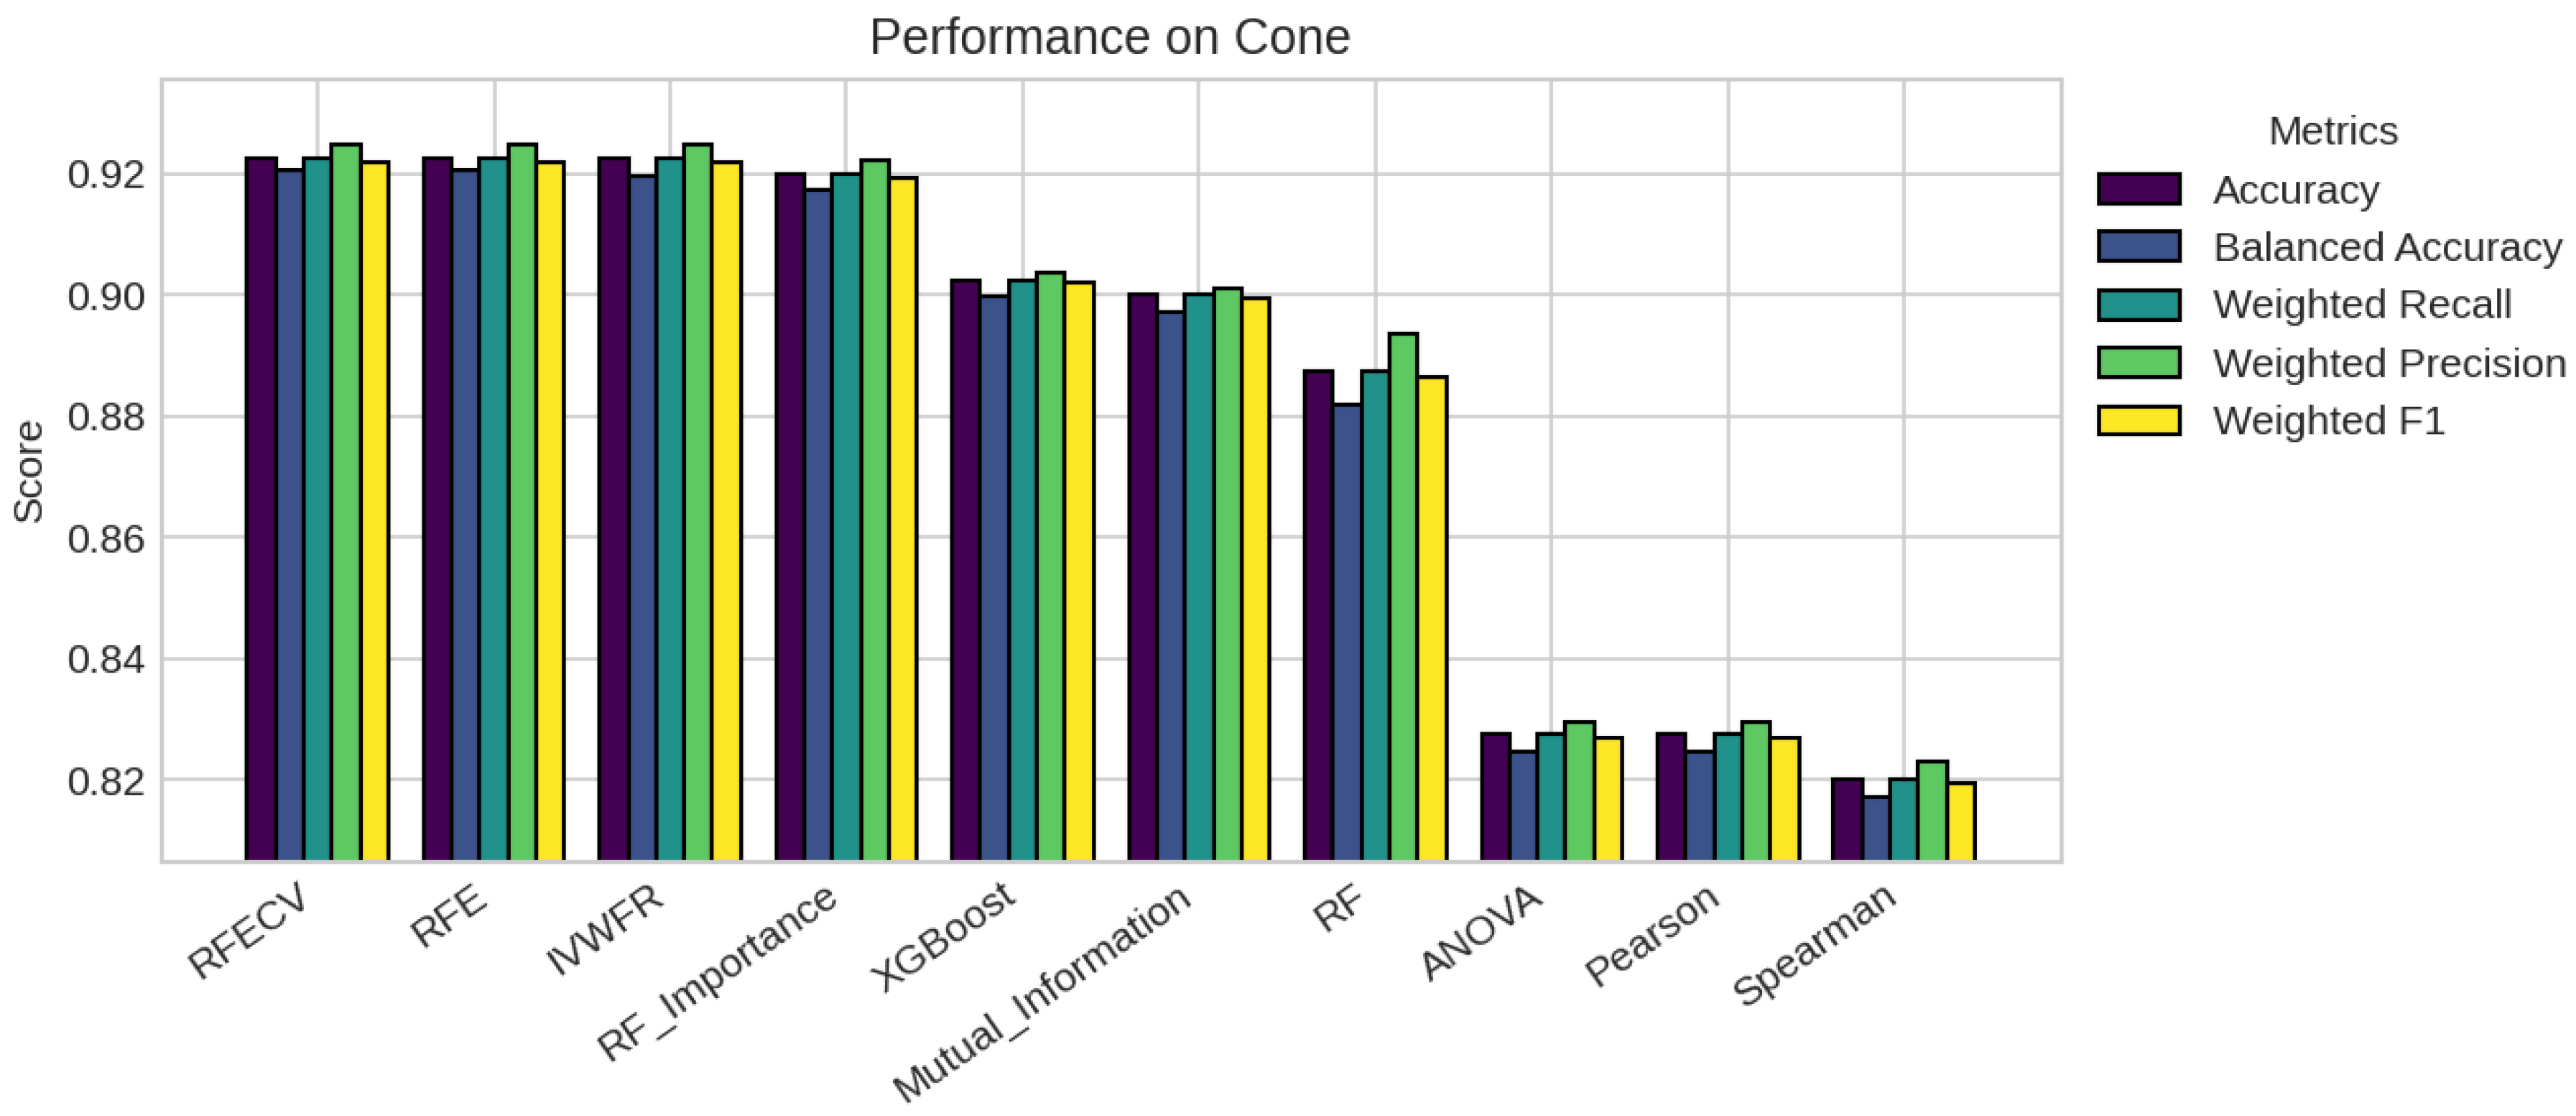
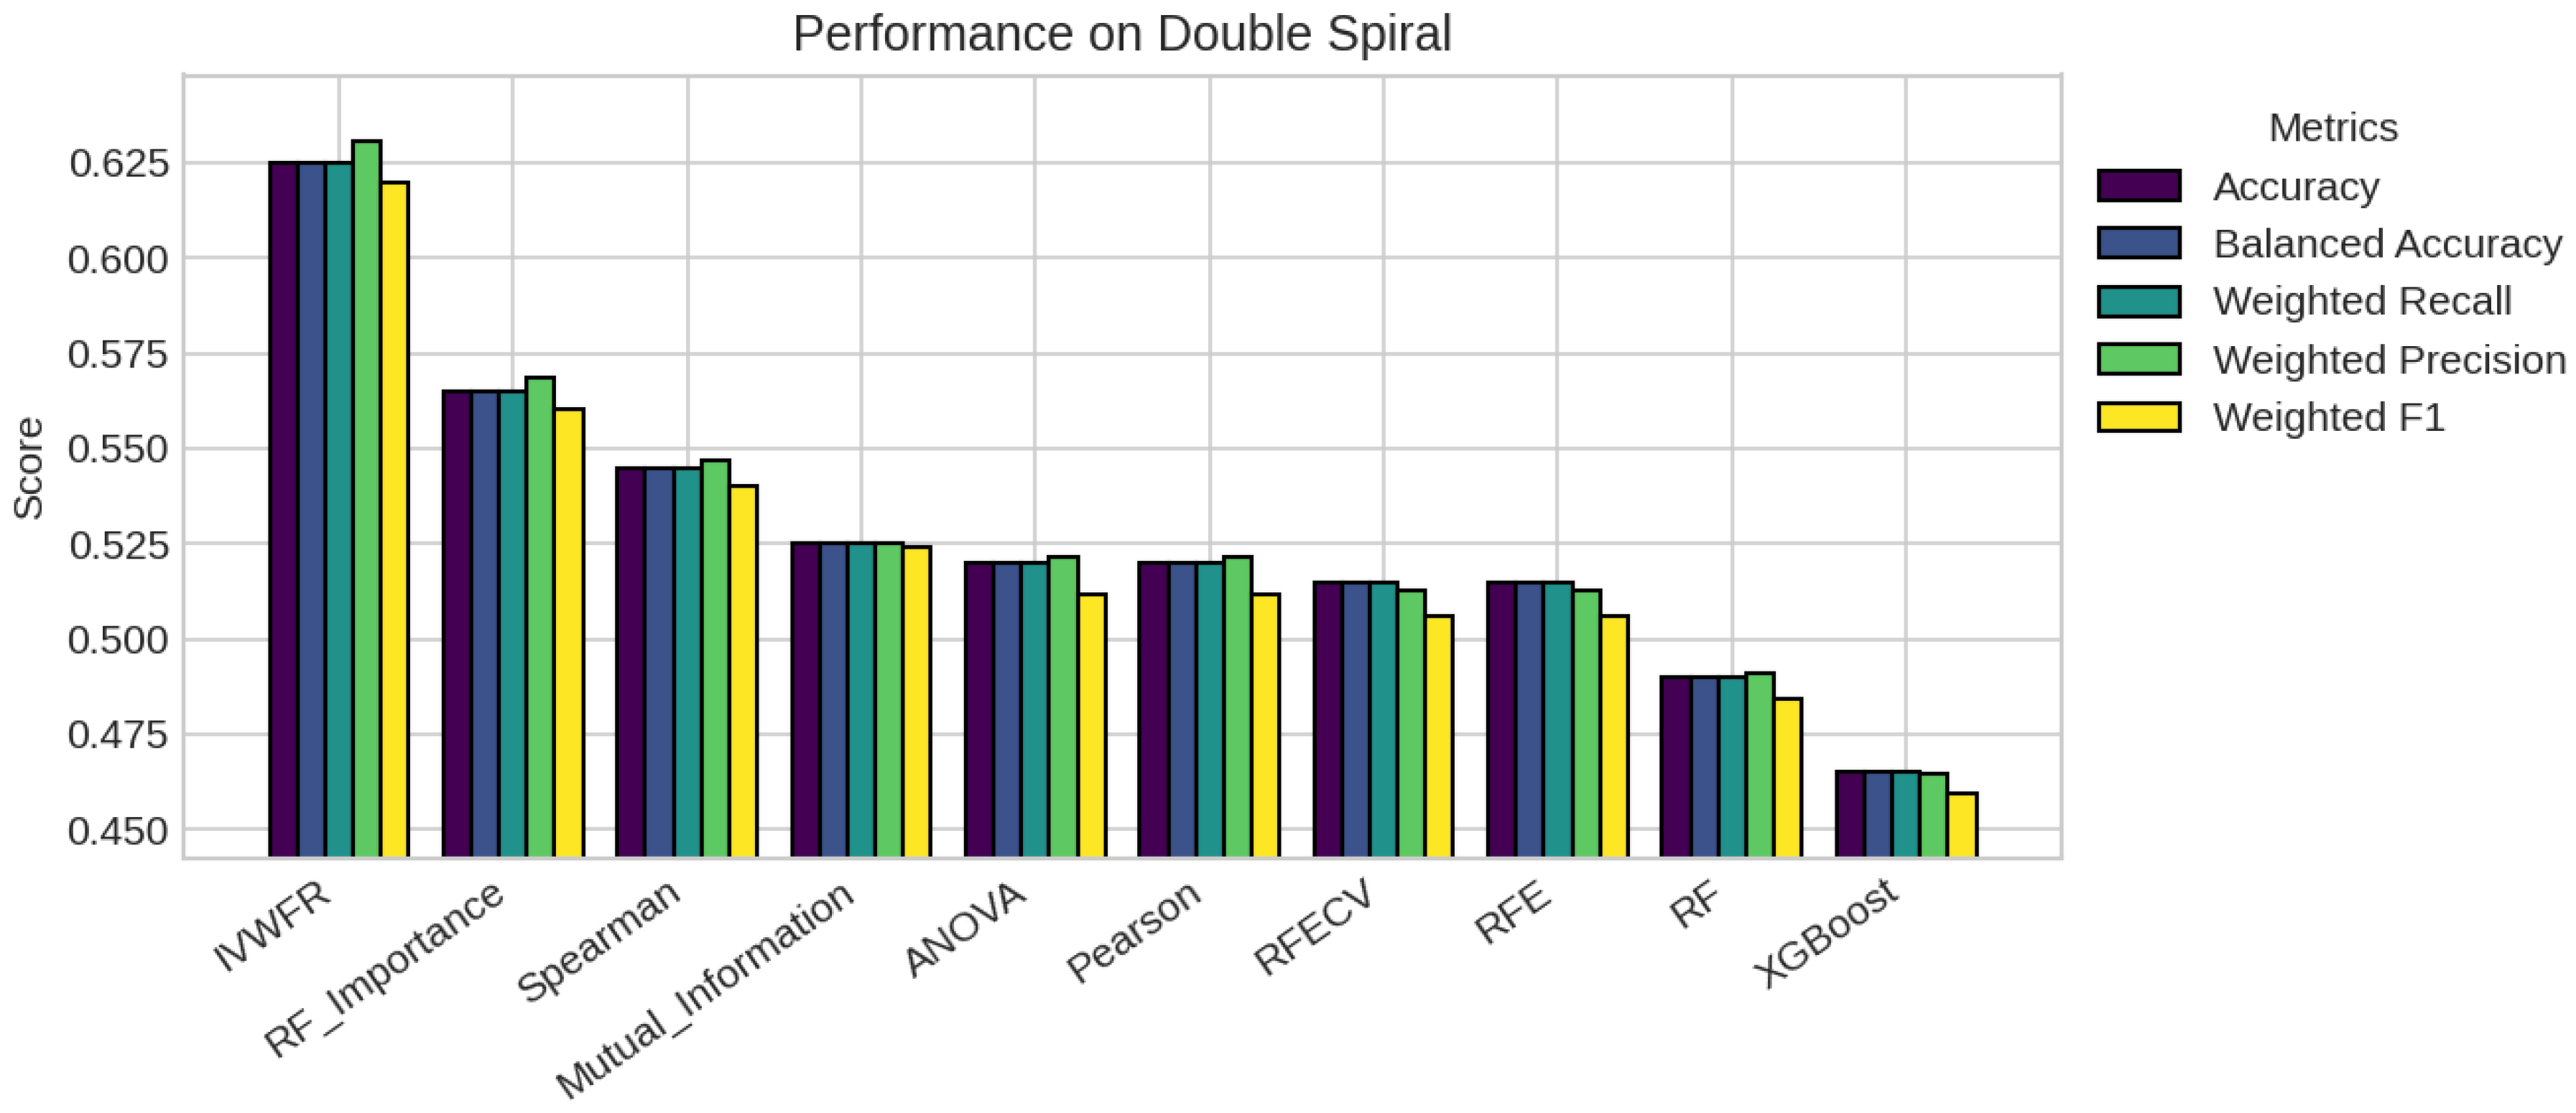

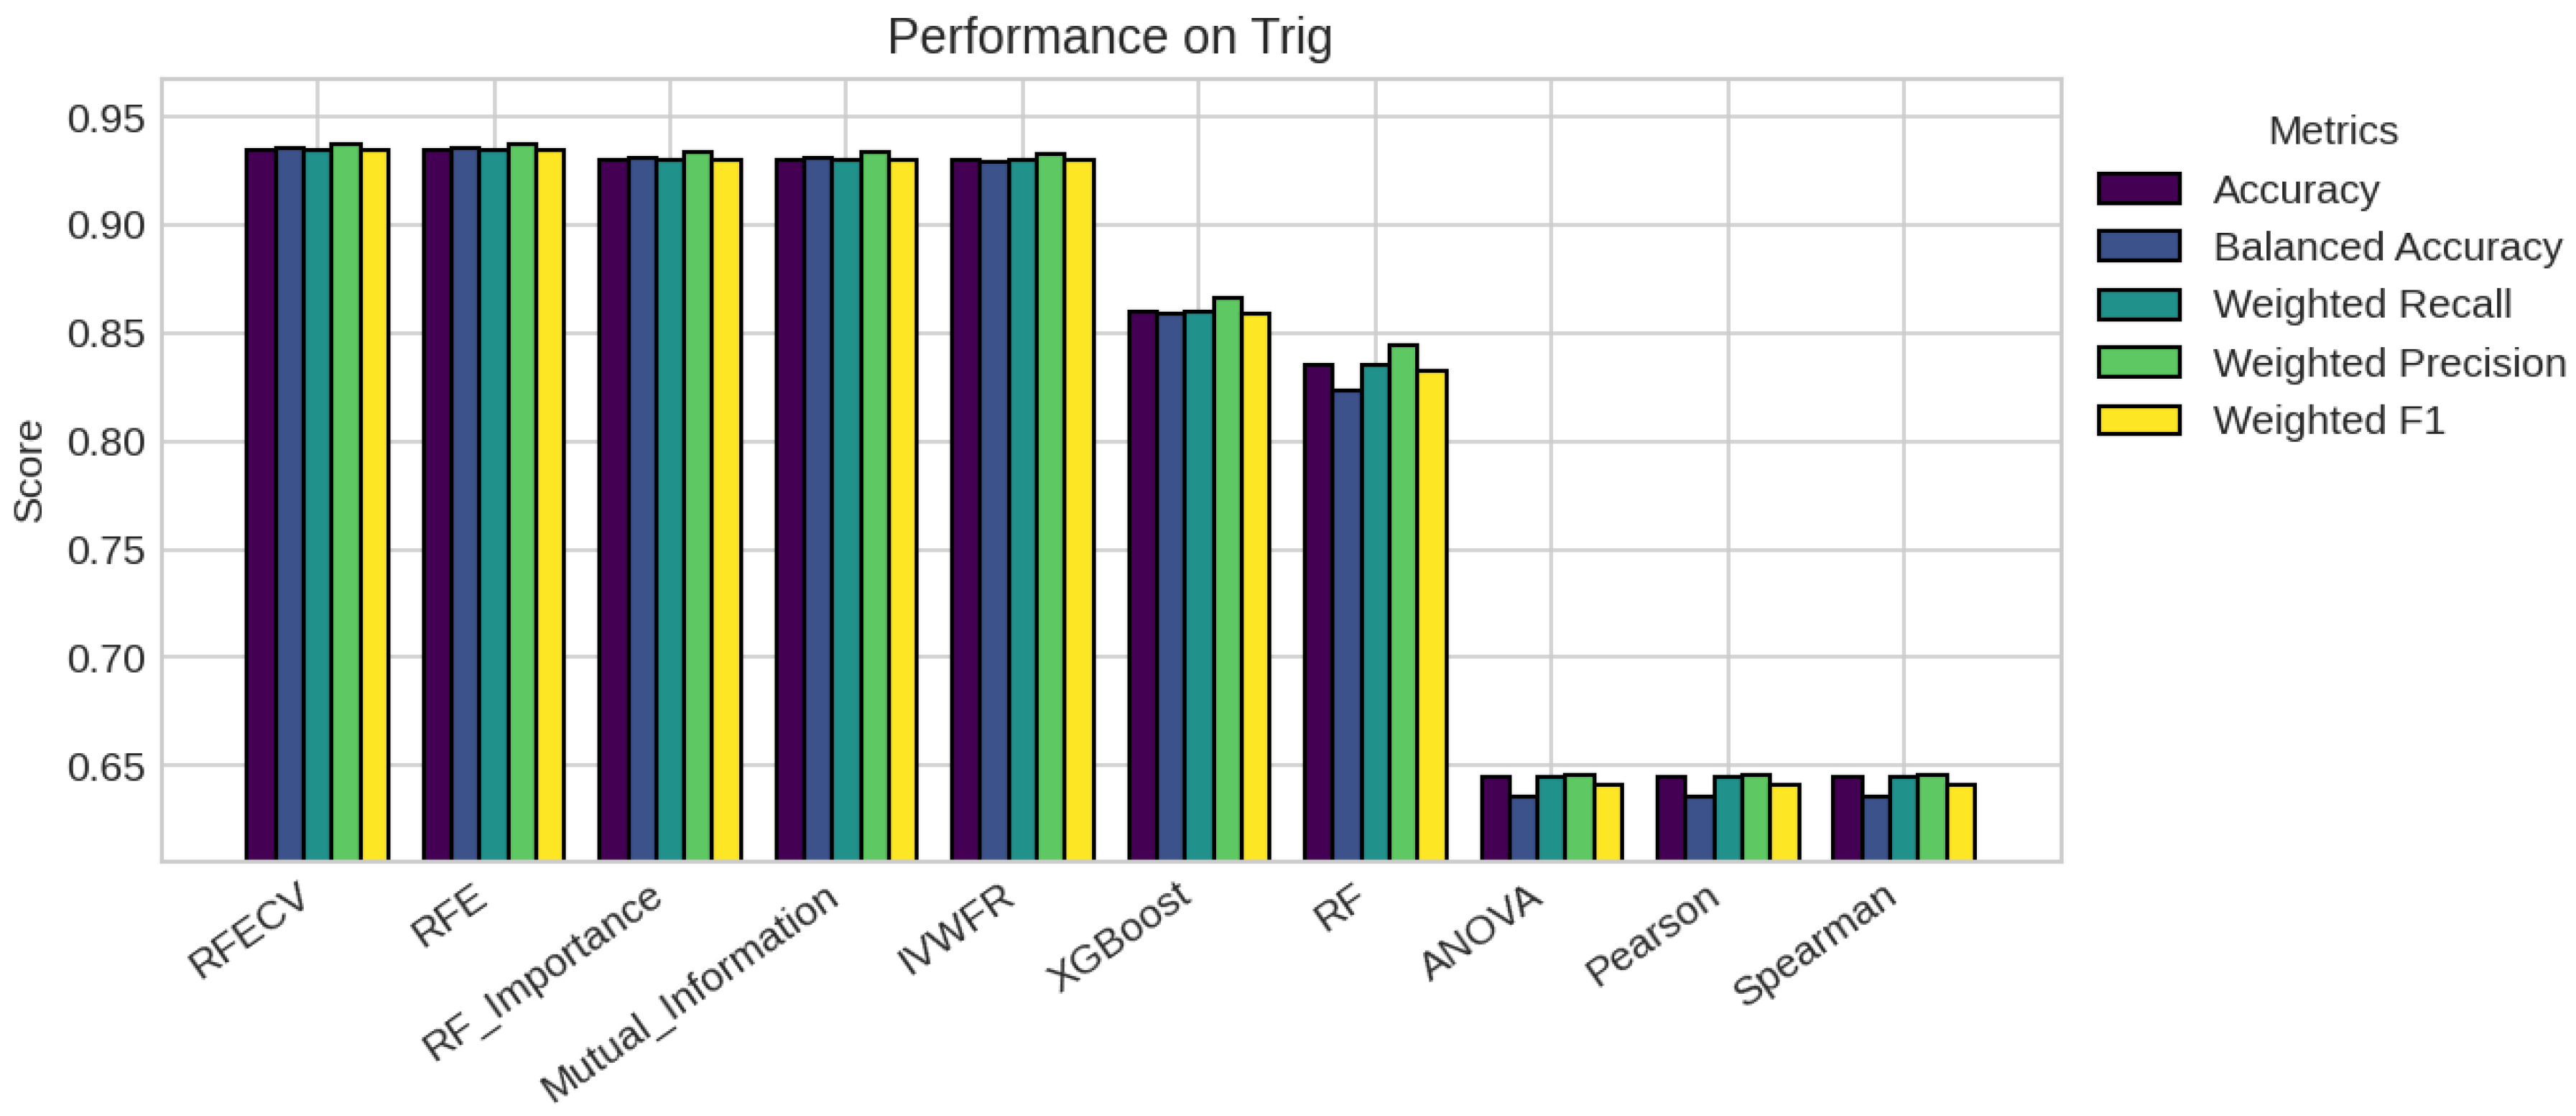
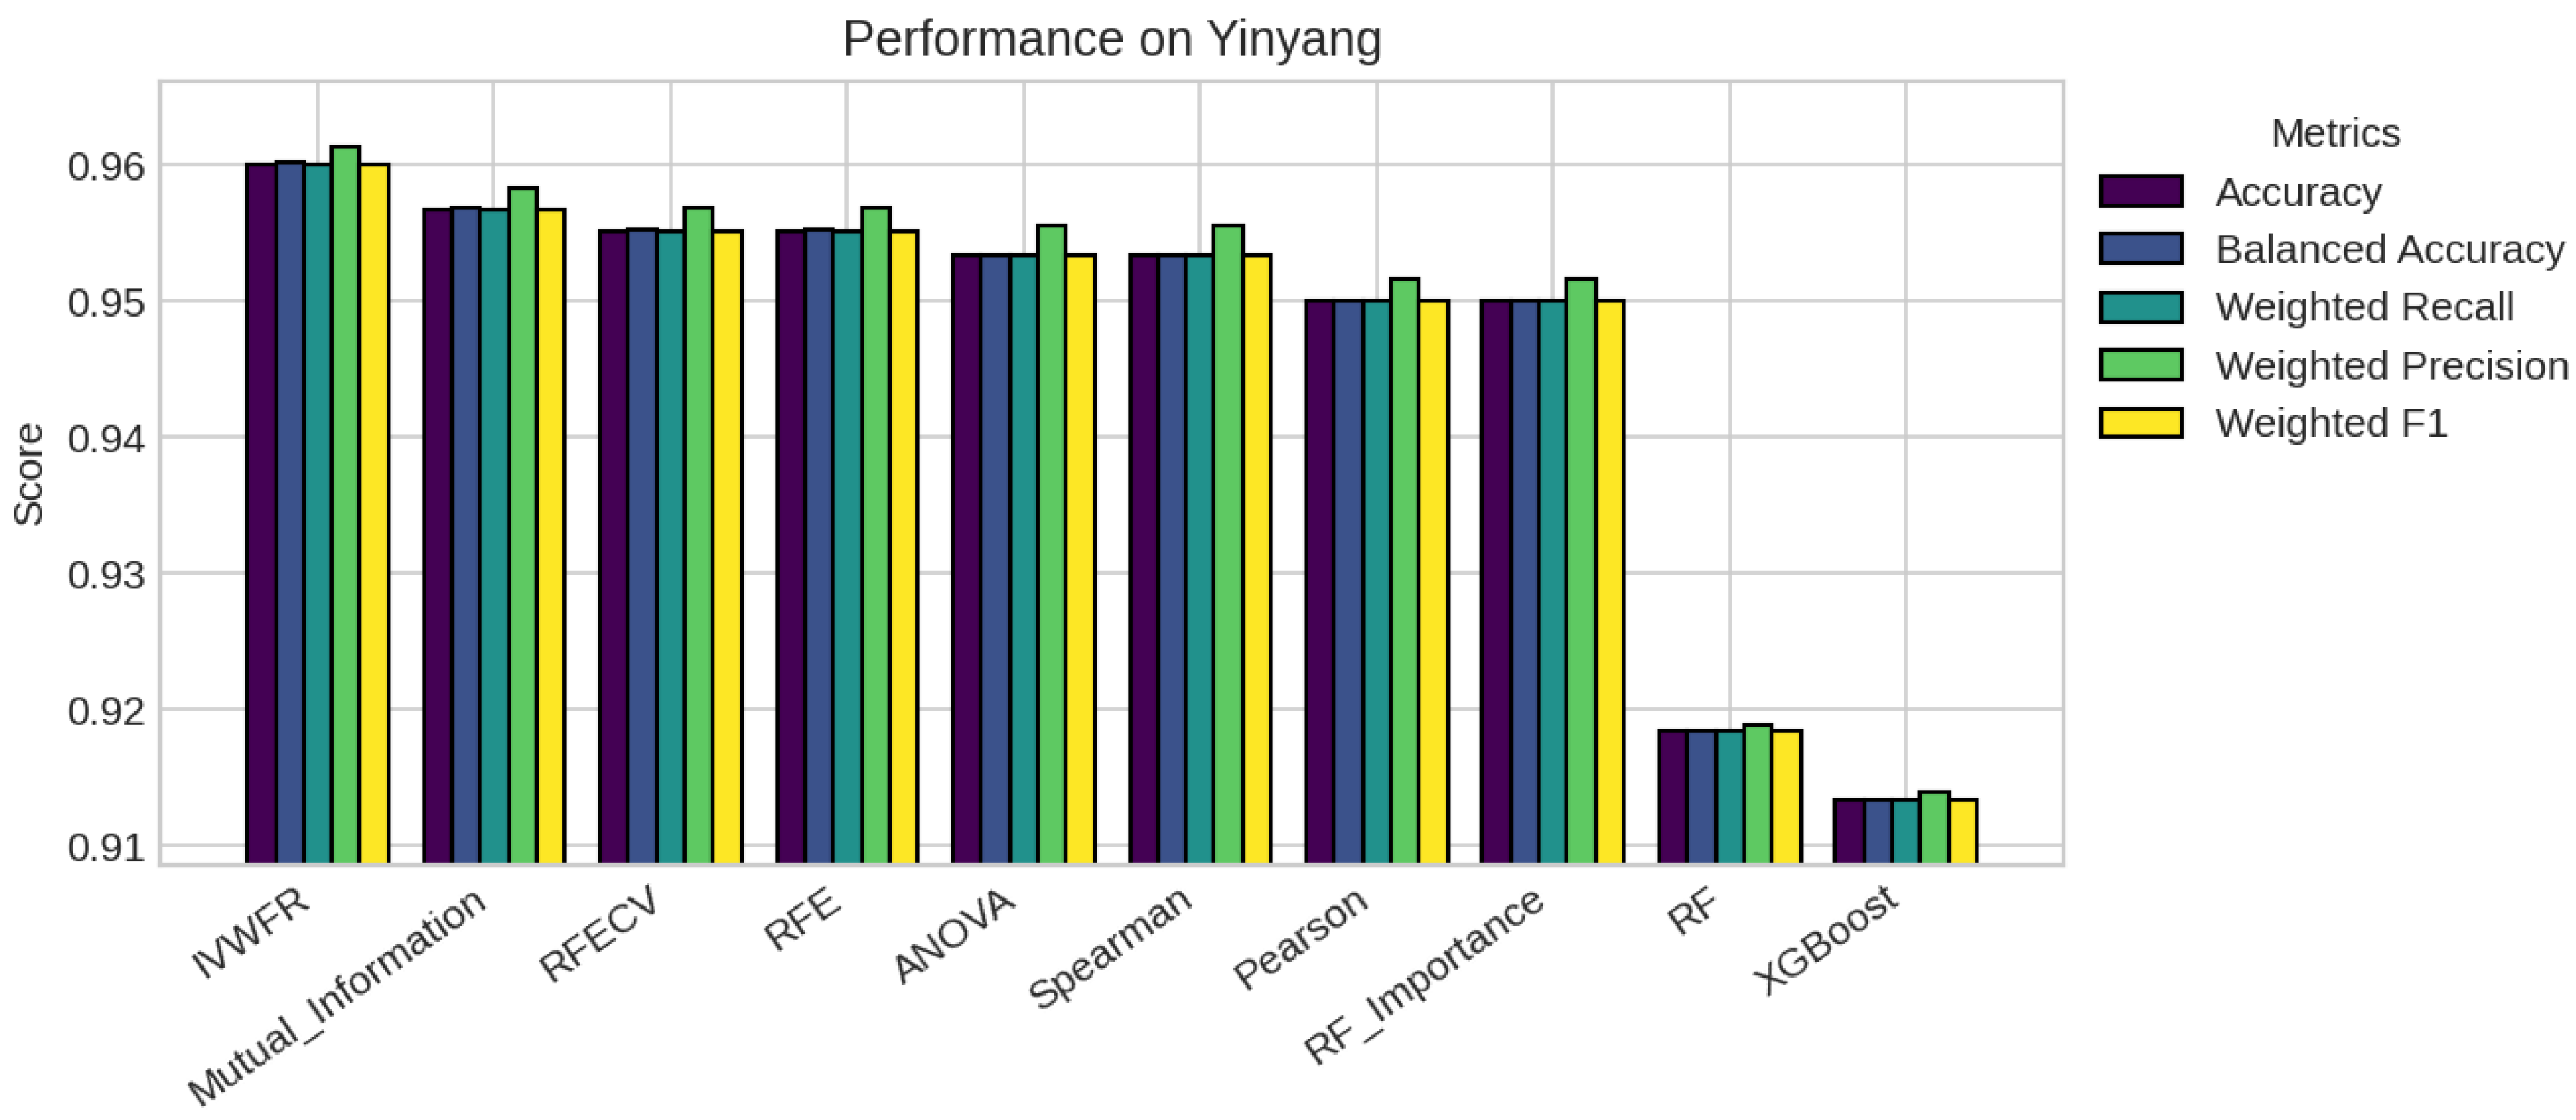

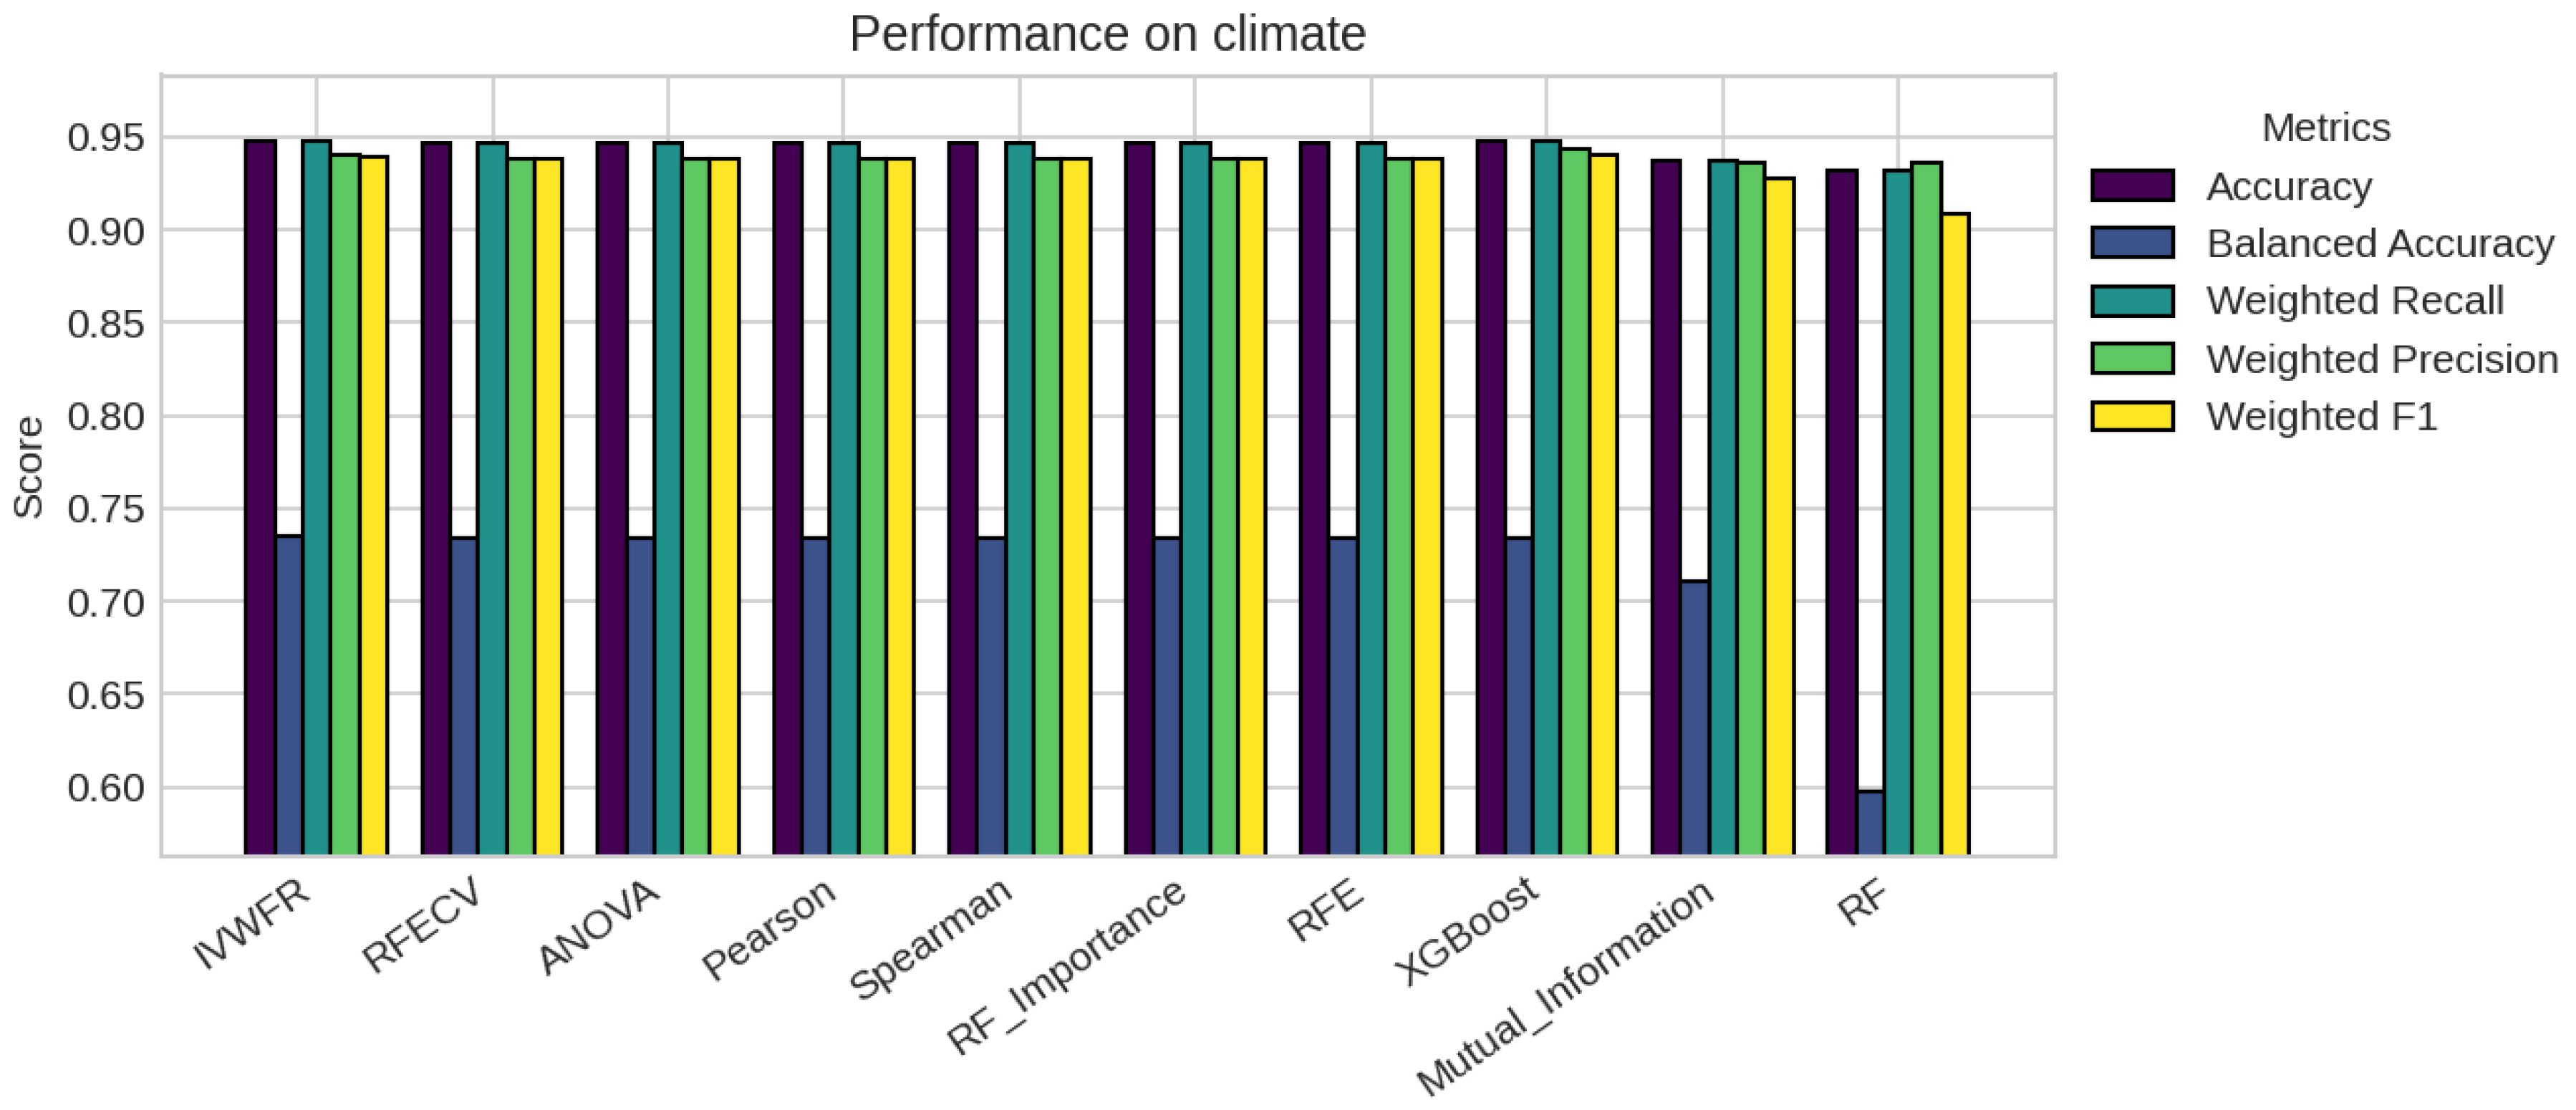

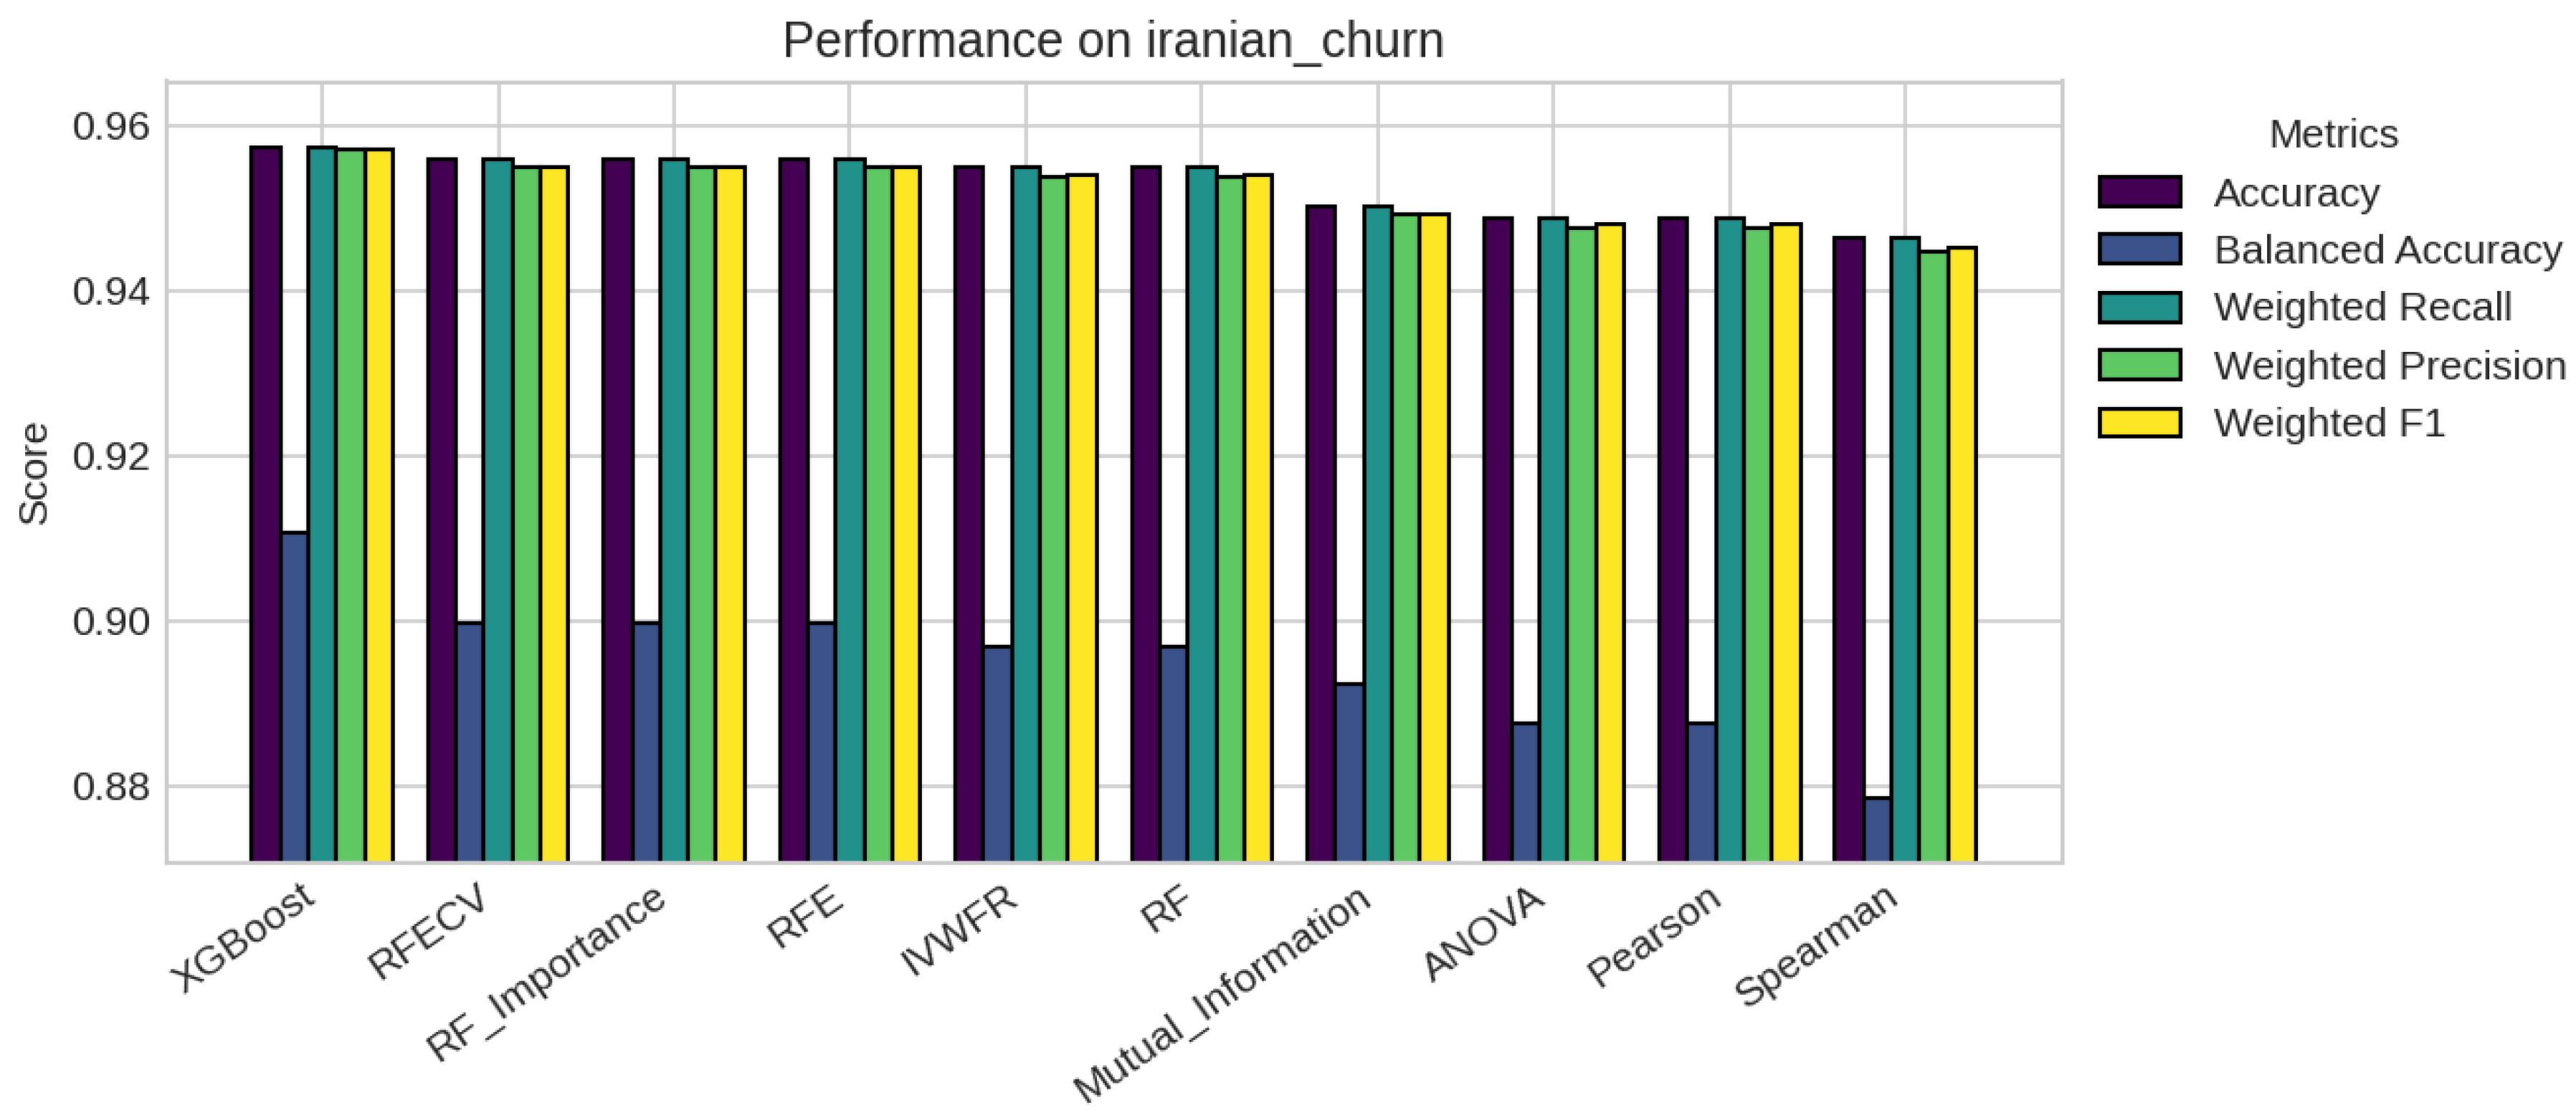
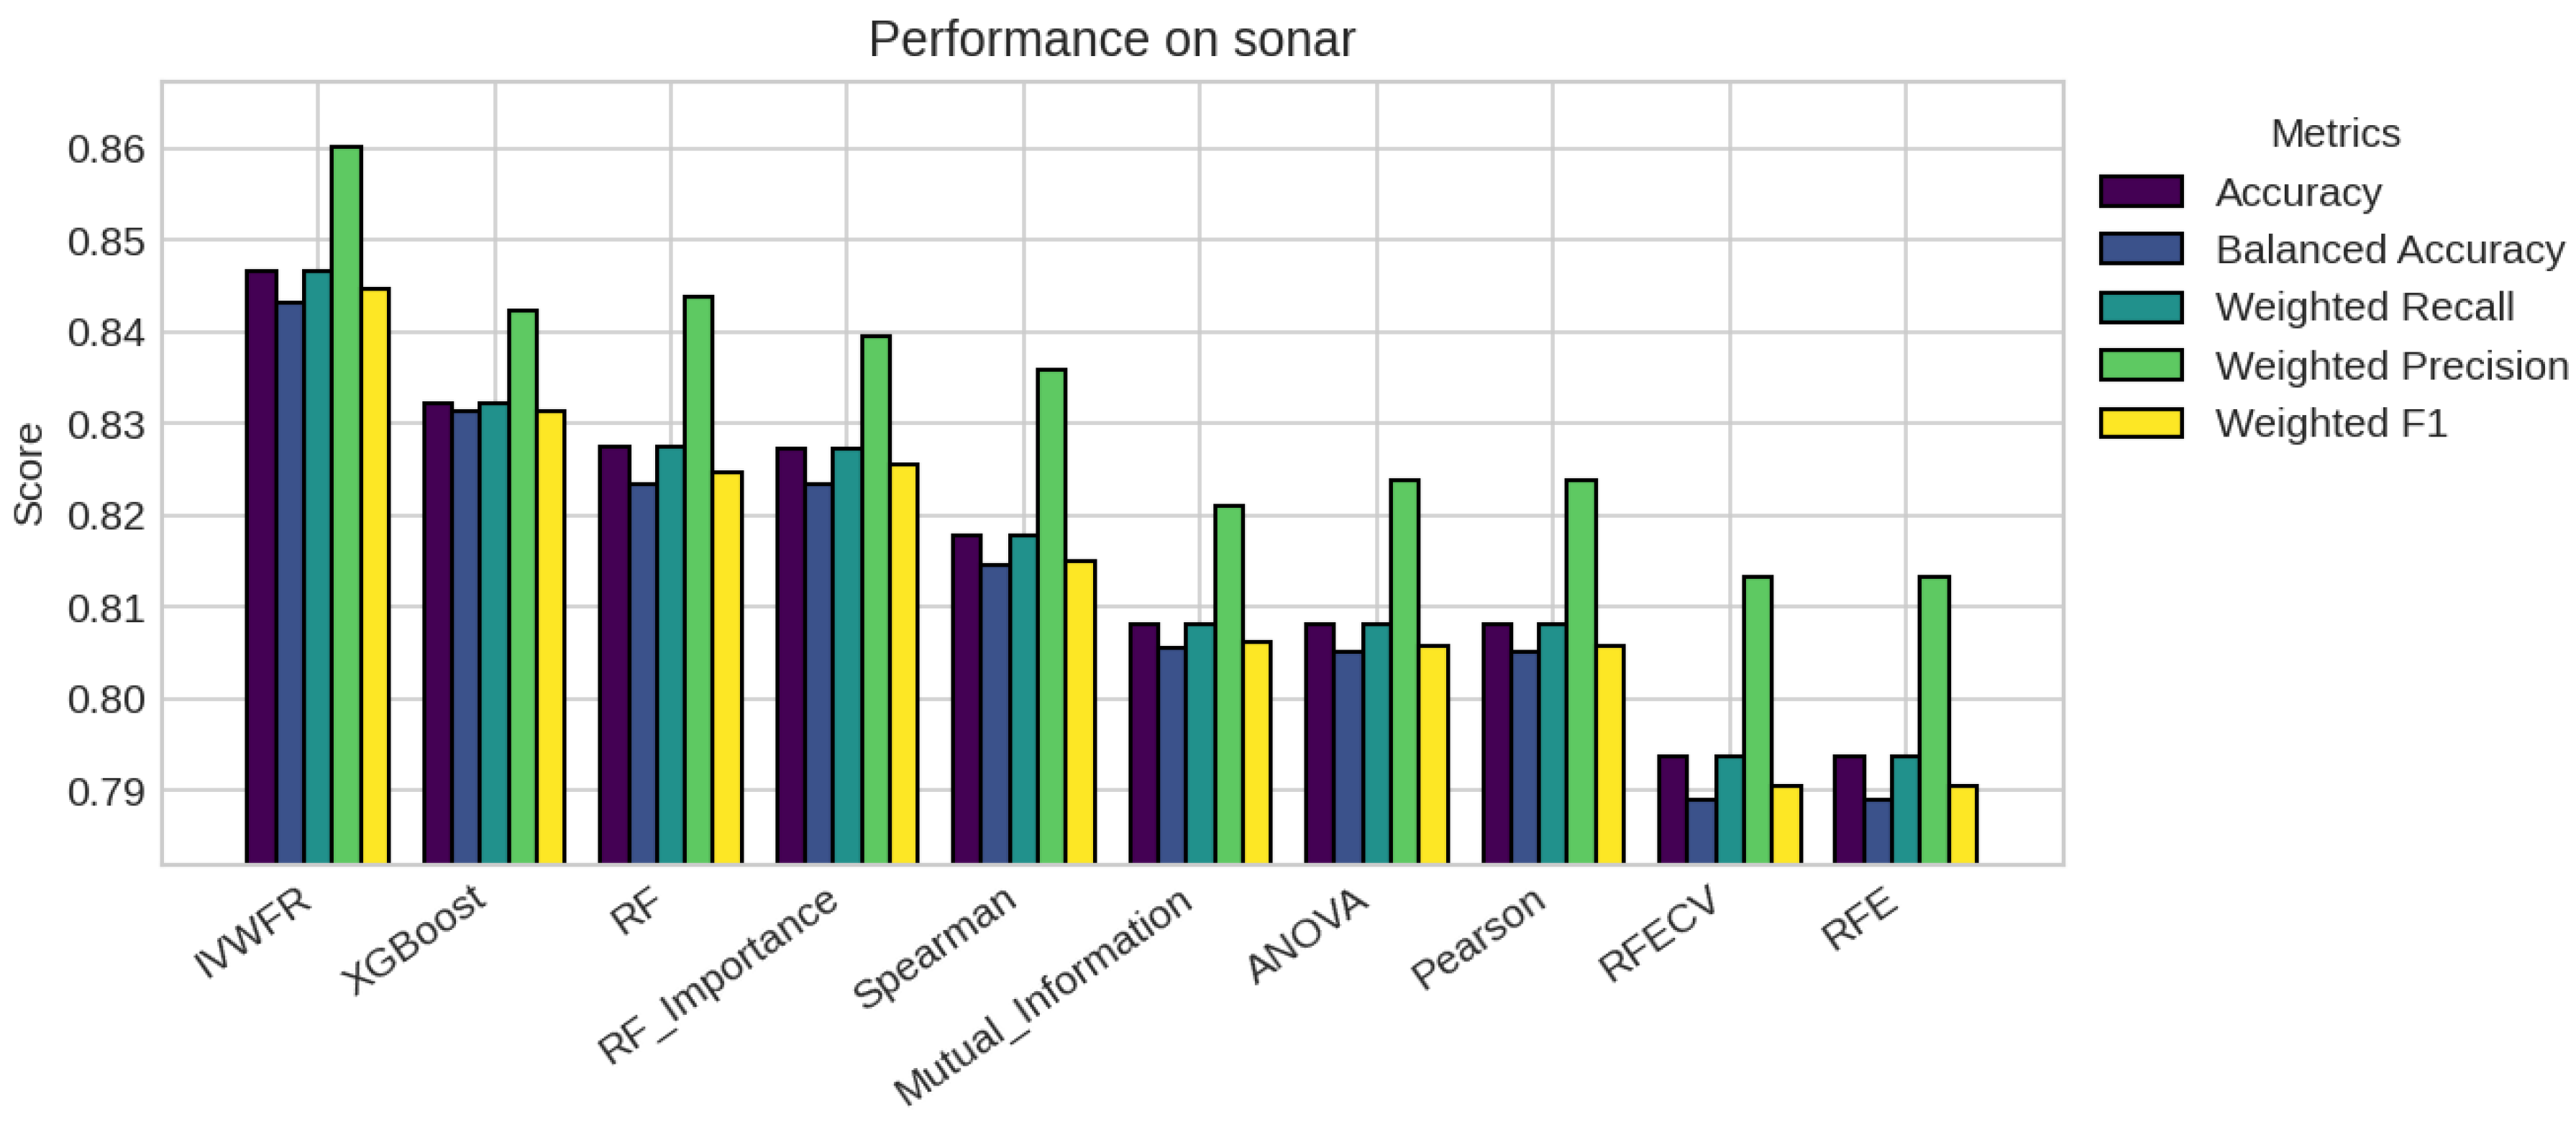


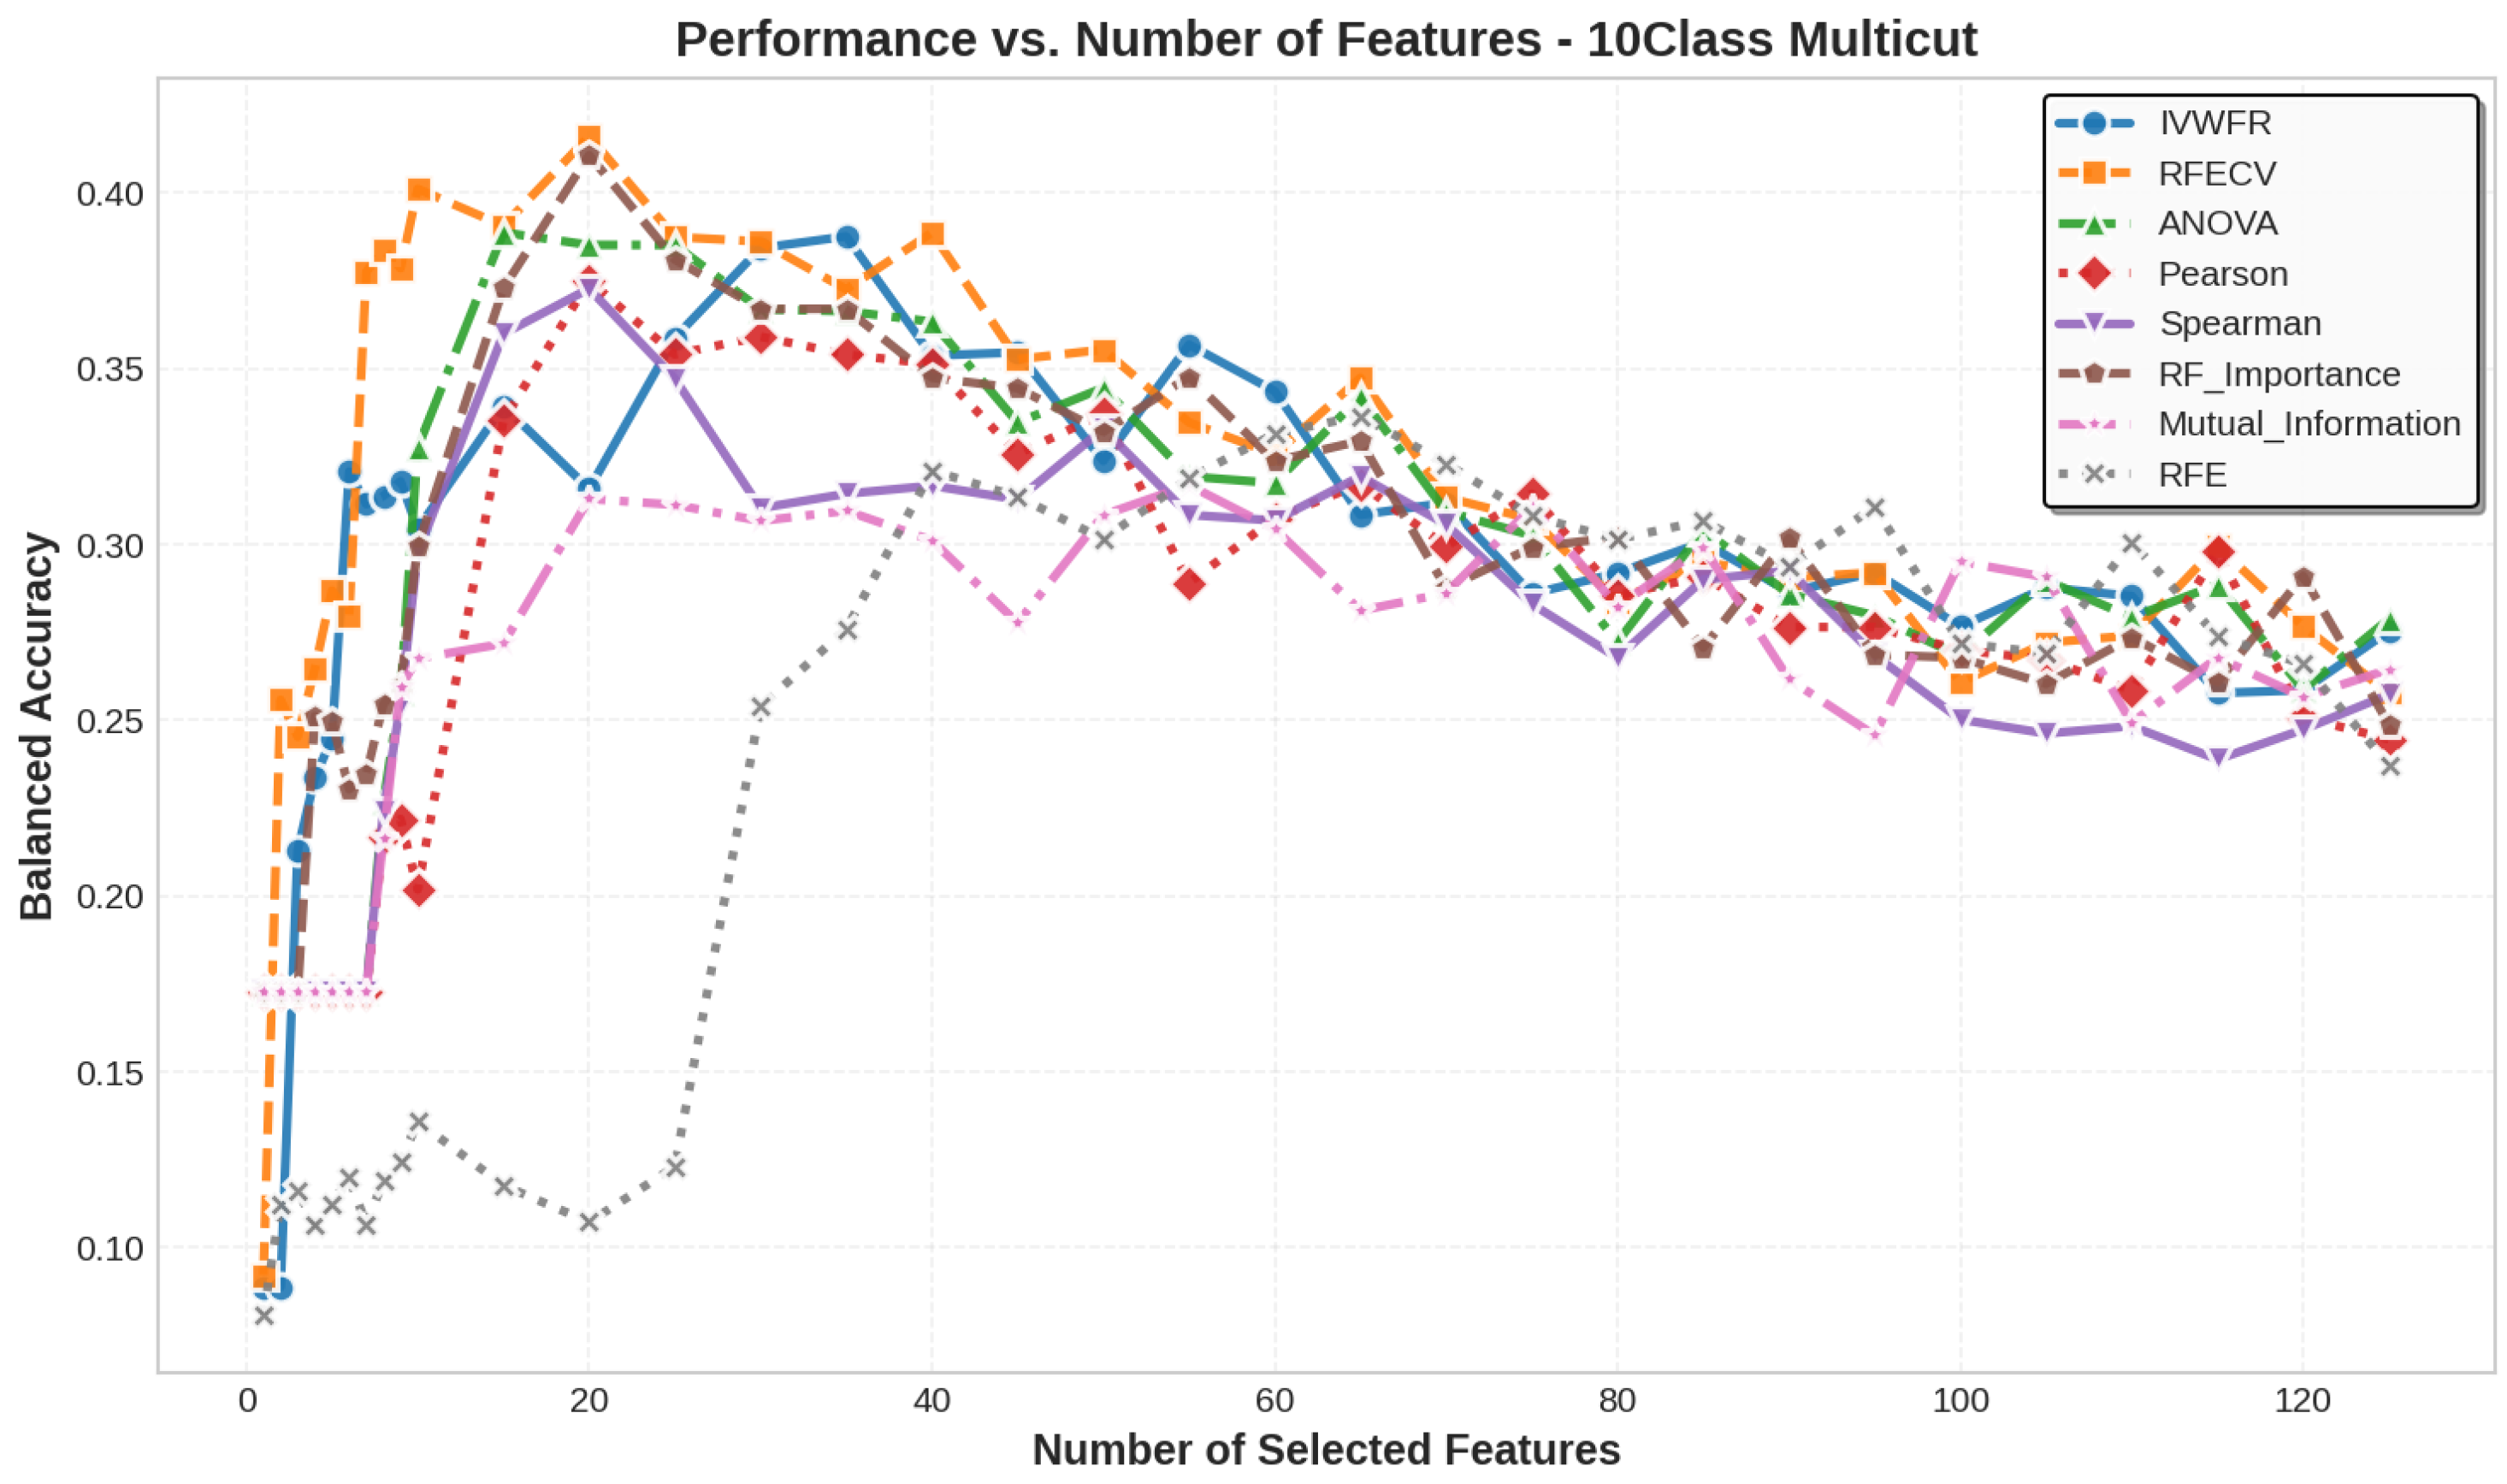

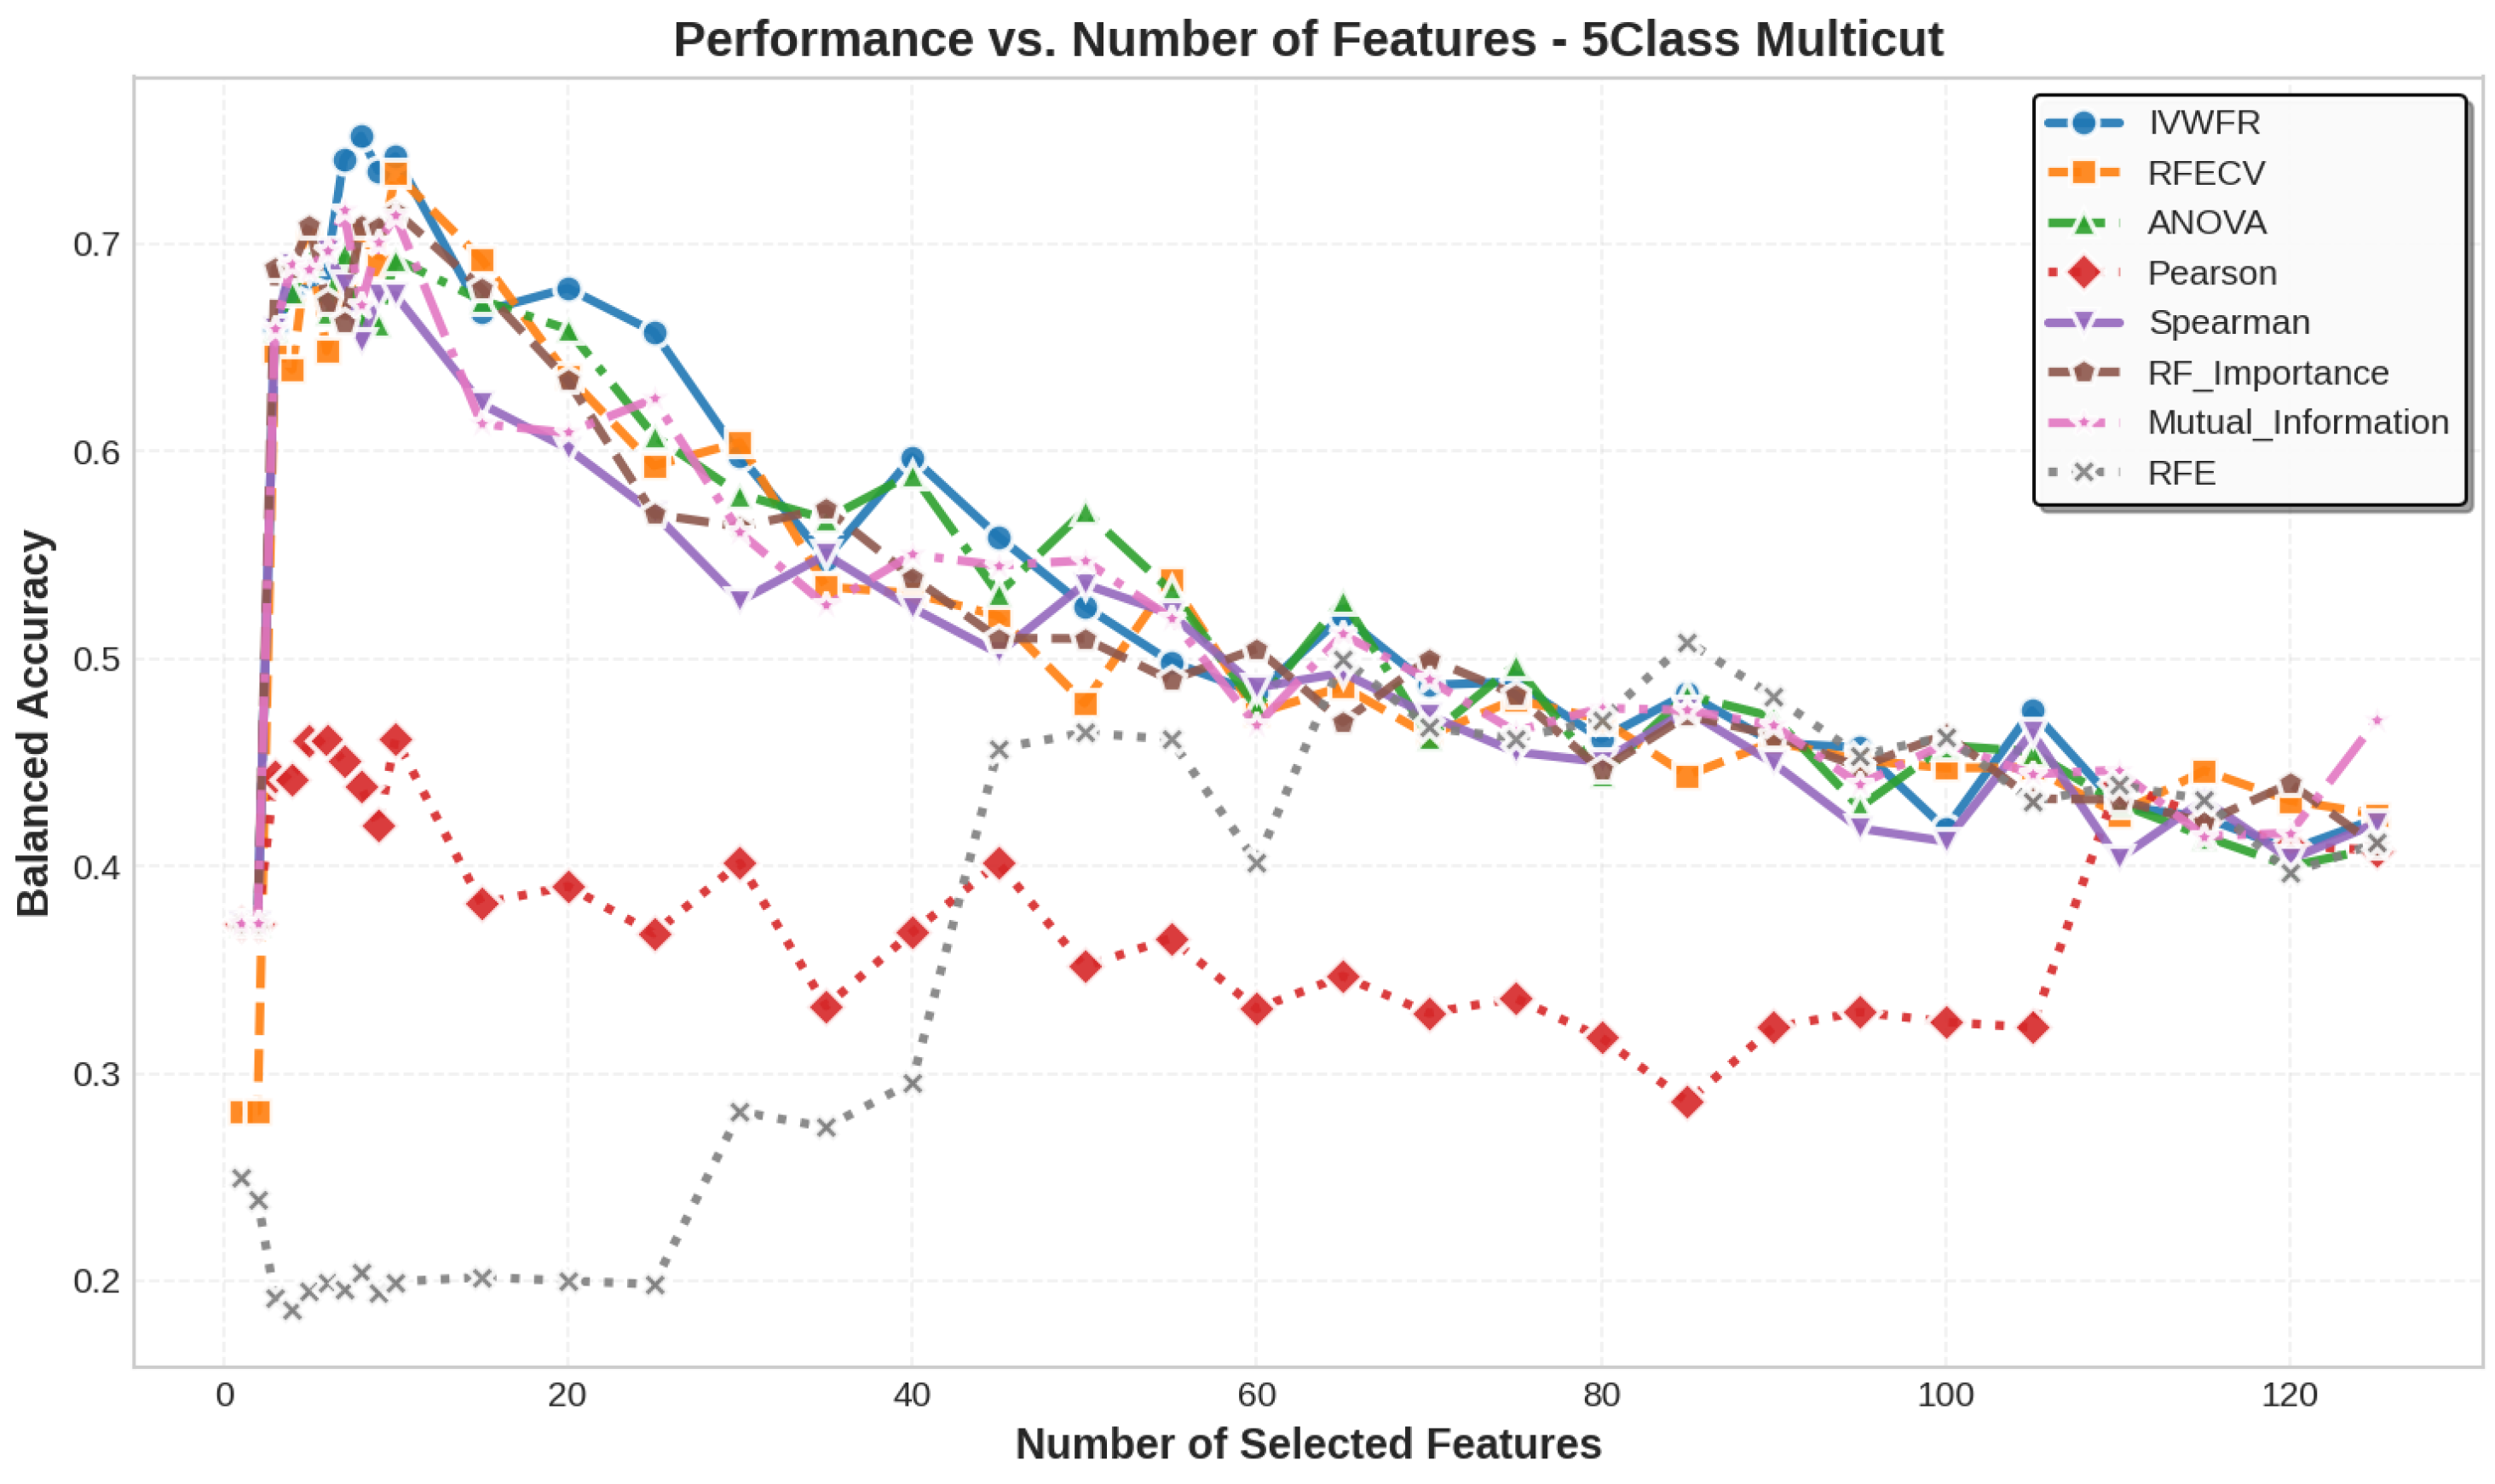


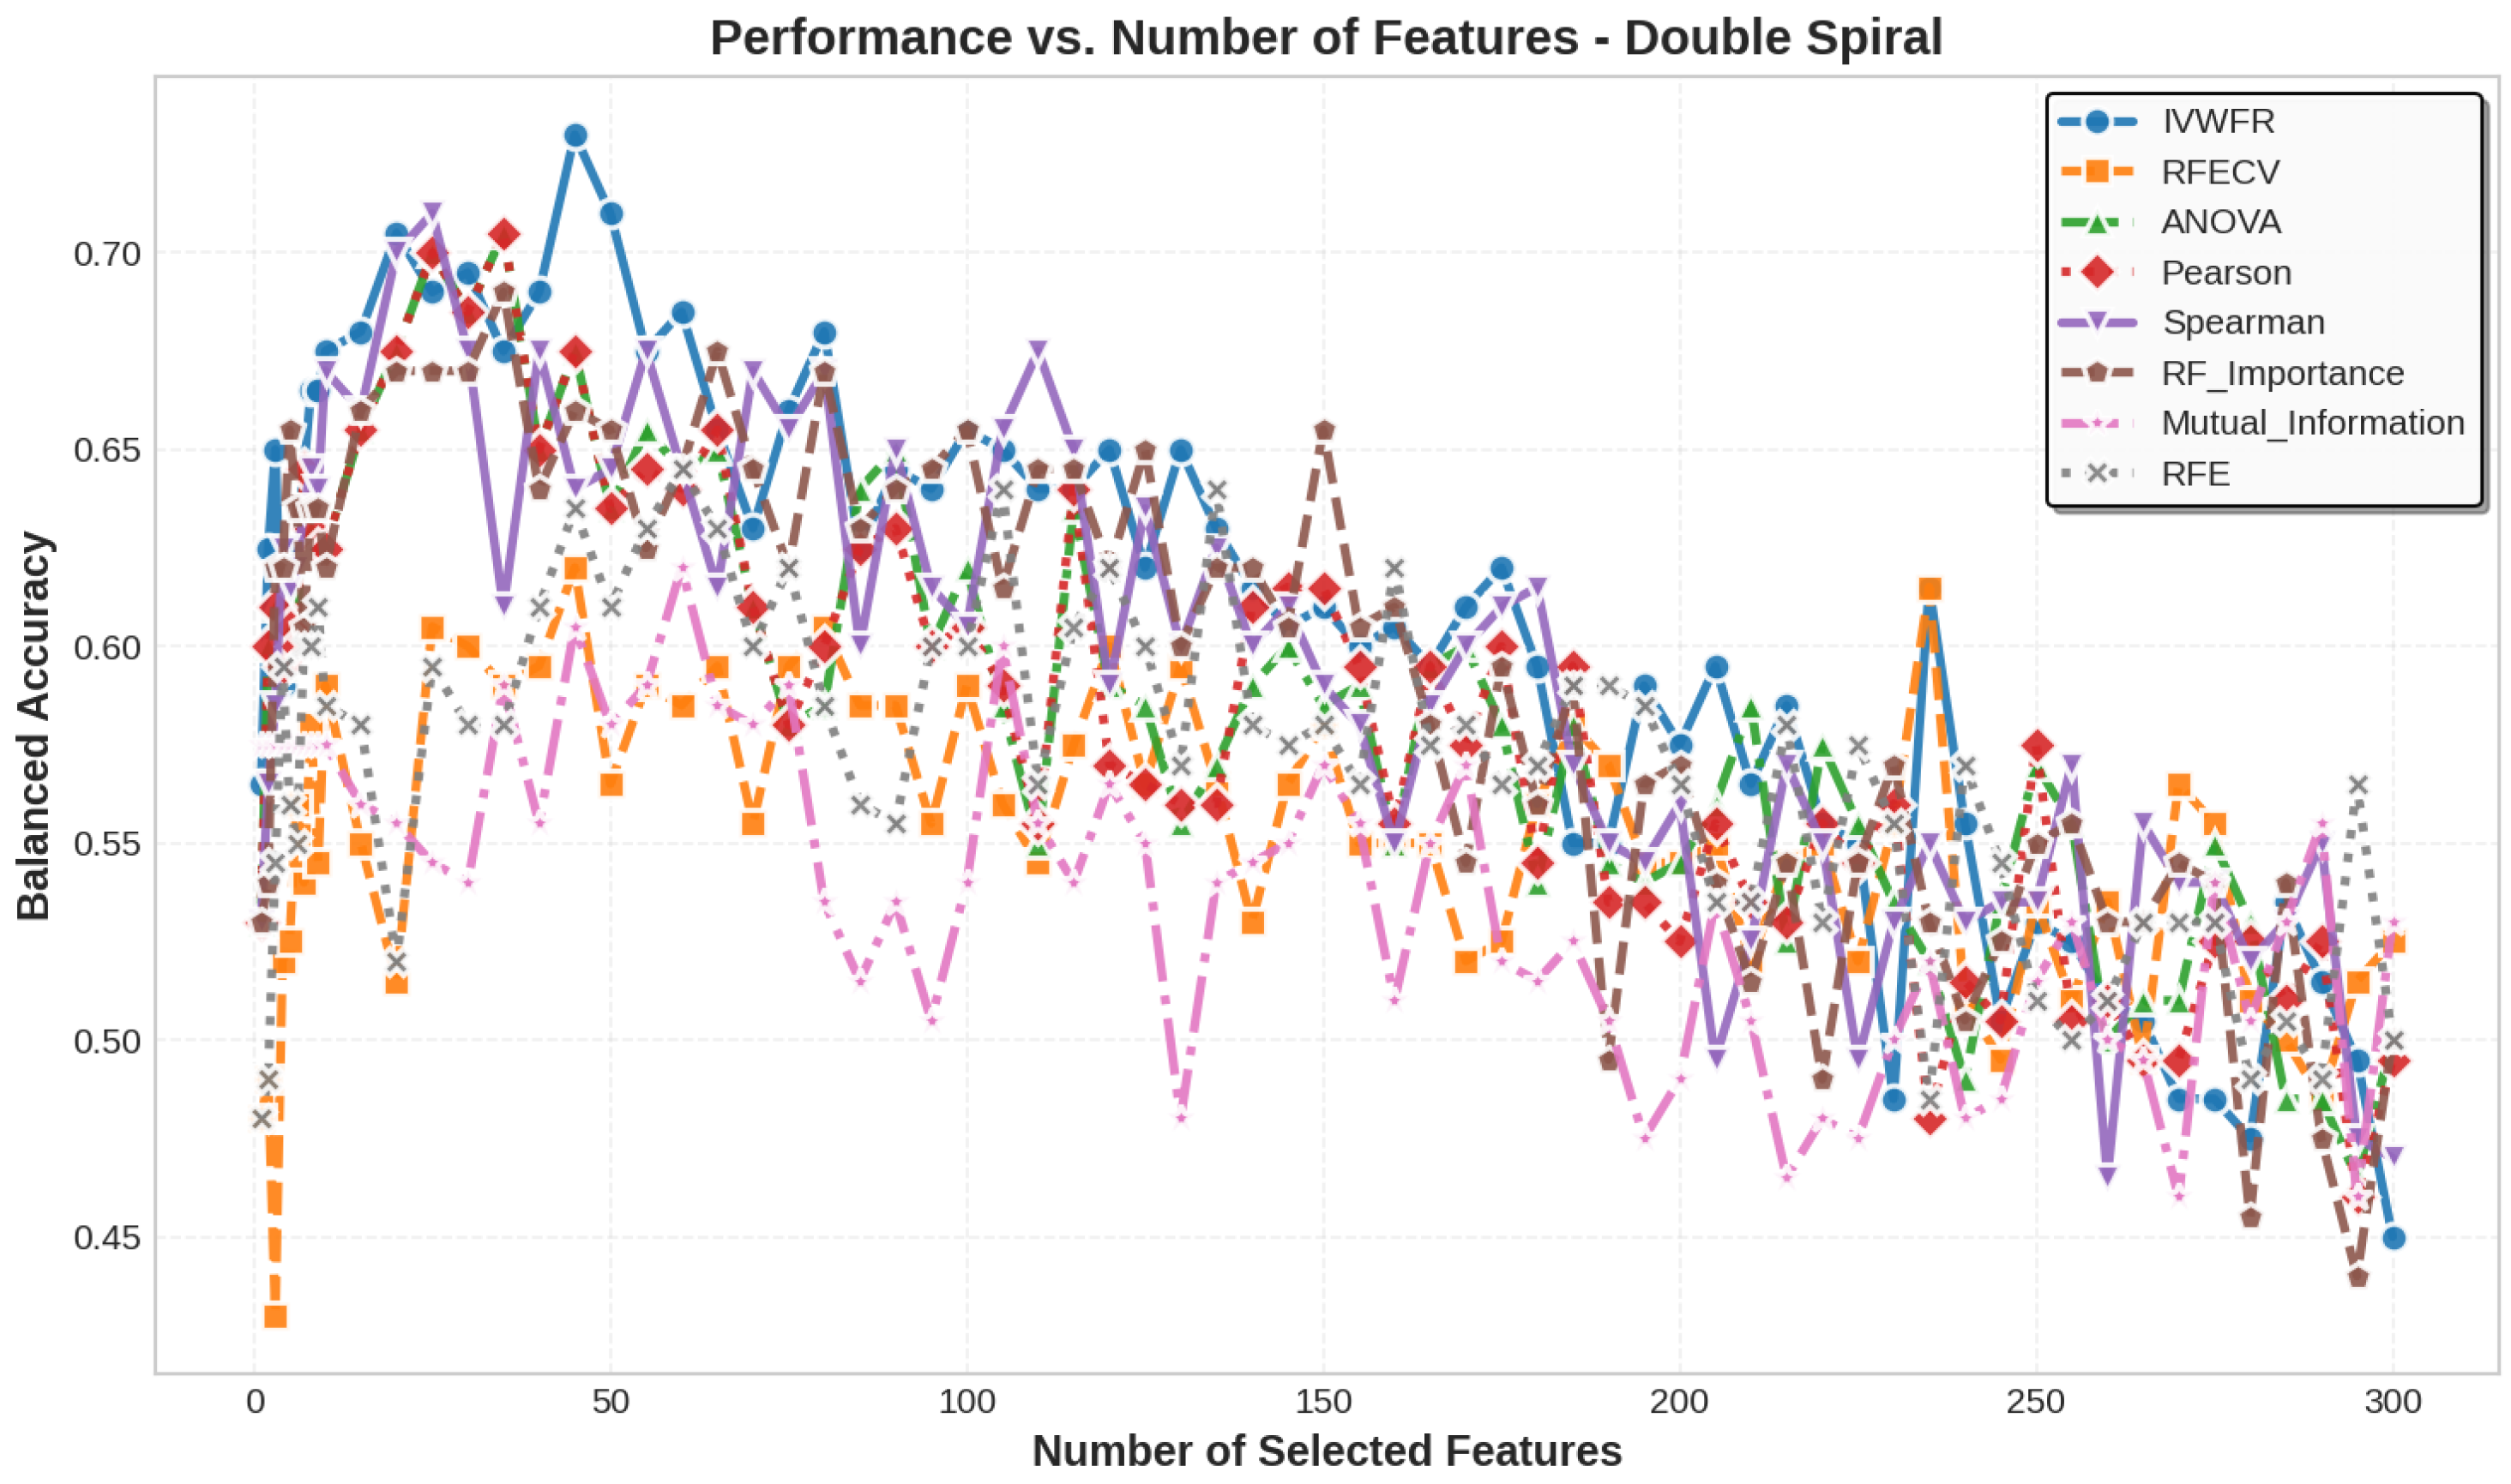
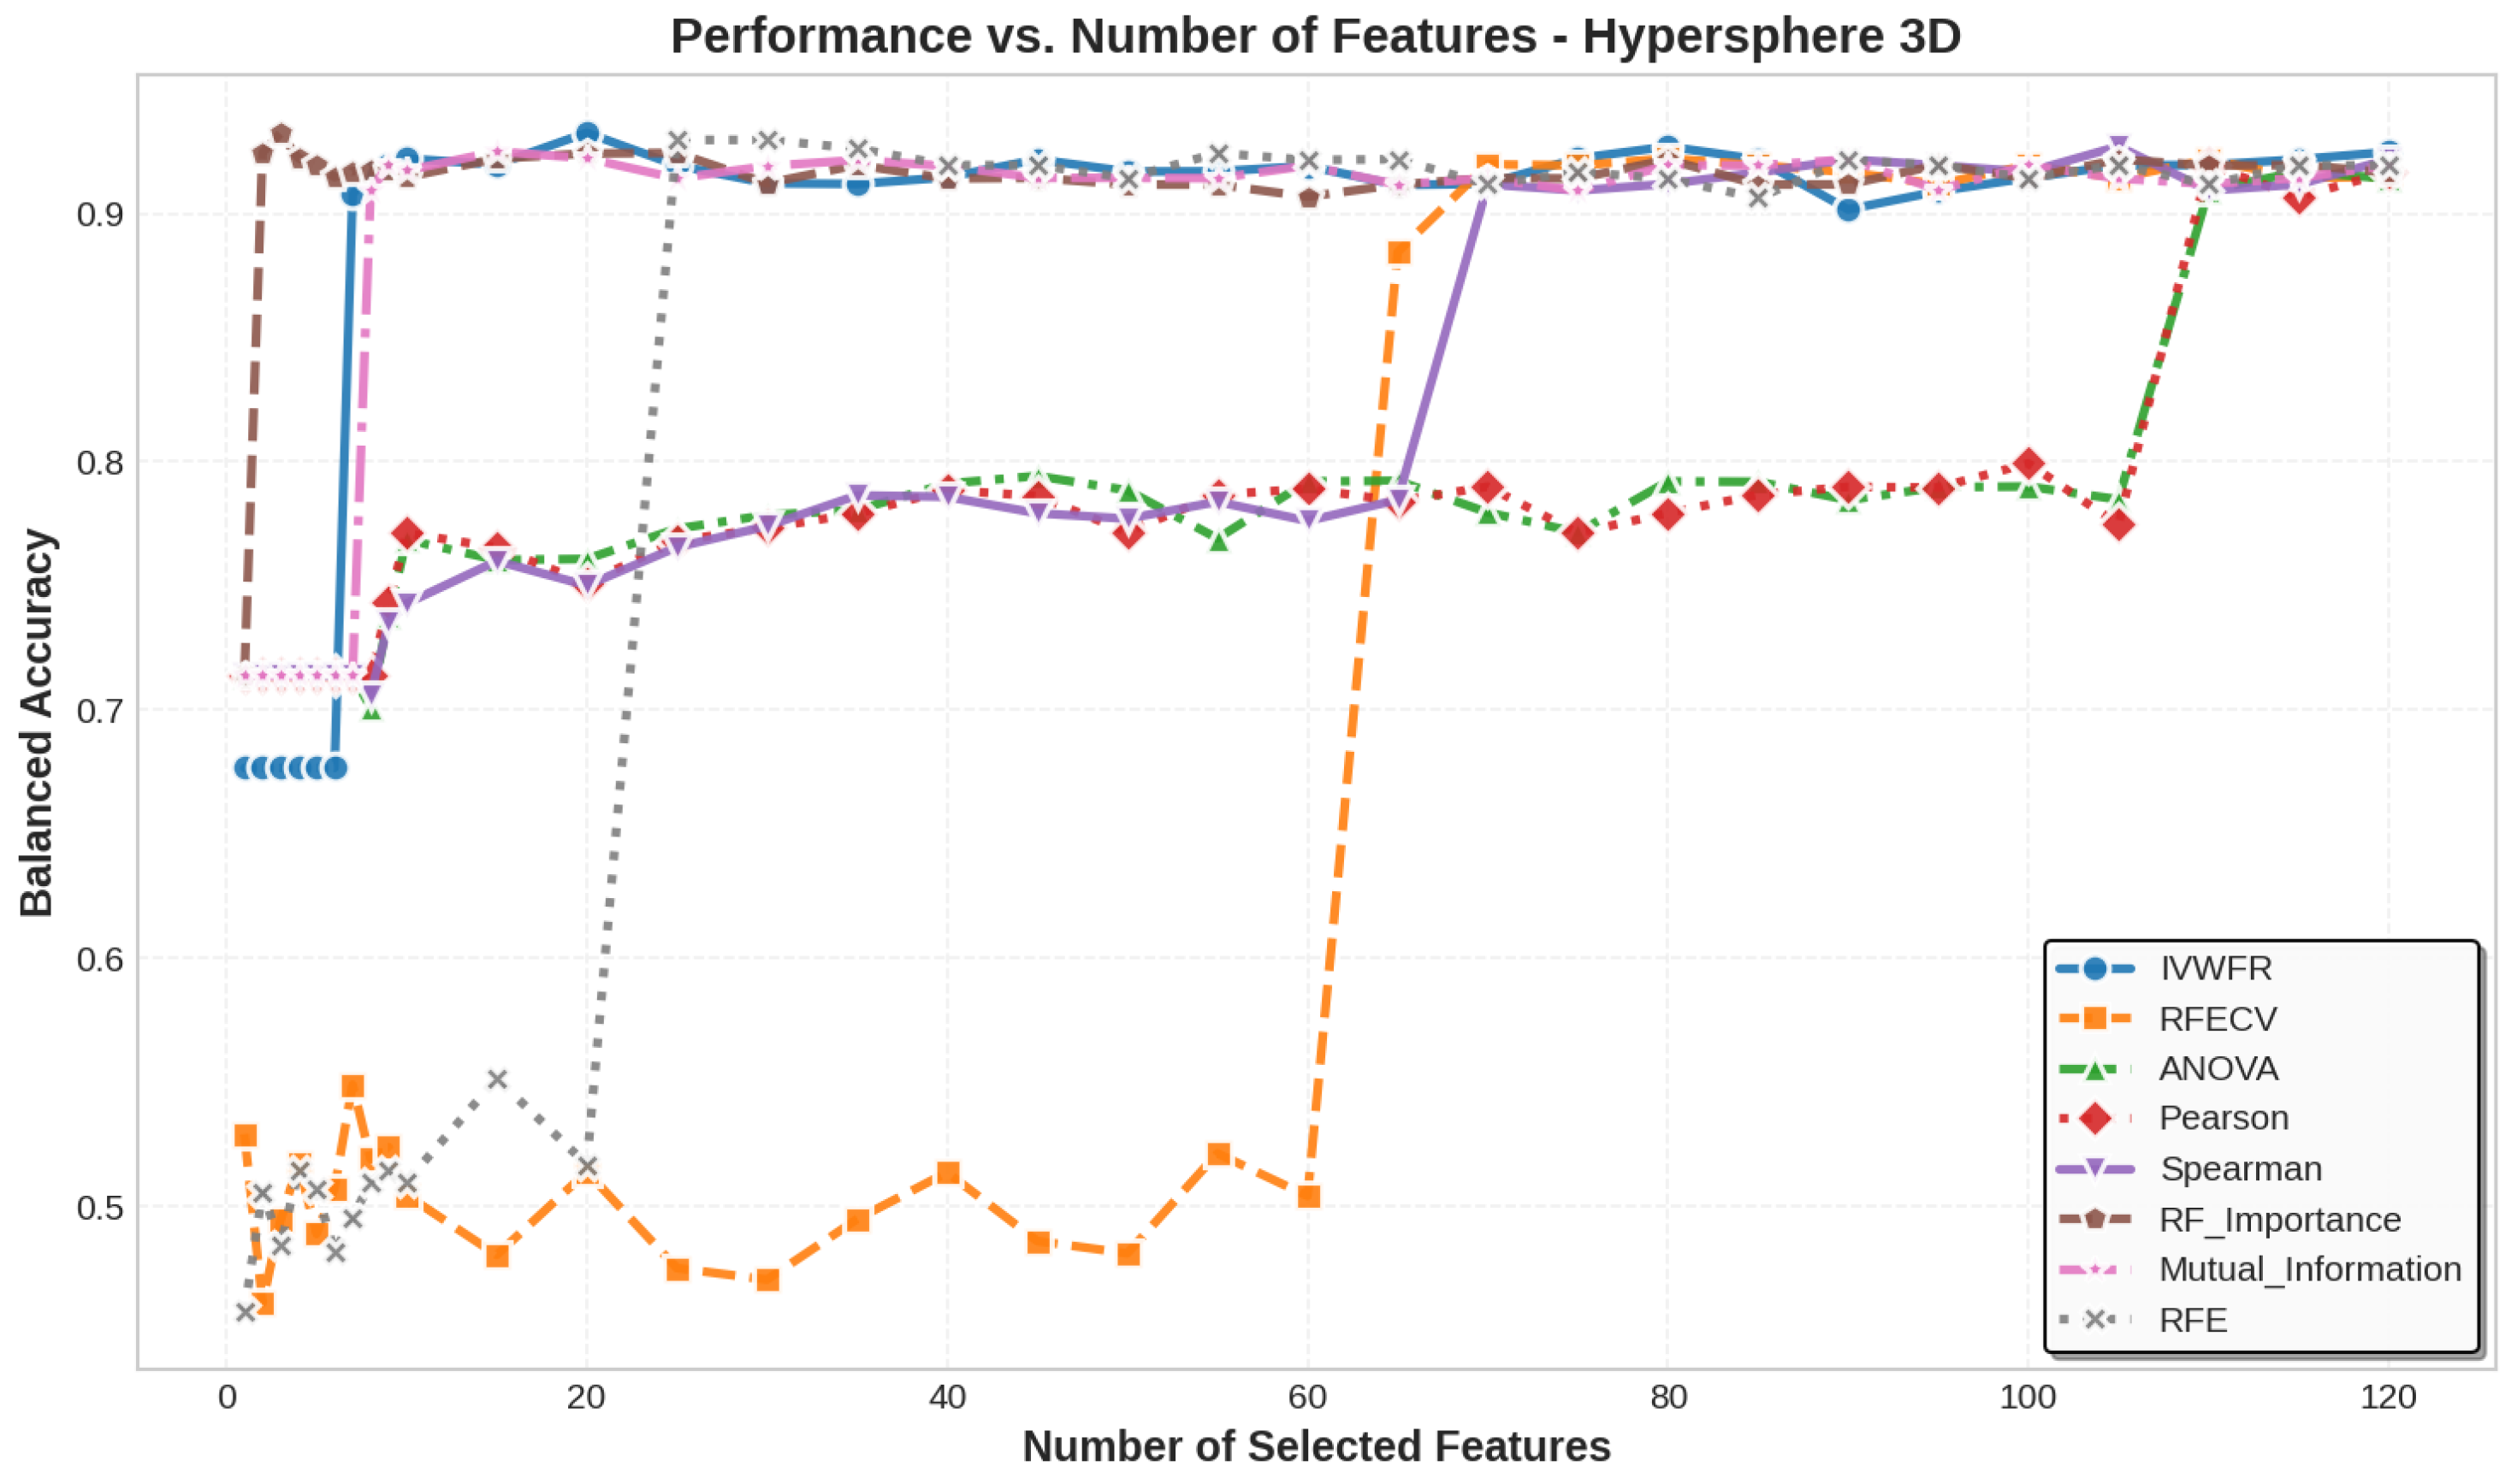
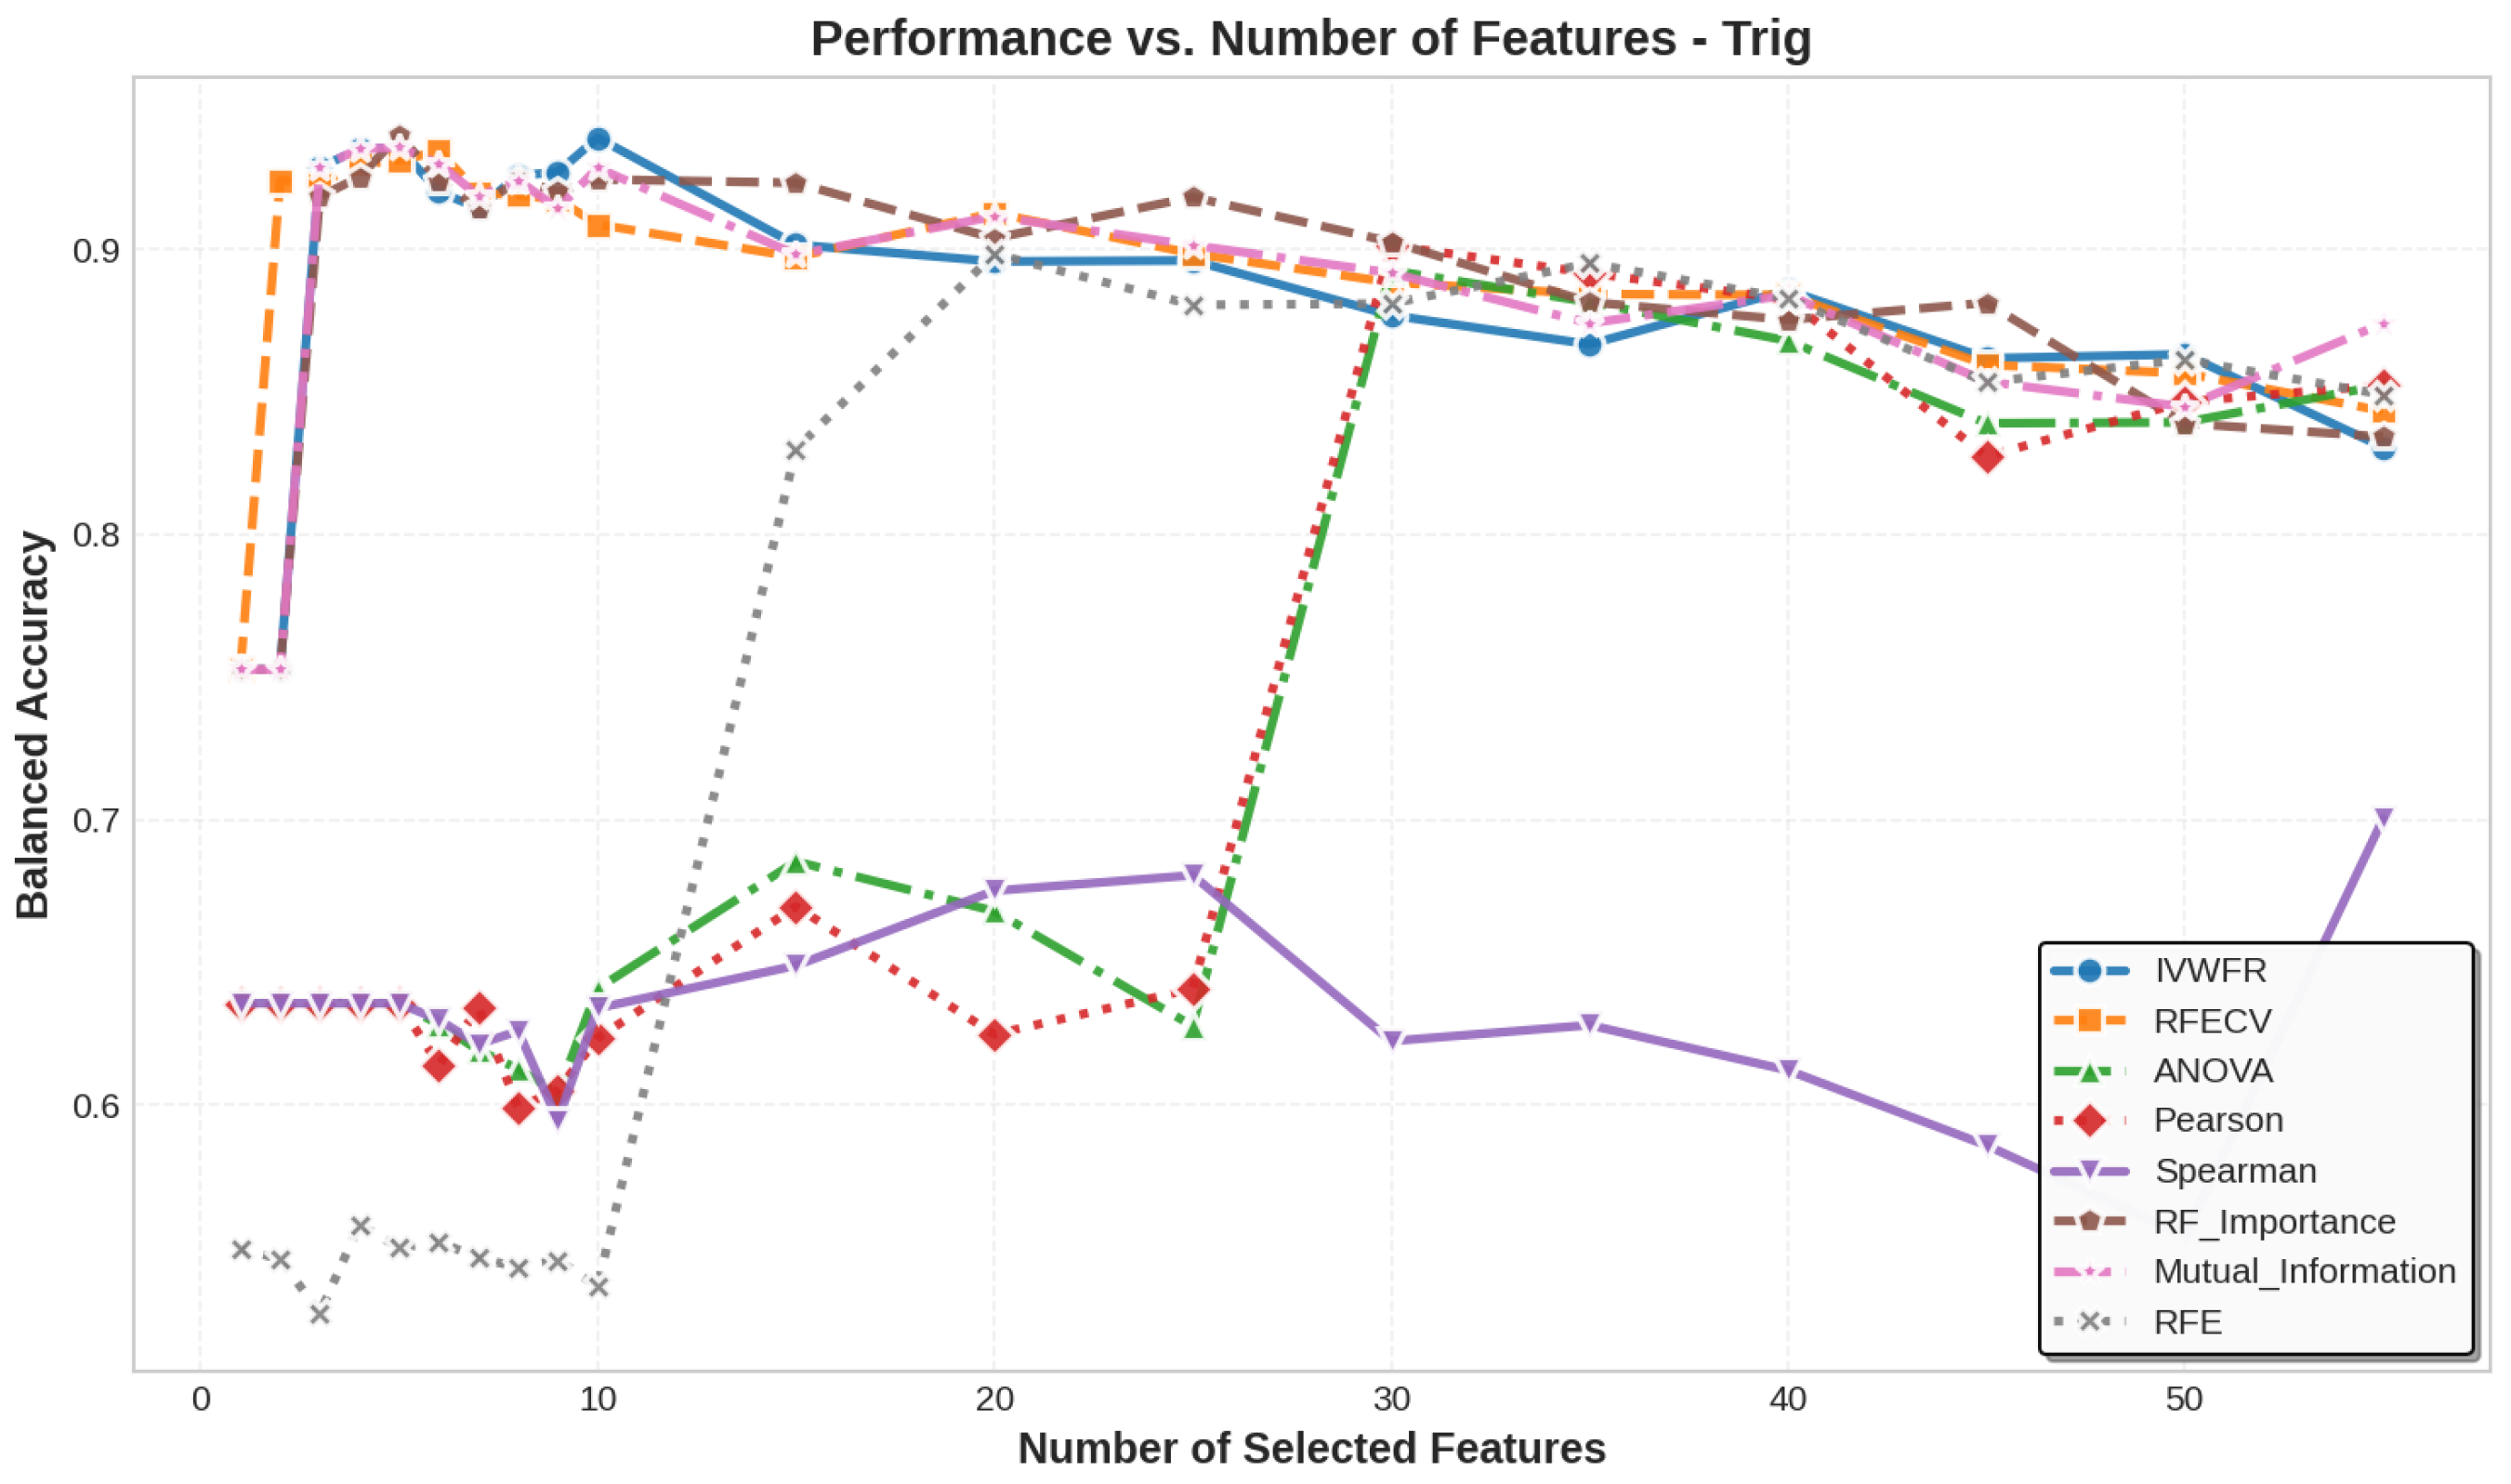

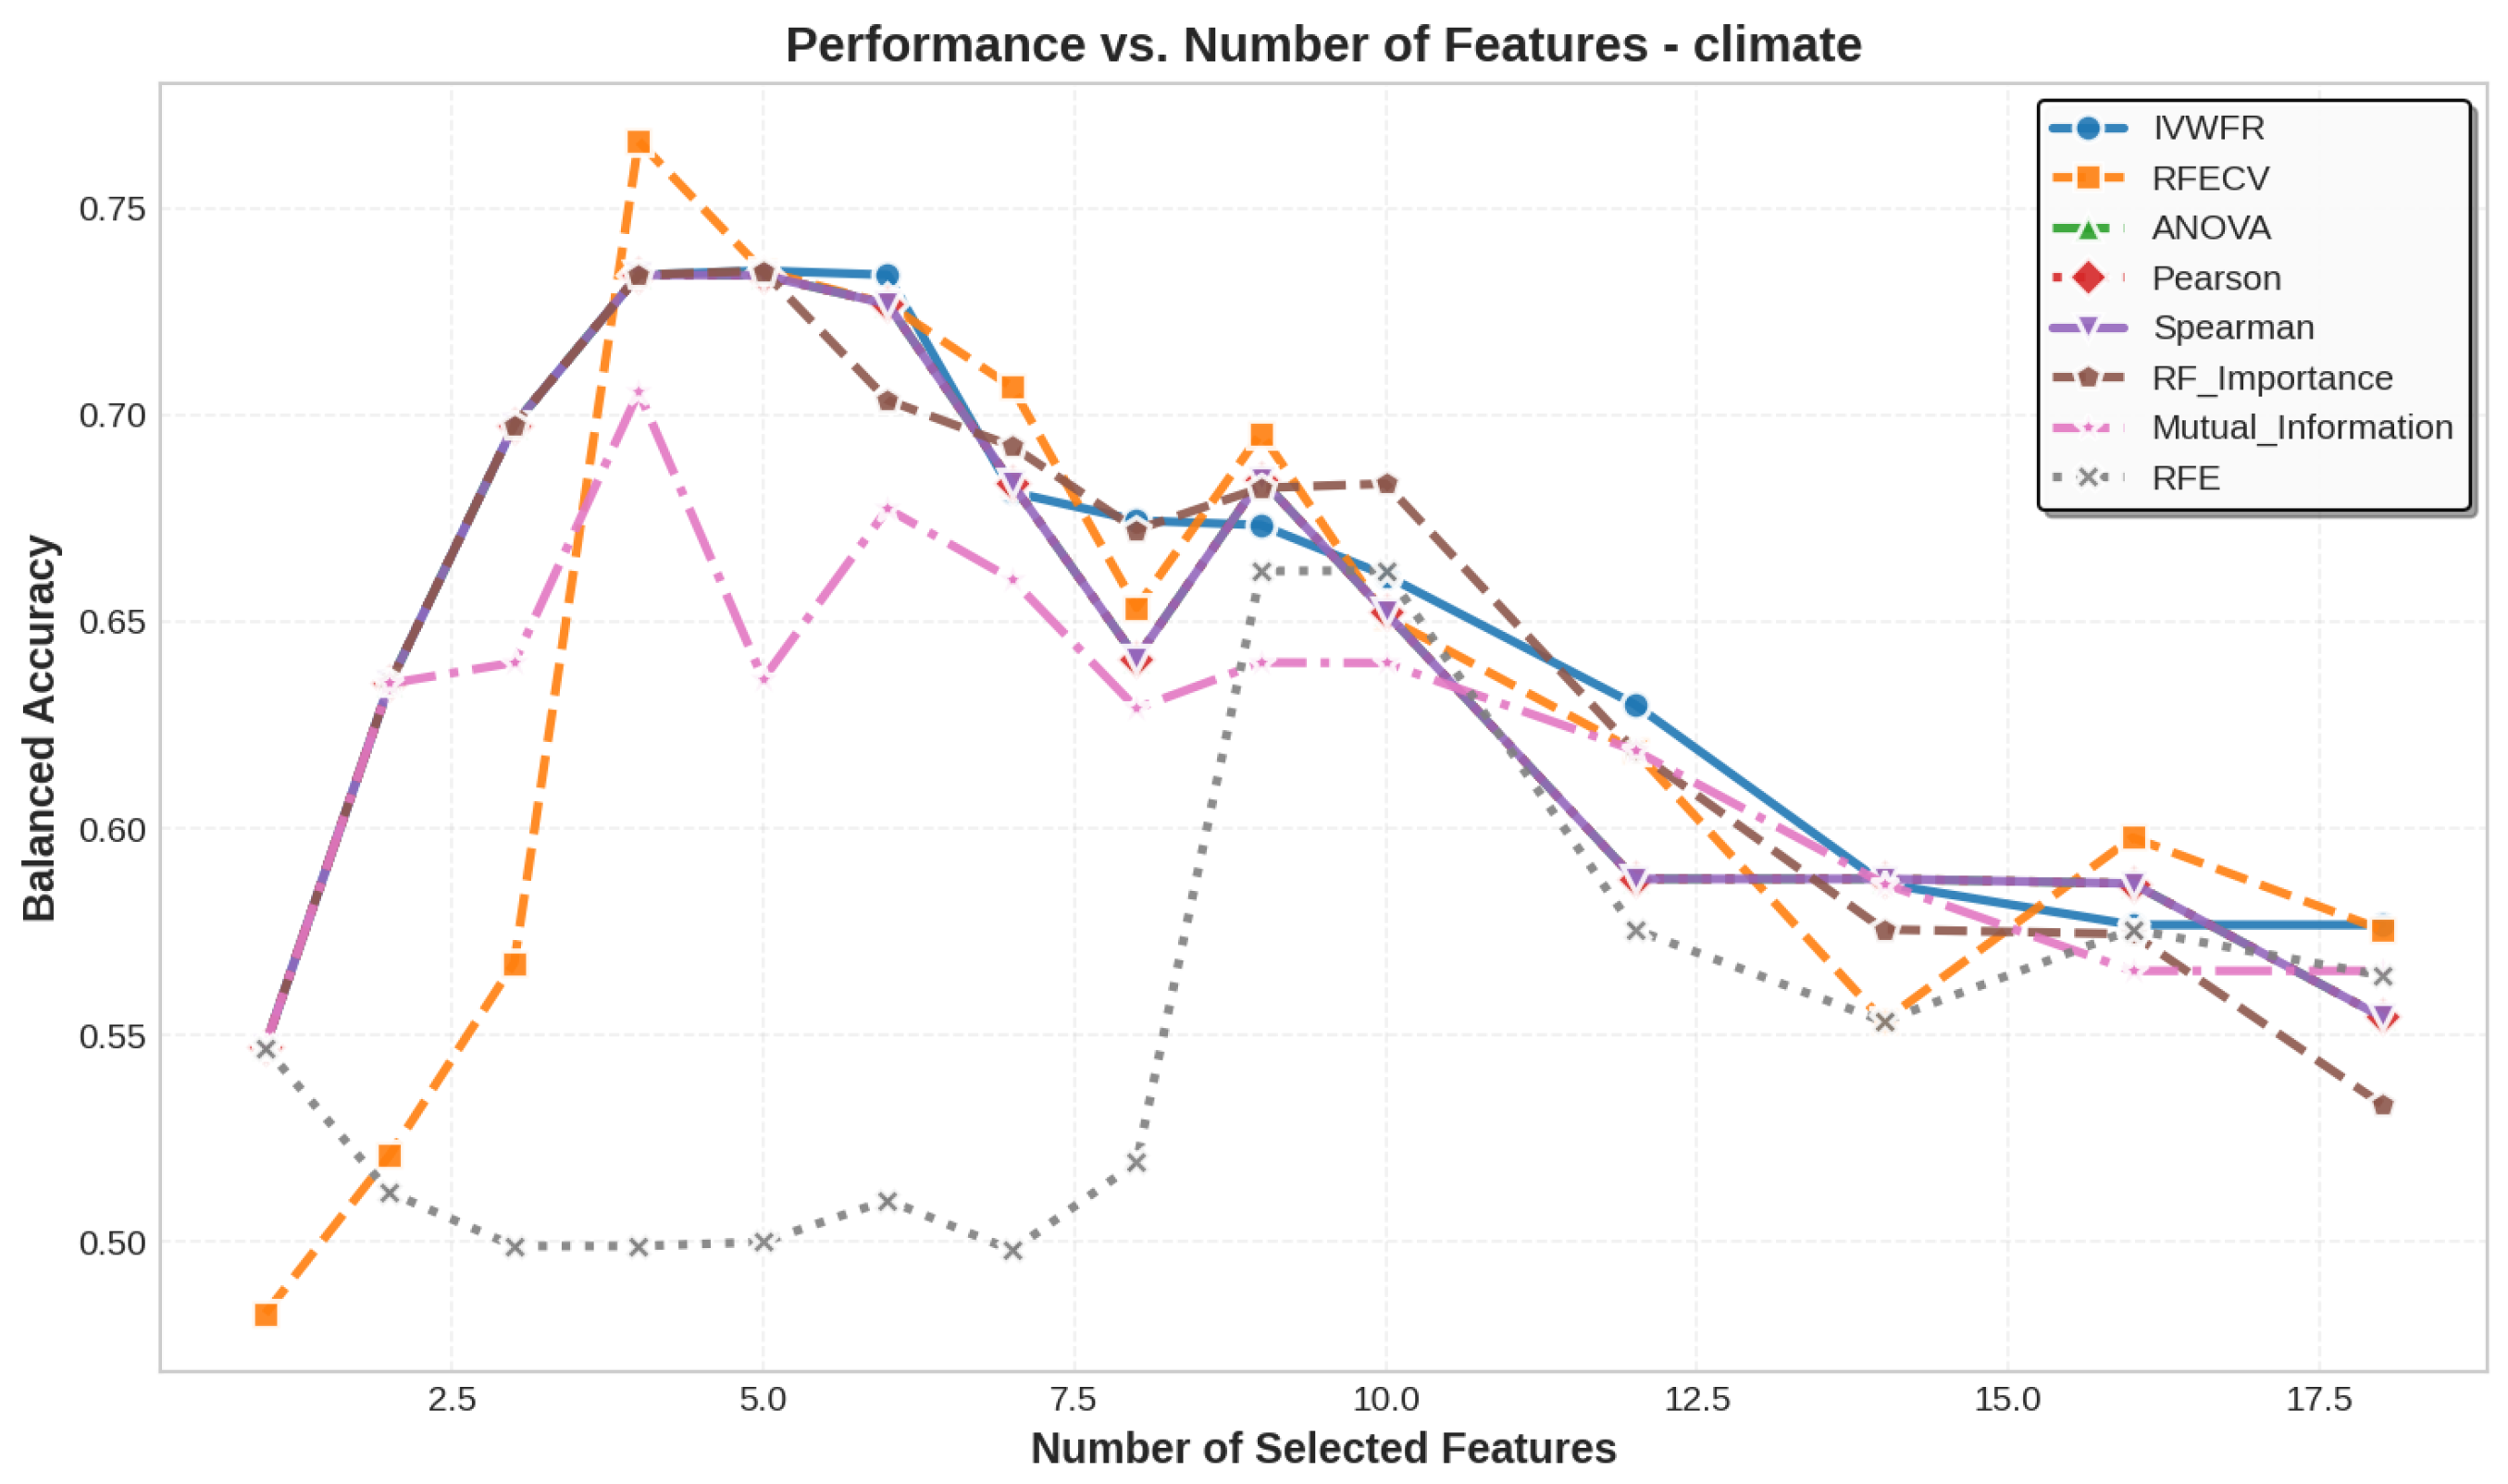




| Missing % | Mean Acc | Std Dev | Degradation | Avg Features |
|---|---|---|---|---|
| 5% | 0.9178 | 0.0049 | 0.0376 (3.9%) | 8.0 |
| 10% | 0.8912 | 0.0032 | 0.0643 (6.7%) | 8.0 |
| 15% | 0.8635 | 0.0032 | 0.0920 (9.6%) | 8.0 |
| 20% | 0.8352 | 0.0070 | 0.1203 (12.6%) | 8.0 |
| Missing % | Mean Acc | Std Dev | Degradation | Avg Features |
|---|---|---|---|---|
| 5% | 0.6172 | 0.0055 | 0.0021 (0.3%) | 5.0 |
| 10% | 0.6113 | 0.0084 | 0.0080 (1.3%) | 5.0 |
| 15% | 0.5923 | 0.0087 | 0.0271 (4.4%) | 5.0 |
| 20% | 0.5948 | 0.0052 | 0.0246 (4.0%) | 5.0 |
| Missing % | Mean Acc | Std Dev | Degradation | Avg Features |
|---|---|---|---|---|
| 5% | 0.8377 | 0.0156 | 0.0411 (4.7%) | 7.0 |
| 10% | 0.7991 | 0.0171 | 0.0797 (9.1%) | 7.0 |
| 15% | 0.7858 | 0.0046 | 0.0930 (10.6%) | 7.0 |
| 20% | 0.7724 | 0.0166 | 0.1064 (12.1%) | 7.0 |
| Missing % | Mean Acc | Std Dev | Degradation | Avg Features |
|---|---|---|---|---|
| 5% | 0.8014 | 0.0123 | 0.0041 (0.5%) | 30.0 |
| 10% | 0.7891 | 0.0207 | 0.0163 (2.0%) | 30.0 |
| 15% | 0.7910 | 0.0190 | 0.0144 (1.8%) | 30.0 |
| 20% | 0.7931 | 0.0219 | 0.0124 (1.5%) | 30.0 |
| Missing % | Mean Acc | Std Dev | Degradation | Avg Features |
|---|---|---|---|---|
| 5% | 0.6405 | 0.0181 | 0.0440 (6.4%) | 9.0 |
| 10% | 0.6386 | 0.0365 | 0.0460 (6.7%) | 9.0 |
| 15% | 0.6069 | 0.0298 | 0.0777 (11.3%) | 9.0 |
| 20% | 0.5926 | 0.0232 | 0.0920 (13.4%) | 9.0 |
References
- Dash, M.; Liu, H. Feature selection for classification. Intell. Data Anal. 1997, 1, 131–156. [Google Scholar] [CrossRef]
- Guyon, I.; Elisseeff, A. An introduction to variable and feature selection. J. Mach. Learn. Res. 2003, 3, 1157–1182. [Google Scholar]
- Saeys, Y.; Inza, I.; Larrañaga, P. A review of feature selection techniques in bioinformatics. Bioinformatics 2007, 23, 2507–2517. [Google Scholar] [CrossRef] [PubMed]
- Chandrashekar, G.; Sahin, F. A survey on feature selection methods. Comput. Electr. Eng. 2014, 40, 16–28. [Google Scholar] [CrossRef]
- Kuncheva, L.I. A stability index for feature selection. In Proceedings of the 25th IASTED International Multi-Conference: Artificial Intelligence and Applications, Innsbruck, Austria, 12–14 February 2007; pp. 390–395. [Google Scholar]
- Haury, A.C.; Gestraud, P.; Vert, J.P. The influence of feature selection methods on accuracy, stability and interpretability of molecular signatures. PLoS ONE 2011, 6, e28210. [Google Scholar] [CrossRef] [PubMed]
- Nogueira, S.; Sechidis, K.; Brown, G. On the stability of feature selection algorithms. J. Mach. Learn. Res. 2018, 18, 1–54. [Google Scholar]
- Cawley, G.C.; Talbot, N.L. On over-fitting in model selection and subsequent selection bias in performance evaluation. J. Mach. Learn. Res. 2010, 11, 2079–2107. [Google Scholar]
- Ahmad, J.; Latif, S.; Khan, I.U.; Alshehri, M.S.; Khan, M.S.; Alasbali, N.; Jiang, W. An interpretable deep learning framework for intrusion detection in industrial Internet of Things. Internet Things 2025, 33, 101681. [Google Scholar] [CrossRef]
- Strobl, C.; Boulesteix, A.L.; Kneib, T.; Augustin, T.; Zeileis, A. Conditional variable importance for random forests. BMC Bioinform. 2008, 9, 307. [Google Scholar] [CrossRef] [PubMed]
- Meinshausen, N.; Bühlmann, P. Stability selection. J. R. Stat. Soc. Ser. B (Stat. Methodol.) 2010, 72, 417–473. [Google Scholar] [CrossRef]
- Kalousis, A.; Prados, J.; Hilario, M. Stability of feature selection algorithms: A study on high-dimensional spaces. Knowl. Inf. Syst. 2007, 12, 95–116. [Google Scholar] [CrossRef]
- Wojtowicz, A.; Bentkowska, U.; Paja, W. The interval-valued weighted feature ranking method based on aggregation functions. In Proceedings of the 2025 IEEE International Conference on Fuzzy Systems (FUZZ), Reims, France, 6–10 July 2025; pp. 1–7. [Google Scholar] [CrossRef]
- Zadeh, L.A. The concept of a linguistic variable and its application to approximate reasoning—I. Inf. Sci. 1975, 8, 199–249. [Google Scholar] [CrossRef]
- Dubois, D.; Prade, H. Internal-valued fuzzy sets, possibility theory and imprecise probability. In Proceedings of the 4th Conference of the European Society for Fuzzy Logic and Technology (EUSFLAT 2005) and 11èmes Rencontres Francophones sur la Logique Floue et ses Applications (LFA 2005), Barcelona, Spain, 7–9 September 2005; pp. 314–319. [Google Scholar]
- Komorníková, M.; Mesiar, R. Aggregation functions on bounded partially ordered sets and their classification. Fuzzy Sets Syst. 2011, 175, 48–56. [Google Scholar] [CrossRef]
- Bustince, H.; Fernandez, J.; Kolesárová, A.; Mesiar, R. Generation of linear orders for intervals by means of aggregation functions. Fuzzy Sets Syst. 2013, 220, 69–77. [Google Scholar] [CrossRef]
- Akiba, T.; Sano, S.; Yanase, T.; Ohta, T.; Koyama, M. Optuna: A Next-generation Hyperparameter Optimization Framework. In Proceedings of the 25th ACM SIGKDD International Conference on Knowledge Discovery & Data Mining, Anchorage, AK, USA, 4–8 August 2019; pp. 2623–2631. [Google Scholar] [CrossRef]
- Reference Page for the Accuracy Score Implementation in Scikit-Learn. Available online: https://scikit-learn.org/stable/modules/generated/sklearn.metrics.accuracy_score.html#sklearn.metrics.accuracy_score (accessed on 13 June 2023).
- Reference Page for the Recall Score Implementation in Scikit-Learn. Available online: https://scikit-learn.org/stable/modules/generated/sklearn.metrics.recall_score.html (accessed on 13 June 2023).
- Reference Page for the Precision Score Implementation in Scikit-Learn. Available online: https://scikit-learn.org/stable/modules/generated/sklearn.metrics.precision_score.html (accessed on 13 June 2023).
- Reference Page for the F1 Score Implementation in Scikit-Learn. Available online: https://scikit-learn.org/stable/modules/generated/sklearn.metrics.f1_score.html (accessed on 13 June 2023).
- Mitra, R.; Ali, E.; Varam, D.; Sulieman, H.; Kamalov, F. Variable Selection in Data Analysis: A Synthetic Data Toolkit. Mathematics 2024, 12, 570. [Google Scholar] [CrossRef]

| Dataset | Rows | Features | Classes (Ratios) |
|---|---|---|---|
| Climate | 540 | 18 | 2 (0.09, 0.91) |
| Estimation of Obesity | 2111 | 16 | 7 (0.13, 0.14, 0.17, 0.14, 0.15, 0.14, 0.14) |
| Iranian Churn | 3150 | 13 | 2 (0.84, 0.16) |
| Sonar | 208 | 60 | 2 (0.53, 0.47) |
| Water Potability | 3276 | 9 | 2 (0.61, 0.39) |
| Dataset | Rows | Features | Classes (Ratios) | Rel | Red | Irr |
|---|---|---|---|---|---|---|
| 10Class Multicut | 500 | 126 | 10 (0.09, 0.06, 0.04, 0.04, 0.14, 0.18, 0.14, 0.14, 0.09, 0.09) | 6 | 20 | 100 |
| 4D AND | 100 | 113 | 2 (0.56, 0.44) | 4 | 9 | 100 |
| 5Class Multicut | 500 | 126 | 5 (0.03, 0.05, 0.05, 0.17, 0.70) | 6 | 20 | 100 |
| 5D XOR | 100 | 115 | 2 (0.49, 0.51) | 5 | 10 | 100 |
| Cone | 400 | 123 | 2 (0.54, 0.46) | 3 | 20 | 100 |
| Double Spiral | 200 | 303 | 2 (0.50, 0.50) | 3 | 37 | 263 |
| Hypersphere 3D | 400 | 123 | 2 (0.52, 0.48) | 3 | 20 | 100 |
| Trig | 200 | 57 | 2 (0.56, 0.43) | 2 | 5 | 50 |
| Yinyang | 601 | 62 | 2 (0.51, 0.49) | 2 | 10 | 50 |
| y = x | 200 | 122 | 2 (0.49, 0.51) | 2 | 20 | 100 |
| IVWFR | RFECV | ANOVA | Pearson | Spearman | RF-Imp. | Mutual Inf. | RFE | RF | XGBoost | |
|---|---|---|---|---|---|---|---|---|---|---|
| IVWFR | - | 0.041 | 2.2 × 10⁻⁷ | 1.4 × 10⁻⁷ | 1.3 × 10⁻⁶ | 2.3 × 10⁻⁴ | 2.1 × 10⁻⁶ | 0.041 | 5.9 × 10⁻⁸ | 2.1 × 10⁻⁶ |
| RFECV | 0.041 | - | 5.3 × 10⁻⁵ | 1.4 × 10⁻⁵ | 0.008 | 0.038 | 6.1 × 10⁻⁴ | 1 | 2.0 × 10⁻⁶ | 1.6 × 10⁻⁴ |
| ANOVA | 2.2 × 10⁻⁷ | 5.3 × 10⁻⁵ | - | 0.217 | 1 | 0.423 | 1 | 5.3 × 10⁻⁵ | 1 | 1 |
| Pearson | 1.4 × 10⁻⁷ | 1.4 × 10⁻⁵ | 0.217 | - | 0.022 | 8.3 × 10⁻⁵ | 1 | 1.4 × 10⁻⁵ | 1 | 0.259 |
| Spearman | 1.3 × 10⁻⁶ | 0.008 | 1 | 0.022 | - | 1 | 1 | 0.008 | 1 | 1 |
| RF-Imp. | 2.3 × 10⁻⁴ | 0.038 | 0.423 | 8.3 × 10⁻⁵ | 1 | - | 0.024 | 0.038 | 0.005 | 0.198 |
| Mutual Inf. | 2.1 × 10⁻⁶ | 6.1 × 10⁻⁴ | 1 | 1 | 1 | 0.024 | - | 6.1 × 10⁻⁴ | 1 | 1 |
| RFE | 0.041 | 1 | 5.3 × 10⁻⁵ | 1.4 × 10⁻⁵ | 0.008 | 0.038 | 6.1 × 10⁻⁴ | - | 2.0 × 10⁻⁶ | 1.6 × 10⁻⁴ |
| RF | 5.9 × 10⁻⁸ | 2.0 × 10⁻⁶ | 1 | 1 | 1 | 0.005 | 1 | 2.0 × 10⁻⁶ | - | 0.331 |
| XGBoost | 2.1 × 10⁻⁶ | 1.6 × 10⁻⁴ | 1 | 0.259 | 1 | 0.198 | 1 | 1.6 × 10⁻⁴ | 0.331 | - |
| IVWFR | RFECV | ANOVA | Pearson | Spearman | RF-Imp. | Mutual Inf. | RFE | RF | XGBoost | |
|---|---|---|---|---|---|---|---|---|---|---|
| IVWFR | - | 1 | 0.010 | 0.010 | 0.005 | 1 | 0.021 | 1 | 0.552 | 1 |
| RFECV | 1 | - | 0.114 | 0.114 | 0.292 | 1 | 0.321 | 1 | 1 | 1 |
| ANOVA | 0.010 | 0.114 | - | 1 | 1 | 0.008 | 1 | 0.114 | 1 | 0.064 |
| Pearson | 0.010 | 0.114 | 1 | - | 1 | 0.008 | 0.834 | 0.114 | 1 | 0.064 |
| Spearman | 0.005 | 0.292 | 1 | 1 | - | 0.029 | 0.999 | 0.292 | 1 | 0.040 |
| RF-Imp. | 1 | 1 | 0.008 | 0.008 | 0.029 | - | 0.052 | 1 | 1 | 1 |
| Mutual Inf. | 0.021 | 0.321 | 1 | 0.834 | 0.999 | 0.052 | - | 0.321 | 1 | 0.097 |
| RFE | 1 | 1 | 0.114 | 0.114 | 0.292 | 1 | 0.321 | - | 1 | 1 |
| RF | 0.552 | 1 | 1 | 1 | 1 | 1 | 1 | 1 | - | 1 |
| XGBoost | 1 | 1 | 0.064 | 0.064 | 0.040 | 1 | 0.097 | 1 | 1 | - |
| Dataset | IVWFR | RFECV | ANOVA | Pearson | Spearman | RF Imp. | Mutual Inf. | RFE | RF | XGBoost |
|---|---|---|---|---|---|---|---|---|---|---|
| 5Class Multicut | 8 | 7 | 7 | 7 | 7 | 7 | 7 | 7 | 126 | 126 |
| 10Class Multicut | 39 | 11 | 11 | 11 | 11 | 11 | 11 | 11 | 126 | 126 |
| Trig | 5 | 5 | 5 | 5 | 5 | 5 | 5 | 5 | 57 | 57 |
| Hypersphere 3D | 19 | 95 | 95 | 95 | 95 | 95 | 95 | 95 | 123 | 123 |
| 4D AND | 25 | 4 | 4 | 4 | 4 | 4 | 4 | 4 | 113 | 113 |
| Double Spiral | 152 | 227 | 227 | 227 | 227 | 227 | 227 | 227 | 303 | 303 |
| Cone | 26 | 25 | 25 | 25 | 25 | 25 | 25 | 25 | 123 | 123 |
| 5D XOR | 40 | 35 | 35 | 35 | 35 | 35 | 35 | 35 | 115 | 115 |
| y = x | 23 | 14 | 14 | 14 | 14 | 14 | 14 | 14 | 122 | 122 |
| Yinyang | 11 | 7 | 7 | 7 | 7 | 7 | 7 | 7 | 62 | 62 |
| Dataset | IVWFR | RFECV | ANOVA | Pearson | Spearman | RF Imp. | Mutual Inf. | RFE | RF | XGBoost |
|---|---|---|---|---|---|---|---|---|---|---|
| estimation_of_obesity | 5 | 2 | 2 | 2 | 2 | 2 | 2 | 2 | 16 | 16 |
| water_potability | 5 | 4 | 4 | 4 | 4 | 4 | 4 | 4 | 9 | 9 |
| iranian_churn | 13 | 11 | 11 | 11 | 11 | 11 | 11 | 11 | 13 | 13 |
| sonar | 30 | 47 | 47 | 47 | 47 | 47 | 47 | 47 | 60 | 60 |
| climate | 5 | 4 | 4 | 4 | 4 | 4 | 4 | 4 | 18 | 18 |
| IVWFR | RFECV | ANOVA | Pearson | Spearman | RF-Imp. | Mutual Inf. | RFE | RF | XGBoost | |
|---|---|---|---|---|---|---|---|---|---|---|
| IVWFR | 1.000 | 0.667 | 0.667 | 0.154 | 0.667 | 0.667 | 0.667 | 0.667 | 0.063 | 0.063 |
| RFECV | 0.667 | 1.000 | 0.750 | 0.167 | 0.750 | 0.750 | 0.750 | 1.000 | 0.056 | 0.056 |
| ANOVA | 0.667 | 0.750 | 1.000 | 0.167 | 0.750 | 0.750 | 0.750 | 0.750 | 0.056 | 0.056 |
| Pearson | 0.154 | 0.167 | 0.167 | 1.000 | 0.273 | 0.167 | 0.167 | 0.167 | 0.056 | 0.056 |
| Spearman | 0.667 | 0.750 | 0.750 | 0.273 | 1.000 | 0.750 | 0.750 | 0.750 | 0.056 | 0.056 |
| RF-Imp. | 0.667 | 0.750 | 0.750 | 0.167 | 0.750 | 1.000 | 0.750 | 0.750 | 0.056 | 0.056 |
| Mutual Inf. | 0.667 | 0.750 | 0.750 | 0.167 | 0.750 | 0.750 | 1.000 | 0.750 | 0.056 | 0.056 |
| RFE | 0.667 | 1.000 | 0.750 | 0.167 | 0.750 | 0.750 | 0.750 | 1.000 | 0.056 | 0.056 |
| RF | 0.063 | 0.056 | 0.056 | 0.056 | 0.056 | 0.056 | 0.056 | 0.056 | 1.000 | 1.000 |
| XGBoost | 0.063 | 0.056 | 0.056 | 0.056 | 0.056 | 0.056 | 0.056 | 0.056 | 1.000 | 1.000 |
| IVWFR | RFECV | ANOVA | Pearson | Spearman | RF-Imp. | Mutual Inf. | RFE | RF | XGBoost | |
|---|---|---|---|---|---|---|---|---|---|---|
| IVWFR | 1.000 | 0.282 | 0.250 | 0.250 | 0.250 | 0.250 | 0.220 | 0.282 | 0.310 | 0.310 |
| RFECV | 0.282 | 1.000 | 0.571 | 0.294 | 0.467 | 0.571 | 0.467 | 1.000 | 0.087 | 0.087 |
| ANOVA | 0.250 | 0.571 | 1.000 | 0.467 | 0.692 | 1.000 | 0.692 | 0.571 | 0.087 | 0.087 |
| Pearson | 0.250 | 0.294 | 0.467 | 1.000 | 0.692 | 0.467 | 0.467 | 0.294 | 0.087 | 0.087 |
| Spearman | 0.250 | 0.467 | 0.692 | 0.692 | 1.000 | 0.692 | 0.467 | 0.467 | 0.087 | 0.087 |
| RF-Imp. | 0.250 | 0.571 | 1.000 | 0.467 | 0.692 | 1.000 | 0.692 | 0.571 | 0.087 | 0.087 |
| Mutual Inf. | 0.220 | 0.467 | 0.692 | 0.467 | 0.467 | 0.692 | 1.000 | 0.467 | 0.087 | 0.087 |
| RFE | 0.282 | 1.000 | 0.571 | 0.294 | 0.467 | 0.571 | 0.467 | 1.000 | 0.087 | 0.087 |
| RF | 0.310 | 0.087 | 0.087 | 0.087 | 0.087 | 0.087 | 0.087 | 0.087 | 1.000 | 1.000 |
| XGBoost | 0.310 | 0.087 | 0.087 | 0.087 | 0.087 | 0.087 | 0.087 | 0.087 | 1.000 | 1.000 |
| IVWFR | RFECV | ANOVA | Pearson | Spearman | RF-Imp. | Mutual Inf. | RFE | RF | XGBoost | |
|---|---|---|---|---|---|---|---|---|---|---|
| IVWFR | 1.000 | 0.429 | 0.250 | 0.250 | 0.250 | 0.429 | 0.429 | 0.429 | 0.088 | 0.088 |
| RFECV | 0.429 | 1.000 | 0.429 | 0.429 | 0.429 | 0.667 | 0.667 | 1.000 | 0.088 | 0.088 |
| ANOVA | 0.250 | 0.429 | 1.000 | 1.000 | 1.000 | 0.429 | 0.429 | 0.429 | 0.088 | 0.088 |
| Pearson | 0.250 | 0.429 | 1.000 | 1.000 | 1.000 | 0.429 | 0.429 | 0.429 | 0.088 | 0.088 |
| Spearman | 0.250 | 0.429 | 1.000 | 1.000 | 1.000 | 0.429 | 0.429 | 0.429 | 0.088 | 0.088 |
| RF-Imp. | 0.429 | 0.667 | 0.429 | 0.429 | 0.429 | 1.000 | 0.429 | 0.667 | 0.088 | 0.088 |
| Mutual Inf. | 0.429 | 0.667 | 0.429 | 0.429 | 0.429 | 0.429 | 1.000 | 0.667 | 0.088 | 0.088 |
| RFE | 0.429 | 1.000 | 0.429 | 0.429 | 0.429 | 0.667 | 0.667 | 1.000 | 0.088 | 0.088 |
| RF | 0.088 | 0.088 | 0.088 | 0.088 | 0.088 | 0.088 | 0.088 | 0.088 | 1.000 | 1.000 |
| XGBoost | 0.088 | 0.088 | 0.088 | 0.088 | 0.088 | 0.088 | 0.088 | 0.088 | 1.000 | 1.000 |
| IVWFR | RFECV | ANOVA | Pearson | Spearman | RF-Imp. | Mutual Inf. | RFE | RF | XGBoost | |
|---|---|---|---|---|---|---|---|---|---|---|
| IVWFR | 1.000 | 0.188 | 0.118 | 0.118 | 0.200 | 0.200 | 0.188 | 0.188 | 0.154 | 0.154 |
| RFECV | 0.188 | 1.000 | 0.727 | 0.727 | 0.727 | 0.712 | 0.624 | 1.000 | 0.772 | 0.772 |
| ANOVA | 0.118 | 0.727 | 1.000 | 1.000 | 0.727 | 0.667 | 0.652 | 0.727 | 0.772 | 0.772 |
| Pearson | 0.118 | 0.727 | 1.000 | 1.000 | 0.727 | 0.667 | 0.652 | 0.727 | 0.772 | 0.772 |
| Spearman | 0.200 | 0.727 | 0.727 | 0.727 | 1.000 | 0.681 | 0.638 | 0.727 | 0.772 | 0.772 |
| RF-Imp. | 0.200 | 0.712 | 0.667 | 0.667 | 0.681 | 1.000 | 0.681 | 0.712 | 0.772 | 0.772 |
| Mutual Inf. | 0.188 | 0.624 | 0.652 | 0.652 | 0.638 | 0.681 | 1.000 | 0.624 | 0.772 | 0.772 |
| RFE | 0.188 | 1.000 | 0.727 | 0.727 | 0.727 | 0.712 | 0.624 | 1.000 | 0.772 | 0.772 |
| RF | 0.154 | 0.772 | 0.772 | 0.772 | 0.772 | 0.772 | 0.772 | 0.772 | 1.000 | 1.000 |
| XGBoost | 0.154 | 0.772 | 0.772 | 0.772 | 0.772 | 0.772 | 0.772 | 0.772 | 1.000 | 1.000 |
| IVWFR | RFECV | ANOVA | Pearson | Spearman | RF-Imp. | Mutual Inf. | RFE | RF | XGBoost | |
|---|---|---|---|---|---|---|---|---|---|---|
| IVWFR | 1.000 | 0.160 | 0.160 | 0.160 | 0.160 | 0.160 | 0.115 | 0.160 | 0.221 | 0.221 |
| RFECV | 0.160 | 1.000 | 0.333 | 0.143 | 0.333 | 0.143 | 0.143 | 1.000 | 0.035 | 0.035 |
| ANOVA | 0.160 | 0.333 | 1.000 | 0.143 | 0.333 | 0.333 | 0.143 | 0.333 | 0.035 | 0.035 |
| Pearson | 0.160 | 0.143 | 0.143 | 1.000 | 0.600 | 0.000 | 0.143 | 0.143 | 0.035 | 0.035 |
| Spearman | 0.160 | 0.333 | 0.333 | 0.600 | 1.000 | 0.000 | 0.143 | 0.333 | 0.035 | 0.035 |
| RF-Imp. | 0.160 | 0.143 | 0.333 | 0.000 | 0.000 | 1.000 | 0.000 | 0.143 | 0.035 | 0.035 |
| Mutual Inf. | 0.115 | 0.143 | 0.143 | 0.143 | 0.143 | 0.000 | 1.000 | 0.143 | 0.035 | 0.035 |
| RFE | 0.160 | 1.000 | 0.333 | 0.143 | 0.333 | 0.143 | 0.143 | 1.000 | 0.035 | 0.035 |
| RF | 0.221 | 0.035 | 0.035 | 0.035 | 0.035 | 0.035 | 0.035 | 0.035 | 1.000 | 1.000 |
| XGBoost | 0.221 | 0.035 | 0.035 | 0.035 | 0.035 | 0.035 | 0.035 | 0.035 | 1.000 | 1.000 |
| IVWFR | RFECV | ANOVA | Pearson | Spearman | RF-Imp. | Mutual Inf. | RFE | RF | XGBoost | |
|---|---|---|---|---|---|---|---|---|---|---|
| IVWFR | 1.000 | 0.592 | 0.522 | 0.522 | 0.566 | 0.560 | 0.486 | 0.592 | 0.502 | 0.502 |
| RFECV | 0.592 | 1.000 | 0.739 | 0.739 | 0.733 | 0.733 | 0.645 | 1.000 | 0.749 | 0.749 |
| ANOVA | 0.522 | 0.739 | 1.000 | 1.000 | 0.823 | 0.694 | 0.621 | 0.739 | 0.749 | 0.749 |
| Pearson | 0.522 | 0.739 | 1.000 | 1.000 | 0.823 | 0.694 | 0.621 | 0.739 | 0.749 | 0.749 |
| Spearman | 0.566 | 0.733 | 0.823 | 0.823 | 1.000 | 0.700 | 0.610 | 0.733 | 0.749 | 0.749 |
| RF-Imp. | 0.560 | 0.733 | 0.694 | 0.694 | 0.700 | 1.000 | 0.633 | 0.733 | 0.749 | 0.749 |
| Mutual Inf. | 0.486 | 0.645 | 0.621 | 0.621 | 0.610 | 0.633 | 1.000 | 0.645 | 0.749 | 0.749 |
| RFE | 0.592 | 1.000 | 0.739 | 0.739 | 0.733 | 0.733 | 0.645 | 1.000 | 0.749 | 0.749 |
| RF | 0.502 | 0.749 | 0.749 | 0.749 | 0.749 | 0.749 | 0.749 | 0.749 | 1.000 | 1.000 |
| XGBoost | 0.502 | 0.749 | 0.749 | 0.749 | 0.749 | 0.749 | 0.749 | 0.749 | 1.000 | 1.000 |
| IVWFR | RFECV | ANOVA | Pearson | Spearman | RF-Imp. | Mutual Inf. | RFE | RF | XGBoost | |
|---|---|---|---|---|---|---|---|---|---|---|
| IVWFR | 1.000 | 0.821 | 0.342 | 0.342 | 0.378 | 0.821 | 0.545 | 0.821 | 0.211 | 0.211 |
| RFECV | 0.821 | 1.000 | 0.389 | 0.389 | 0.389 | 0.923 | 0.613 | 1.000 | 0.203 | 0.203 |
| ANOVA | 0.342 | 0.389 | 1.000 | 1.000 | 0.613 | 0.351 | 0.351 | 0.389 | 0.203 | 0.203 |
| Pearson | 0.342 | 0.389 | 1.000 | 1.000 | 0.613 | 0.351 | 0.351 | 0.389 | 0.203 | 0.203 |
| Spearman | 0.378 | 0.389 | 0.613 | 0.613 | 1.000 | 0.351 | 0.220 | 0.389 | 0.203 | 0.203 |
| RF-Imp. | 0.821 | 0.923 | 0.351 | 0.351 | 0.351 | 1.000 | 0.613 | 0.923 | 0.203 | 0.203 |
| Mutual Inf. | 0.545 | 0.613 | 0.351 | 0.351 | 0.220 | 0.613 | 1.000 | 0.613 | 0.203 | 0.203 |
| RFE | 0.821 | 1.000 | 0.389 | 0.389 | 0.389 | 0.923 | 0.613 | 1.000 | 0.203 | 0.203 |
| RF | 0.211 | 0.203 | 0.203 | 0.203 | 0.203 | 0.203 | 0.203 | 0.203 | 1.000 | 1.000 |
| XGBoost | 0.211 | 0.203 | 0.203 | 0.203 | 0.203 | 0.203 | 0.203 | 0.203 | 1.000 | 1.000 |
| IVWFR | RFECV | ANOVA | Pearson | Spearman | RF-Imp. | Mutual Inf. | RFE | RF | XGBoost | |
|---|---|---|---|---|---|---|---|---|---|---|
| IVWFR | 1.000 | 0.442 | 0.630 | 0.630 | 0.630 | 0.442 | 0.172 | 0.442 | 0.348 | 0.348 |
| RFECV | 0.442 | 1.000 | 0.556 | 0.556 | 0.556 | 0.321 | 0.167 | 1.000 | 0.304 | 0.304 |
| ANOVA | 0.630 | 0.556 | 1.000 | 1.000 | 1.000 | 0.429 | 0.186 | 0.556 | 0.304 | 0.304 |
| Pearson | 0.630 | 0.556 | 1.000 | 1.000 | 1.000 | 0.429 | 0.186 | 0.556 | 0.304 | 0.304 |
| Spearman | 0.630 | 0.556 | 1.000 | 1.000 | 1.000 | 0.429 | 0.186 | 0.556 | 0.304 | 0.304 |
| RF-Imp. | 0.442 | 0.321 | 0.429 | 0.429 | 0.429 | 1.000 | 0.167 | 0.321 | 0.304 | 0.304 |
| Mutual Inf. | 0.172 | 0.167 | 0.186 | 0.186 | 0.186 | 0.167 | 1.000 | 0.167 | 0.304 | 0.304 |
| RFE | 0.442 | 1.000 | 0.556 | 0.556 | 0.556 | 0.321 | 0.167 | 1.000 | 0.304 | 0.304 |
| RF | 0.348 | 0.304 | 0.304 | 0.304 | 0.304 | 0.304 | 0.304 | 0.304 | 1.000 | 1.000 |
| XGBoost | 0.348 | 0.304 | 0.304 | 0.304 | 0.304 | 0.304 | 0.304 | 0.304 | 1.000 | 1.000 |
| IVWFR | RFECV | ANOVA | Pearson | Spearman | RF-Imp. | Mutual Inf. | RFE | RF | XGBoost | |
|---|---|---|---|---|---|---|---|---|---|---|
| IVWFR | 1.000 | 0.609 | 0.609 | 0.609 | 0.609 | 0.609 | 0.480 | 0.609 | 0.189 | 0.189 |
| RFECV | 0.609 | 1.000 | 0.647 | 0.750 | 0.647 | 0.647 | 0.647 | 1.000 | 0.115 | 0.115 |
| ANOVA | 0.609 | 0.647 | 1.000 | 0.750 | 0.867 | 0.750 | 0.750 | 0.647 | 0.115 | 0.115 |
| Pearson | 0.609 | 0.750 | 0.750 | 1.000 | 0.867 | 0.750 | 0.750 | 0.750 | 0.115 | 0.115 |
| Spearman | 0.609 | 0.647 | 0.867 | 0.867 | 1.000 | 0.750 | 0.750 | 0.647 | 0.115 | 0.115 |
| RF-Imp. | 0.609 | 0.647 | 0.750 | 0.750 | 0.750 | 1.000 | 0.750 | 0.647 | 0.115 | 0.115 |
| Mutual Inf. | 0.480 | 0.647 | 0.750 | 0.750 | 0.750 | 0.750 | 1.000 | 0.647 | 0.115 | 0.115 |
| RFE | 0.609 | 1.000 | 0.647 | 0.750 | 0.647 | 0.647 | 0.647 | 1.000 | 0.115 | 0.115 |
| RF | 0.189 | 0.115 | 0.115 | 0.115 | 0.115 | 0.115 | 0.115 | 0.115 | 1.000 | 1.000 |
| XGBoost | 0.189 | 0.115 | 0.115 | 0.115 | 0.115 | 0.115 | 0.115 | 0.115 | 1.000 | 1.000 |
| IVWFR | RFECV | ANOVA | Pearson | Spearman | RF-Imp. | Mutual Inf. | RFE | RF | XGBoost | |
|---|---|---|---|---|---|---|---|---|---|---|
| IVWFR | 1.000 | 0.500 | 0.500 | 0.500 | 0.500 | 0.500 | 0.500 | 0.500 | 0.177 | 0.177 |
| RFECV | 0.500 | 1.000 | 0.556 | 0.556 | 0.400 | 0.556 | 0.750 | 1.000 | 0.113 | 0.113 |
| ANOVA | 0.500 | 0.556 | 1.000 | 0.750 | 0.750 | 0.750 | 0.556 | 0.556 | 0.113 | 0.113 |
| Pearson | 0.500 | 0.556 | 0.750 | 1.000 | 0.750 | 1.000 | 0.750 | 0.556 | 0.113 | 0.113 |
| Spearman | 0.500 | 0.400 | 0.750 | 0.750 | 1.000 | 0.750 | 0.556 | 0.400 | 0.113 | 0.113 |
| RF-Imp. | 0.500 | 0.556 | 0.750 | 1.000 | 0.750 | 1.000 | 0.750 | 0.556 | 0.113 | 0.113 |
| Mutual Inf. | 0.500 | 0.750 | 0.556 | 0.750 | 0.556 | 0.750 | 1.000 | 0.750 | 0.113 | 0.113 |
| RFE | 0.500 | 1.000 | 0.556 | 0.556 | 0.400 | 0.556 | 0.750 | 1.000 | 0.113 | 0.113 |
| RF | 0.177 | 0.113 | 0.113 | 0.113 | 0.113 | 0.113 | 0.113 | 0.113 | 1.000 | 1.000 |
| XGBoost | 0.177 | 0.113 | 0.113 | 0.113 | 0.113 | 0.113 | 0.113 | 0.113 | 1.000 | 1.000 |
| IVWFR | RFECV | ANOVA | Pearson | Spearman | RF-Imp. | Mutual Inf. | RFE | RF | XGBoost | |
|---|---|---|---|---|---|---|---|---|---|---|
| IVWFR | 1.000 | 0.800 | 0.800 | 0.800 | 0.800 | 0.800 | 0.800 | 0.800 | 0.278 | 0.278 |
| RFECV | 0.800 | 1.000 | 1.000 | 1.000 | 1.000 | 1.000 | 0.600 | 1.000 | 0.222 | 0.222 |
| ANOVA | 0.800 | 1.000 | 1.000 | 1.000 | 1.000 | 1.000 | 0.600 | 1.000 | 0.222 | 0.222 |
| Pearson | 0.800 | 1.000 | 1.000 | 1.000 | 1.000 | 1.000 | 0.600 | 1.000 | 0.222 | 0.222 |
| Spearman | 0.800 | 1.000 | 1.000 | 1.000 | 1.000 | 1.000 | 0.600 | 1.000 | 0.222 | 0.222 |
| RF-Imp. | 0.800 | 1.000 | 1.000 | 1.000 | 1.000 | 1.000 | 0.600 | 1.000 | 0.222 | 0.222 |
| Mutual Inf. | 0.800 | 0.600 | 0.600 | 0.600 | 0.600 | 0.600 | 1.000 | 0.600 | 0.222 | 0.222 |
| RFE | 0.800 | 1.000 | 1.000 | 1.000 | 1.000 | 1.000 | 0.600 | 1.000 | 0.222 | 0.222 |
| RF | 0.278 | 0.222 | 0.222 | 0.222 | 0.222 | 0.222 | 0.222 | 0.222 | 1.000 | 1.000 |
| XGBoost | 0.278 | 0.222 | 0.222 | 0.222 | 0.222 | 0.222 | 0.222 | 0.222 | 1.000 | 1.000 |
| IVWFR | RFECV | ANOVA | Pearson | Spearman | RF-Imp. | Mutual Inf. | RFE | RF | XGBoost | |
|---|---|---|---|---|---|---|---|---|---|---|
| IVWFR | 1.000 | 0.846 | 0.846 | 0.846 | 0.846 | 0.846 | 0.846 | 0.846 | 1.000 | 1.000 |
| RFECV | 0.846 | 1.000 | 0.692 | 0.692 | 0.692 | 1.000 | 0.833 | 1.000 | 0.846 | 0.846 |
| ANOVA | 0.846 | 0.692 | 1.000 | 1.000 | 0.833 | 0.692 | 0.833 | 0.692 | 0.846 | 0.846 |
| Pearson | 0.846 | 0.692 | 1.000 | 1.000 | 0.833 | 0.692 | 0.833 | 0.692 | 0.846 | 0.846 |
| Spearman | 0.846 | 0.692 | 0.833 | 0.833 | 1.000 | 0.692 | 0.692 | 0.692 | 0.846 | 0.846 |
| RF-Imp. | 0.846 | 1.000 | 0.692 | 0.692 | 0.692 | 1.000 | 0.833 | 1.000 | 0.846 | 0.846 |
| Mutual Inf. | 0.846 | 0.833 | 0.833 | 0.833 | 0.692 | 0.833 | 1.000 | 0.833 | 0.846 | 0.846 |
| RFE | 0.846 | 1.000 | 0.692 | 0.692 | 0.692 | 1.000 | 0.833 | 1.000 | 0.846 | 0.846 |
| RF | 1.000 | 0.846 | 0.846 | 0.846 | 0.846 | 0.846 | 0.846 | 0.846 | 1.000 | 1.000 |
| XGBoost | 1.000 | 0.846 | 0.846 | 0.846 | 0.846 | 0.846 | 0.846 | 0.846 | 1.000 | 1.000 |
| IVWFR | RFECV | ANOVA | Pearson | Spearman | RF-Imp. | Mutual Inf. | RFE | RF | XGBoost | |
|---|---|---|---|---|---|---|---|---|---|---|
| IVWFR | 1.000 | 0.638 | 0.510 | 0.510 | 0.540 | 0.638 | 0.426 | 0.638 | 0.500 | 0.500 |
| RFECV | 0.638 | 1.000 | 0.741 | 0.741 | 0.741 | 0.774 | 0.621 | 1.000 | 0.783 | 0.783 |
| ANOVA | 0.510 | 0.741 | 1.000 | 1.000 | 0.918 | 0.709 | 0.679 | 0.741 | 0.783 | 0.783 |
| Pearson | 0.510 | 0.741 | 1.000 | 1.000 | 0.918 | 0.709 | 0.679 | 0.741 | 0.783 | 0.783 |
| Spearman | 0.540 | 0.741 | 0.918 | 0.918 | 1.000 | 0.741 | 0.649 | 0.741 | 0.783 | 0.783 |
| RF-Imp. | 0.638 | 0.774 | 0.709 | 0.709 | 0.741 | 1.000 | 0.649 | 0.774 | 0.783 | 0.783 |
| Mutual Inf. | 0.426 | 0.621 | 0.679 | 0.679 | 0.649 | 0.649 | 1.000 | 0.621 | 0.783 | 0.783 |
| RFE | 0.638 | 1.000 | 0.741 | 0.741 | 0.741 | 0.774 | 0.621 | 1.000 | 0.783 | 0.783 |
| RF | 0.500 | 0.783 | 0.783 | 0.783 | 0.783 | 0.783 | 0.783 | 0.783 | 1.000 | 1.000 |
| XGBoost | 0.500 | 0.783 | 0.783 | 0.783 | 0.783 | 0.783 | 0.783 | 0.783 | 1.000 | 1.000 |
| IVWFR | RFECV | ANOVA | Pearson | Spearman | RF-Imp. | Mutual Inf. | RFE | RF | XGBoost | |
|---|---|---|---|---|---|---|---|---|---|---|
| IVWFR | 1.000 | 0.800 | 0.500 | 0.500 | 0.500 | 0.800 | 0.500 | 0.800 | 0.556 | 0.556 |
| RFECV | 0.800 | 1.000 | 0.333 | 0.333 | 0.333 | 1.000 | 0.600 | 1.000 | 0.444 | 0.444 |
| ANOVA | 0.500 | 0.333 | 1.000 | 1.000 | 1.000 | 0.333 | 0.143 | 0.333 | 0.444 | 0.444 |
| Pearson | 0.500 | 0.333 | 1.000 | 1.000 | 1.000 | 0.333 | 0.143 | 0.333 | 0.444 | 0.444 |
| Spearman | 0.500 | 0.333 | 1.000 | 1.000 | 1.000 | 0.333 | 0.143 | 0.333 | 0.444 | 0.444 |
| RF-Imp. | 0.800 | 1.000 | 0.333 | 0.333 | 0.333 | 1.000 | 0.600 | 1.000 | 0.444 | 0.444 |
| Mutual Inf. | 0.500 | 0.600 | 0.143 | 0.143 | 0.143 | 0.600 | 1.000 | 0.600 | 0.444 | 0.444 |
| RFE | 0.800 | 1.000 | 0.333 | 0.333 | 0.333 | 1.000 | 0.600 | 1.000 | 0.444 | 0.444 |
| RF | 0.556 | 0.444 | 0.444 | 0.444 | 0.444 | 0.444 | 0.444 | 0.444 | 1.000 | 1.000 |
| XGBoost | 0.556 | 0.444 | 0.444 | 0.444 | 0.444 | 0.444 | 0.444 | 0.444 | 1.000 | 1.000 |
| IVWFR | RFECV | ANOVA | Pearson | Spearman | RF-Imp. | Mutual Inf. | RFE | RF | XGBoost | |
|---|---|---|---|---|---|---|---|---|---|---|
| IVWFR | 1.000 | 0.400 | 0.167 | 0.167 | 0.167 | 0.400 | 0.400 | 0.400 | 0.312 | 0.312 |
| RFECV | 0.400 | 1.000 | 0.333 | 0.333 | 0.333 | 1.000 | 0.333 | 1.000 | 0.125 | 0.125 |
| ANOVA | 0.167 | 0.333 | 1.000 | 0.333 | 0.333 | 0.333 | 0.333 | 0.333 | 0.125 | 0.125 |
| Pearson | 0.167 | 0.333 | 0.333 | 1.000 | 1.000 | 0.333 | 0.333 | 0.333 | 0.125 | 0.125 |
| Spearman | 0.167 | 0.333 | 0.333 | 1.000 | 1.000 | 0.333 | 0.333 | 0.333 | 0.125 | 0.125 |
| RF-Imp. | 0.400 | 1.000 | 0.333 | 0.333 | 0.333 | 1.000 | 0.333 | 1.000 | 0.125 | 0.125 |
| Mutual Inf. | 0.400 | 0.333 | 0.333 | 0.333 | 0.333 | 0.333 | 1.000 | 0.333 | 0.125 | 0.125 |
| RFE | 0.400 | 1.000 | 0.333 | 0.333 | 0.333 | 1.000 | 0.333 | 1.000 | 0.125 | 0.125 |
| RF | 0.312 | 0.125 | 0.125 | 0.125 | 0.125 | 0.125 | 0.125 | 0.125 | 1.000 | 1.000 |
| XGBoost | 0.312 | 0.125 | 0.125 | 0.125 | 0.125 | 0.125 | 0.125 | 0.125 | 1.000 | 1.000 |
Disclaimer/Publisher’s Note: The statements, opinions and data contained in all publications are solely those of the individual author(s) and contributor(s) and not of MDPI and/or the editor(s). MDPI and/or the editor(s) disclaim responsibility for any injury to people or property resulting from any ideas, methods, instructions or products referred to in the content. |
© 2025 by the authors. Licensee MDPI, Basel, Switzerland. This article is an open access article distributed under the terms and conditions of the Creative Commons Attribution (CC BY) license (https://creativecommons.org/licenses/by/4.0/).
Share and Cite
Wojtowicz, A.; Paja, W.; Bentkowska, U. Feature Importance Ranking Using Interval-Valued Methods and Aggregation Functions for Machine Learning Applications. Appl. Sci. 2025, 15, 12130. https://doi.org/10.3390/app152212130
Wojtowicz A, Paja W, Bentkowska U. Feature Importance Ranking Using Interval-Valued Methods and Aggregation Functions for Machine Learning Applications. Applied Sciences. 2025; 15(22):12130. https://doi.org/10.3390/app152212130
Chicago/Turabian StyleWojtowicz, Aleksander, Wiesław Paja, and Urszula Bentkowska. 2025. "Feature Importance Ranking Using Interval-Valued Methods and Aggregation Functions for Machine Learning Applications" Applied Sciences 15, no. 22: 12130. https://doi.org/10.3390/app152212130
APA StyleWojtowicz, A., Paja, W., & Bentkowska, U. (2025). Feature Importance Ranking Using Interval-Valued Methods and Aggregation Functions for Machine Learning Applications. Applied Sciences, 15(22), 12130. https://doi.org/10.3390/app152212130


