Abstract
The aim was to optimize a series of aluminosilicate glasses for the synthesis of leucite glass-ceramics (GC) for dental applications. Appen predictive models were used to design a series of aluminosilicate glasses to control optical, thermal and mechanical properties. Glasses were produced using melt quenching methods, annealed and processed into powders and further heat-treated and milled to produce GC powders. Glasses/GCs were characterized using dilatometry, HTXRD, SEM and 27Al MAS-NMR and GCs tested using biaxial flexural strength (BFS) for comparison to commercial leucite GC products. The results indicated good prediction to experimental measurement correlations (for coefficient of thermal expansion, refractive index and density) and provided evidence of leucite GCs’ optimization compared to commercial products. This included significant BFS and Weibull m increases, improved microstructural control and designed translucency, meeting the demands for strong, esthetic and durable single-tooth restorations. The simple predictive approach, combined with complementary characterization techniques, allowed structure–property relations of aluminosilicate glasses/glass-ceramics to be understood, and may find similar applications in other glass systems beyond dentistry.
Keywords:
glass design; flexural strength; glass-ceramic; microstructure; MAS-NMR; X-ray diffraction 1. Introduction
Glass properties are generally divided into two principal categories: those determined by structure and those dependent on composition [1]. Predictive models offer a practical route to identify glasses with targeted properties [2]. According to the Functional Glass Manufacturing Innovation Consortium (FGMIC) roadmap, glasses with structures that are engineered or compositionally tailored are termed “functional”. Performance and technology enhancement are the main goals for innovation in functional glass manufacturing, so new compositions with improved process control and tailored properties are developed [3].
Since the pioneering work of Winkelmann and Schott [4], a series of additive methods has been devised [5,6,7,8] that relate oxide glass composition to a property α, where
where αᵢ is a numerical constant characteristic of each oxide constituent and Pᵢ is the weight or mole fraction of the oxide added. This method is built on the thermodynamic concept of a glass as a solution of components, each contributing to the property of interest in proportion to its molar fraction. The function of composition and the property of interest are not always linearly related, requiring corrections for multi-component systems [2,9,10]. Relatively accurate predictions can, however, be achieved [9] for coefficient of thermal expansion (CTE) and refractive index (R.I.) using this method. Modifications have extended the use of this method for R.I. in bioactive glass formulations [11]. Various predictive models have also been suggested for glass development applications in engineering and optical fields [12,13].
After designing new materials, it is also important to understand their structure–property relationships. Solid-state magic angle spinning nuclear magnetic resonance (MAS-NMR) is essential in the characterization and understanding of changes in glass/glass-ceramic structure during experimentation [14]. When used in conjunction with high-temperature X-ray diffraction (HTXRD) techniques, useful insights are provided to make further glass design changes. The effects of various oxide substitutions on the aluminosilicate glass network and their subsequent crystallization can then be carefully mapped and understood. Aluminosilicate glasses with a broad range oxide content are versatile for tailored designing of a wide range of engineering applications [15]. In dentistry, aluminosilicate glasses are used to produce leucite glass-ceramics (GC) for various dental prosthesis applications (e.g., monolithic crowns, veneering of metal alloys or polycrystalline substrates for crowns and bridges) [16,17,18]. For these applications, specific tailored glass properties are required to achieve glass-ceramics with high strength, translucency and low solubility. The study aims to apply a predictive model to optimize a series of aluminosilicate glasses/glass-ceramics, together with advanced characterization techniques to understand and control their structure–property relations.
2. Materials and Methods
2.1. Glass Design
Glass compositions (Table 1) were formulated using Appen factors (Appendix A, Table A1) to estimate the CTE and R.I. Network connectivity and density were also calculated for each composition. The predicted properties were determined using the Appen additive approach [7] as expressed in Equation (1), where αi is the characteristic Appen factor of the i-th oxide and Pi is its mole fraction in the glass. Contributions of each oxide to the fusion temperature were calculated to estimate processing conditions [4]. Aluminosilicate glasses were designed by adjusting compositions around the stoichiometry of leucite. A range of glass CTE was designed to promote tangential compression of the leucite phase in the GC to enhance flexural strength. The R.I. was designed to match the R.I. of leucite (1.5, [19]) encouraging translucent GCs. The fusion temperature was estimated to allow GC processing in commercial dental furnaces (<1200 °C) used to produce dental restorations.

Table 1.
Aluminosilicate glass compositions (mole %).
2.2. Glass Synthesis and Processing
Glass batch A (Table 1) was heated inside an electric kiln (Fredrickson Kiln Co., New York, NY, USA) at 10 °C/min to 1316 °C with a 7 h hold and the furnace cooled. The glass frit was crushed, wet ground and screened to 125 μm [17]. Glass batches B and C (Table 1) were heated in a Pt/Rh (90/10) crucible, inside an electric furnace (UAF1600 furnace, Lenton, Hope Valley, UK) at a rate of 10 °C/min to 1550 °C and held for 5 h. The crucible with the molten glass was then transferred to a preheated furnace (Tris Burnout furnace, Dentalfarm, Turin, Italy) and annealed at 500 °C for 2 h, followed by furnace cooling. Glass C was re-homogenized after crushing and ball milling for 2 h (Pascal Engineering Ltd., London, UK) using alumina grinding media. The powder was remelted for 2 h at 1550 °C in a UAF1600 furnace (Lenton, UK), followed by air quenching (1 min). The glass was then annealed again (as before). The glass frits were crushed, ball milled (2 h) and sieved (Endecotts Ltd., London, UK) to obtain a particle size of ≤125 μm.
2.3. High-Temperature X-Ray Diffraction
Experimental glass powders (A, B, C) were screened to 38 µm, and high-temperature X-ray diffraction (HTXRD) was carried out. Powders were placed on a platinum strip within a high-temperature furnace (Anton Parr HTK 16, Anton Parr, Graz, Austria), equipped with precise temperature control (Anton Parr TCU 2000) and fitted to an X-ray diffractometer (X’Pert Pro, Panalytical, Almelo, The Netherlands). Measurements were performed using flat plate θ/2θ geometry, together with Ni-filtered Cu-Kα radiation (λ1 = 1.540598 Å, λ2 = 1.544426 Å). An initial X-ray diffraction (XRD) pattern was recorded at 25 °C, followed by data collection from 500 °C to 1100 °C in 20 °C increments. For each temperature, a short scan of 15 min was conducted over a 2θ range of 10° to 80°, with a step size of 0.0167° and a step time of 26.67 s. A 5 min hold was applied at each temperature to allow stabilization and equilibration of the domain structure before data acquisition. A National Institute of Standards (NIST) standard reference material (SRM, 660a, LaB6, lanthanum hexaboride) was used for system calibration. The structural models (International Centre for Diffraction PDF-4 database) of tetragonal leucite (ICDD: 00-038-1423), cubic leucite (ICDD: 01-076-2298) and sanidine (ICDD: 00-025-0618) were used for phase identification.
2.4. Glass-Ceramic Powder Production
Portions of the screened (to 125 μm) glass powders (A, B, C) were weighed (50.0 g), placed on custom-made refractory trays and crystallized using two-step heat treatment parameters listed in Table 2, followed by furnace withdrawal and air-quenching. Glass-ceramic frits (A, B and C) were then crushed, ball milled and screened to 125 µm.
Table 2.
Two-step crystallization heat treatments of the glasses.
2.5. Solid State MAS-NMR
Experimental glasses and glass-ceramic powders (A, B, C), along with commercial glass-ceramic powders; IPS Empress Esthetic (shade ETC2, Ivoclar-Vivadent, Schaan, Liechtenstein) and Ceramco 3 Dentine (Batch No. 02111576, Dentsply Ceramco, Burlington Township, NJ, USA) were characterized using solid-state 27Al Magic Angle Spinning Nuclear Magnetic Resonance (MAS-NMR). The experiments were performed on Bruker Avance III HD 800 MHz and Avance NEO 600 MHz NMR spectrometers (Bruker, Ettlingen, Germany), corresponding to magnetic fields of 18.8 T and 14.1 T. A short pulse length (0.5 µs) and a recycle delay of 0.5 s were employed for the 27Al MAS-NMR measurements. The powder samples were packed into zirconia rotors (2.5 mm outer diameter) and spun at 24 kHz during measurements at a resonance frequency of 208.5 MHz. For 27Al triple quantum (3Q) MAS experiment, a three-pulse program with split-t1 full echo acquisition was used. A 4.5 µs pulse was used for the 3Q excitation, followed by a conversion pulse of 1.2 µs and 38 µs of a 180 degree selective pulse. In total, 69 t1 experiments were acquired with rotor synchronized increments, with 2400 scans and 1 µs recycle delay within each and 48 dummy scans. In addition, commercial GC powder samples were run versus an experimental GC at resonance frequency of 156.4 MHz under MAS condition of 12 kHz using 4 mm zirconia rotors. All 27Al MAS-NMR spectra were referenced using a 1 M solution of Al(NO3)3.
2.6. Differential Thermal Expansion Analysis
The CTE of cut glass-frit blocks and sintered GC specimens (6 mm depth × 6 mm height × 25 mm length, n = 1) for all experimental glasses and GCs were measured using a differential dilatometer (DIL 402PC, Netzsch Instruments, Selb, Germany). The temperature range was between 25 °C and 1200 °C, at a heating rate of 3 °C/min. A dedicated, standard alumina rod specimen was run before each measurement for device calibration. The subsequent data correction was carried out using Netzsch Proteous thermal analyses software (ver. 4.8.2, 2006, Netzsch Instruments, Selb, Germany). The alumina rod was run in a nitrogen gas atmosphere and using identical temperature range/heating rate parameters as the test specimens. CTE calculations took place between 100 and 400 °C as the plots were linear at that range for all specimens tested. The agreement between the predicted and measured CTE values for all experimental glasses (A–C), was evaluated using a chi-square goodness-of-fit test and the root mean squared error (RMSE).
2.7. Glass Density and Refractive Index Measurement
The density of the glass-frit specimens was determined for all experimental glasses based on Archimedes’ principle, using an analytical balance (Mettler AE 200, Mettler Instruments Ltd., Leicester, UK) equipped with a density determination kit (Mettler ME-33360, Mettler Instruments Ltd., Leicester, UK). The reference liquid was distilled water. The mass of each glass-frit specimen (n = 10 per test group) was measured in air and then in distilled water, with a precision of 0.1 mg. Following the procedure specified by the manufacturer, the specimen density () was calculated using the following relation:
where A is the specimen weight in air, B is its apparent weight (buoyant force) when immersed in distilled water and is the density of distilled water at the measurement temperature.
The Becke line method was used to measure the refractive index (R.I.) of the experimental glasses (n = 3 per test group). Glass powders were placed between glass slides after adding a series of refractive index oils and viewed using a light microscope (Olympus Bx60, Olympus Optical Co., Southend-on-Sea, UK). The R.I. was found when the particular refractive index oil was matched with the glass grains and the Becke line was not visible.
2.8. Glass-Ceramic Specimen Preparation
Experimental GC (A, B, C) powders (125 μm) were used to fabricate 30 disk specimens per test group. Specimens were fabricated by moistening 1.1 g of powder with 0.4 mL of modeling liquid (CH B:24066, Vita Zahnfabrik, Bad Sackingen, Germany), followed by tissue condensation and hydraulic GC slurry pressing (3 × 10⁵ Pa, 1 min). The experimental disk specimens were transferred to a pre-heated (538 °C) porcelain furnace (Multimatt MCII, Dentsply, Konstanz, Germany) and sintered under vacuum at a rate of 38 °C/min to 1040 °C with 2 min hold for GC A, to 1180 °C with 2 min hold for GC-B and to 1100 °C with 2 min hold for GC C. A 3 min cooling cycle was applied at the end of the firings. All Specimens were wet ground to P1000 grade SiC paper. GC-A specimens were prepared in a previous study [17].
2.9. Biaxial Flexural Strength Testing
Thirty disk specimens (14 mm diameter and 2 mm depth) per experimental GC group were tested using the biaxial flexural strength test (ball on ring). GC-A was identically tested in a previous study [17]. Specimens were centrally loaded on a 10 mm diameter knife-edge support via a 4 mm diameter spherical ball indenter. A thin plastic sheet (0.03 mm) was positioned between the specimen surface and the indenter to evenly distribute the load. The load was delivered by an Instron universal testing machine (5567/H1580, Instron, Buckinghamshire, UK) at a crosshead speed of 1 mm/min. The biaxial flexural strength was calculated using the Timoshenko and Woinowsky–Krieger Equation [20], and a Poisson’s ratio of 0.25. Strength data were compared using a one-way ANOVA (SigmaStat, version 2.03, SPSS Inc., Chicago, IL, USA) and Tukey’s multiple comparison test (p < 0.05). The strength data were plotted using Weibull regression analysis with accuracy of fit assessed using a 90% critical correlation coefficient [21]. Statistical differences between Weibull modulus and characteristic strength for each test group were compared by the overlap of double-sided 95% confidence intervals.
2.10. Secondary Electron Imaging
Fractured GC BFS specimens and GC specimens after crystallization heat treatments were polished and etched (0.1% hydrofluoric acid, 60 s) and gold-coated (Agar Auto Sputter Coater, Agar scientific Ltd., Stansted, UK) and viewed using secondary electron imaging (10 kV accelerating voltage, 10 mm working distance), with a field emission scanning electron microscope (SEM) (FEI Inspect F, Oxford Instruments, Oxfordshire, UK). SEM Photomicrographs used for quantitative crystal size analysis were scanned using a pen tablet (CTL-460, Wacom Co., Ltd., Beijing, China) in combination with image analysis software (Sigma Scan Pro 5.0, Systat Software, Inc., Chicago, IL, USA). The leucite crystal size and area fraction were measured by manually drawing around each leucite crystal. Care was taken to ensure that the photomicrographs selected for measurements were representative of the overall crystalline distribution in each GC specimen explored.
3. Results
3.1. Appen-Predicted and Measured Values
Appen-predicted and measured CTE, Density and R.I. values for the selected experimental glasses can be seen in Table 3. Predicted glass network connectivity values are also presented (Table 3). Predicted and measured experimental glass CTE values were correlated (r2 = 0.95, Appendix A, Figure A1). A root mean squared error of 0.19 × 10⁻⁶/K was calculated. The χ2 test indicated no significant difference between measured and predicted CTE values (p < 0.05), since the critical χ2 value was larger than the calculated at the 95% significance level (Degrees of freedom: 2).
Table 3.
Predicted and measured property values for the experimental glasses.
In summary, the Appen-predicted properties showed a good agreement to the experimentally measured values.
3.2. Dilatometry Results
The CTE values for the experimental glasses are summarized in Table 3. The corresponding CTE plots are in Appendix A (Figure A2). The measured CTE (10−6 K−1, 100–400 °C) for the experimental glass-ceramics were 18.6 for GC B and 21.0 for GC C. The CTE of GC A was previously reported as 19.0 × 10⁻⁶ K−1 [17].
3.3. BFS Results
The Mean BFS (SD) and Weibull regression analysis results for the sintered GCs are shown in Table 4. There was a significant difference in Mean BFS between all the test groups (p < 0.05). All the GC test groups had higher Mean BFS (p < 0.05) than a previously tested commercial GC, Ceramco 3 (Mean (SD) BFS: 75.7 (6.8) MPa) [22]). There was a significant difference in characteristic strength between all the test groups according to the overlap of their double-sided confidence intervals. GC-B had significantly (p < 0.05) higher Weibull modulus than GC-A and GC-C.
Table 4.
BFS Results for the Glass-Ceramics.
In summary, there was an increased Mean BFS for all the designed novel leucite GCs compared to a commercial leucite GC.
3.4. HTXRD Results
The HTXRD plots for glasses A and B with identified Sanidine and Leucite phases can be seen in Figure 1a and Figure 2a,b. Inset Tables in Figure 1b and Figure 2c summarize major (M) and minor (m) cubic leucite and sanidine phases and temperatures with the co-existence of both phases. Cubic leucite was the only phase identified in glass C HTXRD (Figure 2b).
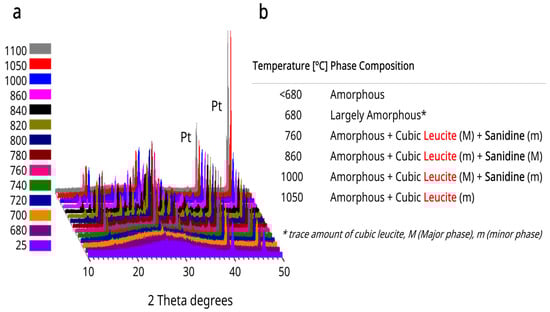
Figure 1.
(a) Glass A high-temperature XRD plots. (b) Table summarizing major (M) and minor (m) cubic leucite and sanidine phases for glass A.
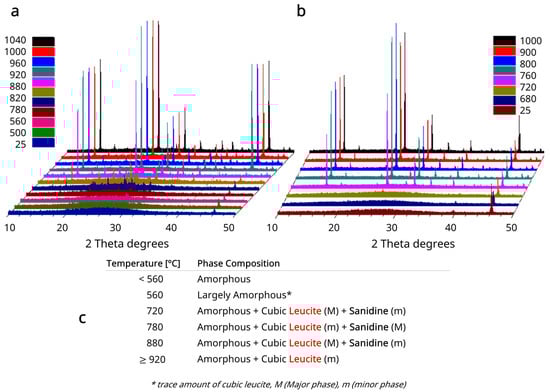
Figure 2.
(a) HT-XRD plots for Glass B and (b) Glass C. (c) Table summarizing major (M) and minor (m) cubic leucite and Sanidine phases for Glass B. Cubic leucite was the only crystalline phase for Glass C.
3.5. SEM Results
SEM photomicrographs of commercial GC (Ceramco 3) and experimental GCs (A, B and C) can be seen in Figure 3a–f. The results of the quantitative image analysis of the SEM photomicrographs are in Table 5. These values contrast with the larger Mean (SD) leucite crystal size (10.15 (30.63) μm2) of the Ceramco-3 GC specimen, with a 30.2% area fraction [22]. Extensive crystal and glassy matrix microcracking were also present (Figure 3a). GC-A (Figure 3b) presents spherical leucite crystals with signs of within-crystal microcracking only. A mixed morphology of spherical and fiber-like leucite crystals (Figure 3c), with some orientated domains (Figure 3d) was found for GC-B. The GC-C specimen displayed a highly crystallized leucite microstructure, containing fine spheres and high aspect ratio rods in orientated domains (Figure 3e), and areas of increased interconnectivity (Figure 3f).
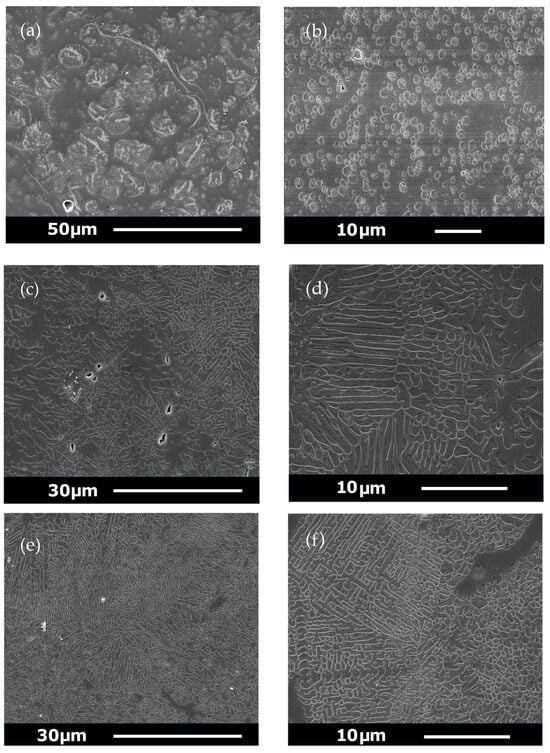
Figure 3.
(a) SEM photomicrographs of commercial GC (Ceramco-3) showing larger crystal size and matrix microcracking. (b) Novel GCs following crystallization heat treatments-GC-A illustrating spherical leucite crystallites. (c) GC-B showing a mixture of spherical and fiber-like leucite crystals and (d) GC-B with orientated crystal domains. (e) GC-C showing orientated rod-shaped crystallites. (f) GC-C with fine spherical crystallites and interconnectivity.
Table 5.
Quantitative image analysis results for the experimental glass-ceramics.
In summary, various leucite crystal sizes, morphologies and area fractions were demonstrated in the novel glass-ceramics, which may have differing technical/clinical applications.
3.6. Solid State MAS-NMR Results
For the glasses, the 27Al MAS-NMR spectra exhibit a narrow line at the center of gravity at 57.4–57.9 ppm. The position of this line indicates that the specimens contain four-coordinated Al(IV) species in the glasses (Figure 4a). The GC spectra (Figure 4b) indicated resonances around 59.5, 67.2 and a third feature at 62 ppm, which was clearer in GC-B and C. These three features were thought to be related to T sites in the framework of the leucite phase [23]. The 27Al 3Q MAS-NMR spectrum of the GC-C (Figure 4c) illustrates the presence of three sites as indicated. Leucite-based commercial controls showed similar 27Al MAS-NMR spectra in Figure 4d. Based on the comparison with the experimental GC-C, the longer low-frequency tail of the 27Al line shape seen in the commercial comparison materials (Figure 4d) indicates the presence of the tetrahedral amorphous aluminum species Al(IV) in the glassy matrix [24]. In summary, 27Al MAS-NMR indicated the structural differences between glasses and GCs as well as the relevant T sites in the framework of the leucite phase.
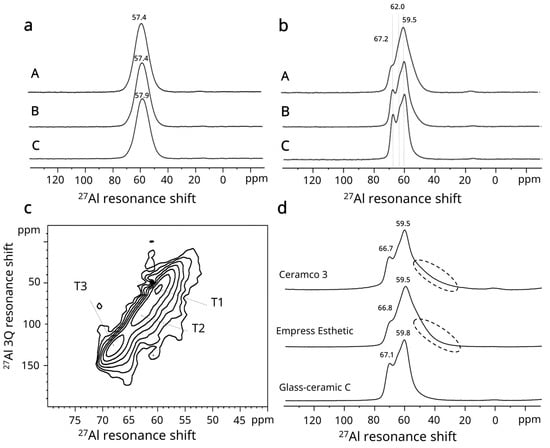
Figure 4.
27Al NMR results for (a) experimental glasses; (b) experimental GCs and (c) 27Al 3QMAS-NMR for GC-C. (d) Comparison of GC-C and commercial GC, where dashed frames around longer low-frequency tails indicate a tetrahedral amorphous aluminum species Al(IV) in the glassy matrix.
4. Discussion
Appen glass predictions used in the current paper (Table 3) were within 0.3 × 10⁻⁶/K of the actual values for CTE, 0.02–0.03 g/cm3 for density and 0.01 for refractive index, making it useful for the design of aluminosilicate glasses for dentistry. This accuracy is in agreement with other studies [25]. In fact, the predicted and measured CTE values were highly correlated (r2 = 0.95, Appendix A, Figure A1), with no significant differences (p > 0.05). The higher CTE found in the glass C (10.4 × 10⁻⁶/K) and GC-C (21.0 × 10⁻⁶/K) may be due to its higher K2O content (Table 1). This oxide makes a bigger contribution to the CTE and is essential to the formation of a higher area fraction (50%) of the leucite phase (KAlSi2O6), which has a high CTE (28 × 10−6 °C−1) [26]. The glasses were designed systematically using Appen factors to match the CTE with the leucite phase. This benefits the generation of tangential compressive stresses within the glassy matrix and reduces strength limiting matrix microcracking [27]. SEM photomicrographs of glass-ceramics A-C indicated a lack of matrix microcracking (Figure 3b–f) compared with Ceramco 3 GC (Figure 3a), and a statistically higher BFS for the experimental GCs. Commercial GCs have been linked to lower CTE (Ceramco 3 CTE = 12.8−6 K−1, 100–400 °C), matrix microcracking and the relief of beneficial residual stresses [22]. The BFS fracture specimens (Appendix A, Figure A3a–c) presented increasingly rougher intergranular fracture surfaces (from GC-A to C). Vacuum sintering of GC-B and C did lead to some microstructural coarsening, but with mixed morphology retained in GC-C (Appendix A, Figure A6a). These microstructural features initiating crack pinning, deflection and diversion due to favorable matrix compressive stresses [28]. Appen factors were previously used following EDX of the residual glass to estimate matrix glass network connectivity and thermal relationships between the glass and crystal phase in high strength leucite GCs [24]. GC-C demonstrated local changes in crystal microstructure where residual glass interfacial chemistry may differ to that of GC-A. The resultant residual glass strains may therefore influence fracture progression. This is illustrated in the tortuous fracture interaction with the twinned leucite crystals and residual glass (Appendix A, Figure A6b). Analytical methods were used to estimate the magnitude of residual stresses in lithium-alumina-silicate GCs and their influence on the generation of high BFS [25].
Previous studies regarding the optimization of leucite glass-ceramics relied on powder processing to successfully increase the BFS and reliability [17,22]. Although highly effective, powder processing techniques add additional manufacturing cost and the potential for contamination due to milling duration and media used. The ability to design and predict glass properties and thermally match with the required crystal phase will reduce processing costs and increased the flexural strength (>200 MPa) in GC-C. All formulations gave a significant flexural strength increase compared to the commercial GC (Ceramco 3). This property is useful to resist brittle fracture in ceramic restorations [29]. Typical values of Weibull modulus for ceramic materials (m = 5–15) were exceeded for CG-B (m = 17.6), indicating greater structural reliability. This allows the possibility to design dental prostheses with the potential for reduced clinical failure [30]. Control of crystalline morphology, volume fraction, chemical composition of the residual glass and physical properties, will also affect GC wear properties. This has importance in the preservation of tooth structure during function [31]. Ceramic microstructures and mechanical properties can be adjusted to suit clinical usage. High volume fraction and high aspect ratio crystal morphology may better suit crown substrates to prevent fracture. Conversely, a fine spherical crystal morphology may be more applicable for crown veneering materials to reduce enamel wear. There may be additional advantages in some systems/engineering applications to use glass prediction models where fracture toughness is advantageous. This may particularly apply in glass-ceramics with lower crystal volume fraction (20%) requiring careful control of residual glass thermal properties to reach high KIc values [32].
SEM imaging of the experimental glasses revealed signs of amorphous phase separation which appeared to be spherical domains of low connectivity. This was not fully characterized due to the size of the domains but may be associated with the displacement of TiO2 from the glass network to form Ca or Na-Ca titanates [24,33], providing increased nucleation [34]. The higher leucite area fraction (50–54.2%) and a change in crystal morphology and growth mechanism in GC-B and C may be linked to higher TiO2 content in these glasses (0.5%). This was similarly demonstrated in an aluminosilicate glass series with systematic increases in Ca/Ti ratios [35]. Appen predictions allowed close matching of glass R.I. with that of the leucite phase (Table 3) to create translucent glass-ceramics. This allows the creation of esthetic dental restorations where tooth shade colors can be subsequently introduced into translucent GCs to mimic tooth shades. Estimated glass fusion temperature predictions ensured processing temperatures of between 1040 And 1180 °C following crystallization. Processing of the novel GCs in current commercial vacuum dental furnaces was therefore achieved (<1200 °C). This ensured a viable route for restoration fabrication available in Dental Technology laboratories.
The 27Al MAS-NMR spectra of the glasses (A, B, C) revealed four-coordinated Al(IV) species in the glasses in similar structural surrounding within three formulations (Figure 4a). Following crystallization heat treatments, it was clear from the spectra that the differing sites for crystalline leucite framework silicate development were present (Figure 4b–d) and confirmed by HTXRD (Figure 2). The 27Al MAS-NMR spectra (Figure 4b) were in close agreement with Kohn et al. [23], who indicated the T1 site was at 58.5 ppm, T2 site at 61.5 ppm and T3 site at 66.5 ppm for leucite. Although the sites overlapped, the spectrum of GC-C shows the most distinct features in the MAS-NMR (Figure 4b) and 3Q NMR (Figure 4c) spectra. This structural factor can be linked to the high BFS encountered in GC-C (Table 4), as there was maximum consumption of aluminum by the leucite phase and minimum residual aluminum in the glassy matrix as indicated by 27Al MAS NMR data (Figure 4d). The longer tail shown in the commercial GCs (Figure 4d) reflects the lower area fraction of leucite in the glassy matrix (Ceramco 3 = 30.2%) and IPS Empress Esthetic GC = 31.2% [17]), and with significantly lower BFS than GC-C. This contrasts with the high leucite area fraction (50%, Figure 3e,f) of finer leucite crystallites indicated in GC-C. MAS-NMR is therefore a valuable tool in assessing the structure/property relations and design of glasses and glass-ceramics. Differences in the more refined and developed microstructural development of GC-C versus GC-B, may be due to its higher K2O content (Table 1), available for leucite crystal development. Re-homogenization of glass C may also have provided a relatively more uniform distribution of elements across the glass network, effecting the local diffusion for crystallization.
In conjunction with NMR, HTXRD enabled the identification and coexistence of both leucite and sanidine crystal phases in the GCs (Figure 1a,b and Figure 2a,c). These phases exist in the same phase field according to the phase diagram [36]. Barreiro and Vicente (1993) [37] confirmed sanidine crystallization in leucite containing dental ceramics (800–950 °C). It was possible to crystallize sanidine from 760 to 1000 °C (GC-A) and 720–880 °C (GC-B). Glass specimens were crystallized at 650 °C/1120 °C and 620/920 °C with holds (Table 2) and ramped through the sanidine crystallization range to avoid its crystallization. Sintering of the GC compacts in a commercial vacuum furnace was >1000 °C (Table 3) to further discourage the coexistence of two different crystal phases. This was to prevent crystal phase/residual glass mismatches for the CTE (Sanidine = 4.1 × 10⁻⁶ °C−1 and leucite = 28 × 10−6 °C−1; 25–700 °C) [26], the refractive index (leucite =1.50, Sanidine = 1.52 [38]) and the consequent negative effects on the mechanical properties and translucency. Room temperature XRD of the crystallized GC verified a bulk leucite phase in all sample groups (Appendix A, Figure A4). The GCs processing schedules used in the study were therefore verified. Future work to complement the HTXRD would be Raman spectroscopy to gain further structural and molecular information on these materials [39].
The Appen model in this study yielded accurate data for the design and synthesis of aluminosilicate glasses of high network connectivity and silica content (>69%). Previous studies indicated silica content needed to be >50% for the accurate prediction of glass properties [40,41]. For dental ceramic crown prosthesis applications, glasses with low solubility and bioactivity are required. Estimation of network connectivity (3.87–3.90) and glass properties is therefore essential for safe GC design for Dentistry. The Appen model has also been modified for broader applications in estimating the R.I. of bioactive glasses [11], and applied to dental glass ionomer and light cured composite applications. Graph-based deep learning approaches have been developed to predict properties of chalcogenide glasses [42]. This is witnessed together with a growing interest in data-driven and machine learning (ML) models. Analytical approaches like additive or regression-based methods are however still valued due to accuracy [13]. In the future, incorporation of more structural features [42] into predictive models, together with experimentally verified data input from different glass systems and transfer learning [43], should enhance ML models. ML used in XRD is then the next step in establishing chemical–structural property relations [44].
The current study established predictive glass modeling in conjunction with advanced characterization techniques, producing tailored Dental GC materials. They benefited from a thermally and optically matched residual glass, microstructural control, and enhanced flexural strength and processability. This approach may therefore benefit broader engineering and biomedical applications requiring tailored properties, like optics, glazes and bioactive glasses. Future work is to expand these techniques to design strong diopside GCs, which are thermally compatible with YTZP substrates to prevent chipping of crown restoratives.
5. Conclusions
The predictive Appen model applied in this study was successful in optimizing a series of aluminosilicate glasses and glass-ceramics. Furthermore, the advanced characterization techniques (MAS-NMR and HTXRD) utilized enabled a deeper understanding and control over their structure–property relations. The formulations synthesized can serve as high strength, functional, esthetic and durable leucite glass-ceramic restoratives for dental prostheses.
6. Patents
- Theocharopoulos A., Chen XH., Karpukhina N., Hill, R.G., Cattell, M.J. Leucite glass ceramics. US9856165B2, 2018.
- Theocharopoulos A., Chen XH., Karpukhina N., Hill, R.G., Cattell, M.J. Leucite glass ceramics. EP3013762B1, 2022.
Author Contributions
All authors have contributed substantially to the study reported as follows: Conceptualization, M.J.C., X.C., A.L.T. and N.K.; methodology, X.C., A.L.T., N.K. and M.J.C.; validation, X.C., A.L.T., M.J.C. and N.K.; formal analysis, A.L.T., X.C., M.J.C. and N.K.; investigation, X.C., A.L.T. and N.K.; resources, M.J.C.; data curation, X.C., M.J.C., A.L.T. and N.K.; writing—original draft preparation, X.C. and A.L.T.; writing—review and editing, A.L.T., M.J.C., X.C. and N.K.; visualization, X.C., A.L.T. and N.K.; supervision, N.K. and M.J.C.; project administration, M.J.C.; funding acquisition, M.J.C. All authors have read and agreed to the published version of the manuscript.
Funding
The authors acknowledge funding from St. Bartholomew’s, The Royal London Charitable Foundation (RAB05/PJ/06), the State Scholarships Foundation (IKY) of Greece and the Den-Mat Corporation.
Institutional Review Board Statement
Not applicable.
Informed Consent Statement
Not applicable.
Data Availability Statement
The data presented in this study are available on request from the corresponding author.
Acknowledgments
The authors acknowledge the support of the following companies for the kind donation of the commercial leucite glass-ceramic materials: Ivoclar-Vivadent, Schaan, Liechtenstein & Dentsply, Ceramco, Burlington, USA (now Dentsply Sirona). The authors also acknowledge the help of Rory Wilson, Zofia Luklinska, Robert Hill and Mick Willis. This article is dedicated to the memory of the late Xiaohui (Helen) Chen (co-author), who will be sadly missed but not forgotten by her family and many friends in the research community.
Conflicts of Interest
The authors declare no conflicts of interest. The funders had no role in the design of the study, in the collection, analyses, or interpretation of data, in the writing of the manuscript or in the decision to publish the results.
Abbreviations
The following abbreviations are used in this manuscript:
| CTE | Coefficient of Thermal Expansion |
| GC | Glass-Ceramic |
| FGMIC | Functional Glass Manufacturing Innovation Consortium |
| AI | Artificial Intelligence |
| ML | Machine Learning |
| RMSE | Root Mean Squared Error |
| R.I. | Refractive Index |
| BFS | Biaxial Flexural Strength |
| NIST SRM | National Institute of Standards Standard Reference Material |
| CCC | Critical Correlation Coefficient |
| SEM | Scanning Electron Microscopy |
| EDX | Electron Dispersive X-ray Spectroscopy |
| HTXRD/XRD | High-Temperature X-ray Diffraction/X-ray diffraction |
| DSC | Differential Scanning Calorimetry |
| MAS NMR | Magic Angle Spinning Nuclear Magnetic Resonance |
| SD | Standard Deviation |
| YTZP | Yttria Tetragonal Zirconia Polycrystals |
Appendix A
Table A1.
Appen factors for glass properties prediction used in the study.
Table A1.
Appen factors for glass properties prediction used in the study.
| Oxides | Thermal Expansion Coefficient (α) Appen Factors (×10−6/K, 20–400 °C) |
|---|---|
| SiO2 | 0.5 to 3.8 |
| Al2O3 | −3.0 |
| K2O | 46.5 (42.0) |
| CaO | 13.0 |
| TiO2 | −1.5 to −3.0 |
| Na2O | 39.5 |
| Li2O | 27.0 |
| MgO | 6.0 |
The following remarks apply for specific Appen Factors:
| |

Figure A1.
Plot showing correlation between predicted and measured CTE values. The dotted line represents the theoretical line of equality.

Figure A2.
CTE plots for all experimental glasses.

Figure A3.
Fracture surfaces (SEM) of sintered: (a) GC-A; (b) GC-B and (c) GC-C showing progressively rougher intergranular fracture surfaces (a–c).

Figure A4.
Room temperature XRD plots of the experimental GCs with overlapped tetragonal leucite peaks as indicated by black lines.

Figure A5.
Flowchart of study design, processing and characterization.

Figure A6.
SEM photomicrographs of (a) GC-C sintered specimen showing the retained mixed crystal morphology, along with some microstructural coarsening. (b) GC-C fracture surface (×20,000) depicting the tortuous fracture interaction with the twinned leucite crystals and residual glass.
References
- Zarzycki, J. Glasses and the Vitreous State; Cambridge University Press: Cambridge, UK, 1991; pp. 1, 37–64, 228–231. [Google Scholar]
- Priven, A.I. General method for calculating the properties of oxide glasses and glass forming melts from their composition and temperature. Glass Technol. 2004, 45, 244–254. Available online: https://www.semanticscholar.org/paper/General-method-for-calculating-the-properties-of-Priven/92307dc8af50a43eaa9697dd859002126862ad0d (accessed on 22 October 2025).
- Functional Glass Manufacturing Innovation Consortium. Driving Functional Glass Manufacturing Innovation: A Technology Roadmap to 2025. Available online: https://ceramics.org/wp-content/uploads/2019/05/FGMIC-roadmap.pdf (accessed on 22 October 2025).
- Winkelmann, A.A.; Schott, O. Dependence of thermal resistance coefficients of glasses on their chemical composition. Ann. Phys. 1894, 51, 730–746. [Google Scholar] [CrossRef]
- Gilard, P.; Dubrul, L. Calculation of physical properties of glass: III. Index of refraction. J. Soc. Glass Technol. 1937, 21, 476–488. [Google Scholar]
- Huggins, M.L.; Sun, K.-H. Calculation of density and optical constants of a glass from its composition in weight percentage. J. Am. Ceram. Soc. 1943, 26, 4–11. [Google Scholar] [CrossRef]
- Appen, A.A. Toward the method for calculating the properties of glass. Glass Ceram. 1961, 18, 235–237. [Google Scholar] [CrossRef]
- Hormadaly, J. Empirical methods for estimating the linear coefficient of expansion of oxide glasses from their composition. J. Non-Cryst. Solids 1986, 79, 311–324. [Google Scholar] [CrossRef]
- Volf, M.B. Mathematical Approach to Glass; Elsevier Science Pub. Comp. Inc.: Amsterdam, The Netherlands, 1988; pp. 31, 142–146. [Google Scholar]
- De Guire, E.; Bartolo, L.; Brindle, R.; Devanathan, R.; Dickey, E.C.; Fessler, J.; French, R.H.; Fotheringham, U.; Harmer, M.; Lara-Curzio, E.; et al. Data-driven glass/ceramic science research: Insights from the glass and ceramic and data science/informatics communities. J. Am. Ceram. Soc. 2019, 102, 6385–6406. [Google Scholar] [CrossRef]
- Duminis, T.; Shahid, S.; Karpukhina, N.G.; Hill, R.G. Predicting refractive index of fluoride containing glasses for aesthetic dental restorations. Dent. Mater. 2018, 34, e83–e88. [Google Scholar] [CrossRef]
- McCloy, J. Methods for prediction of refractive index in glasses for the infrared. In Proceedings of the SPIE 8016, Window and Dome Technologies and Materials XII, Orlando, FL, USA, 25–29 April 2011. [Google Scholar] [CrossRef]
- Lu, X.; Vienna, J.D.; Du, J. Glass formulation and composition optimization with property models: A review. J. Am. Ceram. Soc. 2024, 107, 1603–1624. [Google Scholar] [CrossRef]
- Youngman, R. NMR Spectroscopy in glass science: A review of the elements. Materials 2018, 11, 476. [Google Scholar] [CrossRef]
- Allu, A.R.; Gaddam, A.; Ganisetti, S.; Balaji, S.; Siegel, R.; Mather, G.C.; Fabian, M.; Pascual, M.J.; Ditaranto, N.; Milius, W.; et al. Structure and crystallization of alkaline-earth aluminosilicate glasses: Prevention of the alumina-avoidance principle. The J. Phys. Chem. B 2018, 122, 4737–4747. [Google Scholar] [CrossRef]
- Höland, W.; Rheinberger, V. Dental glass-ceramics. In Bioceramics and Their Clinical Applications; Kokubo, T., Ed.; Woodhead Publishing: Cambridge, UK, 2008; pp. 548–568. [Google Scholar]
- Chen, X.; Chadwick, T.C.; Wilson, R.M.; Hill, R.; Cattell, M.J. Crystallization of high-strength fine-sized leucite glass-ceramics. J. Dent. Res. 2010, 89, 1510–1516. [Google Scholar] [CrossRef]
- Fu, L.; Engqvist, H.; Xia, W. Glass–ceramics in Dentistry: A review. Materials 2020, 13, 1049. [Google Scholar] [CrossRef]
- Deer, W.A.; Howie, R.A.; Zussman, J. An Introduction to the Rock-Forming Minerals; John Wiley and Sons Inc.: London, UK, 1966. [Google Scholar]
- Timoshenko, S.P.; Woinowsky-Krieger, S. Theory of Plates and Shells, 2nd ed.; McGraw-Hill: New York, NY, USA, 1959; pp. 70–71. [Google Scholar]
- Abernethy, R.B. The New Weibull Handbook; Abernethy, R.B.: North Palm Beach, FL, USA, 1996. [Google Scholar]
- Theocharopoulos, A.; Chen, X.; Wilson, R.M.; Hill, R.; Cattell, M.J. Crystallization of high-strength nano-scale leucite glass-ceramics. Dent. Mater. 2013, 29, 1149–1157. [Google Scholar] [CrossRef] [PubMed]
- Kohn, S.; Henderson, C.; Dupree, R. Si–Al ordering in leucite group minerals and ion-exchanged analogues: An MAS NMR study. Am. Mineral. 1997, 82, 1133–1140. [Google Scholar] [CrossRef]
- Cattell, M.J.; Patzig, C.; Bissasu, S.; Tsoutsos, A.; Karpukhina, N. Nucleation efficacy and flexural strength of novel leucite glass-ceramics. Dent. Mater. 2020, 36, 592–602. [Google Scholar] [CrossRef]
- Fabris, D.C.N.; Miguel, E.H.; Vargas, R.; Canto, R.B.; Villas-Boas, M.d.O.C.; Peitl, O.; Sglavo, V.M.; Zanotto, E.D. Microstructure, residual stresses, and mechanical performance of surface crystallized translucent glass-ceramics. J. Eur. Ceram. Soc. 2022, 42, 4631–4642. [Google Scholar] [CrossRef]
- Mackert, J.J.R.; Twiggs, S.W.; Williams, A.L. High-temperature X-ray diffraction measurement of sanidine thermal expansion. J. Dent. Res. 2000, 79, 1590–1595. [Google Scholar] [CrossRef]
- Mackert, J.R.; Rueggeberg, E.; Lockwood, P.E.; Evans, A.L.; Thompson, W.O. Isothermal anneal effect on microcrack density around leucite particles in dental porcelain. J. Dent. Res. 1994, 73, 1221–1227. [Google Scholar] [CrossRef] [PubMed]
- Green, D.J. Strength and engineering design. In An Introduction to the Mechanical Properties of Ceramics, 1st ed.; Solid State Science Series; Cambridge University Press: Cambridge, UK, 1998; pp. 248–264. [Google Scholar]
- Quinn, J.B.; Quinn, G.D.; Kelly, J.R.; Scherrer, S.S. Fractographic analyses of three ceramic whole crown restoration failures. Dent. Mater. 2005, 21, 920–929. [Google Scholar] [CrossRef] [PubMed]
- Della Bona, A.; Anusavice, K.J.; DeHoff, P.H. Weibull analysis and flexural strength of hot-pressed core and veneered ceramic structures. Dent. Mater. 2003, 19, 662–669. [Google Scholar] [CrossRef] [PubMed]
- Mao, Z.; Beuer, F.; Hey, J.; Schmidt, F.; Sorensen, J.A.; Prause, E. Antagonist enamel tooth wear produced by different dental ceramic systems: A systematic review and network meta-analysis of controlled clinical trials. J. Dent. 2024, 142, 104832. [Google Scholar] [CrossRef]
- Nonami, T.; Tsutsumi, S. Press-formable CaO-MgO-SiO2-TiO2-Ag2O glass as a biomaterial. J. Biomed. Mater. Res. 2000, 50, 8–15. [Google Scholar] [CrossRef]
- Cattell, M.J.; Chadwick, T.C.; Knowles, J.C.; Clarke, R.L. The crystallization of an aluminosilicate glass in the K2O-Al2O3-SiO2 System. Dent. Mater. 2005, 21, 811–822. [Google Scholar] [CrossRef]
- James, P.F. Nucleation in glass forming systems a review. In Advances in Ceramics; Simmons, J.H., Uhlmann, D.R., Beall, B.H., Eds.; The American Ceramic Society: Columbus, OH, USA, 1982; Volume 4, pp. 1–48. [Google Scholar]
- Almuhamadi, J.; Almusali, M.H.; Chen, X.; Theocharopoulos, A.L.; Alostath, H.F.; Karpukhina, N.; Cattell, M.J. Effect of TiO2 and CaO addition on the crystallization and flexural strength of novel leucite glass-ceramics. Materials 2024, 17, 3422. [Google Scholar] [CrossRef]
- Schairer, J.F.; Bowen, N.L. The system K2O-Al2O3-SiO2. Am. J. Sci. 1955, 253, 681–746. [Google Scholar] [CrossRef]
- Barreiro, M.M.; Vicente, E.E. Kinetics of isothermal phase transformations in a dental porcelain. J. Mater. Sci. Mater. Med. 1993, 4, 431–436. [Google Scholar] [CrossRef]
- Deer, W.A.; Howie, R.A.; Zussman, J. Rock-Forming Minerals: Framework Silicates; Wiley: Hoboken, NJ, USA, 1963; Volume 4. [Google Scholar]
- Garibay-Alvarado, J.A.; Pizá-Ruiz, P.; Zaragoza-Contreras, A.E.; Espinosa-Magaña, F.; Reyes-López, S.Y. SiO2-Al2O3-ZrO2-Ag composite and its signal enhancement capacity on Raman spectroscopy. Chemosensors 2025, 13, 266. [Google Scholar] [CrossRef]
- Scholze, H.; Lakin, M.J. Calculation Based on Composition. Glass: Nature, Structure and Properties, 1st ed.; Springer: London, UK, 1991; pp. 189–190. [Google Scholar]
- Priven, A.I.; Mazurin, O.V. Comparison of methods used for the calculation of density, refractive index and thermal expansion of oxide glasses. Glass Technol. 2003, 44, 156–166. Available online: https://www.semanticscholar.org/paper/Comparison-of-methods-used-for-the-calculation-of-Priven-Mazurin/579afc011415ff6711708a9b2b3442e991899677 (accessed on 22 October 2025).
- Li, H.; Liu, P.; Liu, S.; Yang, B. Deep learning-assisted attribute prediction of chalcogenide glasses based on graph classification. Sci. Rep. 2025, 15, 19360. [Google Scholar] [CrossRef]
- Cassar, D.R. GlassNet: A multitask deep neural network for predicting many glass properties. Ceram. Int. 2023, 49, 36013–36024. [Google Scholar] [CrossRef]
- Davel, C.; Bassiri-Gharb, N.; Correa-Baena, J.-P. Machine learning in X-ray diffraction for materials discovery and characterization. Matter 2025, 8, 102272. [Google Scholar] [CrossRef]
Disclaimer/Publisher’s Note: The statements, opinions and data contained in all publications are solely those of the individual author(s) and contributor(s) and not of MDPI and/or the editor(s). MDPI and/or the editor(s) disclaim responsibility for any injury to people or property resulting from any ideas, methods, instructions or products referred to in the content. |
© 2025 by the authors. Licensee MDPI, Basel, Switzerland. This article is an open access article distributed under the terms and conditions of the Creative Commons Attribution (CC BY) license (https://creativecommons.org/licenses/by/4.0/).