You are currently viewing a new version of our website. To view the old version click .
Applied Sciences
  • Article
  • Open Access

2 November 2025

Analytical Hierarchy Process–Fuzzy Comprehensive Evaluation Model for Predicting Rockburst with Multiple Indexes

,
,
and
1
Chinese Institute of Coal Science, Beijing 100013, China
2
China Coal Research Institute, Beijing 100013, China
3
State Key Laboratory of Digital Intelligent Technology for Unmanned Coal Mining, Beijing 100013, China
*
Authors to whom correspondence should be addressed.

Abstract

Rockburst is a dynamic disaster that frequently occurs in hard and brittle rock tunnels under high in situ stress conditions. It is influenced by multiple factors, including lithological condition, in situ stress condition, and surrounding rock mass structural condition. Rockbursts are highly destructive and difficult to predict accurately. At present, many methods have been proposed for predicting rockburst proneness. However, the above methods suffer from a lack of diversity, limited applicability, and low predictive accuracy. Therefore, based on the Analytical Hierarchy Process (AHP) method and fuzzy mathematics theory, the eight evaluation indexes (strength brittleness index, stress coefficient, elastic energy index, surrounding grade, etc.) were selected to establish the new AHP fuzzy comprehensive evaluation model. Based on the field case studies, the feasibility and accuracy of the model were validated. The results indicate that the proposed multi-index prediction model demonstrates strong feasibility and high predictive accuracy, and the model has promising application prospects. Meanwhile, the 13 recognized evaluation indexes were summarized, and an approach for accurate rockburst prediction was proposed. The predicting model and predicting approach proposed in this paper are of great significance for improving the accuracy of rockburst prediction.

1. Introduction

When excavating tunnels, caverns, or underground roadways in high-stress and hard-brittle rock masses, rockburst dynamic disasters are extremely likely to occur. Predicting rockburst proneness has long been one of the major global challenges in rock engineering. After tunnel excavation, the surrounding rock transitions from a triaxial stress state to a biaxial stress state, causing stress concentration. The stress concentration leads to the progressive accumulation of energy within the surrounding rock mass. The energy can be released, inducing rockburst when it has accumulated to a certain level []. Rockbursts are characterized by burstiness, destructiveness, and instantaneity, and are difficult to predict in engineering practice. They frequently inflict catastrophic damage on underground construction and directly endanger construction personnel and equipment []. Identifying the main influencing factors of rockbursts and providing timely and accurate predictions and prevention measures have become critical tasks in the construction of underground projects such as tunnels, mines, and hydropower works. At present, based on strength theory, damage theory, and energy theory, the mechanism of rockburst occurrence has been analyzed by numerous scholars [,]. Various methods have been proposed for predicting rockburst proneness. However, most of these methods take into account only a few factors affecting rockbursts and therefore are one-sided and limited in scope. Therefore, it is essential to establish a predictive method for rockbursts that considers multiple influencing factors, possesses objectivity and universality, and has a high precision rate.
Over the past few decades, domestic and international scholars have conducted extensive studies on rockburst prediction. Firstly, some scholars use a single evaluation index to predict the rockburst proneness. Rock mechanics parameters and in situ stress parameters were used to establish the rockburst prediction methods. These methods included Russenes evaluation method [], Turchaninov evaluation method [], Hoek evaluation method [], Barton evaluation method [], Kidybiński evaluation method [], Hou FL evaluation method [], Lu JY evaluation method [], Tao ZY evaluation method [], Xu LS evaluation method [], Tan YA evaluation method [], etc. As research progresses, some new evaluation indexes have been proposed for predicting rockburst. The fractal dimension of the rock surfaces was proposed to predict rockburst by Li []. A new index of rockburst potential exponent was proposed by Zhang [], and the corresponding critical value was obtained. Based on energy storage and release characteristics, Yin [] proposed a new evaluation index to predict rockburst under combined static and dynamic loading. Five-factor discriminant index was used to predict rockburst by Jia [], and satisfactory application results have been obtained in the Houziyan underground powerhouse. Based on multi-physical field parameters, an integrated predicting method for rockburst monitoring was proposed by Zhang [], and the results indicated that the sensitivity of the three monitoring techniques to rockburst was ranked as follows: visible-light imaging > far-infrared > acoustic emission. Yang [] proposed a new prediction index of the relative energy release rate (per unit time) for predicting rockburst. Based on the energy storage and release characteristics of the Type II evolution curve, a new evaluation index C was obtained by Cai []. Combining the local energy release rate (LERR) and the limit energy storage rate (LERS), a new index of the rockburst energy release rate (RBERR) was proposed to predict rockburst by Xu []. Based on the consideration of the pre-peak energy dissipation, strain energy accumulation, and post-peak energy dissipation, a novel evaluation index G for rockburst proneness was introduced by Mo []. The proposed approach addressed the limitations inherent in two widely used rockburst proneness metrics—the elastic energy index and the impact energy index. Based on the numerical simulation techniques, the strain energy analysis method was proposed to predict rockburst by Wang []. Using the disturbance-energy analysis, Cai [] studied the basic criteria of rock mass conditions and the geological factors for predicting rockbursts. Tan [] found that the more inhomogeneous the coal-rock body was, the shorter the lasting time in the vibration period of AE characteristics was, and this phenomenon can be used to predict the rockburst proneness. Based on the micro-seismic monitoring technology and stress conditions under combined dynamic and static stress, the comprehensive index ISD was obtained by He []. Based on in situ stress conditions, energy accumulation theory, and numerical simulation method, a new method was introduced to predict the potential location and strength of rockburst by Miao []. He [] proposed the classification grade of rockburst, the failure criterion of rockburst, and the control method of rockburst. The above rockburst prediction methods were easy to operate and achieved moderate predictive accuracy. However, the selection of the evaluation index was limited, and the prediction method had significant limitations. Thus, it is necessary to establish the multi-index evaluation method of rockburst to improve prediction accuracy.
Based on the mathematical-statistical method, some researchers have proposed an integrated multi-indexes model for predicting rockburst. By comprehensively analyzing the main evaluation indexes of rockburst, the maximum tangential stress, the rock compressive strength, the rock tensile strength, and the elastic energy index were selected to establish a rockburst prediction model. The models included the fuzzy mathematical model [], the matter–element model, the neural network model [,], etc. The new Bayesian network model was established by Li for predicting rockburst, and its validity and accuracy were verified by using 15 incomplete-case examples []. Based on fuzzy matter–element theory, some major indexes were selected by Wang to establish the rockburst prediction model including the brittleness index, surrounding rock stress, elastic strain energy index, and rock integrality index []. Chen [] developed a projection-pursuit model for predicting rockburst, selecting the maximum tangential stress, stress coefficient, and elastic deformation index as predictors. Based on the fuzzy theory and the neural network theory, the fuzzy neural network model was developed by Li to predict rockburst []. Based on an analysis of the primary factors related to rockburst, Chen developed a novel artificial neural network model, and the results demonstrated its accuracy and reliability []. A novel discrete Hopfield neural network (DHNN) model for predicting rockburst was introduced by Xu, and it addressed the random and subjective nature of weight assignment in conventional prediction methods []. Based on the artificial neural networks (ANN) and AdaBoost algorithm approach, the integrated AdaBoost–ANN model was established by Ge [], overcoming the instability of single weak classifiers. Wang [] established an efficacy-coefficient analysis model for rockburst prediction based on the basic principles of the efficacy coefficient. Based on the fuzzy probability theory, Liu developed a new fuzzy-probability model for rockburst prediction []. Wang [] established a Delphi–normal cloud rockburst predicting model that mitigates both fuzziness and randomness in rockburst evaluation, demonstrating superior accuracy compared with the efficacy-coefficient and set-pair analysis approaches. An unascertained measurement classification model was introduced to predict rockburst by Shi [], which showed good agreement with the fuzzy comprehensive evaluation method, the clustering evaluation method, and matter–element extension analysis method. The random forest (RF) model of rockburst prediction was proposed by Dong [], and its predictive accuracy was higher than that of support vector machines (SVM) and artificial neural networks (ANN). Sun introduced a fuzzy neural network rockburst predicting model optimized with an improved genetic algorithm combined with backpropagation []. Gao proposed a modified ant-colony-clustering method for rockburst prediction, which improves the computational efficiency and accuracy of the traditional algorithm []. Qin used rough set theory to determine the weights of rockburst evaluation indicators and established an Extenics-based evaluation model for rockburst prediction []. According to the fuzzy inference system (FIS), adaptive neural-fuzzy inference system (ANFIS), and field measurements, Adoko established the knowledge-based and data-driven fuzzy model to predict rockburst, and the model successfully provided a prediction in a case study []. According to set pair analysis (SPA) theory and variable fuzzy set function (VFS), Wang proposed the SPA–VFS model to predict rockburst []. Based on the fuzzy logic body theory, the acoustic emission characteristic parameters and rock mechanics parameters were selected to establish a rule-based fuzzy evaluation model by Liu []. Based on the multi-factor fuzzy evaluation index system, Guo proposed the comprehensive fuzzy evaluation model to predict coal bursts []. Guo Y established a rockburst predicting model based on the theory of variable fuzzy sets []. Based on the inverse weight analysis method, Chen developed a standardized fuzzy comprehensive evaluation model, which overcomes the excessive subjectivity of weight assignments in traditional models []. Based on the index-distance and uncertainty quantification method, Zhang established a finite-interval cloud model for predicting rockburst, and the model addresses the ambiguity of measured indicator values and the fuzzy randomness of intensity classification []. Using the combined-weighting (GEM–GW) method to determine the composite indicator weights, Pei constructed a grey evaluation model for predicting rockburst []. Based on the principal component analysis (PCA) theory and fuzzy comprehensive evaluation (FCE) theory, the PCA–FCE comprehensive evaluation model was established to predicting rockburst by Cai []. Zhou proposed an entropy–cloud rockburst prediction model, which outperformed the Bayesian model, the k-nearest neighbors (KNN) algorithm, and the random forest (RF) model in accuracy []. Based on rock engineering systems (RES) theory, the engineering geologic factor, complex environmental factor, and human excavation factor were used to establish the intelligent predicting model of rockburst by Guo []. Wen investigated the calculation methods of single-index attribute measurements and composite attribute measurements, and developed an attribute-recognition model for rockburst prediction []. Using statistical theory, a distance-based discriminant analysis model was established to predict rockburst proneness by Gong []. Using matter–element theory and correlation functions, Xiong introduced a matter–element model for predicting rockbursts []. Zhao used the support vector machine (SVM) classification method to establish an SVM-based rockburst predicting model [].These studies selected two to four rockburst evaluation indexes to establish models for rockburst prediction, thereby improving the reliability and accuracy of predicting results. However, the evaluation indexes of surrounding rock structure conditions were not taken into account. Therefore, further studies are required to enhance the accuracy of rockburst prediction.
Determining the weights of evaluation indexes is a critical step in establishing a rockburst predicting model. At present, the determination of indexes weights predominantly relies on the fuzzy comprehensive evaluation method [], Expert scoring method [], Analytic Hierarchy Process method [], Artificial Neural Network method [,], and Grey Relational analysis method [], etc. Feng was the first to use an expert system to conduct a systematic study of rockburst occurrences in South African deep gold mines []. Accounting for the fuzziness of weight assignments, Liu introduced the concept of fuzzy weights and developed a fuzzy probability model to predict rockburst []. Using Grey Relational analysis and fuzzy recognition theory, Jiang proposed a new approach to calculating weight and established a dynamic-weight grey classification rockburst predicting model []. Although these methods can satisfy the evaluation requirements to some extent, each of these methods exhibits certain shortcomings. For instance, the expert scoring method is characterized by a high degree of subjectivity and is relatively difficult to implement. The fuzzy comprehensive evaluation method assigns disproportionately high weights to extreme values, and it can cause other information to be overlooked, resulting in a loss of information. The evaluation accuracy of Artificial Neural Network methods and Grey Relational analysis method is low. However, the Analytic Hierarchy Process (AHP) has the advantage of taking into account a large number of evaluation indexes and providing a comprehensive assessment, and it helps to reduce the subjectivity and randomness involved in determining index weight.
The AHP-fuzzy comprehensive evaluation method was rarely used to predict rockburst. However, it has been widely applied in other fields. Based on the risk management process and fuzzy logic theory, Khodadadi proposed the AHP-fuzzy comprehensive evaluation method to determine and evaluate the risk propensity of contractors in construction projects []. Based on the AHP-fuzzy comprehensive evaluation method, the collaborative traffic predicting method for snow disasters was developed by Han []. Based on the AHP method and fuzzy Delphi method (FDM), Yoo proposed the rock behavior index (RBI) to identify quantitatively the mechanical behavior of rocks in shallow tunnels []. Ye introduced the AHP-fuzzy comprehensive evaluation method to evaluate the stability assessment of rockfalls []. Based on the AHP method, Ren developed a multi-level hierarchical model to analyze campus fire risk []. Liang introduced the AHP method to determine the component weighting factors for the integrity assessment units of natural gas compressors []. Hu used the AHP method to determine the weights of the evaluation indexes in the assessment system of enterprise wastewater treatment [].
Based on the above studies, it can be concluded that the single-index rockburst prediction methods select relatively few indexes and thus cannot comprehensively reflect the main factors influencing rockbursts, resulting in inherent limitations and low prediction accuracy. The multi-index rockburst prediction approaches consider only lithological condition and stress condition while neglecting the surrounding rock structural condition, so the accuracy of rockburst prediction remains insufficient. At present, the weights of evaluation indexes are usually determined by the expert scoring method, the Artificial Neural Network method, and the Grey Relational analysis method; these methods are characterized by high subjectivity and low evaluation precision. However, the AHP-fuzzy comprehensive evaluation model can comprehensively account for multiple factors affecting rockbursts, including the lithological condition, stress condition, and surrounding rock structural condition. This method can realize the quantitative analysis for evaluation indexes, reduce the subjectivity in determining weights and increase the accuracy of the predicting model. Therefore, based on the Analytical Hierarchy Process (AHP) method and the fuzzy mathematics theory, the eight evaluation indexes (strength brittleness index, stress coefficient, elastic energy index, surrounding grade, etc.) were selected to establish the new AHP fuzzy comprehensive evaluation model. Based on the field case studies of Jinping II Hydropower Station, the feasibility and accuracy of the model were validated. The results indicate that the proposed multi-index prediction model demonstrates strong feasibility and high predictive accuracy and that the model has promising application prospects. Meanwhile, the 13 recognized evaluation indexes were summarized, and an approach for accurate rockburst prediction was proposed. The predicting model and predicting approach proposed in this paper are of great significance for improving the accuracy of rockburst prediction.

2. AHP Fuzzy Comprehensive Evaluation Theory

In traditional rockburst prediction approaches, either one metric was used, or the weighting of metrics was strongly affected by human factors, reducing the effectiveness and accuracy of prediction. However, the AHP–fuzzy comprehensive evaluation method combined quantitative and qualitative approaches by considering multiple indexes. The approach used expert experience to mitigate subjective arbitrariness and thereby increased the reliability and accuracy of the discriminative results.
This method involved three main steps for predicting rockburst []. Firstly, based on the case study and mechanism analysis, the main evaluation indexes were determined for predicting rockburst. A set of evaluation indexes for the predicting-level classification model was obtained by applying mathematical statistical analysis, numerical calculation, and expert scoring to the various rockburst indexes. Secondly, each index was fuzzified by using an appropriate membership function, and the weights were assigned to the evaluation indexes from lower levels up to higher levels. Thirdly, the fuzzy evaluation method was used to determine the grade of rockburst prediction.

2.1. AHP Method

Based on the network system theory and multi-objective comprehensive evaluation method, the AHP method was a decision-making analysis method proposed by American operations researcher T.L. Saaty []. The AHP method was applied to analyze and determine the index weights; it involves four steps []. Firstly, the relationships among the factors in the system were investigated to establish a hierarchical structure model of the system. Secondly, pairwise comparisons of elements situated at the same hierarchical level were performed to quantify their relative importance under a specified criterion from the higher level, and the corresponding pairwise comparison matrix was constructed. Thirdly, the judgment matrix was used to calculate the relative weights of the elements being compared for that criterion. Fourthly, the composite weights of elements at each level were calculated and ranked with respect to the overall system goal.

2.1.1. Establishing the Hierarchical Structure Model

A key step in the AHP method was to construct the hierarchical structure model. The research goal was analyzed systematically to determine the multiple evaluation indexes. Then, the sub-indexes for each evaluation index were determined, and the top-down hierarchical dominance relationship was constructed. The hierarchical structure model is shown in Figure 1.
Figure 1. The hierarchical structure model.

2.1.2. Constructing the Judgement Matrix

After establishing the hierarchical structure model, the dominance relationships among the evaluation indexes have been determined. The weight of sub-indexes was determined. It was assumed that problem A has the evaluation indexes B1, B2,…, Bn. Therefore, the judgement matrix B can be constructed as follows.
B = b 11 b 12 b 1 n b 21 b 22 b 2 n b n 1 b n 2 b n n
where bij represents the compared result of the column Bi and column Bj, and bij = 1/bij, i = 1, 2,…, n, j = 1, 2,…, m.
The 1~9 scale method was applied to determine the bij value. The ratio of each evaluation indexes can be obtained to construct the judgement matrix, as shown in Table 1.
Table 1. The 1~9 sign method for determining the relative importance of indexes.

2.1.3. Ranking Single Evaluation Index and Checking Consistency

The judgment matrix B is the reciprocal judgment matrix. Based on the Perron theorem, matrix B has a unique largest eigenvalue, denoted λmax. The largest eigenvalue was usually estimated by the power method, the row-sum method, the root-finding method, and the logarithmic least-squares method. In this paper, the largest eigenvalue was calculated using a root-finding method. The steps were as follows [].
(1)
For each row of the judgment matrix, the n-th root of the product of its elements was be calculated.
W i ¯ = j = 1 n b i j n
where W i ¯ is the n-th root of the product of the elements in the i-th row. The order of the judgement matrix is n. The element of the matrix is bij.
Therefore, the eigenvector W ¯ was be obtained.
W ¯ = W 1 ¯ , W 2 ¯ , , W n ¯ T
(2)
W ¯ was normalized as follows.
W i = W i ¯ i = 1 n W i ¯
where Wi is i-th element of the eigenvector. Therefore, the approximate eigenvector was obtained by Equation (4). It is also the relative weight of the evaluation indexes.
(3)
The maximum eigenvalue of the judgment matrix was calculated.
λ m a x = i = 1 n B i W n W i
where Bi is the i-th row vector of the judgment matrix.
Then, λmax was subjected to a consistency test as follows.
The consistency index was expressed as follows.
C I = λ m a x n n 1
where CI is the consistency index and λmax is the maximum eigenvalue.
The average consistency index RI was calculated. RI was obtained by repeatedly calculating the principal eigenvalue of randomly generated judgment matrices and taking the arithmetic mean of those values, as shown in Table 2.
Table 2. The average consistency index for matrices of different orders was obtained by repeating the computation 1000 times.
The consistency ratio CR can be expressed.
C R = C I / R I
where CR is the consistency ratio and RI is the average consistency index.
For n = 1 or 2, RI is equal to 0. For n ≥ 3, the CR could be obtained by Equation (7). If CR < 0.10, the judgment matrix was regarded as meeting the required level of consistency. Otherwise, the comparison values in the judgment matrix for the evaluation indexes were revised until satisfaction.

2.1.4. Ranking Overall Indexes and Checking Consistency

The overall ranking of hierarchy is the weight vector of all bottom-level evaluation indexes with respect to the overall objective, and it needs to perform multi-level combinatorial computations. The top-down approach was used to calculate weights, synthesizing them layer by layer. The combination weight Wk in k-th level was calculated as the product of the relative weight Rk of n indexes in this level and the combination weight Wk−1 of m indexes in the upper level. It could be expressed as follows [,].
W k = R k W k 1 = W 11 k W 12 k W 1 m k W 21 k W 22 k W 2 m k W n 1 k W n 2 k W n m k W 1 k 1 W 2 k 1 W m k 1 = j = 1 m W 1 j k W j k 1 j = 1 m W 2 j k W j k 1 j = 1 m W n j k W j k 1 = W 1 k W 2 k W n k
where Wk is the combination weight of the k-th level indexes with respect to the overall objective. Wk−1 is the combination weight of the (k − 1)-th level indexes with respect to the overall objective. Rk is the relative weight of the k-th level indexes. Wkij is the weight in k-th level of the i-th row and the j-th column, and i = 1, 2,…, n; j = 1, 2,…, m.
The consistency of the total sorting result was also checked. The comprehensive ratio couldbe expressed at the k-th level.
C R k = C I k / R I k
where CRk is the comprehensive ratio in the k-th level, CIk is the consistency index in the k-th level, and RIk is the average consistency index of the judgment matrix in the k-th level.
Therefore, CIk and RIk could be expressed as follows.
C I k = j = 1 m W k 1 C I j k
where CIkj is the consistency index of the j-th element in the k-th level. Wk−1 is the combination weight of each index in the (k − 1)-th level.
R I k = j = 1 m W k 1 R I j k
where RIkj is the average consistency index of the j-th element in the k-th level.
If CRk < 0.10, the overall consistency of the judgment matrix was acceptable. Otherwise, it needed to be calculated again.

2.2. Fuzzy Comprehensive Evaluation Method

The fuzzy comprehensive evaluation method was adopted in the paper. Firstly, based on the measured values of the evaluation indexes, it was to perform the single-factor evaluation and construct a single-factor fuzzy relation matrix. Secondly, the contribution rate of each index for the evaluation goal was determined. Through fuzzy transformation, the judgment set was obtained. Finally, the final evaluation result was obtained based on the maximum membership principle [,]. The steps of the fuzzy comprehensive evaluation method were as follows.

2.2.1. Determining the Factor Set and the Prediction Set

The qualitative assessment of each evaluation index was performed by determining the factor set and the prediction set. The U is defined as the factor set, and the V is defined as the prediction set.
U = u 1 , u 2 , u 3 , , u m V = ν 1 , ν 2 , ν 3 , , ν m
where U is the set of n evaluation factors. V is the set of m prediction indexes.

2.2.2. Determining Fuzzy Relation Matrix

The fuzzy relation matrix R was a fuzzy relation of the factor set U and the prediction set V. It could be expressed as follows.
R = r i j = r 11 r 12 r 1 m r 21 r 22 r 2 m r n 1 r n 2 r n m
where R is the fuzzy relation matrix. rij is the element of the fuzzy relation matrix, and 0 ≤ rij ≤ 1. rnm represents the membership degree of the m-th prediction with respect to factor n, and i = 1, 2,…, n; j = 1, 2,…, m.

2.2.3. Fuzzy Comprehensive Prediction

In the paper, the weight set W of each evaluation index was determined. It was expressed as follows.
W = W 1 , W 2 , , W n
Based on the fuzzy relation matrix R and weight set W, the comprehensive prediction was conducted. The fuzzy subset A could be expressed as.
A = W R
where A is the prediction set of the evaluation index. W is the weight set for graded prediction indexes. R is the fuzzy relation matrix. “•” is the composite operator of the fuzzy relation.
If the weights of the evaluation index and the fuzzy relation matrix could be determined, the comprehensive evaluation result could be expressed as [].
A = W 1 , W 2 , , W n r 11 r 12 r 1 m r 21 r 22 r 2 m r n 1 r n 2 r n m
where A = [A1, A2,…, Am], and Am is the membership degree of the m-th evaluation grade. The maximum membership degree Ai was the final evaluation grade. Therefore, a comprehensive prediction result could be obtained by Equation (16).

2.3. AHP-Fuzzy Comprehensive Evaluation Model

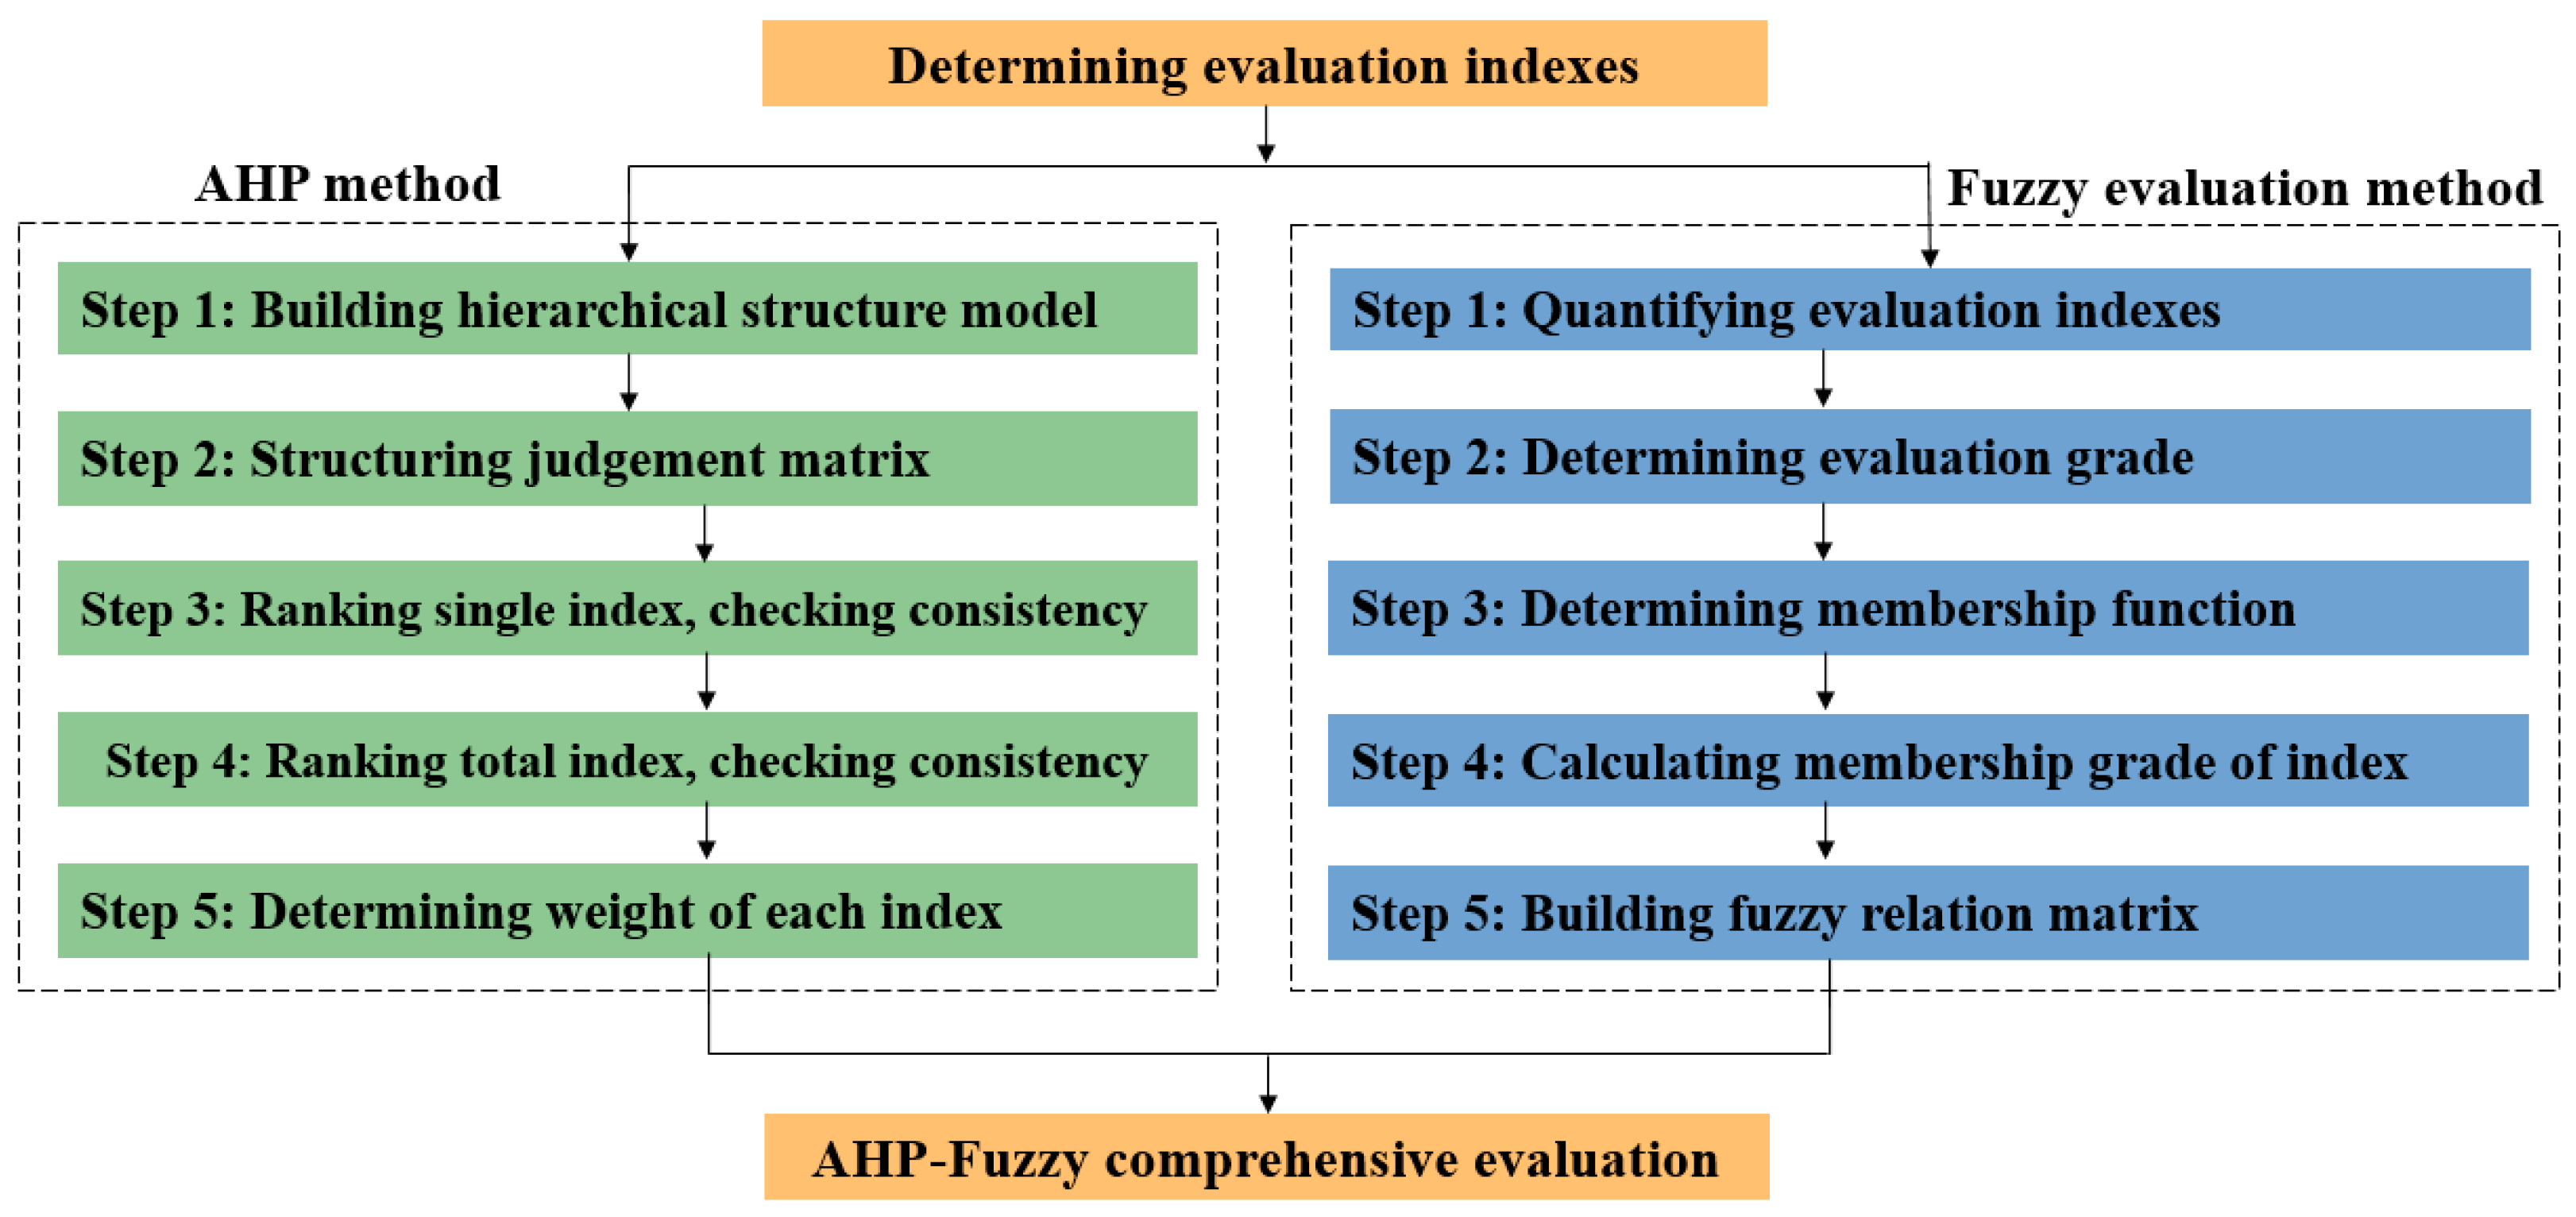
It is critical to determine the weight of the evaluation index for predicting rockburst. In the traditional prediction method, the expert scoring method is adopted to calculate the weight, and it is characterized by a high degree of subjectivity. Therefore, the AHP-fuzzy comprehensive evaluation method was proposed to predict rockburst, as shown in Figure 2. This method is composed of the AHP model and the fuzzy evaluation model. The AHP model was used to determine the weights of evaluation indexes, and the specific computational procedures are as follows: building a hierarchical structure model, structuring a judgment matrix, ranking single and total indexes, checking consistency, and determining the weight of each index. The fuzzy evaluation model was used to judge the rockburst grade, and the specific computational procedures are as follows: quantifying evaluation indexes, determining evaluation grade, determining membership function, calculating membership grade of index, and building fuzzy relation matrix. Thus, the AHP method was used to analyze the evaluation indexes and criteria of rockburst occurrence and establish the hierarchical structure model. Then, the weights of each evaluation index were determined, and the consistency was checked. Finally, the weight results were applied to the fuzzy evaluation framework. Because of the objectivity and reliability of the AHP-fuzzy comprehensive evaluation, it can be applied to predict rockburst.
Figure 2. AHP-fuzzy comprehensive evaluation method.

3. Application of the AHP-Fuzzy Comprehensive Evaluation Method in Rockburst Prediction

In practice, a single index often cannot adequately represent or assess the safety of a complex system. It indicates that conventional prediction methods are inadequate to satisfy the requirements of practical application []. However, the AHP-fuzzy comprehensive evaluation method can effectively resolve this problem []. Therefore, the AHP-fuzzy comprehensive evaluation method was used to establish a quantitative model for predicting rockburst in the paper. The method possesses theoretical and practical significance.

3.1. Determining Prediction Set of Rockburst Grade

The rockburst proneness was used to characterize the probability and magnitude of rockburst occurrence. Different judgment methods can be used to provide either quantitative or qualitative characterizations. In accordance with the engineering practice, rockburst proneness is uniformly classified into four levels, including no rockburst, weak rockburst, medium rockburst, and strong rockburst []. Therefore, the graded judgment set of rockburst can be defined as A = [No rockburst, Weak rockburst, Medium rockburst, Strong rockburst]. In the judgment set, each evaluation index denotes the proneness for rockburst occurrence.

3.2. Evaluation Indexes and Criteria for Predicting Rockburst

According to domestic and international research, rockbursts were primarily controlled by three factors, including the lithological condition, stress condition, and surrounding rock condition []. The eight evaluation indexes were selected to consider the three aspects of influencing factors. The strength brittleness coefficient, elastic deformation energy index, and linear elastic energy can effectively reflect the lithological condition associated with rockburst and are widely used. The stress index, stress coefficient, and T criterion can effectively reflect the stress condition. The RQD indicator and the surrounding rock classification can effectively reflect the surrounding rock condition and are also widely applied. The above eight evaluation indexes are quantitative, which can improve the accuracy of predicted results. The eight evaluation indexes have advantages such as strong operability and ease of acquisition. Therefore, in the paper, the evaluation indexes of rockburst were selected as follows.
(1)
On the lithological condition, the evaluation indexes included the strength brittleness coefficient B [], elastic deformation energy index Wet [], and linear elastic energy We [].
(2)
On the stress condition, the evaluation indexes included the stress index S [], stress coefficient P [], and T criterion [].
(3)
On the surrounding rock condition, the evaluation indexes included the RQD indicator [] and the grade of surrounding rock classification [].
The precise definitions of the eight evaluation indexes discussed above are as follows.
(1)
The strength brittleness coefficient is defined as the ratio of the uniaxial compressive strength and the tensile strength. The rockburst proneness can be determined by the method of the strength brittleness coefficient []. The bigger the B value, the greater the proneness of rockburst occurrence. It can be expressed as follows.
B = σ c / σ t
where B is the strength brittleness coefficient; σc is the uniaxial compressive strength; and σt is the tensile strength.
(2)
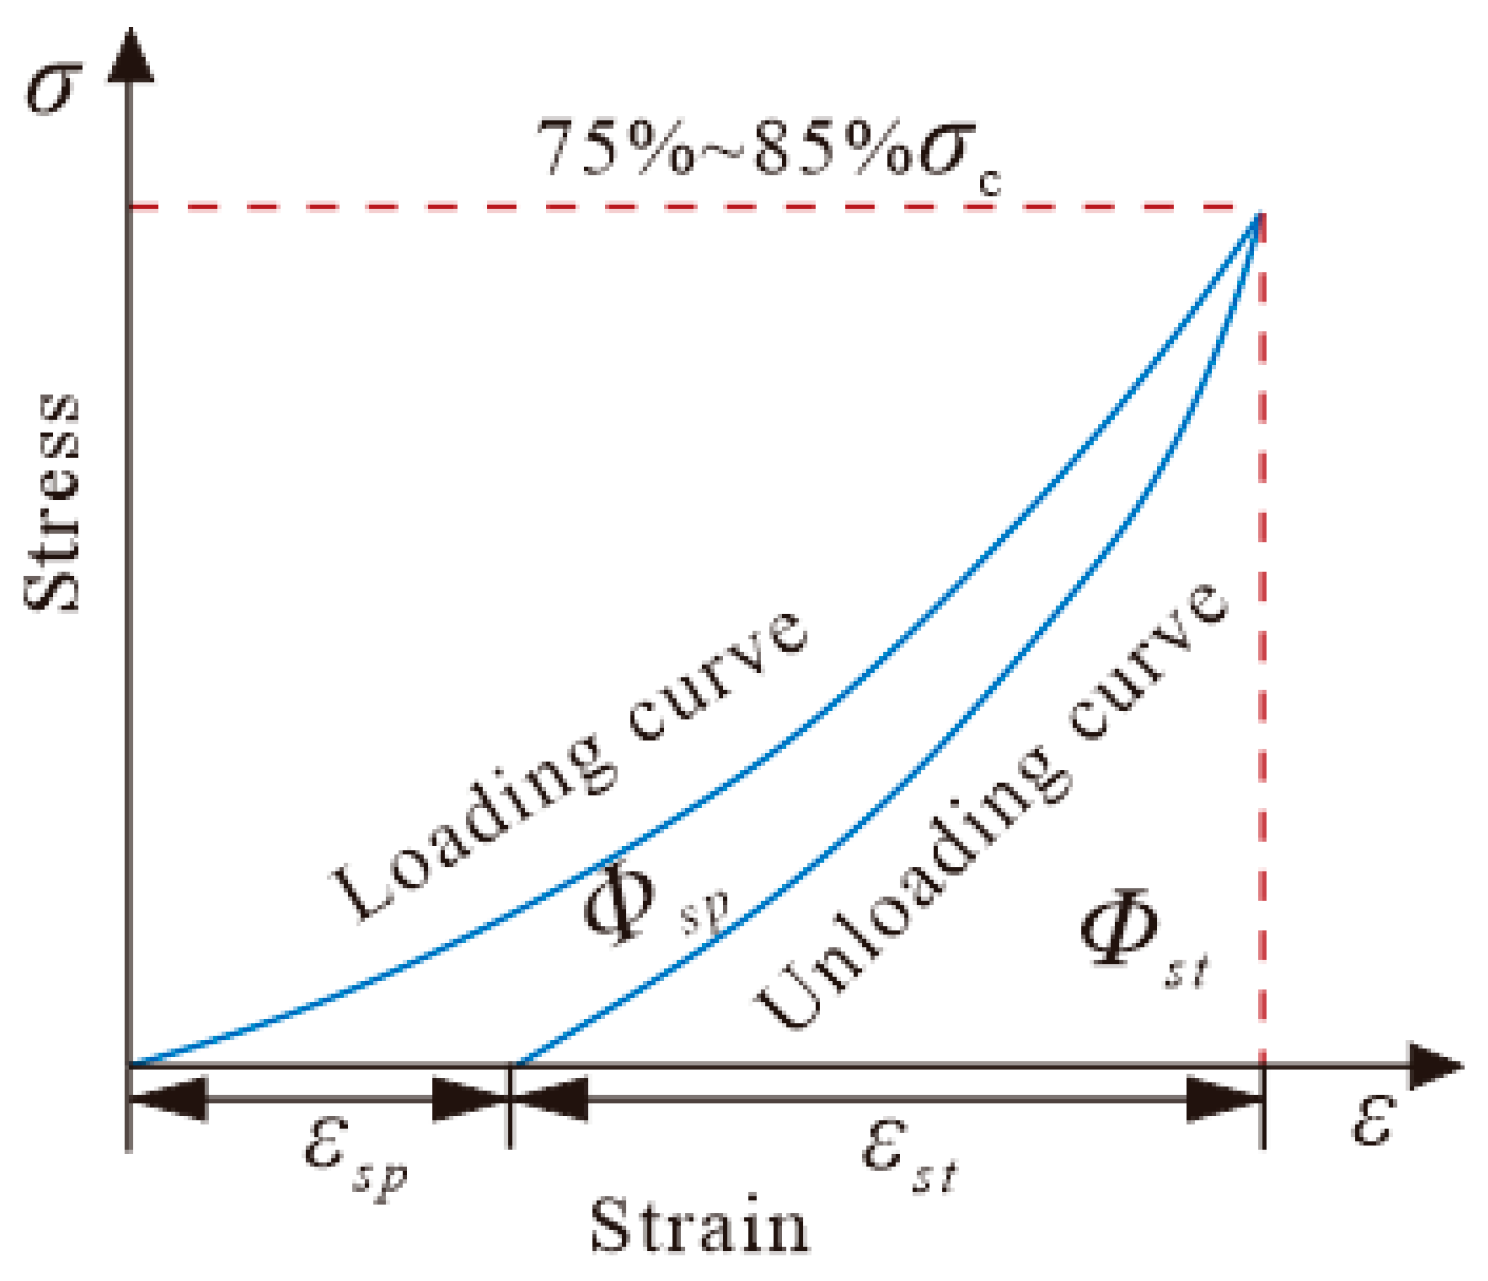
The elastic deformation energy index is defined as the ratio of the elastic deformation stored energy and the plastic deformation dissipating energy. The elastic strain energy accumulated in the rock is the primary internal dominant factor for rockburst occurrence. Therefore, A. Kidybinski proposed the elastic deformation energy index to predict rockburst []. By conducting the experimental test, under the condition of loading to 75–85% of the rock sample peak strength and then unloading to zero, the ratio of the area of the unloading curve to the area enclosed between the loading and unloading curve is the elastic deformation energy index, as shown in Figure 3. The bigger the Wet value, the greater the rockburst proneness. It can be expressed as follows.
Figure 3. The calculating curve of the elastic deformation energy index.
W e t = Φ s t / Φ s p
where Wet is the elastic deformation energy index. Φst is the plastic deformation dissipating energy. Φsp is the elastic deformation stored energy.
(3)
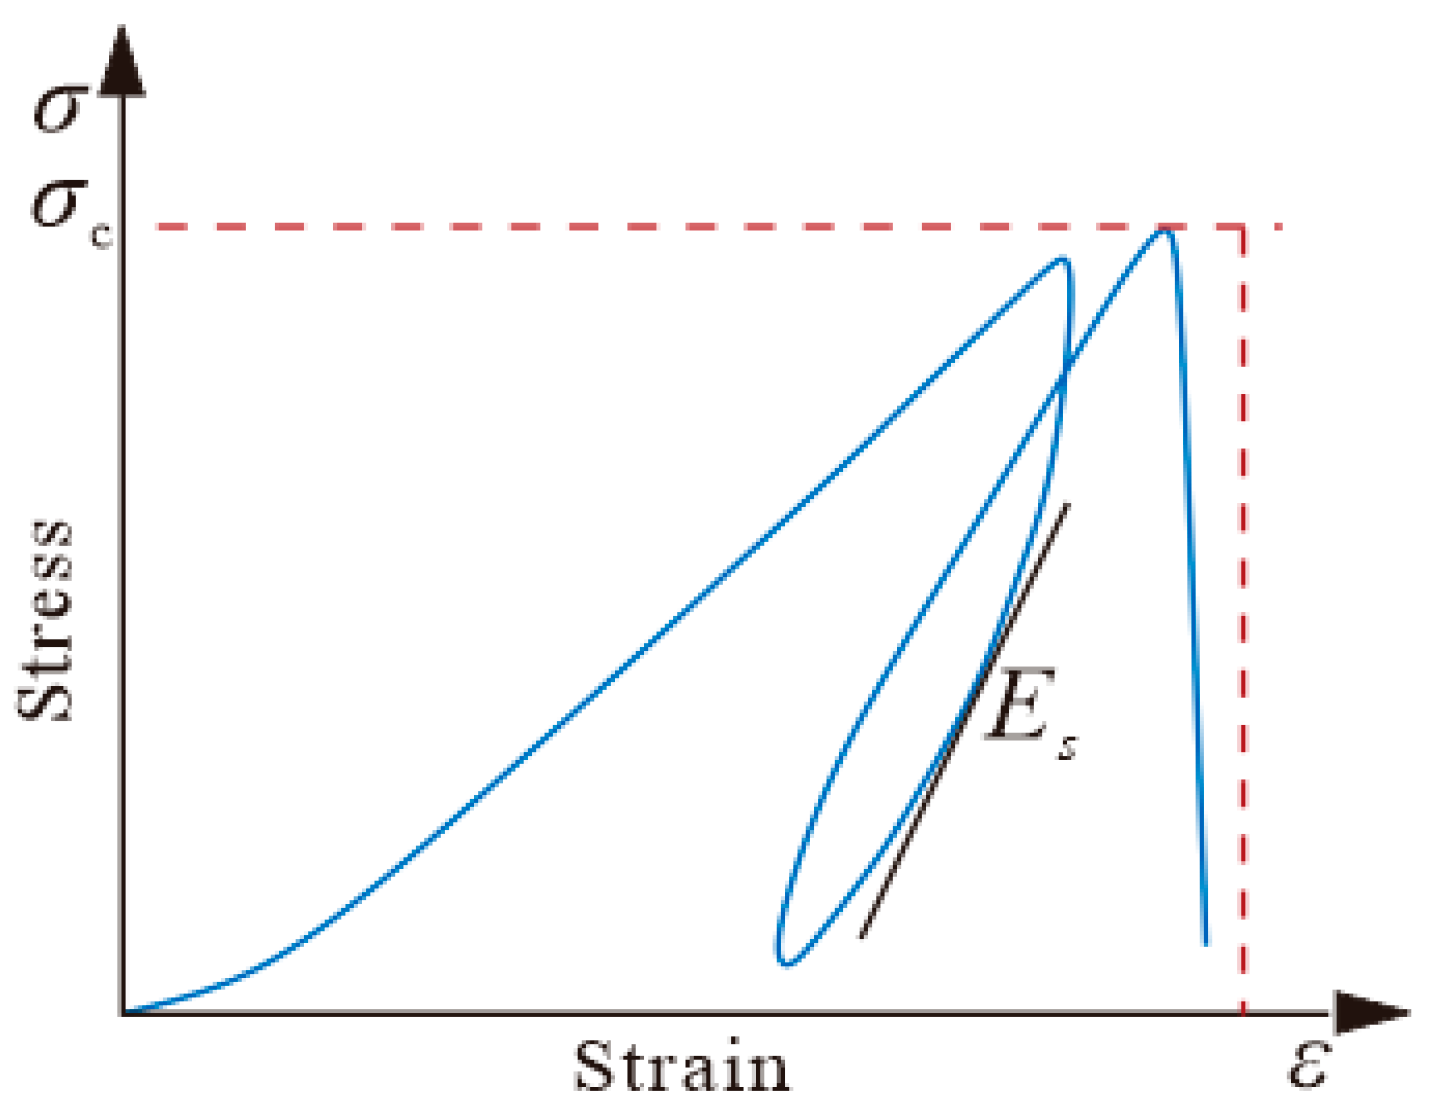
During uniaxial compression of the rock specimen, linear elastic energy is defined as the accumulated elastic energy before prior to attainment of the peak strength []. The sample was unloaded while the loading was close to the peak strength. The loading–unloading curve was obtained to calculate the unloading tangent modulus, as shown in Figure 4. The bigger the We value, the greater the rockburst proneness. It can be expressed as follows.
Figure 4. The calculating curve of the unloading tangent modulus.
W e = σ c 2 / 2 E s
where We is linear elastic energy and Es is the unloading tangent modulus.
(4)
The stress index S is defined as the ratio of the maximum value of in situ stress and the compressive strength of rock []. The bigger the S value, the bigger the possibility of rockburst occurrence. The stress index accounts for both the stress state of the rock mass and the rock mechanical properties. It can be expressed as follows.
S = σ m a x / σ c
where S is the stress index and σmax is the maximum value of in situ stress.
(5)
The stress coefficient is the ratio of the maximum tangent stress and the compressive strength of the rock []. The bigger the P value, the bigger the possibility of rockburst occurrence []. It can be expressed as follows.
P = σ θ / σ c
where P is the stress coefficient and σθ is the maximum tangent stress.
(6)
The T criterion is the ratio of the sum of the tangential stress and the axial stress in the tunnel to the uniaxial compressive strength of rock. The bigger the T value, the bigger the possibility of rockburst occurrence. It can be expressed as follows.
T = σ θ + σ L σ c
where σL is the axial stress of the tunnel.
(7)
The RQD indicator is defined as the ratio of the cumulative length of core pieces ≥ 10 cm to the total drilled length []. The bigger the RQD value, the bigger the possibility of rockburst occurrence. It is expressed as follows.
R Q D = L p / L t × 100
where RQD is the rock quality designation. Lp is the cumulative length of core pieces ≥ 10 cm. Lt is the total drilled length.
(8)
The rockburst occurrence is closely related to the fragmentation degree of the surrounding rock, and it is divided into five grades []. Grade I has characteristics of fresh and integral rock, minimal structural influence, undeveloped joint cracks, and no weak structure planes. Grade II has characteristics of fresh and slightly weathered rock, affected generally by structure, slightly developed joint cracks, and little weak structural surface. Grade III has characteristics of slightly weathered rock, developed geologic structure, and numerous weak structural surfaces. Grade IV of the surrounding rock is similar to Grade III, and it has characteristics of well-developed faults and many weak structural surfaces. Grade V surrounding rock is lumpy material, including gravel, pebble, and gravel soil.
The grade of rockburst occurrence corresponding to the surrounding rock classification IS as follows. Strong rockburst may occur in the surrounding rock classified as Grade I and II. Medium rockburst may occur in the surrounding rock classified as Grade III. Weak rockburst may occur in the surrounding rock classified as Grade IV. Grade V surrounding rock would not cause rockburst.
By collecting the evaluation index and criteria for predicting rockburst from domestic and international sources, this paper shows the corresponding relation between eight evaluation indexes and rockburst occurrence grades, as shown in Table 3.
Table 3. The criterion of rockburst grade is based on 8 evaluation indexes.

3.3. Analysis Hierarchical Structure of Rockbust

3.3.1. Establishing Hierarchical Structure Model of Rockburst

The hierarchical structure model of rockburst occurrence is shown in Figure 5. A represents the proneness of rockburst occurrence. B1, B2, and B3 represent the lithological condition, the stress condition, and the surrounding rock condition, respectively. C1~C8 represent the strength brittleness coefficient, the elastic deformation energy index, the linear elastic energy, the stress index, the stress coefficient, the T criterion, the RQD indicator, and the surrounding rock classification, respectively.
Figure 5. The hierarchical structure model of rockburst on the 8 evaluation indexes.

3.3.2. Building the Judgment Matrix of Evaluation Indexes for Predicting Rockburst

After building the hierarchical structure model, the 1-9 proportional scaling method was adopted to determine the judgment matrix. In the judgment matrix, the number 1 indicates that the two evaluation indexes are equally important for rockburst. The number 9 indicates that the former index is more extremely important than the latter index for rockburst. Similarly, the meanings of the intermediate numbers can be obtained, and the quantitative meanings are shown in Table 1. In the paper, the Delphi method was used to determine the values in the pairwise comparison matrix. The scores are from the expert scoring database in the field of rockburst. The AHP expert scoring method is different from the traditional expert scoring method. This scoring method can overcome subjectivity and achieve quantitative evaluation and analysis because the Analytic Hierarchy Process (AHP) method has a step of checking the consistency. If the consistency ratio was less than 0.10, it indicated that the judgment matrix was regarded as meeting the required level of consistency and the expert scoring method was reasonable. Otherwise, it was revised to the comparison values until satisfaction. Therefore, the four judgment matrices were obtained, as shown in Table 4.
Table 4. Judgment matrix.

3.3.3. The Single-Hierarchy Ranking Results of Rockburst

The weights of each evaluation index were calculated in judgment matrix A-B1~B3. The calculated process was as follows:
(1)
The n-th roots of the product of each row element were calculated in judgment matrix A-B1~B3. The data in Table 4 were substituted into Equation (2) as follows.
W 1 ¯ = j = 1 3 b 1 j 3 = 1 × 1 × 2 3 = 1.2599 W 2 ¯ = j = 1 3 b 2 j 3 = 1 × 1 × 3 3 = 1.4422 W 3 ¯ = j = 1 3 b 3 j 3 = 1 2 × 1 3 × 1 3 = 0.5503
where W 1 ¯ is the third root of the product of the elements in the first row. W 2 ¯ is the third root of the product of the elements in the second row. W 3 ¯ is the third root of the product of the elements in the third row.
Therefore, the eigenvector W ¯ can be obtained.
W ¯ = 1.2599 , 1.4422 , 0.5503 T
(2)
W ¯ was substituted into Equation (4) as follows.
W 1 = W 1 ¯ i = 1 3 W i ¯ = 1.2599 1.2599 + 1.4422 + 0.5503 = 0.3874 W 2 = W 2 ¯ i = 1 3 W i ¯ = 1.4422 1.2599 + 1.4422 + 0.5503 = 0.4434 W 3 = W 3 ¯ i = 1 3 W i ¯ = 0.5503 1.2599 + 1.4422 + 0.5503 = 0.1692
where W1 is first element of the eigenvector. W2 is the second element of the eigenvector. W3 is the third element of the eigenvector.
Therefore, the approximate value of the eigenvector W = (0.3874, 0.4434, 0.1692)T can be obtained. It is also the relative weight of each evaluation index.
(3)
The above results were substituted into Equation (5) to obtain the maximum eigenvalue λmax.
λ m a x = i = 1 n B i W n W i = 1.1642 3 × 0.3874 + 1.3334 3 × 0.4434 + 0.5082 3 × 0.1692 = 3.0184
(4)
The consistency of the maximum eigenvalue was checked as follows.
C I = λ m a x n n 1 = 3.0184 3 3 1 = 0.0092
Because the dimension n is 3, the average consistency index RI is equal to 0.52.
The CI and RI values were substituted into Equation (7) to obtain the CR value.
C R = C I R I = 0.0092 0.52 0.0177 < 0.1
It was indicated that the single-hierarchical hierarchy ranking results of rockburst could satisfy the demand of the consistency check.
Similarly, the single-hierarchy ranking results were calculated on the judgment matrix B1-C1~C3, the judgment matrix B2-C4~C6, and judgment matrix B3-C7~C8, respectively, as shown in Table 5. The CR values of the four judgment matrixes were less than 0.1, and this indicated that the four judgment matrixes had relatively good consistency. The single-hierarchy ranking results of four judgment matrixes satisfied the demand of the consistency check.
Table 5. The single-hierarchy ranking results of 8 evaluation indexes for predicting rockburst.
As shown in Table 6, the weights of B1, B2, and B3 indexes are 0.3874, 0.4434, and 0.1692, respectively. It shows that the importance of the three evaluation indexes for rockburst occurrence is as follows: stress condition > lithological condition > surrounding rock condition. In the criterion layer of lithological condition, the elastic deformation energy index was the most important index for predicting rockburst. In the criterion layer of stress condition, the stress index and T criterion were more important indexes for predicting rockburst. In the criterion layer of surrounding rock condition, the surrounding rock classification index was the most important index for predictingrockburst.
Table 6. The overall hierarchy ranking results of 8 evaluation indexes for predicting rockburst.

3.3.4. The Overall-Hierarchy Ranking Results of Rockburst

Based on the overall-ranking principle in the AHP method, the weights of each evaluation index with respect to the overall objective were calculated, and the total hierarchical consistency of the judgment matrix was checked.
The evaluation indexes weights for predicting rockburst were substituted into Equation (8) to obtain the overall hierarchy ranking result.
W i = j = 1 m W j W i j
where Wi is the weight of each evaluation index in third level for predicting rockburst. The Wj is the weight of each evaluation index in second level for predicting rockburst. The Wij is the weight in the third level of the i-th row and the j-th column, and i = 1, 2,…, 8; j = 1, 2, 3.
The each weight of single-hierarchy ranking result was substituted into Equation (30) to obtain the comprehensive weight. For example, the comprehensive weight W1 was as follows.
W 1 = j = 1 m W j W 1 j = 0.3874 × 0.1634 + 0.4434 × 0 + 0.1692 × 0 = 0.0633
Similarly, the comprehensive weight of each evaluation index for rockburst proneness can be obtained W = (0.0633, 0.2090, 0.1151, 0.1378, 0.0868, 0.2188, 0.0423, 0.1269)T.
The consistency of the overall hierarchy ranking results was checked. The data in Table 5 were substituted into Equations (9)~(11) to obtain the consistency ratio.
C R = 0.3974 × 0.0047 + 0.4434 × 0.0268 + 0.1692 × 0.0000 0.3974 × 0.52 + 0.4434 × 0.52 + 0.1692 × 0.00 = 0.0315 < 0.1
Because CR is less than 0.1, the overall hierarchy ranking results had relatively good consistency. Therefore, the weights of the evaluation indexes determined by the above AHP method are reasonable. The overall hierarchy ranking results of rockburst are shown in Table 6.
The results indicated that the contribution degree of each evaluation index to rockburst occurrence was different. The contribution degrees are presented in descending order of magnitude: the T criterion, the elastic deformation energy index, the stress index, the surrounding rock classification, the linear elastic energy, the stress coefficient, the strength brittleness coefficient, and the RQD indicator.

3.4. AHP-Fuzzy Comprehensive Evaluation for Predicting Rockburst

Based on the distribution characteristics of the evaluation indexes, the membership function of each index for classifying rockburst grade had a k-th order parabolic fuzzy distribution. In the paper, the membership function was defined as the half-step staircase distribution function []. Setting the order k = 1, the distribution function is as follows.
u 1 x i = 1 x i a i b i x i b i a i k a i < x i < b i 0 x i b i , u 2 x i = b i a i b i x i k x i < a i 1 a i x i b i b i a i x i a i k x i > b i u 3 x i = c i b i b i a i k x i < b i 1 b i x i c i c i b i x i b i k x i > c i , u 4 x i = 0 x i b i x i b i c i b i k b i < x i < c i 1 x i c i
where xi is i-th evaluation index of rockburst. un(xi) is the membership degree of the i-th evaluation index to the n-th grade of rockburst proneness. ai, bi, and ci were the critical values of i-th factor corresponding to I~IV Grade rockburst, respectively, as shown in Table 3.
The critical values in Table 3 were substituted into Equation (32). Each evaluation index can be calculated to obtain the four membership functions. Therefore, the eight evaluation indexes were calculated to obtain the 32 membership functions. Through the laboratory test and field measurement, the measured values of the eight evaluation indexes and discrimination criteria were obtained to perform the comprehensive prediction. Meanwhile, the eight sets of fuzzy relation matrix were obtained. Therefore, the fuzzy relation matrix R of eight rows and four columns could be obtained to predict the rockburst proneness.
The fuzzy relation matrix R and the compressive weight matrix W were substituted into Equation (16) to obtain the compressive evaluation set A. Based on the maximum membership principle, the rockburst proneness of the specific project could be predicted synthetically.

4. Engineering Case Application

The auxiliary hole of the Jinping-II Hydropower Station is characterized by complex geological structures, well-developed faults, deep burial depth, and relatively high in situ stress. Tunnel excavation is likely to cause stress redistribution and energy concentration. The study area presents the typical physical conditions associated with frequent rockbursts. On the one hand, the tunnel is characterized by its long length and large cross-section, representing the engineering conditions of similar deeply buried large-scale energy infrastructures both domestically and internationally. The tunnel faces a long-term risk of surrounding rock failure during the construction and operation stages, making it an appropriate object for rockburst prediction research. On the other hand, there are ample historical events and representative cases of rockburst. It provided real labeled samples for model training and validation, and it was helpful for the evaluation of the model’s robustness and its applicability in engineering practice. Research on the rockburst prediction in this region carries significant engineering, social, and economic implications and therefore has high research value. Rockburst disasters can cause major casualties, equipment damage, and production stoppages, so predicting outcomes for this project has immediate engineering value and potential for broader application. Therefore, the case of an auxiliary hole in the Jinping-II Hydropower Station was selected for the study. It both reflects the core technical challenges of rockburst prediction and ensures that the study’s conclusions have practical engineering applicability.
The AHP-fuzzy comprehensive evaluation model was applied to predict rockburst in the auxiliary hole of the Jinping-II Hydropower Station. The geological condition is as follows. The tunnel of the auxiliary hole has a length of 17.23 km. The mechanical property of the surrounding rock is very complex, mainly composed of marble, sandstone, and slate. The faults are well developed, and the tunnel is located in a high-stress zone. The tunnel was divided into nine stages to predict rockburst, including the K0~550 m, K550~1500 m, K1500~5000 m, K5000~8100 m, K8100~10,000 m, K10,000~13,500 m, K13,500~15,000 m, K15,000~16,200 m, and K16,200~17,230 m. The rock mechanical parameters of each stage are shown in Table 7 [].
Table 7. The rock mechanical parameters of the auxiliary hole in the Jinping-II Hydropower Station.
Based on rock physical-mechanics test, the measurement in situ stress and the engineering geological analogy method, the measured values of the eight evaluation indexes were determined in each stage of the tunnel, as shown in Table 8. In the paper, the quantitative criteria of surrounding rock classification are as follows. Grade I~V of the surrounding rock was quantified to 1~5, respectively. If the research area has both Grade II of the surrounding rock and Grade III of the surrounding rock, the quantitative value was defined as 2.5.
Table 8. Evaluation indexes of the auxiliary hole in the Jinping-II Hydropower Station.
Taking the K0~550 m stage of the tunnel as an example, we conducted the prediction of rockburst proneness.
(1)
The critical values of the eight evaluation indexes in Table 3 were substituted into Equation (33). The membership function equation was obtained. Then, the measured values of the evaluation index in K0~550 m stage were substituted into the membership function equation to obtain the fuzzy relation matrix.
R = 0.0000 0.6910 1.0000 0.0490 1.0000 0.5625 0.1837 0.0000 0.0000 0.3265 1.0000 0.2025 1.0000 0.6944 0.2066 0.0000 1.0000 0.3265 0.1322 0.0000 1.0000 0.6400 0.2975 0.0000 0.0000 0.2403 0.5917 1.0000 1.0000 1.0000 0.2500 0.0000
The fuzzy relation matrix R and the weight W of the evaluation index were substituted into Equation (16) to obtain the comprehensive evaluation set A. The comprehensive evaluation set in the test section of the tunnel for predicting rockburst was expressed as follows.
A 550 = 0.7793 , 0.6000 , 0.3786 , 0.0687 A 1500 = 0.1719 , 0.8602 , 0.6636 , 0.1118 A 5000 = 0.1655 , 0.5226 , 0.6725 , 0.4014 A 8100 = 0.0009 , 0.4746 , 0.8176 , 0.4766 A 10000 = 0.0084 , 0.4584 , 0.7139 , 0.5940 A 13500 = 0.0084 , 0.4600 , 0.6970 , 0.5940 A 15000 = 0.0401 , 0.5200 , 0.7670 , 0.4173 A 16200 = 0.0827 , 0.8568 , 0.7116 , 0.1347 A 17230 = 0.7793 , 0.6515 , 0.3995 , 0.1214
Based on the maximum membership principle, the maximum value of the comprehensive evaluation set A550 is equal to 0.7793. Therefore, the predicted result of rockburst is no rockburst in the K0~550 m stage of the tunnel. The maximum value of the comprehensive evaluation set A1500 is equal to 0.8602, and the predicted result of rockburst is weak rockburst in the K500~1500 m stage of the tunnel. The maximum value of the comprehensive evaluation set A5000 is equal to 0.6725, and the predicted result of rockburst is medium rockburst in the K1500~5000 m stage of the tunnel. The maximum value of the comprehensive evaluation set A8100 is equal to 0.8176, and the predicted result of rockburst is medium rockburst in the K5000~8100 m stage of the tunnel. The maximum value of the comprehensive evaluation set A10,000 is equal to 0.7139, and the predicted result of rockburst is medium rockburst in the K8100~10,000 m stage of the tunnel. The maximum value of the comprehensive evaluation set A13,500 is equal to 0.6970, and the predicted result of rockburst is medium rockburst in the K10,000~13,500 m stage of the tunnel. The maximum value of the comprehensive evaluation set A15,000 is equal to 0.7670, and the predicted result of the rockburst is a medium rockburst in the K13,500~15,000 m stage of the tunnel. The maximum value of the comprehensive evaluation set A16,200 is equal to 0.8580, and the predicted result of rockburst is medium rockburst in the K15,000~16,200 m stage of the tunnel. The maximum value of the comprehensive evaluation set A17,230 is equal to 0.7793, and the predicted result of rockburst is medium rockburst in K16,200~17,230 m stage of the tunnel.
Therefore, the AHP-fuzzy comprehensive evaluation method proposed in the paper was used to predict the rockburst proneness in the nine stages of the 17.23 km auxiliary hole in the Jinping-II Hydropower Station.

5. Analysis and Discussion

5.1. Accuracy Analysis of the Rockburst Predicting Model

This study aimed to develop an AHP-fuzzy comprehensive evaluation model to enable more reasonable and accurate prediction of rockbursts. Based on the proposed rockburst prediction model, the rockburst proneness was predicted in the auxiliary hole of the Jinping-II Hydropower Station. The predicted results of the AHP-fuzzy comprehensive evaluation method were verified by the actual rockburst condition.
The rockburst classification results of the auxiliary hole of the Jinping-II Hydropower Station are shown in Table 9.
Table 9. Rockburst classification results obtained by the AHP-fuzzy comprehensive evaluation method.
Compared with the AHP-fuzzy comprehensive evaluation method, based on the rock mechanical parameters in Table 7 and Table 8, the single-index prediction method was selected to predict the rockburst proneness, including the rock brittleness index method, Russense’s method, and Kidybinski’s method. The predicted results are shown in Table 10. Meanwhile, the accuracy of the predicted results was further verified. Based on the rock mechanical parameters in Table 7 and Table 8, the multi-index prediction method was also selected to predict the rockburst proneness, including the Random Forest (RF) method, Artificial Neural Network (ANN) method, Bayesian method (BM), and TOPSIS method. The comparison prediction results are shown in Table 11.
Table 10. The comparison of results through the single-index prediction method of rockburst.
Table 11. The comparison of results through the multi-index prediction method of rockburst.
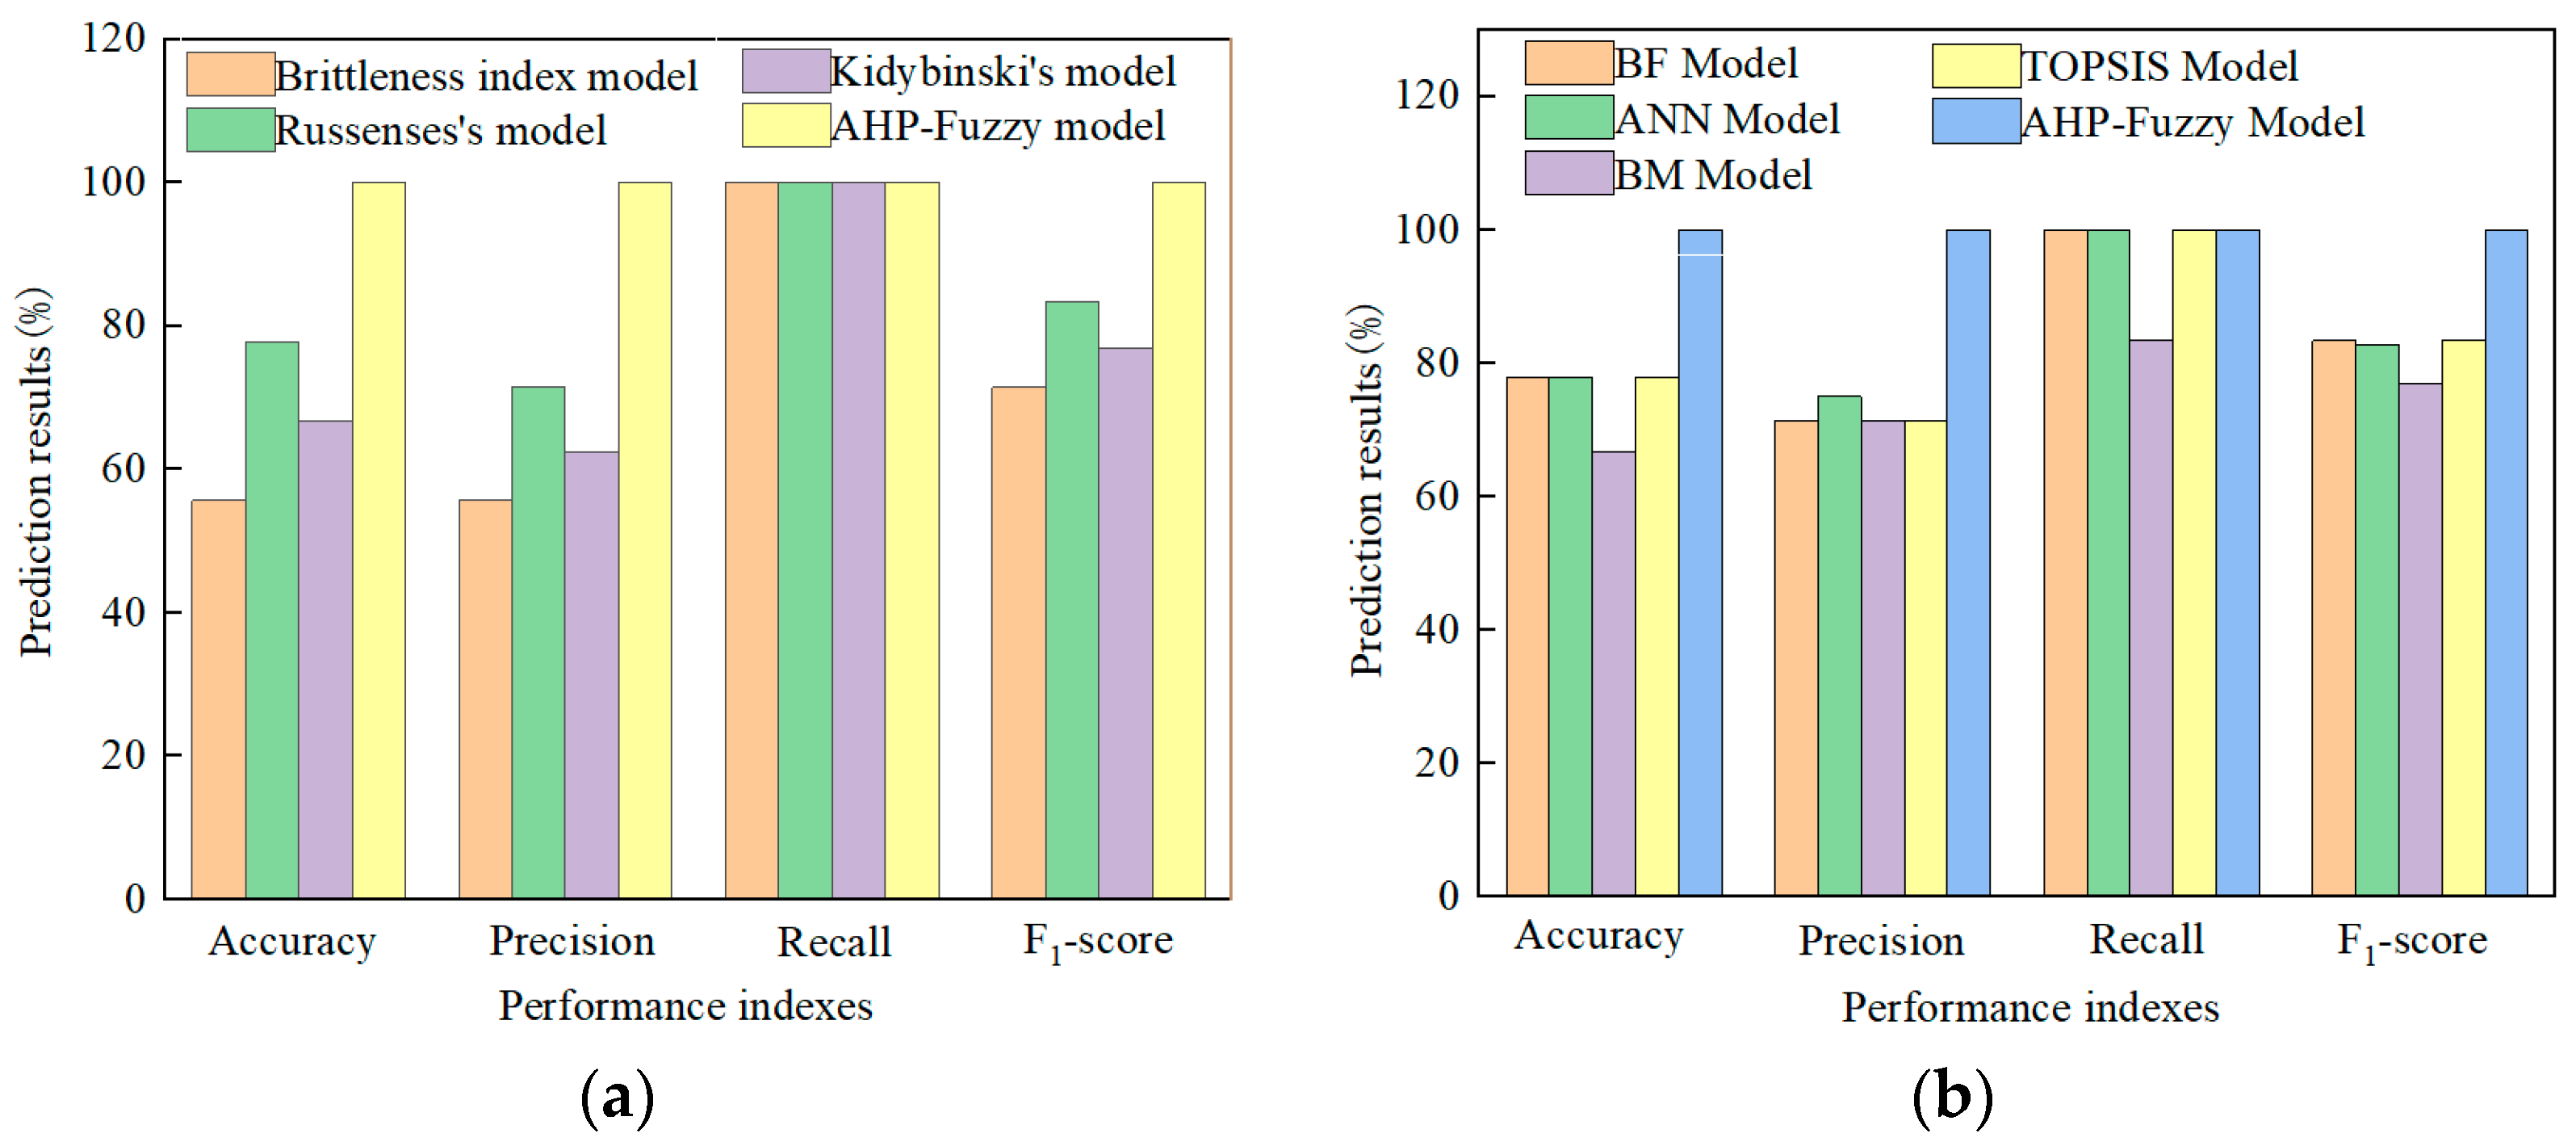
In the paper, the performance indexes of the accuracy, precision, recall, and F1-score were selected to analyze the prediction accuracy of different models. The comparison results of the performance indexs for each model are shown in Table 12 and Figure 6. The comparison results between the single-index model and the proposed model are shown in Figure 6a. These results indicated that the different methods for predicting rockburst could produce inconsistent results. The accuracies of the brittleness index model, Russenses’s model, and Kidybinski’s model were 55.6%, 77.8%, and 66.7%, respectively. However, the accuracy of the proposed model was 100%. The precisions of the brittleness index model, Russenses’ model, and Kidybinski’s model were 55.6%, 71.4% and 62.5%, respectively. However, the precision of the proposed model was 100%. All recalls of the brittleness index model, Russenses’s model, Kidybinski’s model, and the proposed model were 100%. The F1-scores of the brittleness index model, Russenses’ model, and Kidybinski’s model were 71.4%, 83.3% and 76.9%, respectively. However, the F1-score of the proposed model was 100%. Thus, these results showed that the proposed model achieved higher predictive accuracy. In fact, the brittleness index method accounted for the rock uniaxial compression strength and tensile strength but ignored the in situ stress condition. Russenes’s method accounted for the maximum principal stress, the minimum principal stress, and the rock uniaxial compression strength, but ignored the surrounding rock structural condition. Kidybinski’s method accounted for the characteristics of rock storing and releasing energy, but ignored the surrounding rock structural condition. However, the evaluation indexes not considered in the above method are also critical to the rockburst occurrence. The above traditional prediction methods have certain limitations, and deviations in predictions are inevitable.
Table 12. The analyzed results of the performance index for each model.
Figure 6. Comparison diagram of the predicting results of the performance index by different methods. (a) The single-index prediction method; (b) The multi-indexes prediction method.
The comparison results between the multi-index model and the proposed model are shown in Figure 6b. The accuracy of the RF model, the ANN model, the BM model, and the TOPSIS model was 77.8%, 77.8%, 66.7%, and 77.8%, respectively. However, the accuracy of the proposed model was 100%. The precisions of the RF model, the ANN model, the BM model, and the TOPSIS model were 71.4%, 75.0%, 71.4%, and 71.4%, respectively. However, the precision of the proposed model was 100%. The recalls of the RF model, the ANN model, the BM model, and the TOPSIS model were 100%, 100%, 83.3%, and 100%, respectively. However, the recall of the proposed model was 100%. The F1-scores of the RF model, the ANN model, the BM model, and the TOPSIS model were 83.3%, 85.7%, 76.9%, and 83.3%, respectively. However, the F1-score of the proposed model was 100%. Thus, the results showe that the proposed model achieved higher predicting accuracy compared with the multi-index model, and the predicting accuracy of the multi-index model was greater than the single-index model. In fact, the Random Forest algorithm performs poorly on small datasets. Since the amount of data for rockburst prediction is limited, this method is not well-suited for predicting rockburst. The ANN algorithms are prone to overfitting or underfitting, which can lead to low predictive accuracy. For the Bayesian method, the posterior probability distribution in this method is heavily influenced by the prior distribution, resulting in poor predictive outcomes. The TOPSIS algorithm does not take into account the potential correlations among indexes in practice, which may affect the accuracy of the evaluation.
In the paper, the authors established the AHP-fuzzy comprehensive evaluation model which considered a variety of factors, including the physical and mechanical properties, stress condition, and surrounding rock structural condition. Through comparative analysis, it was found that the AHP-fuzzy comprehensive evaluation method takes the evaluation indexes into consideration. This method overcomes the defect of subjectivity while determining the weights of evaluation indexes, and it achieves rockburst proneness prediction by combining the quantitative and qualitative methods. The predictive model proposed by the paper is reliable and accurate. Based on case analysis, the predicted results demonstrated high accuracy.
The AHP-fuzzy comprehensive evaluation model improves the accuracy of rockburst prediction, and enriches and strengthens the theoretical basis of rockburst studies. The proposed model in this study can achieve the accurate prediction of rockburst hazards in unexcavated sections of the tunnel. It contributes to the optimization of roadway layout, supports design and construction sequence, thereby reducing the probability of safety incidents. Meanwhile, it ensures the safety of construction personnel and also improves the economic and social benefits.

5.2. The Outlook of the Rockburst Prediction Model

In a specific engineering application, it is important to obtain complete data for the eight evaluation indexes of the model. In the future, the main research direction will be to quickly and accurately obtain the evaluation indexes. Proposing new and meaningful predicting indexes and reasonably applying them to the AHP-fuzzy evaluation model is also a research hotspot. By summarizing the work of previous scholars, the paper has identified 13 rockburst evaluation indexes that are currently highly recognized. In the paper, the 13 evaluation indexes were applied to the model, and the accuracy was analyzed in depth. Further research is required to strengthen practical engineering applications and model validation.
The 13 evaluation indexes include the deformation brittleness index Ku [], the strength brittleness coefficient B [], the elastic deformation energy index Wet [], the linear elastic energy We [], the energy storage index k [], the rockburst energy ratio η [], the impact energy index Wcf [], the stress index S [], the stress coefficient P [], the T criterion [], the rockburst intensity factor W [], the RQD indicator [], and the surrounding rock classification [].
The above 13 evaluation indexes were classified as follows.
(1)
For the lithological condition, the evaluation indexes included the deformation brittleness index Ku [], the strength brittleness coefficient B [], the elastic deformation energy index Wet [], the linear elastic energy We [], the energy storage index k [], the rockburst energy ratio η [], and the impact energy index Wcf [].
(2)
For the stress condition, the evaluation indexes included the stress condition, which includes stress index S [], the stress coefficient P [], and the T criterion T [].
(3)
For the surrounding rock condition, the evaluation indexes included the rockburst intensity factor W [], the RQD indicator [], and the surrounding rock classification [].
The correspondence between the 13 rockburst evaluation indexes and the rockburst occurrence grades is shown in Table 13.
Table 13. The criterion of rockburst grade based on the 13 evaluation indexes.
Then, the AHP method was adopted to determine the weight of evaluation indexes and predict rockburst proneness. Similarly, the hierarchical structure model was established, as shown in Figure 7.
Figure 7. Hierarchical structure model of the 13 evaluation indexes for predicting rockburst.
The judgment matrix of evaluation indexes for predicting rockburst was established. According to the quantitative description method, the four judgment matrixes were obtained eventually, as shown in Table 14 and Table 15.
Table 14. Judgment matrix D-E1~E3.
Table 15. Judgment matrix E-F1~F13.
The weight vectors of the judgment matrix were calculated, including the judgment matrix D-E1~E3, judgment matrix E1-F1~F7, judgment matrix E2-F8~F10, and judgment matrix E3-F11~F13. The consistency of hierarchical ranking results was checked. Similarly, the single-hierarchy ranking results of rockburst were obtained eventually, as shown in Table 16.
Table 16. The single-hierarchy ranking results of the 13 evaluation indexes for predicting rockburst.
Based on the overall-ranking principle in the AHP method, the overall-hierarchy ranking results were calculated. And the results satisfied the demand for a consistency check, as shown in Table 17.
Table 17. The overall hierarchy ranking results of the 13 evaluation indexes for predicting rockburst.
As shown in Table 15, the results indicated that the contribution degree of each evaluation index to rockburst occurrence is presented in descending order of magnitude. It was, as follows: the T criterion, stress index, the rockburst intensity factor, the stress coefficient, the energy storage index, the rockburst energy ratio, the elastic deformation energy index, the surrounding rock classification, the impact energy index, the linear elastic energy, the strength brittleness coefficient, the deformation brittleness index, and the RQD indicator. The most important step in determining the weights of each evaluation index has been determined. Then the AHP-fuzzy comprehensive evaluation method was used for establishing the rockburst proneness. Future research should focus on developing fast and accurate methods for computing each evaluation index. Finally, this method was applied to the rockburst prediction in engineering practice.
In our opinion, the rockburst prediction in underground engineering should be divided into two steps. Firstly, the research tunnel should be divided into different stages, and the multiple rockburst discrimination criteria in Table 3 and Table 11 should be adopted to obtain the predicted result of rockburst. Secondly, with the development of the construction process, the lithological condition, the stress condition, and the surrounding rock condition should be analyzed synthetically. Based on the AHP-fuzzy comprehensive evaluation method proposed by the paper, the prediction result should be compared with the actual field result of rockburst proneness, and it should seek the optimal criterion of being most appropriate to the tunnel and the roadway. Finally, the rockburst proneness should be predicted reasonably and synthetically.

6. Conclusions

(1)
Based on the AHP method, the eight evaluation indexes were selected, and the weights of indexes were obtained for predicting rockburst proneness. The contribution degree is presented in descending order of magnitude: the T criterion, the elastic deformation energy index, the stress index, the surrounding rock classification, the linear elastic energy, the stress coefficient, the strength brittleness coefficient, and the RQD indicator. According to the fuzzy mathematics theory, the AHP-fuzzy comprehensive evaluation model was established to predict the rockburst.
(2)
According to the field case in the auxiliary hole of the Jinping-II Hydropower Station, the feasibility and accuracy of the model were validated. The accuracy, precision, recall, and F1-score were 100% through the AHP-fuzzy comprehensive evaluation method proposed by the paper. Compared with the applied models in the paper, the predicting accuracy of the proposed model was greater than the single-index model (brittleness index model, Russenses’s model, and Kidybinski’s model) and the multi-index model (RF model, ANN model, BM model, and TOPSIS model). It indicated that the proposed model achieves higher prediction accuracy. The AHP-fuzzy comprehensive evaluation model improves the accuracy of rockburst prediction and enriches and strengthens the theoretical basis of rockburst studies.
(3)
By summarizing the work of previous scholars, the paper has identified 13 rockburst evaluation indexes that are currently highly recognized, and the weights of 13 evaluation indexes were obtained. Then, based on the fuzzy theory, the rockburst proneness can be predicted. However, the proposed model may produce computational errors during the process of quantifying targeted indexes, and the model cannot automatically generate new research plans. When rockburst events are rare, the validation and optimization of the model are severely limited. In the future, the method can be applied to rockburst prediction in tunnels with similar engineering-geological conditions, and it can be extended to the mining hazards and the natural disasters such as coal bumps, floods, and landslides. For disaster prediction, how to propose new and meaningful predicting indexes and reasonably apply them to the AHP-fuzzy evaluation model is also a research hotspot.

Author Contributions

Conceptualization, X.C., L.S., Z.H. and Z.L.; methodology, X.C.; software, X.C.; validation, X.C. and L.S.; formal analysis, X.C.; investigation, X.C. and L.S.; resources, X.C. and L.S.; data curation, X.C. and L.S.; writing—original draft preparation, X.C.; writing—review and editing, X.C. and L.S.; visualization, X.C. and L.S.; supervision, L.S., Z.H. and Z.L.; project administration, X.C. and L.S.; funding acquisition, X.C. and L.S. All authors have read and agreed to the published version of the manuscript.

Funding

This work was supported by the China Postdoctoral Science Foundation (Grant No. 2025T040ZGMK) and the National Natural Science Foundation of China (Grant No. 52174187).

Data Availability Statement

The data used to support the findings of this study is available from the corresponding author upon request.

Conflicts of Interest

The authors declare no conflicts of interest.

References

  1. Blake, W.; Hedley, D.G.F. Rockbursts: Case Studies from North American Hard-Rock Mines; Society for Mining, Metallurgy, and Exploration: New York, NY, USA, 2003. [Google Scholar]
  2. Kaiser, P.K.; Tannant, D.D.; McCreath, D.R. Canadian Rockburst Support Handbook; Geomechanics Research Centre, Laurentian University: Sudbury, ON, Canada, 1996. [Google Scholar]
  3. Singh, S.P. Burst energy release index. Rock Mech. Rock Eng. 1988, 21, 149–155. [Google Scholar] [CrossRef]
  4. Kidybiński, A. Bursting liability indices of coal. Int. J. Rock Mech. Min. 1981, 18, 295–304. [Google Scholar] [CrossRef]
  5. Russenes, B.F. Analysis of Rock Spalling for Tunnels in Steep Valley Sides. Master’s Thesis, Department of Geology, Norwegian Institute of Technology, Trondheim, Norway, 1974. [Google Scholar]
  6. Turchaninov, I.A.; Markov, G.A. Conditions of changing of extra-hard rock into weak rock under the influence of tectonic stresses of massifs. In Proceedings of the International Symposium on Weak Rock, Tokyo, Japan, 21–24 September 1981; pp. 555–559. [Google Scholar]
  7. Hoek, E.; Brown, E.T. Empirical strength criterion for rock masses. J. Geotech. Eng. Div. 1980, 106, 1013–1035. [Google Scholar] [CrossRef]
  8. Barton, N.; Lien, R.; Lunde, J. Engineering classification of rock masses for the design of tunnel support. Rock Mech. 1974, 6, 189–236. [Google Scholar] [CrossRef]
  9. Hou, F.; Liu, X.; Wang, M. Re-analysis of rockburst mechanism and discussion on the gradation of the rockburst intensity. In Proceedings of the Third National Conference on Rock Dynamics, Wuhan, China, 8–14 November 1992; Wuhan University of Mapping Technology Press: Wuhan, China, 1992; pp. 448–457. [Google Scholar]
  10. Lu, J. Numerical simulation and prediction of rockburst. In Proceedings of the Third National Conference on Rock Dynamics, Wuhan, China, 8–14 November 1992; pp. 436–447. [Google Scholar]
  11. Tao, Z. Rockburst and its evaluation method in high ground stress field. Yangtze River 1987, 18, 25–32. [Google Scholar]
  12. Xu, L.; Wang, L.; Li, T.; Xu, J.; Jin, X. Study on the character of rock burst and its forecasting in the Erlang mountain tunnel. J. Geol. Hazards Environ. Preserv. 1999, 10, 55–59. [Google Scholar]
  13. Tan, Y. Rockburst characteristics and structural effects of rock mass. Sci. China Ser. B 1991, 35, 981–990. [Google Scholar]
  14. Li, M.; Zhang, G.; Chen, J. Research on the Surface Fractal Characteristic of the Rock with Rockburst Proneness. Indones. J. Electr. Eng. Comput. Sci. 2016, 1, 349–353. [Google Scholar] [CrossRef]
  15. Zhang, C.; Yu, J.; Chen, J.; Lu, J.; Zhou, H. Evaluation method for potential rockburst in underground engineering. Rock Soil Mech. 2016, 37, 341–349. [Google Scholar]
  16. Yin, Z.; Li, X.; Dong, L.; Jin, J.; Ma, H. Rock burst characteristics and proneness index under coupled static and dynamic loads. J. Cent. South Univ. (Sci. Tech.) 2014, 45, 3249–3256. [Google Scholar]
  17. Jia, Z.; Zhang, R.; Zhang, Y.; Gao, M.; Liu, Q.; Li, A.; Xie, J. Integrated prediction for rockburst of underground powerhouse of Houziyan hydropower station. Chin. J. Geotech. Eng. 2016, 38, 110–116. [Google Scholar] [CrossRef]
  18. Zhang, Y.; Liu, X.; Liang, Z.; Li, Z. Experimental study of rock burst precursor of granite tunnel based on multi-physical field parameters. Chin. J. Rock Mech. Eng. 2014, 33, 1347–1357. [Google Scholar] [CrossRef]
  19. Yang, F.; Zhou, H.; Lu, J.; Zhang, C.; Hu, D. An energy criterion in process of rockburst. Chin. J. Rock Mech. Eng. 2015, 34, 2706–2714. [Google Scholar]
  20. Cai, P.; Wu, A.; Wang, B.; Deng, B. A rockburst proneness index based on class II whole process curve. Chin. J. Rock Mech. Eng. 2010, 29, 3290–3294. [Google Scholar]
  21. Xu, J.; Jiang, J.; Xu, N.; Liu, Q.; Gao, Y. A new energy index for evaluating the tendency of rockburst and its engineering application. Eng. Geol. 2017, 230, 46–54. [Google Scholar] [CrossRef]
  22. Mo, C.; Tan, H.; Su, G.; Jiang, J. A New Rockburst Proneness Index Based on Energy Principle. In Proceedings of the 2014 International Conference on Civil Engineering, Energy and Environment, Chennai, India, 26–27 June 2015. [Google Scholar]
  23. Wang, J.; Park, H. Comprehensive prediction of rockburst based on analysis of strain energy in rocks. Tunn. Undergr. Space Technol. 2001, 16, 49–57. [Google Scholar] [CrossRef]
  24. Cai, M. Prediction and prevention of rockburst in metal mines–A case study of Sanshandao gold mine. J. Rock Mech. Geotech. 2016, 8, 204–211. [Google Scholar] [CrossRef]
  25. Tan, Y.; Guo, W.; Gu, Q.; Zhao, T.; Yu, F.; Hu, S.; Yin, Y. Research on the Rockburst Tendency and AE Characteristics of Inhomogeneous Coal-Rock Combination Bodies. Shock Vib. 2016, 2016, 9271434. [Google Scholar] [CrossRef]
  26. He, J.; Dou, L.; Gong, S.; Li, J.; Ma, Z. Rock burst assessment and prediction by dynamic and static stress analysis based on micro-seismic monitoring. Int. J. Rock Mech. Min. 2017, 93, 46–53. [Google Scholar] [CrossRef]
  27. Miao, S.; Cai, M.; Guo, Q.; Huang, Z. Rock burst prediction based on in-situ stress and energy accumulation theory. Int. J. Rock Mech. Min. 2016, 83, 86–94. [Google Scholar] [CrossRef]
  28. He, M.; Xia, H.; Jia, X.; Gong, W.; Zhao, F.; Liang, K. Studies on classification, criteria and control of rockbursts. J Rock Mech. Geotech. Eng. 2012, 4, 97–114. [Google Scholar] [CrossRef]
  29. Wang, Y.; Li, W.; Li, Q.; Xu, C.; Tan, G. Method of fuzzy comprehensive evaluations for rock burst prediction. Chin. J. Rock Mech. Eng. 1992, 17, 15–23. [Google Scholar]
  30. Wang, C.; Wu, A.; Lu, H.; Bao, T.; Liu, X. Predicting rockburst tendency based on fuzzy matter–element model. Int. J. Rock Mech. Min. 2015, 75, 224–232. [Google Scholar] [CrossRef]
  31. Chen, H.; Li, N.; Nie, D.; Shang, Y. A model for prediction of rockburst by artificial neural network. Chin. J. Geotech. Eng. 2002, 22, 229–232. [Google Scholar]
  32. Li, N.; Feng, X.; Jimenez, R. Predicting rock burst hazard with incomplete data using Bayesian networks. Tunn. Undergr. Space Technol. 2017, 61, 61–70. [Google Scholar] [CrossRef]
  33. Chen, P. A statistics-based projection pursuit model for prediction of rock burst grades. Electron. J. Geotech. Eng. 2016, 2, 129–137. [Google Scholar]
  34. Li, K.; He, F.; Xie, S.; Zhang, S.; Han, H.; He, Y. Optimal model of rockburst prediction based on the fuzzy neural network. In International Symposium on Rockburst and Seismicity in Mines; Mine safety and labor protection: Beijing, China, 2009; pp. 1–6. [Google Scholar]
  35. Xu, J.; Chen, J.; Liu, C.; Wang, J.; Long, G.; Li, C. Application research of DHNN model in prediction of classification of rockburst intensity. Ind. Mine Aut. 2018, 44, 84–88. [Google Scholar]
  36. Qi, F.; Feng, X. Classification and prediction of rockburst using AdaBoost combination learning method. Rock Soil Mech. 2008, 29, 943–948. [Google Scholar]
  37. Wang, Y.; Shang, Y.; Sun, H.; Yan, X. Study of prediction of rockburst intensity based on efficacy coefficient method. Rock Soil Mech. 2010, 31, 529–534. [Google Scholar]
  38. Liu, Z.; Yuan, Q.; Li, J. Application of fuzzy probability model to prediction of classification of rockburst intensity. Chin. J. Rock Mech. Eng. 2008, 27, 3095–3103. [Google Scholar]
  39. Wang, Y.; Jing, H.; Zhang, Q.; Yu, L.; Xu, Z. A normal cloud model-based study of grading prediction of rockburst intensity in deep underground engineering. Rock Soil Mech. 2015, 36, 1189–1194. [Google Scholar] [CrossRef]
  40. Shi, X.; Zhou, J.; Dong, L.; Hu, H.; Wang, H.; Chen, S. Application of unascertained measurement model to prediction of classification of rockburst intensity. Chin. J. Rock Mech. Eng. 2010, 29, 2720–2726. [Google Scholar]
  41. Dong, L.; Li, X.; Peng, K. Prediction of rockburst classification using Random Forest. Trans. Nonferrous Met. Soc. China 2013, 23, 472–477. [Google Scholar] [CrossRef]
  42. Sun, J.; Wang, L.; Zhang, H.; Shen, Y. Application of fuzzy neural network in predicting the risk of rock burst. Procedia Earth Planet. Sci. 2009, 1, 536–543. [Google Scholar] [CrossRef]
  43. Gao, W. Forecasting of rockbursts in deep underground engineering based on abstraction ant colony clustering algorithm. Nat. Hazards 2015, 76, 1625–1649. [Google Scholar] [CrossRef]
  44. Qiu, D.; Chen, J.; Wang, Q.; Zhang, J. Research on rockburst prediction with fuzzy comprehensive evaluations based on rough set. In Boundaries of Rock Mechanics; Taylor and Francis Group: Oxfordshire, UK, 2008; pp. 831–835. [Google Scholar]
  45. Adoko, A.; Gokceoglu, C.; Wu, L.; Zuo, Q. Knowledge-based and data-driven fuzzy modeling for rockburst prediction. Int. J. Rock Mech. Min. 2013, 61, 86–95. [Google Scholar] [CrossRef]
  46. Wang, M.; Jin, J.; Li, L. SPA-VFS Model for the Prediction of Rockburst. In Proceedings of the 2008 Fifth International Conference on Fuzzy Systems and Knowledge Discovery, Jinan, China, 18–20 October 2008; pp. 34–38. [Google Scholar]
  47. Liu, W.; Ding, E.; Meng, X.; Yun, Y. Study on the application of a rule-based fuzzy evaluation in predicting the rock burst. In Proceedings of the 2008 10th International Conference on Control, Automation, Robotics and Vision, Hanoi, Vietnam, 17–20 December 2008; pp. 1168–1171. [Google Scholar]
  48. Guo, Y.; Jiang, F. Application of comprehensive fuzzy evaluation in burst-proneness risk of coal seam. In Proceedings of the 2009 Second International Conference on Future Information Technology and Management Engineering, Sanya, China, 13–14 December 2009; pp. 404–407. [Google Scholar]
  49. Chen, S.; Guo, Y. Application of variable fuzzy sets in classified prediction of rockburst. Chin. J. Rock Mech. Eng. 2006, 24, 4603–4609. [Google Scholar]
  50. Chen, P.; Yu, H.; Shi, H. Prediction model for rockburst based on weighted back analysis and standardized fuzzy comprehensive evaluation. Chin. J. Rock Mech. Eng. 2014, 33, 2154–2160. [Google Scholar]
  51. Zhang, B.; Dai, X. A cloud model for predicting rockburst intensity grade based on index distance and uncertainty measure. Rock Soil Mech. 2017, 38, 257–265. [Google Scholar] [CrossRef]
  52. Pei, Q.; Li, H.; Liu, Y.; Zhang, G. A grey evaluation model for predicting rockburst proneness based on combination weight and its application. Rock Soil Mech. 2014, 35, 49–56. [Google Scholar] [CrossRef]
  53. Cai, W.; Dou, L.; Si, G.; Cao, A.; He, J.; Liu, S. A principal component analysis/fuzzy comprehensive evaluation model for coal burst liability assessment. Int. J. Rock Mech. Min. 2016, 81, 62–69. [Google Scholar] [CrossRef]
  54. Zhou, K.; Yun, L.; Deng, H.; Li, J.; Liu, C. Prediction of rock burst classification using cloud model with entropy weight. Trans. Nonferrous Met. Soc. China 2016, 26, 1995–2002. [Google Scholar] [CrossRef]
  55. Guo, L.; Wu, A.; Ma, D. The method to predict rockbursts proneness based on RES theory. J. Cent. South Univ. (Sci. Technol.) 2004, 35, 304–309. [Google Scholar] [CrossRef]
  56. Wen, C. Application of attribute synthetic evaluation system in application of possibility and classification of rockburst. Eng. Mech. 2008, 25, 153–158. [Google Scholar]
  57. Gong, F.; Li, X. A distance discriminant analysis method for prediction of possibility and classification of rockburst and its application. Chin. J. Rock Mech. Eng. 2007, 26, 1012–1018. [Google Scholar] [CrossRef]
  58. Xiong, X.; Gui, G.; Xu, J.; Wang, B.; Tong, L.; Xiao, Z. Application of extension method to prediction of rockburst of underground engineering. J. Army Eng. Univ. PLA 2007, 8, 695–701. [Google Scholar]
  59. Zhao, H. Classification of rockburst using support vector machine. Rock Soil Mech. 2005, 26, 642–644. [Google Scholar]
  60. Feng, X.; Wang, Y. An expert system on assessing rockburst risks for south african deep gold mines. Int. J. Coal Sci. Technol. 1996, 2, 23–32. [Google Scholar]
  61. Chen, X.; Li, L. Prediction of tunnel rockburst based on AHP-FUZZY method. J. China Coal Soc. 2008, 33, 1230–1234. [Google Scholar] [CrossRef]
  62. Jiang, T.; Huang, Z.; Zhao, Y. Dynamically weighted grey optimization model for rockburst risk forecasting and its application to western route of south-north water transfer project. Chin. J. Rock Mech. Eng. 2004, 23, 1104–1108. [Google Scholar] [CrossRef]
  63. Khodadadi, S.A.T.; Kumar, B.D. Contractor Selection with Risk Assessment by Using AHP Fuzzy Method. Int. J. Adv. Eng. Technol. 2013, 5, 311–318. [Google Scholar]
  64. Han, Y.; Su, G.; Yuan, H.; Wang, W. A collaborative early warning method of transportation during snow disaster based on fuzzy comprehensive evaluation. In Proceedings of the 2010 Seventh International Conference on Fuzzy Systems and Knowledge Discovery, Yantai, China, 10–12 August 2010; pp. 945–951. [Google Scholar]
  65. Yoo, Y.; Song, J. Methodology to quantify rock behavior around shallow tunnels by analytic hierarchy process and fuzzy Delphi method. Geosystem Eng. 2008, 11, 29–36. [Google Scholar] [CrossRef]
  66. Ye, S.; Tang, H.; Chen, H.; Zhu, H. Stability evaluation of rockfall based on AHP-Fuzzy method. In Proceedings of the 2010 Seventh International Conference on Fuzzy Systems and Knowledge Discovery, Yantai, China, 10–12 August 2010; pp. 1369–1373. [Google Scholar]
  67. Ren, Y.; Xiao, Y. Application of analytic hierarchy process to the campus fire hazard analysis. Saf. Environ. Eng. 2008, 15, 85–88. [Google Scholar]
  68. Liang, Z.; Dong, C.; Tian, J.; Yu, D.; Ma, K. Component weight factor determination of the nature gas compressor integrity assessment based on AHP. J. Sw. Petrol. Univ. (Sci. Tech. Ed.) 2014, 36, 176–184. [Google Scholar]
  69. Hu, W.; Long, Q.; Qian, M.; Liu, G. Determination of evaluation index system weight for enterprises wastewater treatment based on AHP. Environ. Pollut. Control 2014, 36, 88–91. [Google Scholar] [CrossRef]
  70. Khan, F.; Sadiq, R. Risk-based prioritization of air pollution monitoring using fuzzy synthetic evaluation technique. Environ. Monit. Assess. 2005, 105, 261–283. [Google Scholar] [CrossRef]
  71. Saaty, T.L. Analytic Hierarchy Process. In Encyclopedia of Operations Research and Management Science; Springer Science & Business Media: New York, NY, USA, 2013. [Google Scholar]
  72. Zhao, H. Analysis of Hierarchy Procedure; Science Press: Beijing, China, 1986. [Google Scholar]
  73. Kwiesielewicz, M.; Uden, E.V. Inconsistent and contradictory judgements in pairwise comparison method in the AHP. Comput. Oper. Res. 2004, 31, 713–719. [Google Scholar] [CrossRef]
  74. Belton, V. A comparison of the analytic hierarchy process and a simple multi-attribute value function. Eur. J. Oper. Res. 1986, 26, 7–21. [Google Scholar] [CrossRef]
  75. Zhang, J.; Deng, B.; Zhu, Y. Application of Fuzzy Mathematics; China Chongqing University Publishing Company: Chongqing, China, 1991. [Google Scholar]
  76. Lin, B.; Zhou, Y.; Liu, Z. Safety System Engineering; China University of Mining and Technology Press: Xuzhou, China, 2005. [Google Scholar]
  77. Wang, E.; He, X.; Nie, B.; Liu, Z. Principle of predicting coal and gas outburstusing electromagnetic emission. J. China Uni. Min. Tech. 2000, 29, 225–229. [Google Scholar]
  78. Yin, Y. Development of program system for mine ground pressure hazard warning based on warning model mechanism. Min. Res. Dev. 2010, 30, 86–89. [Google Scholar] [CrossRef]
  79. Wang, C.; Chuai, X.; Shi, F.; Gao, A.; Bao, T. Experimental investigation of predicting rockburst using Bayesian model. Geomech. Eng. 2018, 15, 1153–1160. [Google Scholar]
  80. Zhou, G. On risk assessment and management of frost damage in a tunnel located in a cold region based on ANP and Fuzzy theory. Mod. Tunnel. Tech. 2013, 50, 60–66. [Google Scholar] [CrossRef]
  81. Li, S.; Feng, X.; Wang, Y.; Yang, N. Evaluation of rockburst proneness in a deep hard rock mine. J. Ne. Univ. (Nat. Sci.) 2001, 22, 60–63. [Google Scholar]
  82. Cai, M.; Wang, J.; Wang, S. Analysis of energy distribution and prediction of rockburst during deep mining excavation in Linglong gold mine. Chin. J. Rock Mech. Eng. 2001, 20, 38–42. [Google Scholar]
  83. Zhang, Z.; Guan, B.; Wen, H. Basic analysis of rock bursting occurrence condition. J. China Railw. Soc. 1998, 20, 82–85. [Google Scholar] [CrossRef]
  84. Kwasniewski, M.; Wang, J. 3-Dnumerical modeling and study of mine tremors associated with coal mining invicinity of major of faults. Pupls. Inst. Geophys. 1999, 22, 351–364. [Google Scholar]
  85. Deere, D.; Deere, D. The Rock Quality Designation (RQD) Index in Practice. In Rock Classification System for Engineering Purpose; American Society for Testing and Materials: Philadelphia, PA, USA, 1988; pp. 91–101. [Google Scholar] [CrossRef]
  86. Liu, Z. Technical study on the prevention and cure of rock burst. China Railw. Sci. 2001, 22, 74–76. [Google Scholar]
  87. Wang, G.; Shi, Y.; Ge, H.; Kou, J.; Shan, Z.; Zhou, C. Rock burst and classification of surrounding rock masses. J. Eng. Geo. 2006, 14, 83–89. [Google Scholar]
  88. Yang, L.; Gao, Y. The Principle of Fuzzy Mathematics and Its Applications; South China University of Technology Press: Guangzhou, China, 2001. [Google Scholar]
  89. Ding, X.; Wu, J.; Li, J.; Liu, C. Artificial neural network for forecasting and classification of rockbursts. J. Hohai Univ. 2003, 31, 424–427. [Google Scholar]
Disclaimer/Publisher’s Note: The statements, opinions and data contained in all publications are solely those of the individual author(s) and contributor(s) and not of MDPI and/or the editor(s). MDPI and/or the editor(s) disclaim responsibility for any injury to people or property resulting from any ideas, methods, instructions or products referred to in the content.

Article Metrics

Citations

Article Access Statistics

Multiple requests from the same IP address are counted as one view.