Article

A Small Linear Accelerator for Charged Microparticles

Institut für Raumfahrtsysteme, Universität Stuttgart, Pfaffenwaldring 29, 70569 Stuttgart, Germany
*
Author to whom correspondence should be addressed.
Appl. Sci. 2025, 15(21), 11709; https://doi.org/10.3390/app152111709
Submission received: 10 September 2025 / Revised: 20 October 2025 / Accepted: 28 October 2025 / Published: 2 November 2025

Abstract

Researching cosmic dust requires terrestrial facilities for accelerating analogues of different sizes and masses. To address the area of very lightweight particles, electrostatic accelerators like Van de Graaf accelerators or Linear Accelerators (LINACs) have proven adequate. This article describes the components, dimensions, working principle and attributes of a variable frequency switched 6-stage LINAC of 120 kilovolts (kV) potential based at the Institute of Space Systems, University of Stuttgart. It utilizes negative voltages, no storage capacitors, isometric drift tubes, one semiconductor-based high-voltage switch per stage and there is no voltage drop during acceleration. The particle rate can reach up to 33 particles per second. By setting a target speed window, it autonomously chooses the right number of acceleration stages to meet that requirement, if possible. Micron-sized iron particles were accelerated successfully, achieving speed increase rates of up to three times the pre-LINAC speed and a total speed of up to 1300 m per second (m/s). This platform provides a new tool for dust sensor calibration, impact physics and material surface processing due to its ability to bring particles of different charge-to-mass ratios to a defined target speed.

1. Introduction

Dust in space is a topic that has been researched since the 1950s to gain knowledge about its origins as well as to assess possible risks to artificial structures in space [1]. Terrestrial facilities for studying materials [2] and cratering [3] as well as for calibrating scientific instruments [4,5,6] are a necessity being accommodated by various sorts of particle accelerators. An overview of the most relevant accelerator types [7,8,9] and the particle mass- and speed-range they provide for experiments is given in Table 1.
Electrostatic Accelerators come in the form of megavolt-capable Van de Graaf, [10], Cockcroft–Walton or Pelletron Generator [9] accelerators. They use large tanks filled with the isolating gas sulfur hexafluoride (SF6), which is a severe greenhouse gas. Inside the tank the high voltage generator charges the terminal, in which the dust source is housed, up to several megavolts. The voltage then evenly drops off to ground along the acceleration column. It is made of a certain number of electrodes, which are connected via resistors to its neighboring electrodes. This splits the total acceleration voltage into smaller chunks. The electrodes generate a static, constant electric field that accelerates the charged dust particles. Handling those megavolt accelerators comes with challenges. First, the SF6 must be contained and kept from venting. Second, radiation control mechanisms have to be applied depending on the local administrative regulations. And third, changing the dust source takes a long time due to the filling procedure of the isolation gas. During this time, no experiments can be conducted. If particles with very small masses are required, electrostatic accelerators are the means of choice. However, if the speed does not have to reach tens of kilometers per second (km/s), a megavolt accelerator would be too costly and complex in handling. Examples for experiments that require particles in the range of only a few hundred meters per second are accelerating lunar dust analogues [11,12] or surface processing applications [13,14]. LINACs are a possibility to either expand the total accelerator potentials of megavolt accelerators [15] or to avoid the costs and challenges of operating those. The drawback of LINACs in general is a more complex hardware and control setup [16,17]. The total acceleration voltage is reached by rapidly switching lower high voltages. They are applied to electrodes, the so-called drift tubes, in a way that a passing particle always sees an accelerating electric field between two tubes. The switching happens while the particle is inside a drift tube, which acts as a Faraday cage, shielding the particle from electric fields. The maximum acceleration voltage is therefore limited only by available facility space and accuracy of the switching pulse train. The latter becomes more challenging with increasing LINAC potential due to radial focusing and phase stability issues [18,19]. At low LINAC potentials, the pulse train is generated fairly easy, and the overall setup size is small.
This article describes a newly developed 6-stage LINAC with a total potential of 120 kV. The following chapter goes over the components of the accelerator. First, the Dust Source is described, which launches the particles with an initial potential. Second, the particles themselves are described. Third, the beam detectors and the signal processing are shown. Fourth, the LINAC and its sub-components as well as its interface are presented. The last sub-chapter goes over the data recording and evaluation. After that, the results of the LINAC operation are shown. A discussion of the findings and a conclusion section are presented at the end of this paper.

2. Materials and Methods

The basic dust accelerator system consists of a dust source, including a 30 kV power supply and a pulser, a focus stage including a 30 kV power supply, and a Faraday cup detector to monitor the particle output. A vacuum system provides the necessary pressures (<1 × 10⁻⁵ millibars) to enable particles to fly without being slowed down by collisions with air molecules. The vacuum also serves as an isolating medium for the high voltages used within the dust source. A test chamber at the end of the beamline can be utilized to set up experiments that shall be hit by accelerated particles.
To extend the achievable particle energies, a LINAC can be installed into the beamline together with additional particle detectors for monitoring particle speeds before and after the LINAC (see Figure 1 and Figure 2).
The attributes of the implemented LINAC are summarized in Table 2.
The components of the dust accelerator, including the LINAC, are described in the following subsections.

2.1. Dust Source

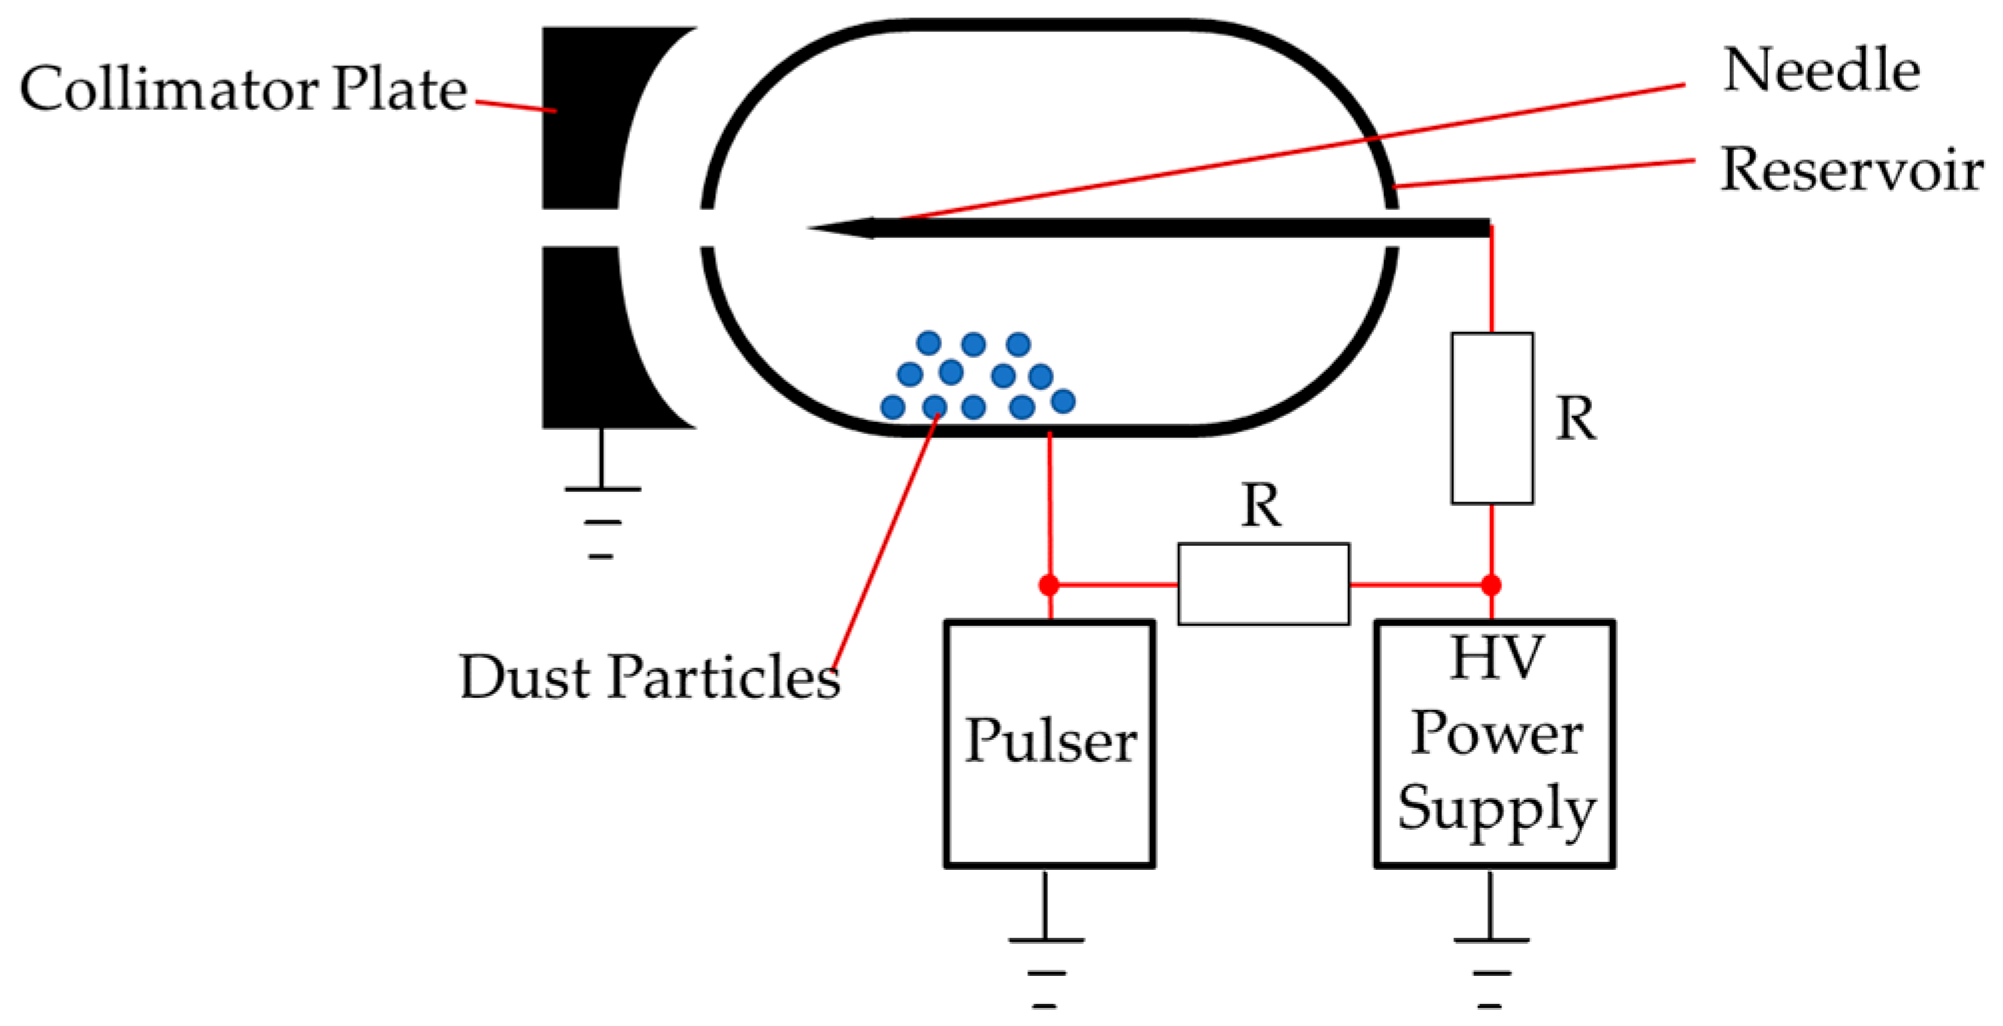
The dust source (see Figure 3) described by [20] mainly consists of three components. First, the dust reservoir. Second, the needle; and third, the collimator plate. The reservoir holds the dust particles and is connected to the pulser unit and the high voltage power supply via resistor. The needle is in the center of the reservoir and points directly to the center of the collimator plate, which has a hole in its middle. The needle is connected to the high voltage power supply by a resistor, while the collimator plate is grounded. Together, they form the electric field in which the charged particles are accelerated along the beam axis. When the pulser is turned off, the reservoir voltage is equal to the needle voltage. When turned on, the reservoir voltage can be decreased with adjustable pulse length and repetition frequency. By manually setting these variables, the dust source’s particle output frequency can be adjusted. Particles which touch the needle tip receive their final charge and are accelerated towards the reservoir’s opening and through the collimator plate into the beamline.
Located directly after the dust source is a focus structure. It uses electrostatic lenses to alter the flight path of bypassing particles, depending on their charge-to-mass ratio and acceleration potential. Examples for electrostatic lenses are a single cylinder lens or an Einzel lens [21]. To improve the particle rate, certain focal lengths can be set but it was not used in this setup due to its overall short length.

2.2. Particles

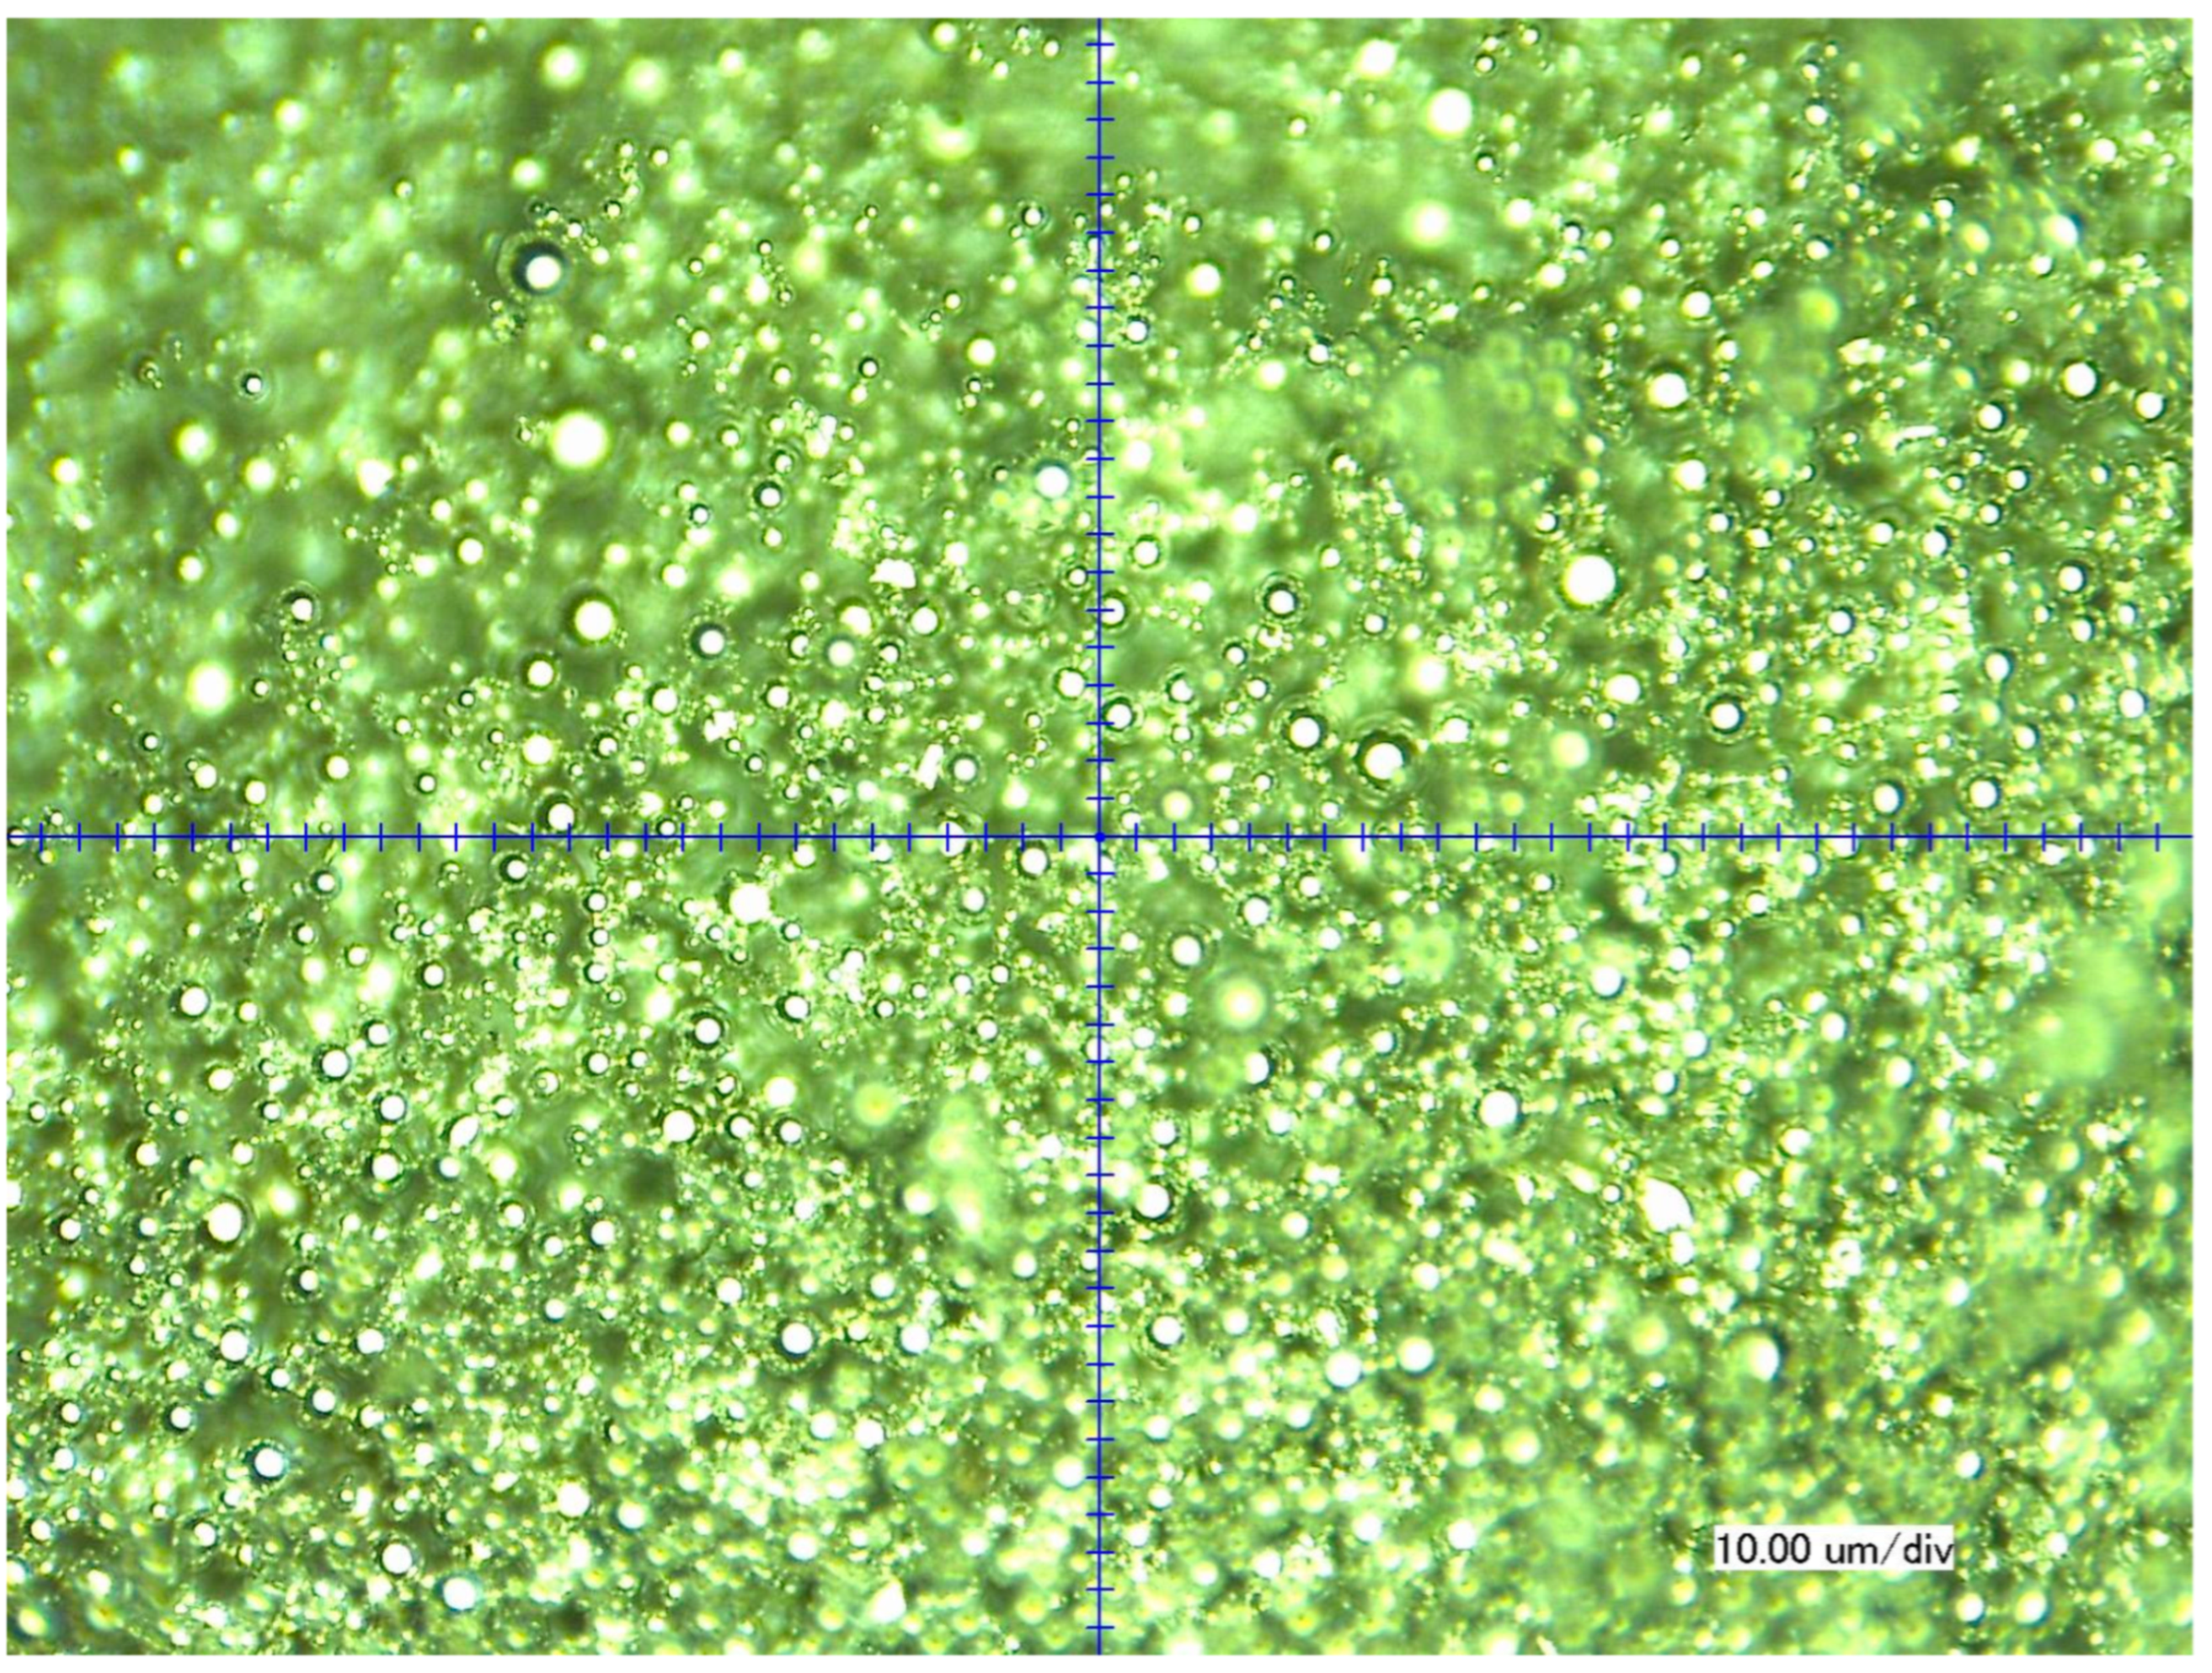
For testing the LINAC, the dust source was filled with iron particles (see Figure 4) with an average size of 1 micrometer (µm).
Hollow silver-coated glass spheres with an average size of 10 µm (see Figure 5) have also been successfully tested.
These materials were used because they are easy to accelerate with the present dust source and they were readily available. They are also used in the megavolt accelerator facility to calibrate dust sensors.

2.3. Beam Detectors

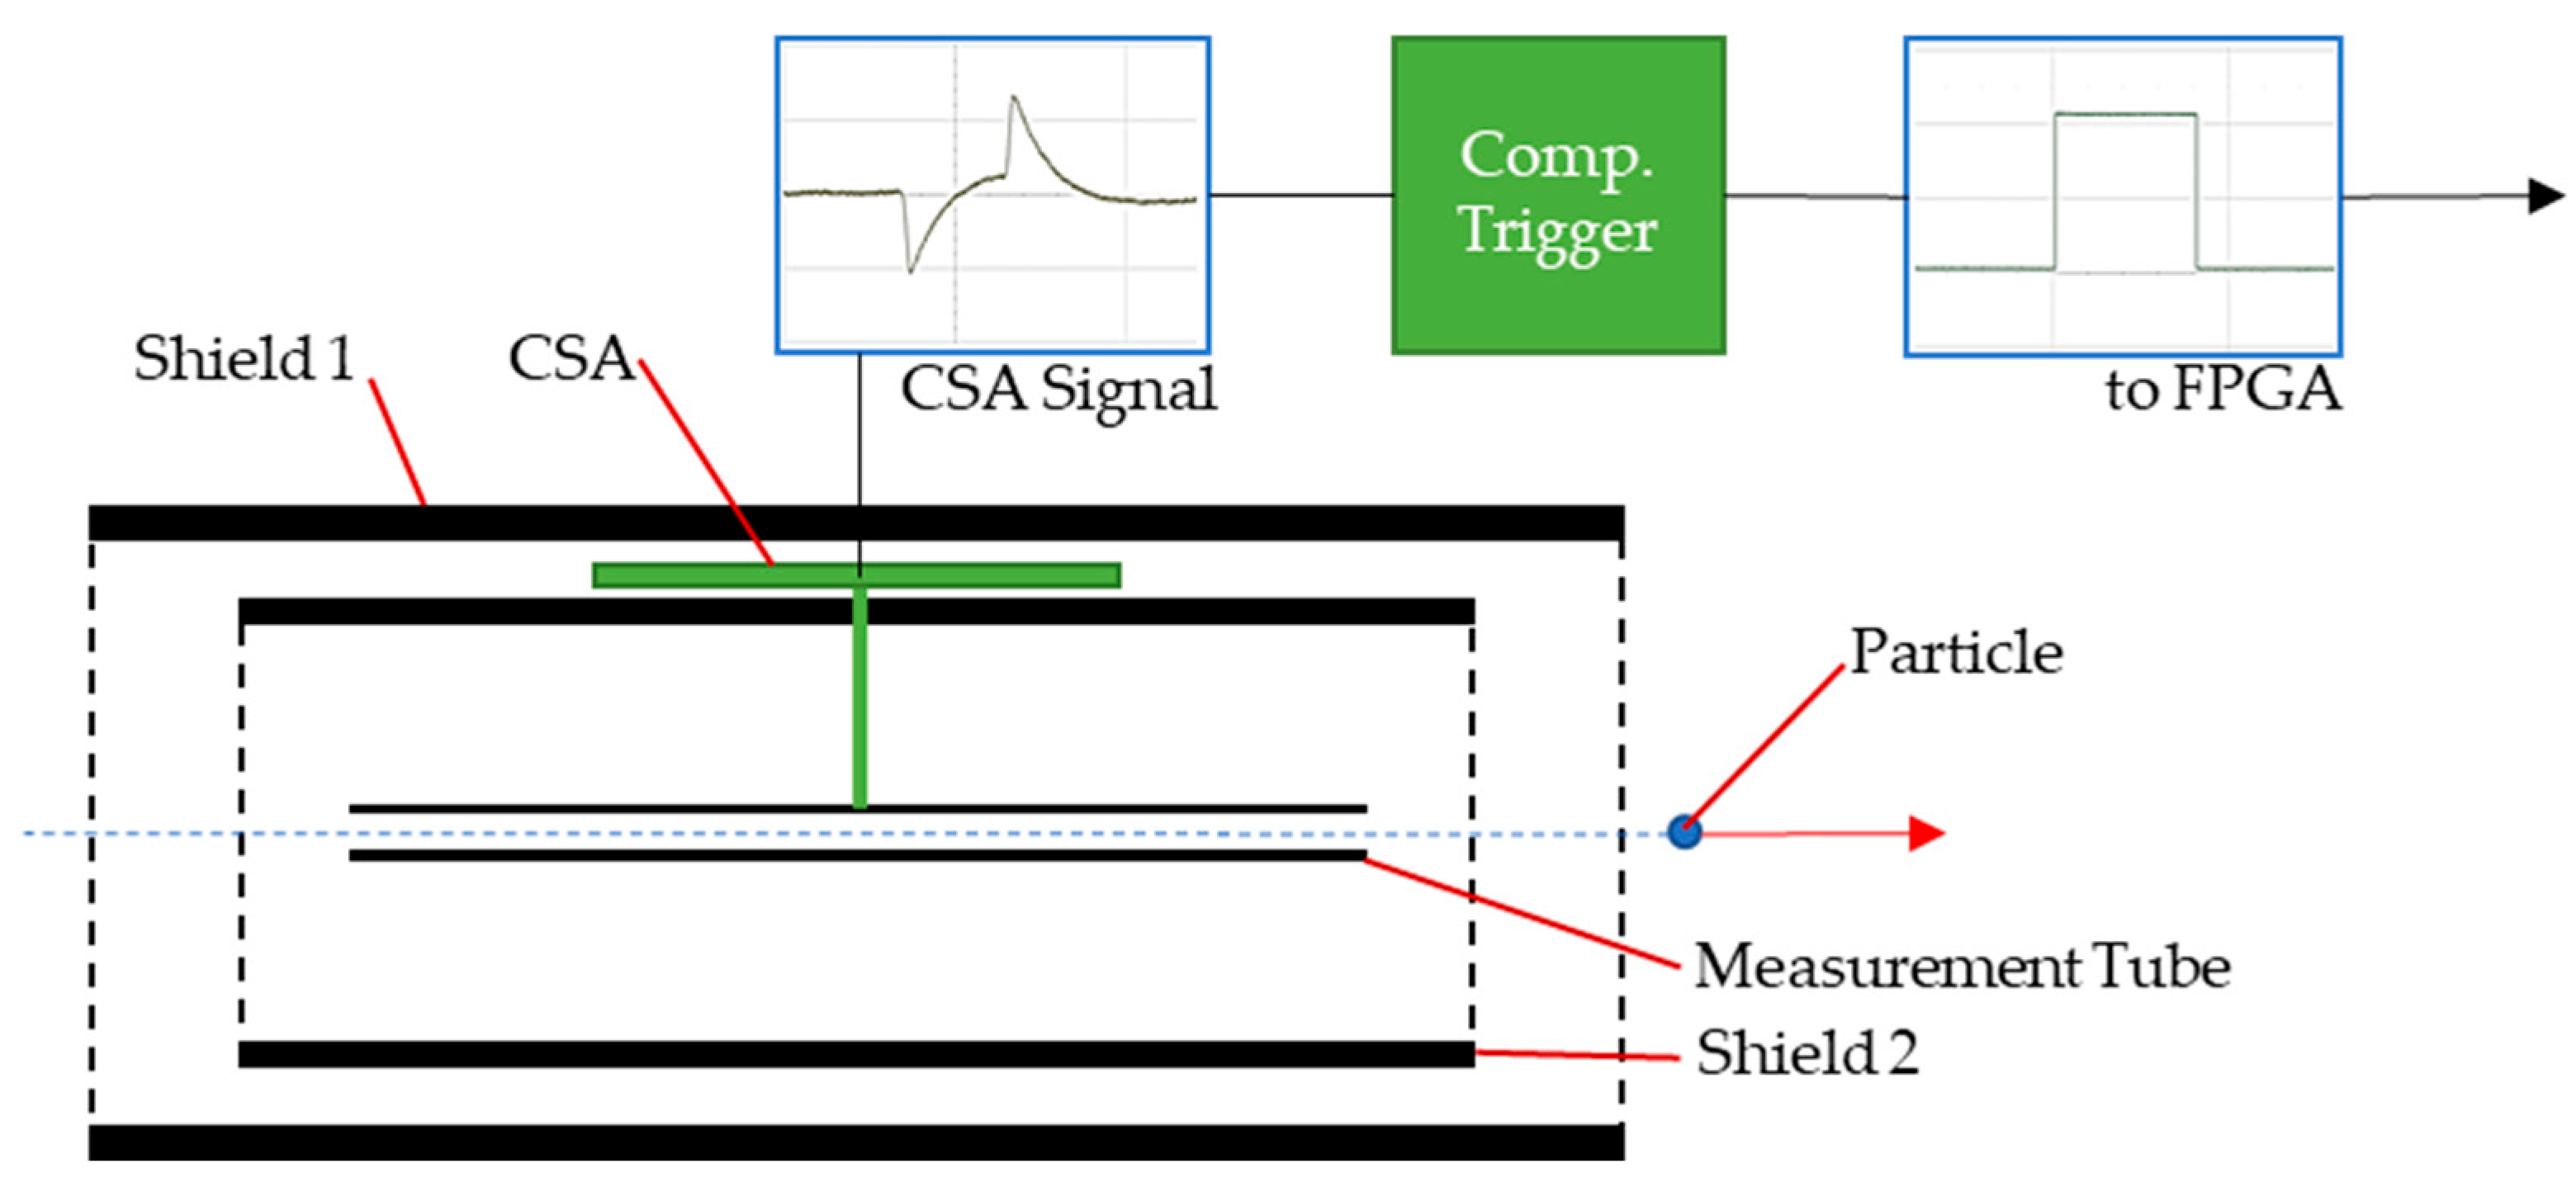
After acceleration by the dust source, the particles pass one or more beam tube detectors [22] to gain information about their speed and charge. Each detector is made of a tube with a length of 200 mm and two grounded grids at a distance of 9 mm to the tube’s ends. The tube is connected to a charge-sensitive amplifier (CSA). When a particle passes the 9 mm gap between grounded grid and tube, the CSA picks up the induced movement of the tube’s charges and converts it to a voltage signal. The voltage amplitude is proportional to the particle’s charge. The voltage is pre-processed by a comparator circuit with adjustable trigger threshold and successive monostable multivibrators to provide a defined digital output (see Figure 6).
The particle speed can be determined by measuring the time when the two detectors’ output voltages cross a preset threshold. For the LINAC setup, two equal detectors at a known distance between their entrance grids are utilized. The longer the distance, the more accurate the speed measurement will be. But the available space is limited, and particles will drop towards the earth due to gravity. The longer the flightpath is before entering the LINAC, the more severe this effect will become. The chosen distance, utilizing readily available vacuum pipes, is 835 mm. This is a good compromise given the accelerator’s length and the resulting accuracy. The speed measurement error Δv/v equals the sum of the error of the measurement section length (MSL) Δs/s and the error of the time measurement Δt/t by the LINAC system:
Δ v v = Δ s s + Δ t t
The MSL’s uncertainty results from the 9 mm gaps (Δs) of the two detectors, where the CSA signals rise when a particle flies through. By increasing the distance between the two gaps to 835 mm (s), the error becomes 1.08%. The LINAC is designed to accept particles with entrance speeds of up to 10 km/s. The sampling frequency is 100 MHz, which makes 8350 counts (t) between the two 835 mm separated detectors triggering. If it is one count (Δt) off, the resulting error is 0.012%. The total maximum speed error, therefore, is 1.1%, if there is not much signal noise which would lead to wrong particle detections. To measure the particle speed after the LINAC, a single detector with an MSL of 209 mm is used. The MSL error therefore increases to 4.3%. The LINAC is designed to allow output particle speeds of 50 km/s, which translates to 360 counts. With one count off, the resulting error is 2.8%. The theoretical total maximum speed error for the post LINAC detector is therefore 7.1%. To confirm this, tests were conducted where particles in the speed range of 95 to 388 m/s were measured by the first two and the last detector without operating the LINAC. The results show that the deviation from particle speed measurements between both detector stages is below 1%. Therefore, the accuracy of the post LINAC detector is deemed sufficient.

2.4. Linear Accelerator

A LINAC operates by providing an electric field between two electrodes to a bypassing particle. After passing the accelerating gap, the particle enters the electrode, which is field free (and therefore called a drift tube). During this time, the LINAC switches the drift tubes’ polarities so that the particle sees an accelerating electric field again when entering the next gap. This way, the targeted total acceleration potential is reached by summing smaller voltages which can be handled more easily in a laboratory environment.

2.4.1. Electrode Assembly

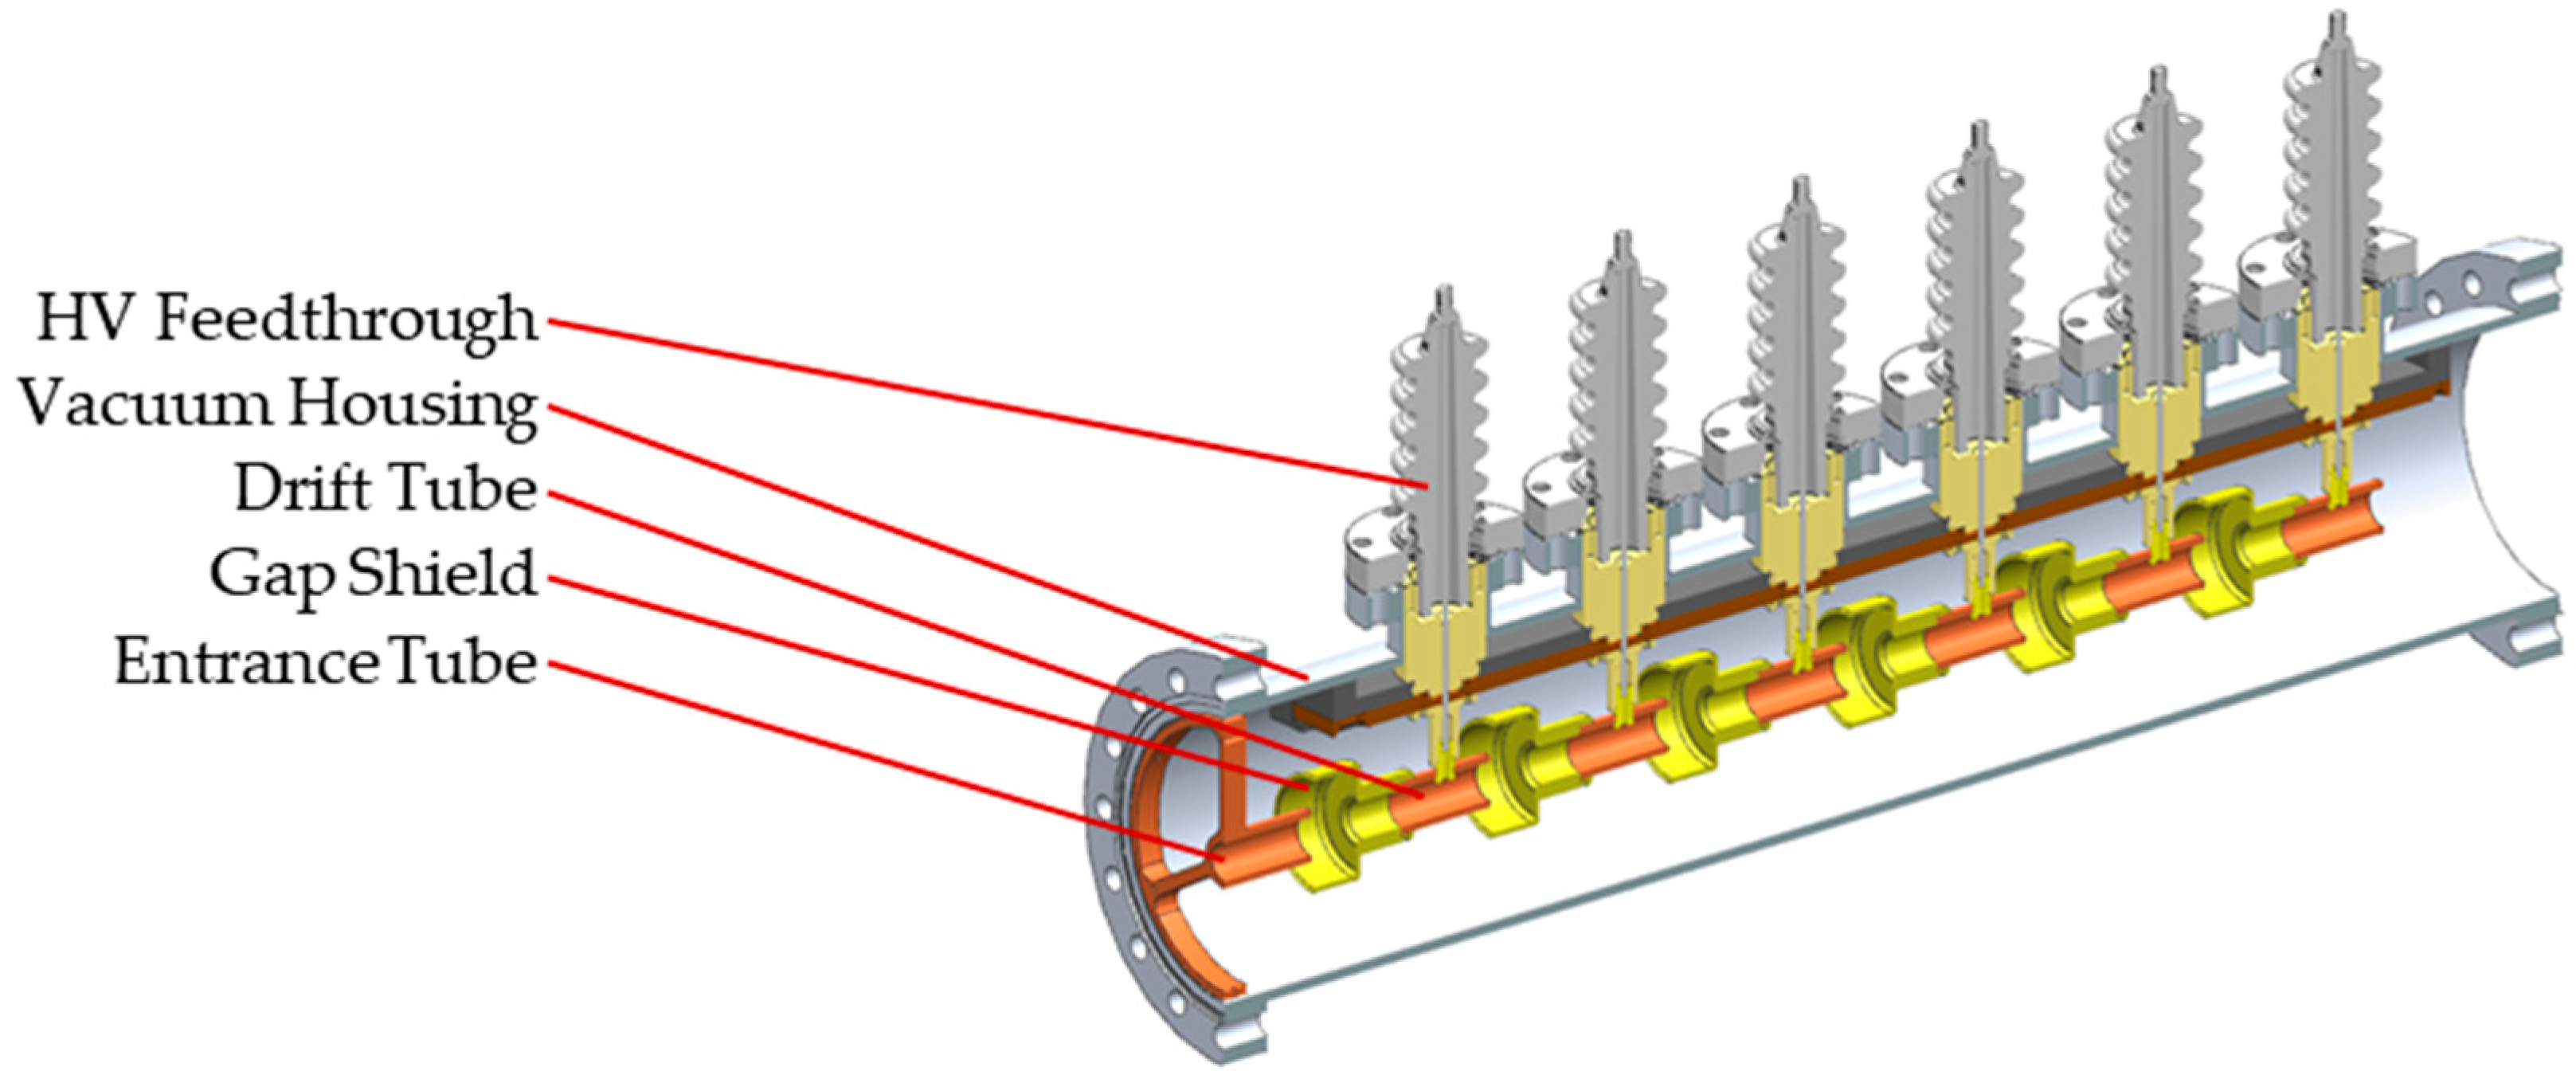
The built LINAC system consists of a drift tube assembly (see Figure 7) which is made of isometric 60 mm long tubes.
The inner diameter of the tubes is 14 mm, the outer diameter 20 mm. The tubes are separated by a gap of 20 mm. The gap is shielded by a sleeve with an inner diameter of 40 mm and an outer diameter of 44 mm. The gap shields are part of the drift tubes and hold the same potential as the tubes they are connected to. The shields are necessary to block electric cross fields stemming from the HV feedthroughs. They would apply defocusing forces onto bypassing particles. The drift tube setup is housed in a custom-made vacuum tube of 600 mm length. To fit the overall accelerator setup, it has standard flange DN100CF connectors. A polymer structure (polyether ether ketone, PEEK) isolates and aligns the drift tubes inside the vacuum tube. There are six high voltage feedthroughs with 80 mm distance in between to supply each drift tube individually. At the entrance side of the drift tube assembly, an always grounded tube segment is placed at 20 mm distance to the first high voltage capable drift tube. It produces the first acceleration gap. Shielding grids were placed at the entrance and exit of the assembly. Their purpose is to reduce electromagnetic interference (EMI) affecting adjacent detectors. EMI is generated by the high-speed high voltage switching.

2.4.2. High Voltage Supply

To provide the necessary negative high voltage, a power supply capable of providing up to ±30 kV at 2 mA maximum is used. Negative voltage was selected to be able to pre-charge the drift tubes all at once. After they successfully attracted the positively charged particles, they are simply discharged. The recharging starts as soon as the particle exits the LINAC. No capacitor-banks are necessary and there is no voltage decay at each succeeding stage. Both are known drawbacks of LINACs with push-pull switch configuration [15,16]. This different approach comes at the expense of having to use one switch, feedthrough, control circuit, etc., per acceleration stage.

2.4.3. Linear Accelerator Driver

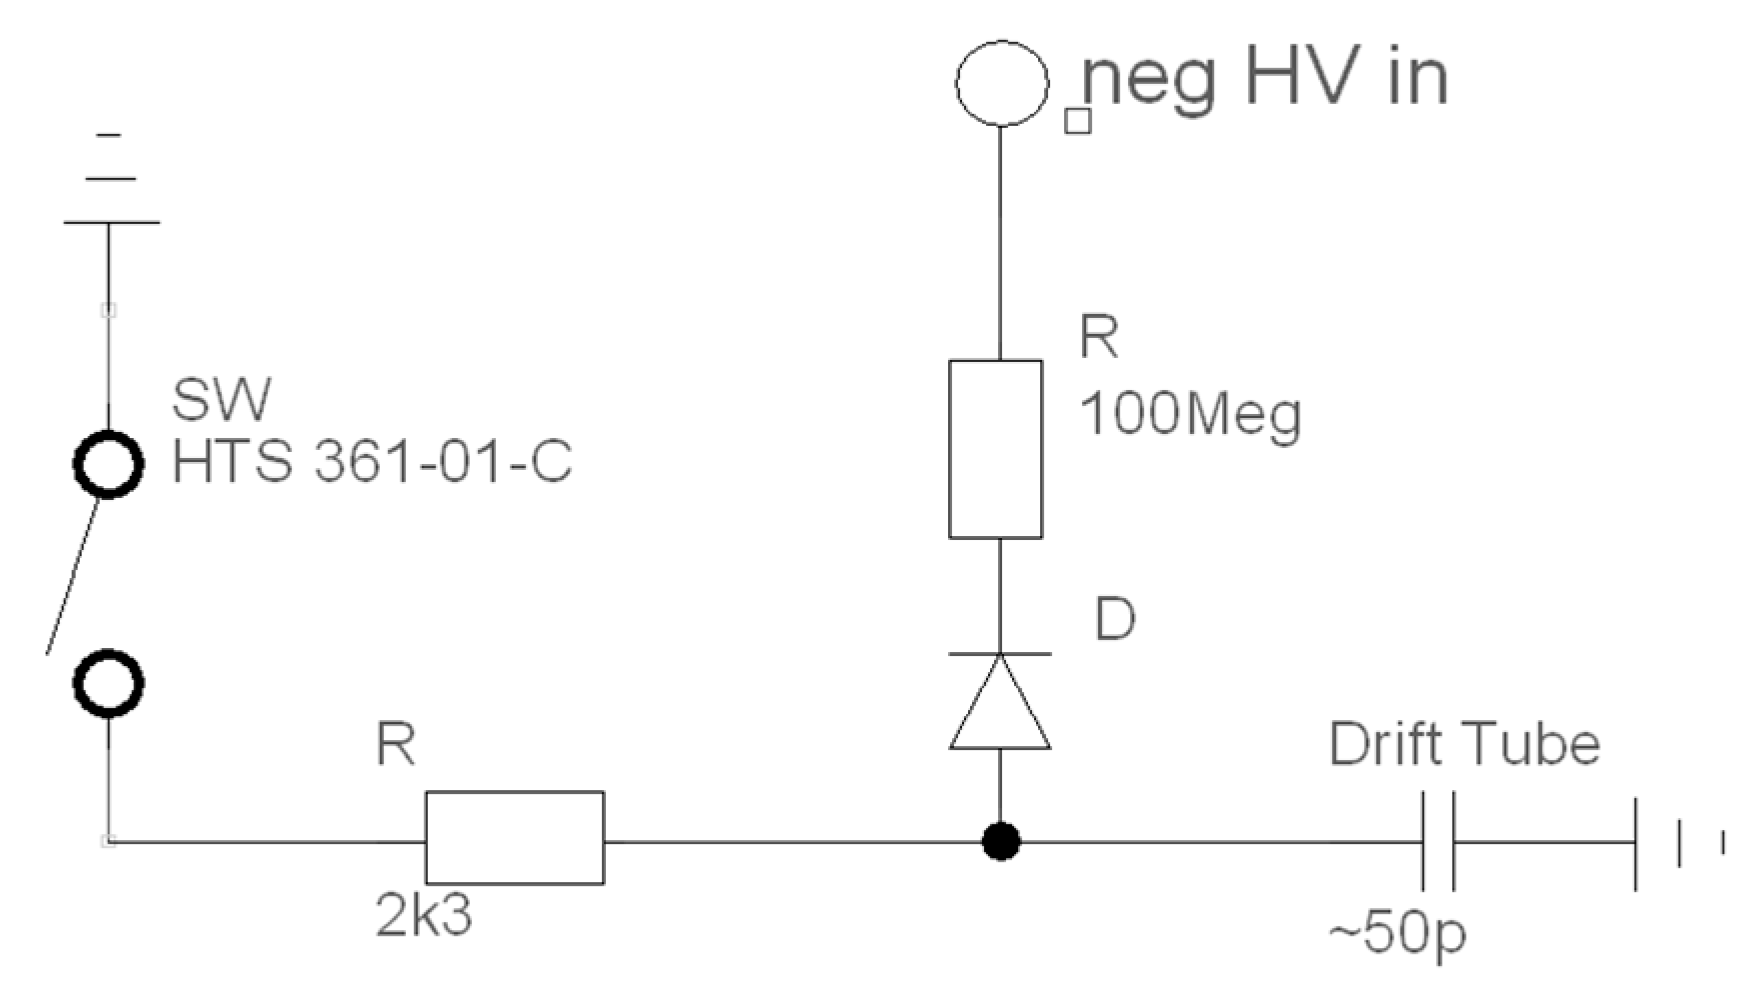
The power supply is connected to the LINAC driver (see Figure 8). It houses:
  • Behlke HTS 361-01-C (Behlke Power Electronics GmbH, 61476 Kronberg im Taunus, Germany) high voltage Metal-Oxide-Semiconductor Field-Effect Transistor (MOSFET) switches,
  • high voltage resistors,
  • high voltage diodes to prevent voltage polarity errors and discharging through unwanted current paths,
  • MOSFET-drivers, and
  • opto-couplers to reduce noise output to peripherals generated by the high-speed switching.
The current limitation at the negative high voltage input is achieved by a 100 megaohm (MΩ) resistor, taking the power supply’s limits into account. The minimum charging time is therefore 0.025 s, which results in a maximum particle rate of 40 particles per second. To allow a buffer, a recharge time of 0.03 s is set, which results in a particle rate of 33 particles per second. 2.3 kΩ protect the switch from over-currents which would damage it. It also limits the discharge time to minimum 0.6 µs. A particle in the LINAC becoming faster than 50,000 m/s will likely enter an acceleration gap before the electrode discharging has finished. The acceleration sequence would therefore slowly fall out of phase.

2.4.4. Pulse Generating Unit

The driver electronics are connected to the Pulse Generating Unit (PGU). Its main component is a Field-Programmable Gate Array (FPGA). It generates the necessary pulse train to control the LINAC Driver. The FPGA architecture was selected over alternatives like microcontroller units (MCUs) due to its ability to perform calculations and operations parallelly (versus sequentially as in MCUs). This speed advantage, compared to MCUs with similar clock rates, is necessary to complete the pulse calculation before the particle enters the LINAC. The overall setup can be kept short and there is no need to increase the length of the vacuum beam tube setup to account for calculation times. Also, clock-accurate measurements and control signal outputs are possible. For the megavolt accelerator used in our facility, the installed Particle Selection Unit (PSU) described by [23] utilizes an FPGA as well. Having the same base, those systems could be merged in the future to improve particle detection for the LINAC.
The first step to generate the pulse train is to measure the particles’ speed. This is achieved by sampling the pre-processed beam tube detectors’ outputs. To reduce noise input caused by the high voltage switching, the FPGA ground floats and its inputs and outputs are decoupled by opto-couplers. After measuring an individual particle’s speed, the FPGA calculates a tailored pulse train for this particle. Then it controls the LINAC driver, taking the delays of all electronic components in line into account. The pulse train is calculated by assuming field-free drift tubes, where the particle speed is constant, and accelerating gaps where the particle acceleration is constant. A detailed description of the pulse train calculation is given in Appendix A. Another feature that was implemented is a selectable particle target speed range. The FPGA analyzes each particle regarding its entrance speed. It calculates how many acceleration stages would be necessary to bring this particle to the desired speed range. Then it utilizes as many stages as necessary. If there is no matching number of stages, no acceleration happens. To sort those particles out safely, a deflection stage has to be implemented.

2.4.5. LINAC Control Center

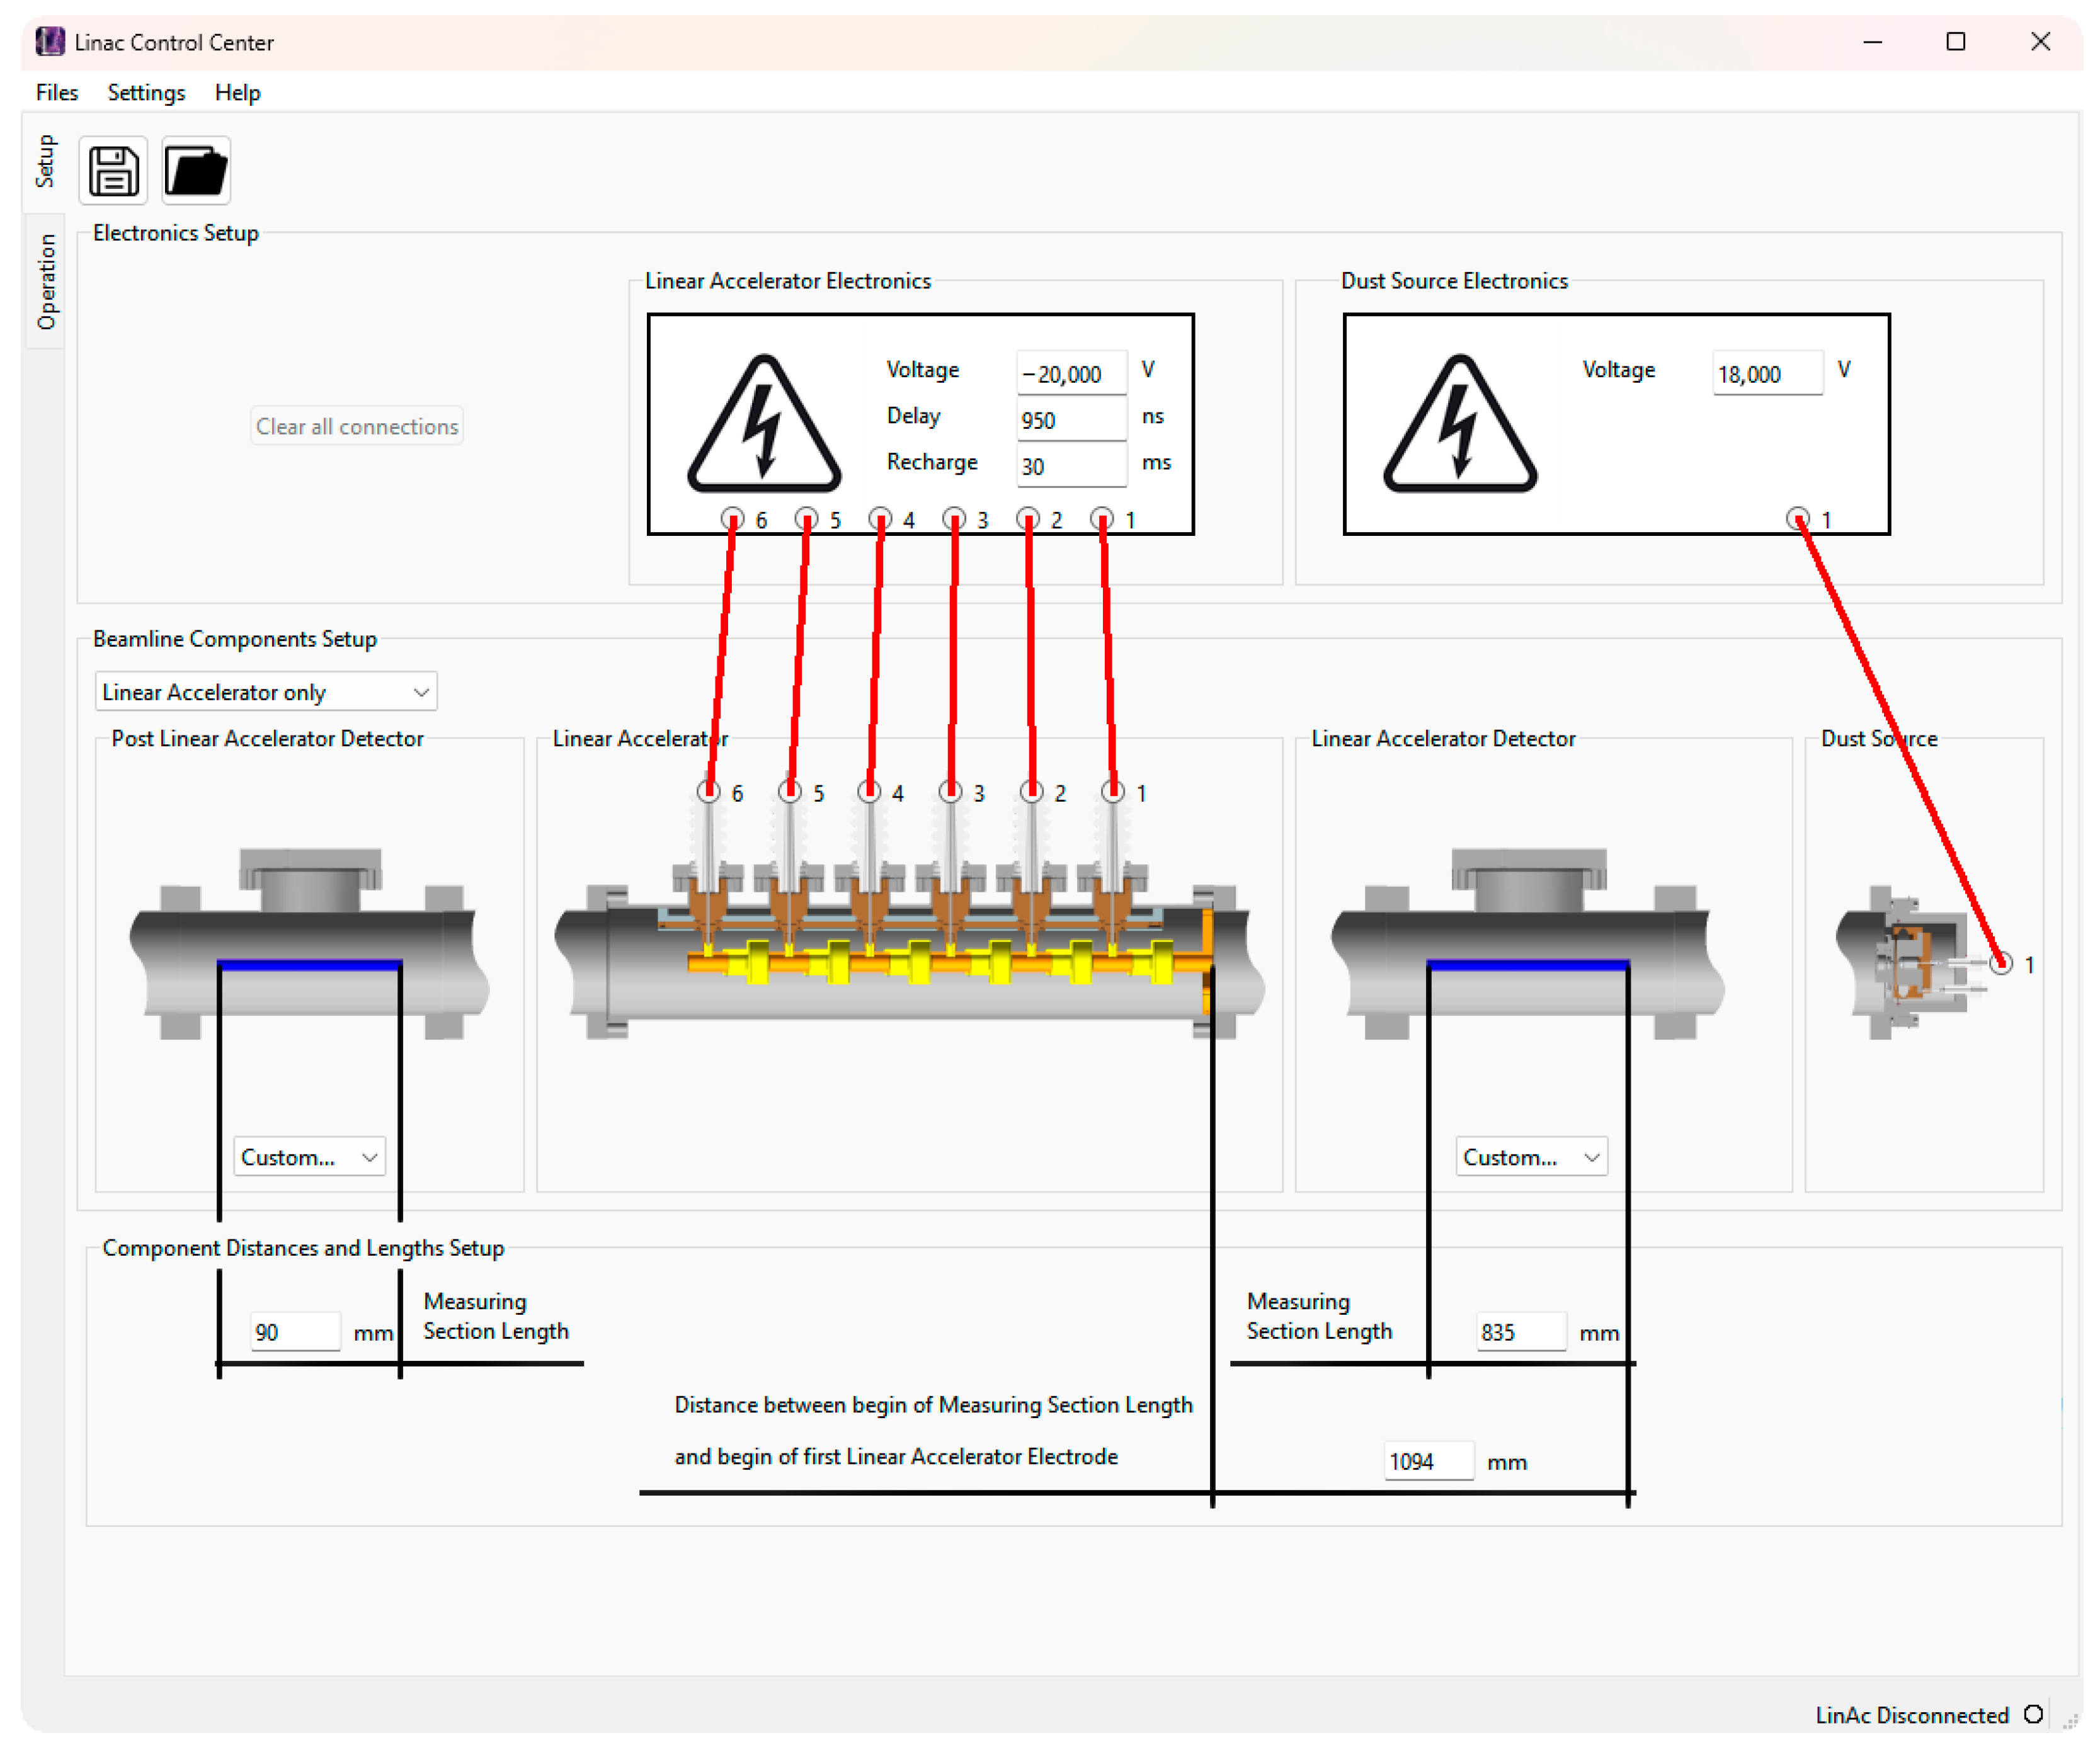
A Graphical User Interface (GUI) was implemented for easy control of the PGU parameters and to monitor the accelerated particles. It is connected via Universal Serial Bus (USB) to the PGU and is also decoupled by an opto-coupler. It is possible to set the acceleration voltages, the cabling of the LINAC driver to the drift tubes (e.g., in case of switch defect), the MSLs, the distance of the LINAC to the first MSL, electronic delays and LINAC recharge time (see Figure 9).
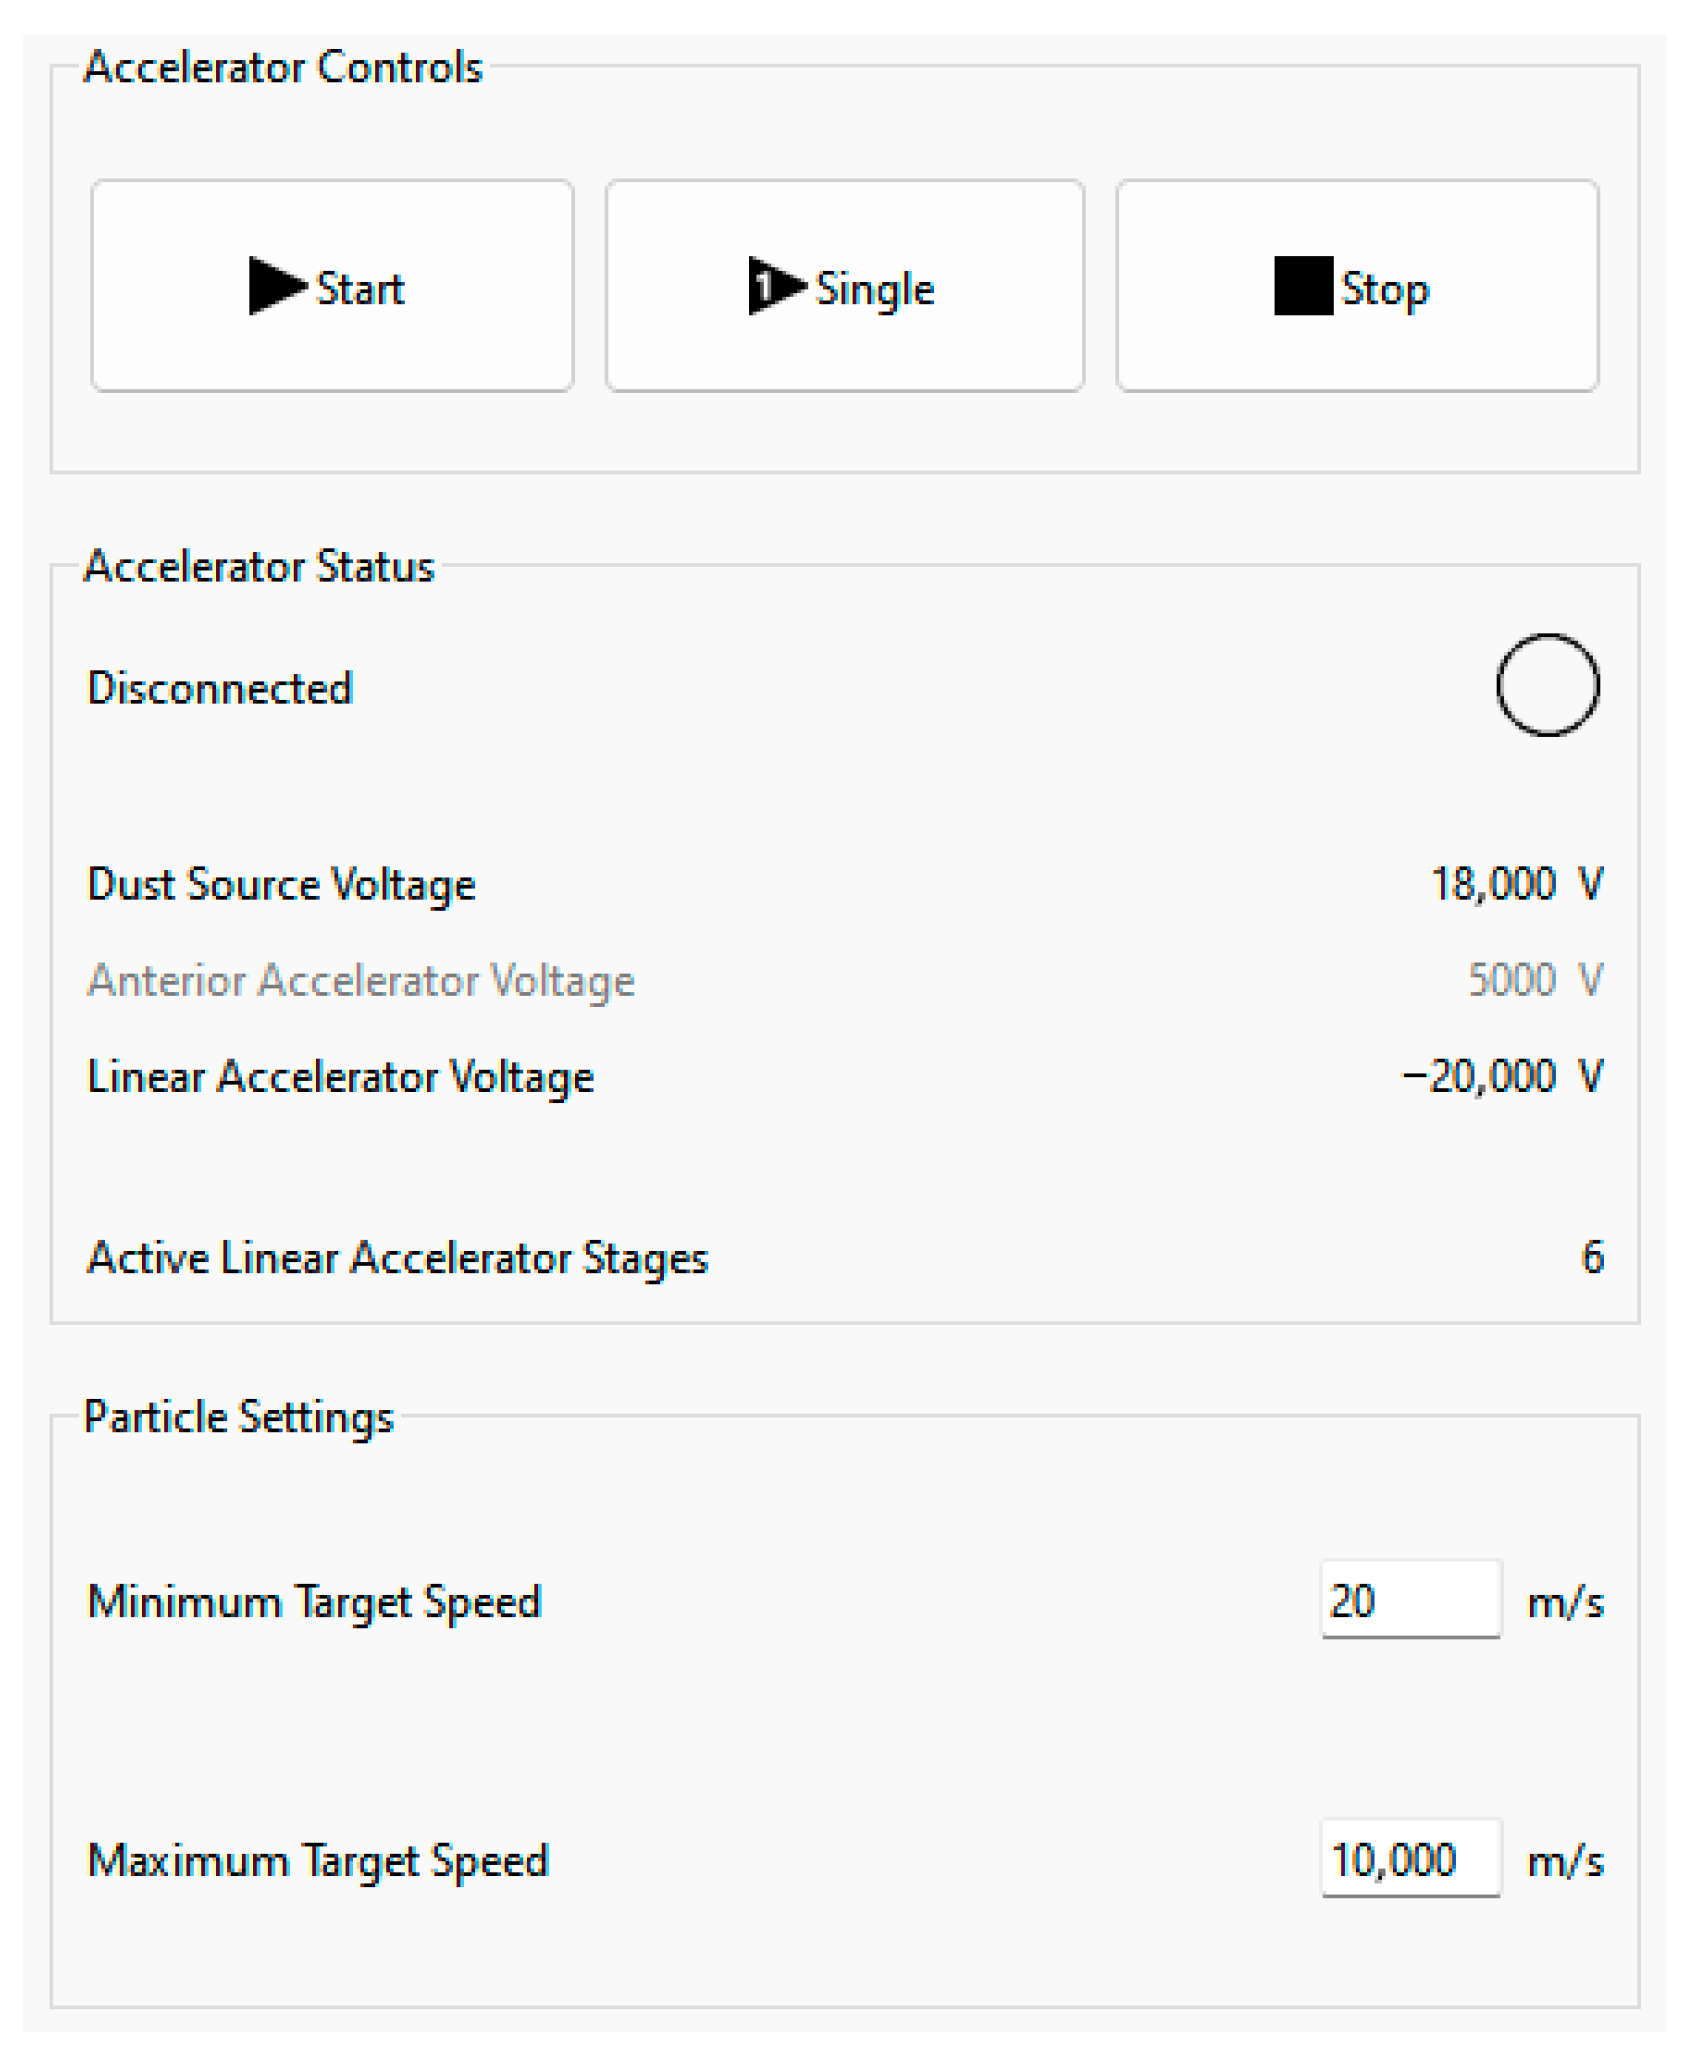
Another page allows the selection of a particle target speed range as well as the operation modes “continuous operation” and “single particle”. The latter waits until the first particle with the desired attributes was accelerated successfully and then stops operation (see Figure 10).
All settings are logged and can be saved to and recalled from a file. The speeds of each recorded particle are also saved into a file for further analysis.

2.5. Data Recording and Evaluation

To record data from the LINAC setup, the input channels 1 to 4 of a Teledyne LeCroy HDO4024 (Teledyne GmbH (European Headquarters), Heidelberg, Germany) oscilloscope are connected directly to the particle detectors’ outputs via BNC cables. The external input is connected to the PGU’s trigger output. When the PGU sends a trigger signal and the voltage at channel 4 (which is connected to the last detector) goes beyond a threshold (meaning a particle made it through the whole setup and was likely to be accelerated in the process), all traces are saved. When enough traces are recorded, they are analyzed on a computer by a script. It checks the traces for thresholds, calculates the particles’ speeds before and after the LINAC, the acceleration ratios, charges, masses and diameters and saves the results into a file.

3. Results

The described LINAC system has been set up and run-in using a dust source filled with micron-sized iron. Operation with one, two, three, four, five and six stages have been successfully tested, achieving acceleration rates between 1.4 and 3. The voltages used were 15 and 18 kV dust source voltage and −20 kV LINAC voltage per stage. Attributes of particles that were accelerated by the LINAC are shown in Table 3.
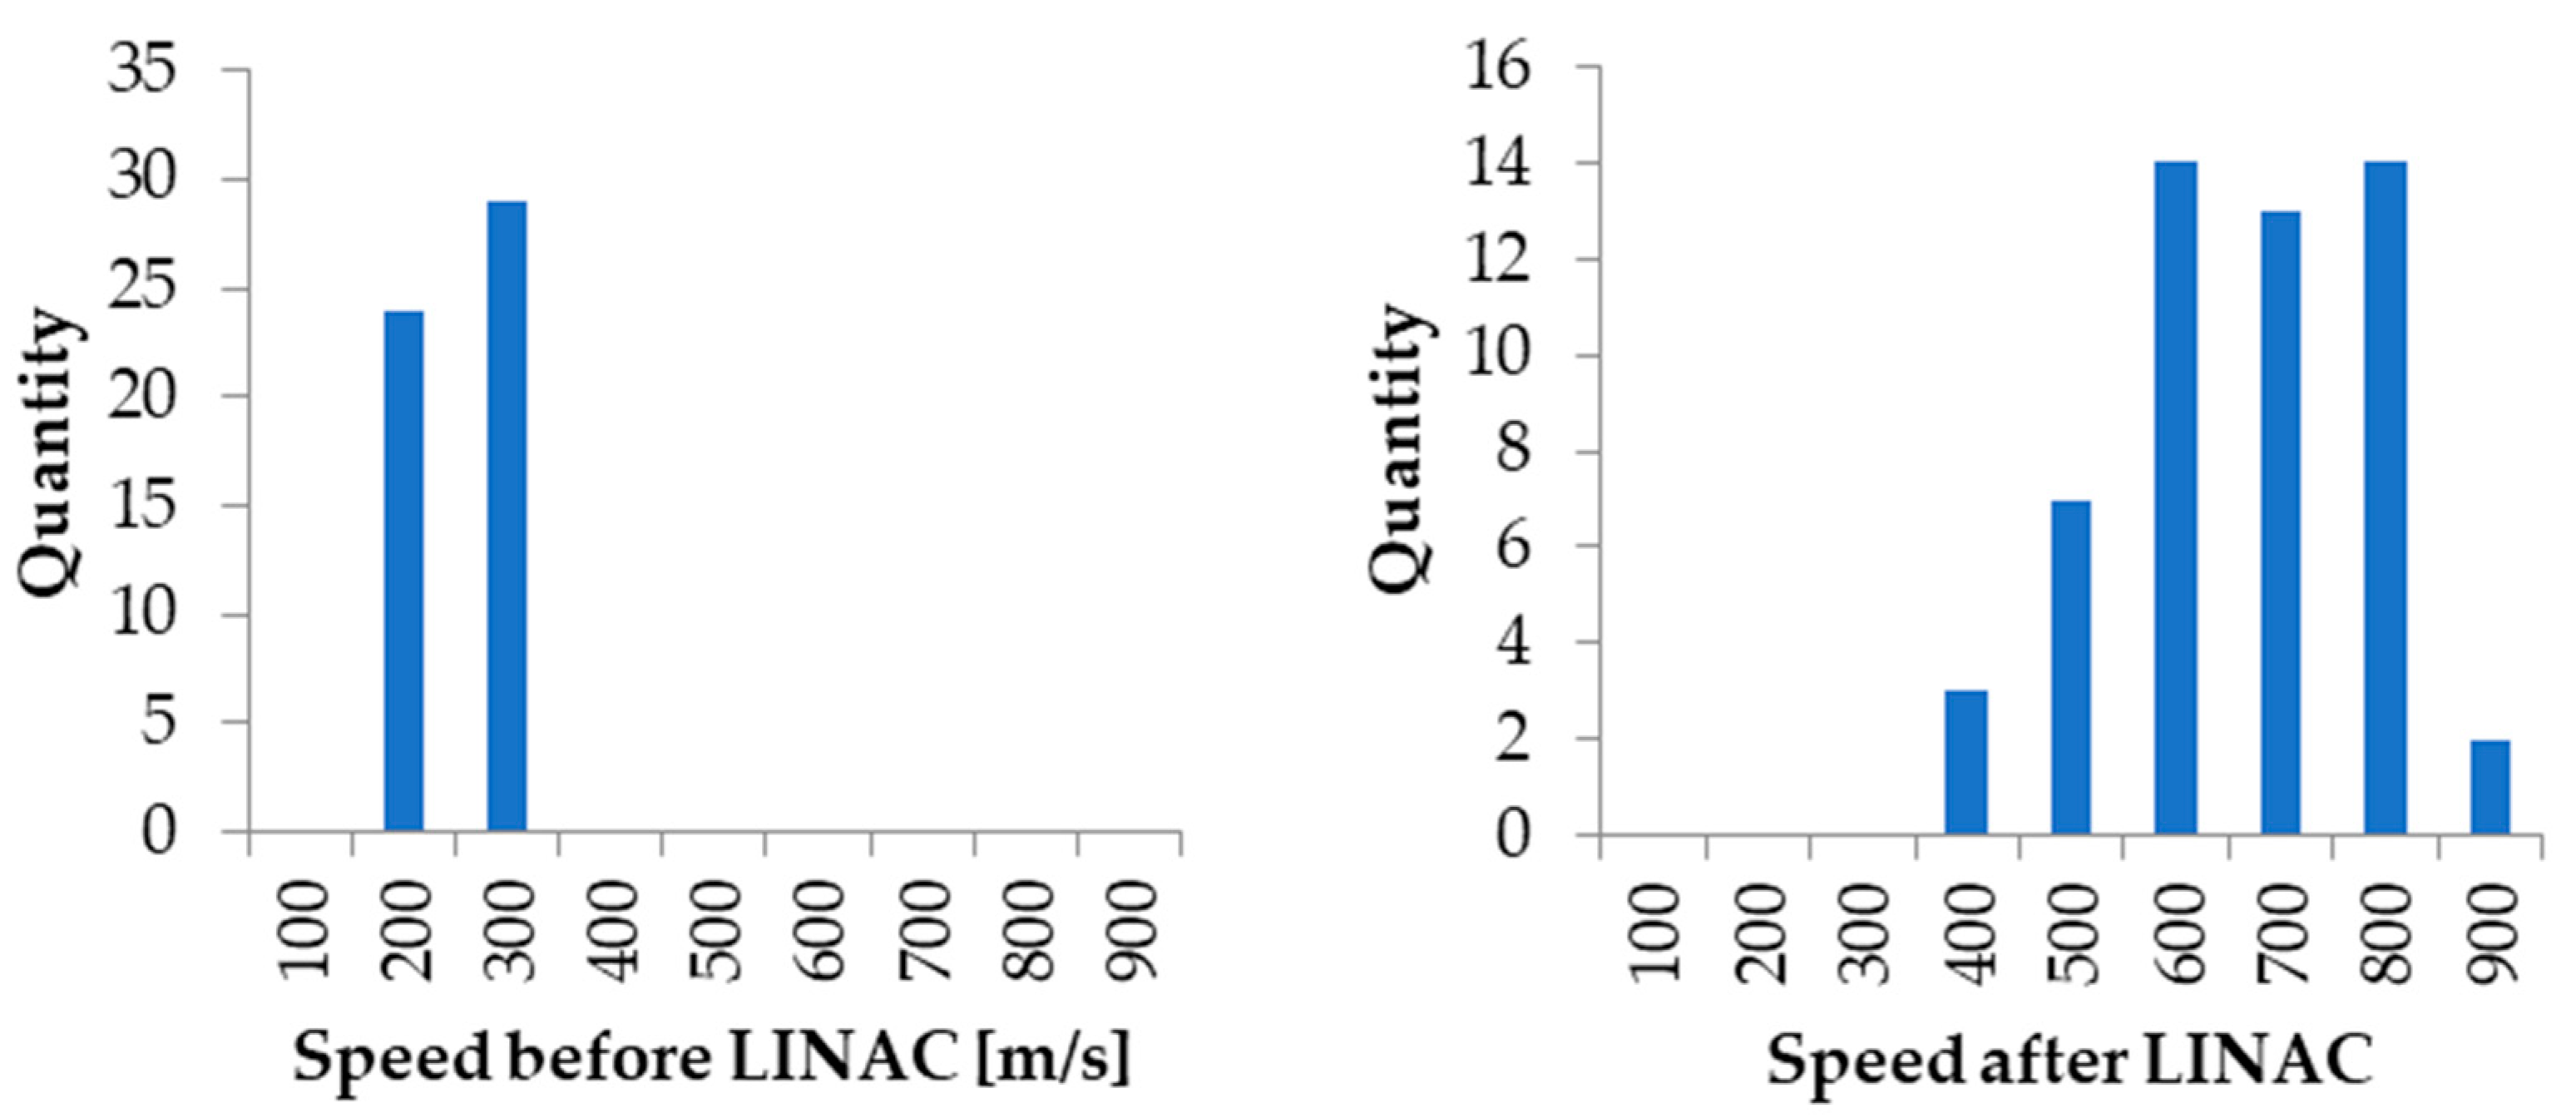
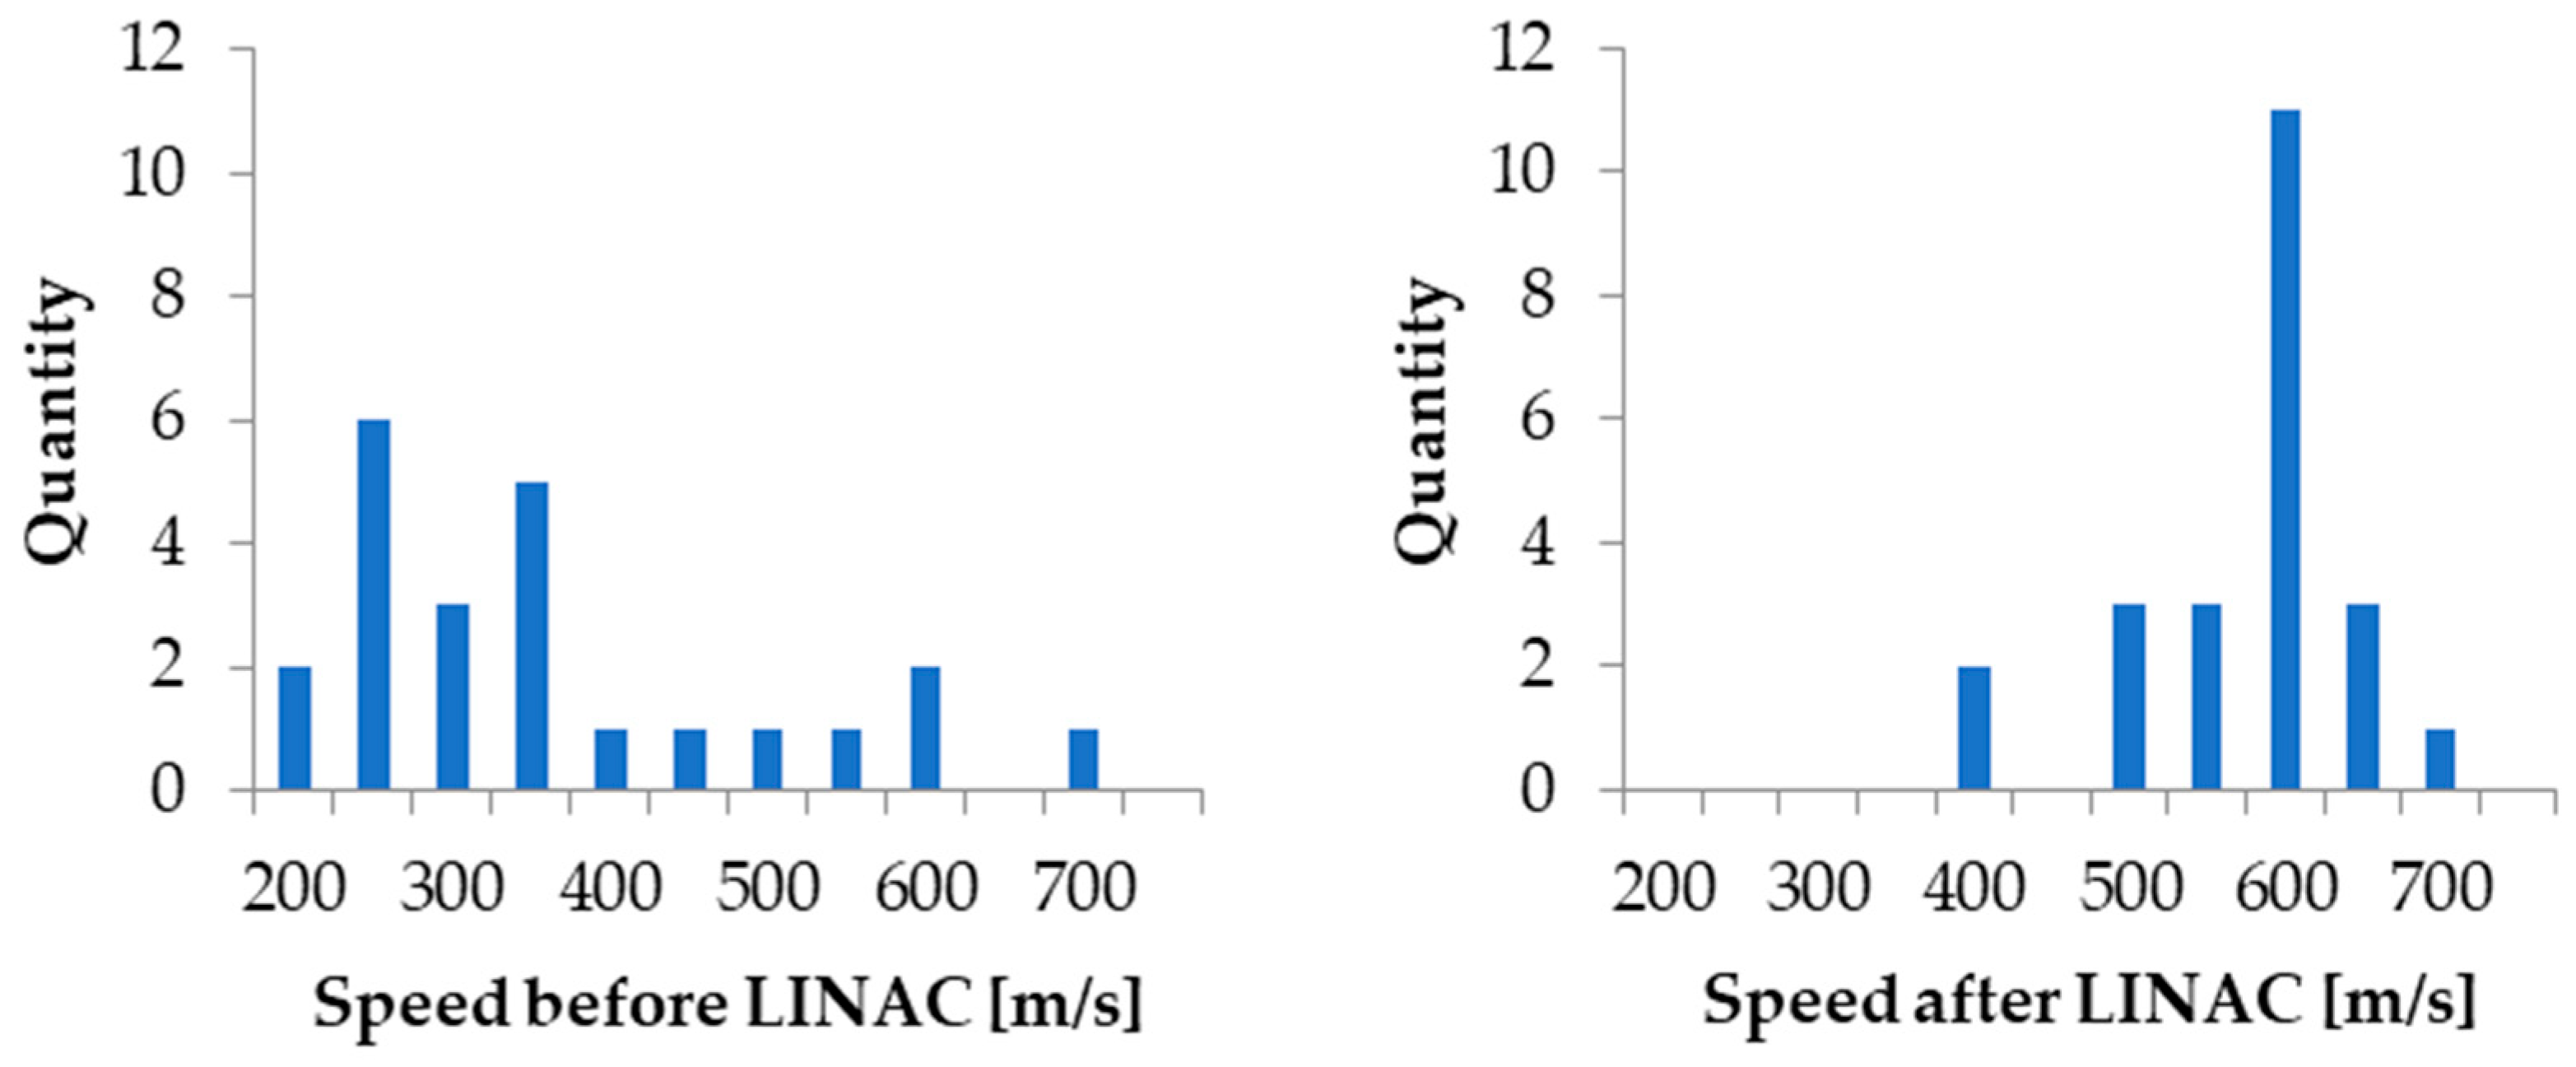
Figure 11 shows a plot of particle speed distributions before and after acceleration by the LINAC. The operation mode was 15 kV dust source voltage and −20 kV LINAC voltage per stage and 6 stages in total. The mean acceleration factor was around 2.9 and the maximum 3.
Figure 12 shows a plot of the LINAC operating at −20 kV per stage, 18 kV dust source voltage and a set particle target speed window of 500 to 600 m/s. The incoming particles’ speeds range from 180 to 680 m/s. The speeds after the LINAC bunch around the targeted speed window due to the LINAC choosing autonomously the amount of acceleration stages to use.
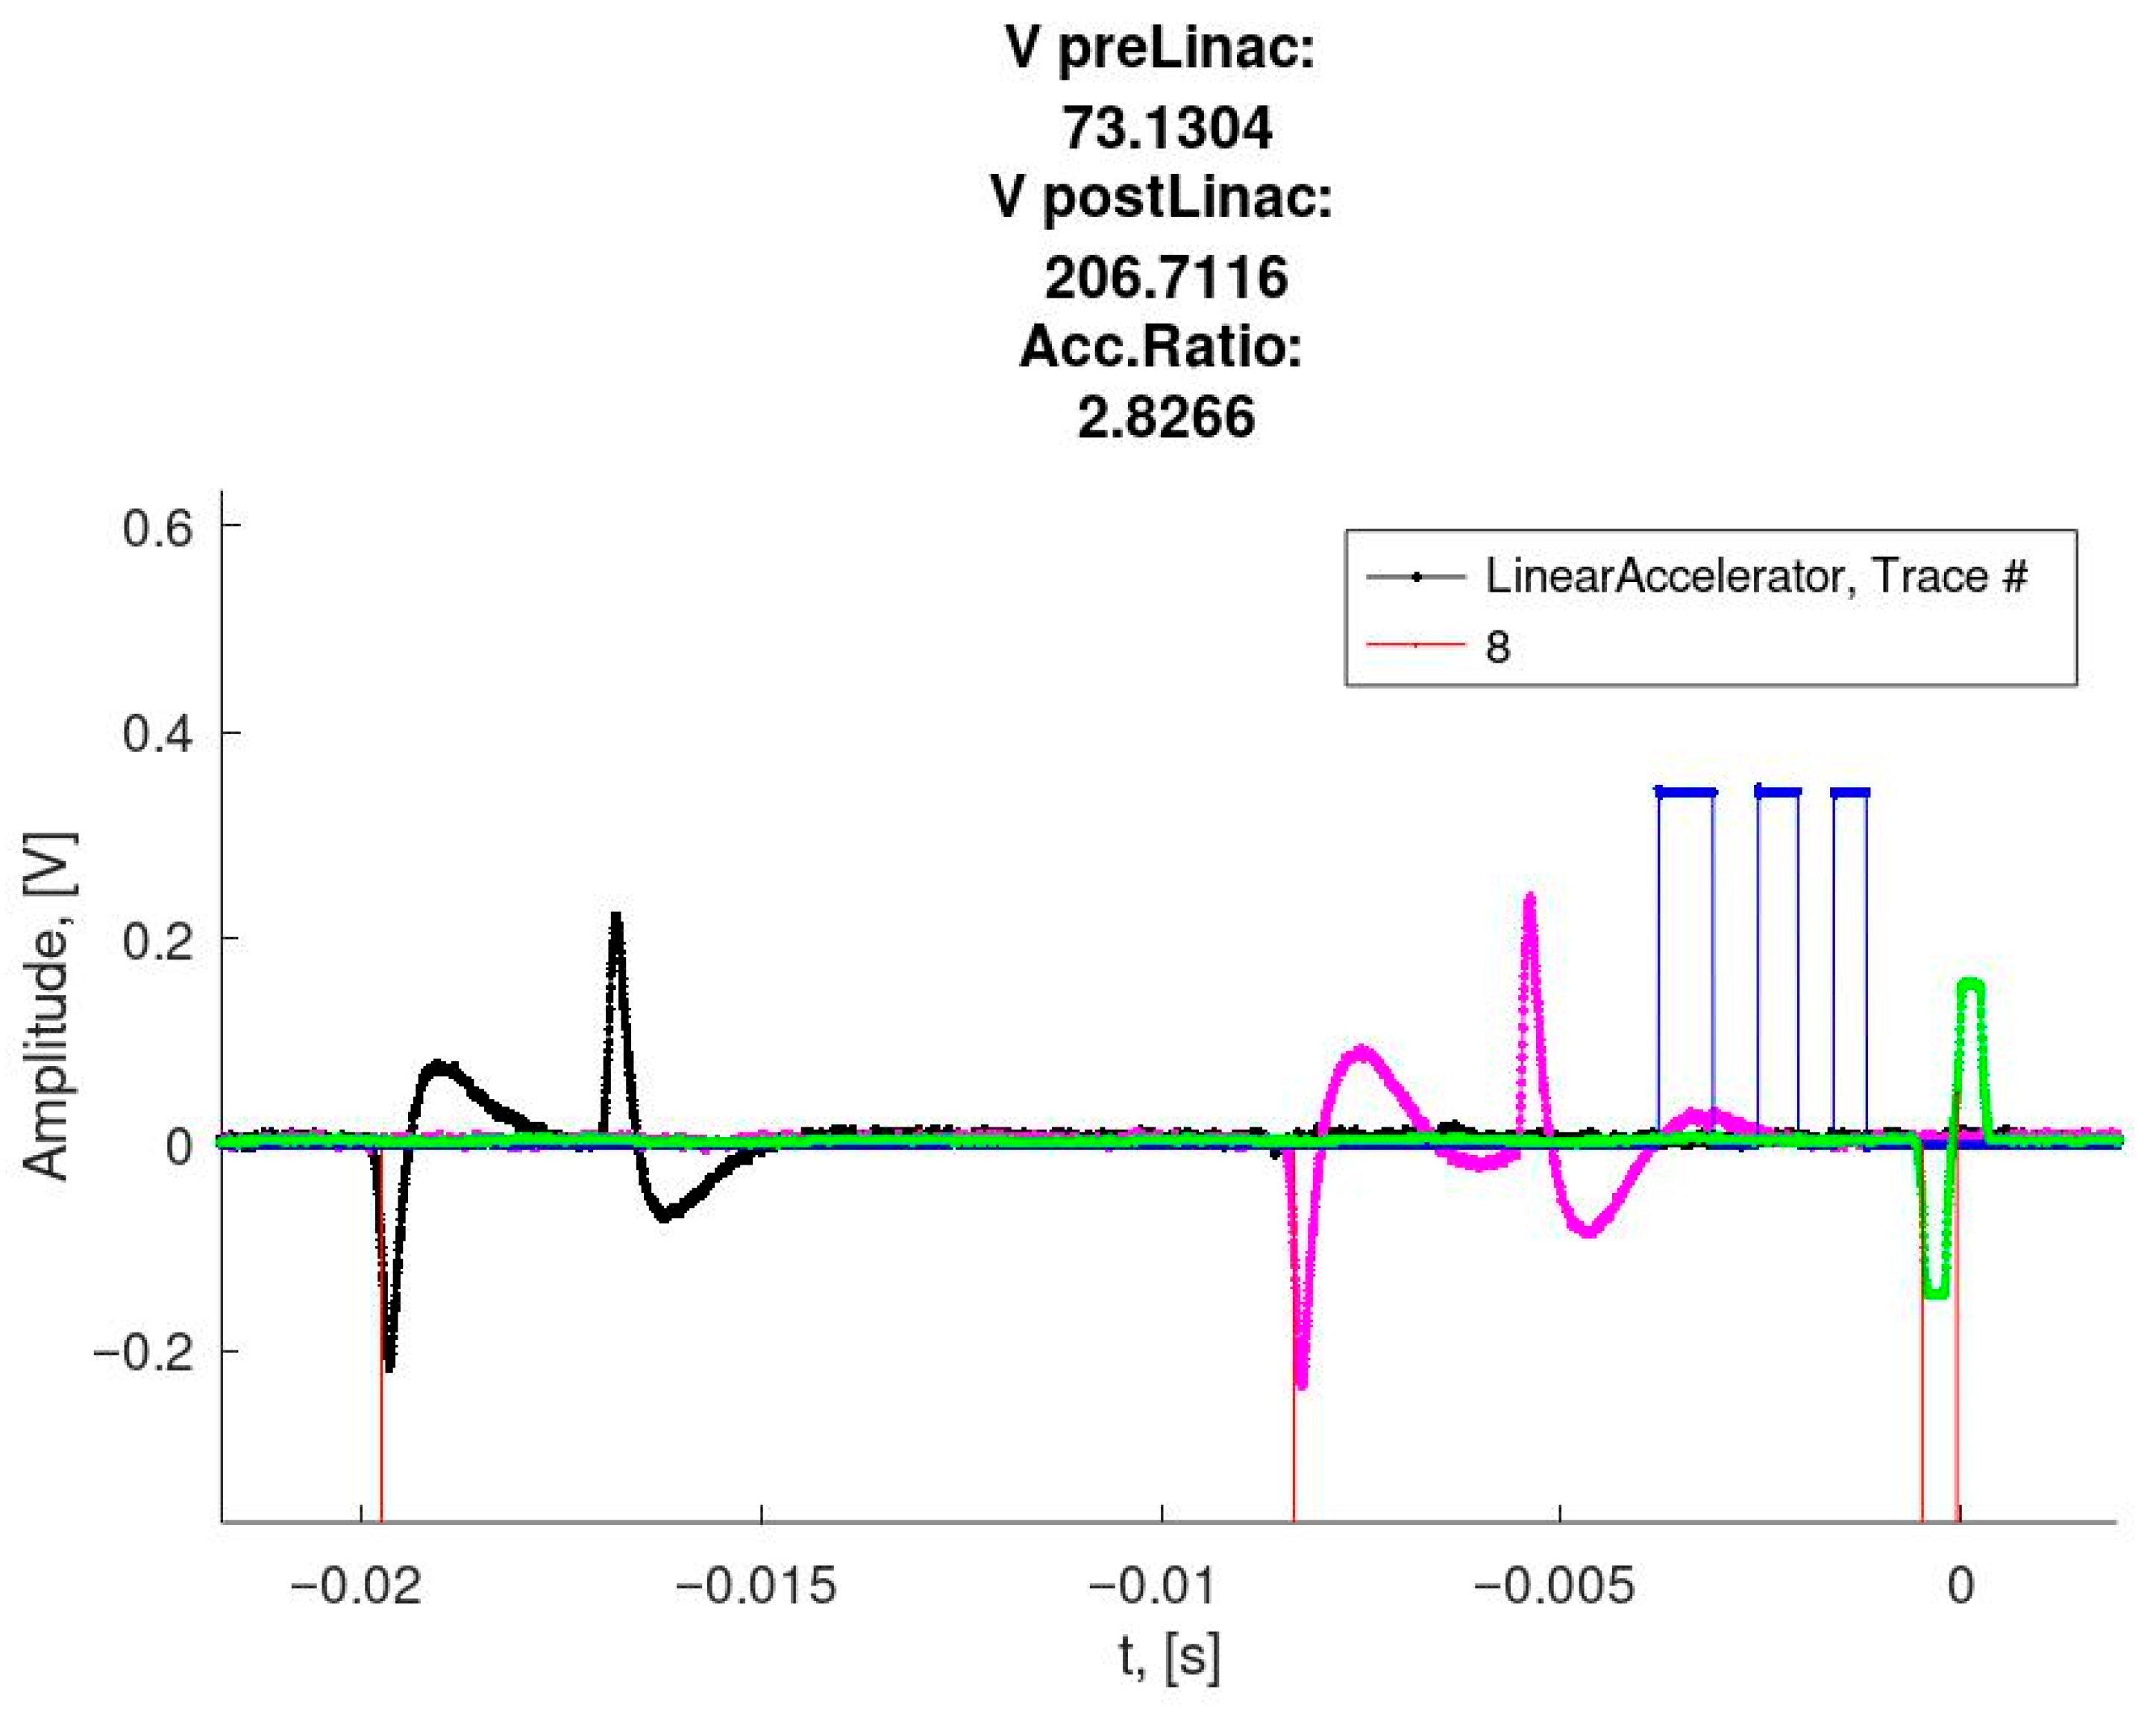
An example oscilloscope trace as recorded during tests is shown in Figure 13.
A 483 m/s particle stemming from an 18 kV dust source was detected by two single-tube beam detectors (black and magenta trace) of 835 mm distance and accelerated by six times −20 kV (high voltage switching interference can be seen on the blue trace). It then is detected again by two dual-tube differential detectors (blue and green traces) of 180 mm measuring section length. The output speed is 1335 m/s which makes an acceleration ratio of 2.8.
For better visualization and error-tracking, the FPGA also outputs the pulse train to be picked up by an oscilloscope. In Figure 14, the last detector was removed (due to limited scope channel availability) and the pulse train was inserted (blue trace).
The signal toggles each time a switching occurs. It can be seen that the time between switching events decreases over time due to isometric drift tube lengths and the particle becoming faster.

4. Discussion

Past and existing LINACs [15,16,17] are dependent on capacitor banks to store and supply a great deal of energy. They have to deal with voltage drops across succeeding acceleration stages. It takes up to a few seconds to recharge between each acceleration, which limits the particle rate. Some of them utilize old and expensive technology like vacuum tubes to switch high voltages.
The LINAC presented in this study avoids the drawbacks above by implementing novel approaches. There is one switch per stage and a pull-up configuration at the electrodes. This eliminates the need for storage capacitors, avoids the voltage drops during acceleration and enables higher recharge speeds (and therefore particle rates). The switches are based on MOSFET technology and are available on the market. The pull-up design requires one switch per stage. This leads to increasing setup costs with increasing stage count. Setups using a push–pull configuration usually require only two (more sophisticated) switches in total. The targeted maximum LINAC potential and the amount of acceleration stages was reached. The maximum particle rate has not been reached yet with this setup due to particle availability. It was not possible to generate a high flux of detectable particles to reach the limit defined by the recharging process. Also, the particles’ maximum speed range was not confirmed yet by experiments due to a lack of detectable high-speed particles. This issue might be addressed by more sophisticated particle detector signal post-processing. It can be achieved by utilizing analog-to-digital converters and digital signal processing techniques.

5. Conclusions

A new 6-stage LINAC of up to 120 kV potential was built and successfully operated. Experiments showed
  • particles in the size range of 0.6 to 1.8 µm,
  • pre-LINAC speed range of 170–530 m/s,
  • post-LINAC speed range of 200–1300 m/s,
  • LINAC potentials from 20 to 120 kV, and
  • acceleration ratios up to 3.
The LINAC utilizes
  • isometric tubes to keep it short,
  • negative voltages,
  • no capacitor banks, and
  • high voltage MOSFET switches.
It can achieve particle rates up to 33 particles per second due to a short recharging time. Also, the variable pulse trains are calculated for each passing particle individually in real-time.
The current accelerator facility supports a broad range of applications requiring high-speed particles. An example is the calibration of dust sensors [5], especially for lunar activities with expected dust speeds around hundreds of meters per second [11,12]. Another field requiring particles in the range of 500 to 1000 m/s particles is surface processing, including surface modification and micro-structuring [13,14].
Future upgrades of the LINAC may focus on integrating the PSU system described by [23] to complement and improve the particle measurement sensitivity. Combined with a deflection stage, particles can be sorted out before or after the LINAC for perfectly experiment-fitting particle attributes. Also, a pre-accelerator stage may be implemented to enable a wider array of particle sources that produce particles of unknown potential [24]. Another upgrade possibility is expanding the total acceleration potential by adding more stages to it. The electrodes’ lengths could be decreased dramatically to make the setup even shorter and allow for more potential at the same overall length. This would sacrifice the electrodes’ drift tube attributes. Together with increasing acceleration potential, challenges in terms of radial and phase stability of the particles [18,19] arise that must be addressed. Reducing the gaps between two electrodes will pose challenges in terms of high-voltage breakdowns, so a careful electrode design is crucial.

Author Contributions

Conceptualization, M.B.; methodology, M.B., Y.L., R.S., F.B., A.M., F.S., J.S. and H.S.; writing—original draft preparation, M.B., Y.L. and R.S.; writing—review and editing, M.B., Y.L. and R.S.; supervision, M.B., Y.L. and R.S. All authors have read and agreed to the published version of the manuscript.

Funding

This research has received funding from European Innovation Council and SMEs Executive Agency (EISMEA) under grant agreement No 101130639, project MADECOLD.

Institutional Review Board Statement

Not applicable.

Informed Consent Statement

Not applicable.

Data Availability Statement

The data that support the findings of this paper are available on request from the corresponding author.

Acknowledgments

The authors wish to thank the mechanical and electronics workshops for their technical support.

Conflicts of Interest

The authors declare no conflicts of interest.

Abbreviations

The following abbreviations are used in this manuscript:
[C]Coulombs
CSACharge Sensitive Amplifier
EMIElectromagnetic Interference
FPGAField-Programmable Gate Array
GUIGraphical User Interface
HVHigh Voltage
[kg]Kilograms, 1 kg = 1000 g
[km/s]Kilometers per Second, 1 km/s = 1000 m/s
[kV]Kilovolts, 1 kV = 1000 V
LCCLINAC Control Center
LINACLinear Accelerator
[m/s]Meters per Second
[mA]Milliamperes, 1 mA = 0.001 A
[mbar]Millibars, 1 mbar = 0.001 bar
[MHz]Megahertz, 1 MHz = 1 × 10⁶ Hz
[µm]Micrometers, 1 µm = 1 × 10⁻⁶ m
[µs]Microseconds, 1 µs = 1 × 10⁻⁶ s
MOSFETMetal-Oxide-Semiconductor Field-Effect Transistor
MSLMeasuring Section Length
[Ω]Ohms, 1 Ω = 1 × 10⁻³ kΩ = 1 × 10⁻⁶
PEEKPolyether Ether Ketone
PGUPulse Generating Unit
PSUParticle Selection Unit
[s]Seconds
SF6Sulfur Hexafluoride
TOFTime Of Flight
USBUniversal Serial Bus

Appendix A

The calculation steps necessary for generating a particle-individual pulse train, is shown in the following:
To get the time tn+1 when the particle reaches the center of any drift tube, the following equation suffices:
t n + 1 = t n + t T n 2 + t G n + 1 + t T n + 1 2
tTn and tTn+1, respectively, are the times of flight within the current and the next drift tube, where the particle has to cross only half of it, and tGn+1 is the time of flight in the whole acceleration gap. The time of flight of a particle with the speed vTn inside a drift tube with the length lT is
t T n = l T v T n
With the known LINAC potential Ulinac at each acceleration gap, the speed inside a tube after n stages can be calculated by
v T n = v 0 2 + 2 n U l i n a c q m
The initial speed after the dust source v0 is calculated by the measured time of flight tTOF within a known measurement section length s:
v 0 = s t T O F
The charge-to-mass ratio q m of the particle is unknown but can be calculated with known dust source voltage UDS by this equation:
q m = 1 2 v 0 2 U D S
The time of flight inside a gap of length lG equals to
t G n + 1 = l G U l i n a c m q 2 q m U l i n a c + v T n 2 v T n
Putting Equations (A2) to (A6) into (A1) results in a formula that has a part of pre-known values that can be pre-calculated, and the value tTOF that has to be measured in-situ:
t n + 1 = t n + t T O F 1 s l G 2 U D S U l i n a c 1 + n + 1 U l i n a c U D S 1 + n U l i n a c U D S + l T 2 1 1 + n U l i n a c U D S + 1 1 + n + 1 U l i n a c U D S
In theory, this greatly reduces the necessary calculation steps inside the FPGA to one simple multiplication and addition for each acceleration gap, which can be done within a few nanoseconds. Practically, the approach was a little more elaborated to add further functionality to the LINAC setup: The accelerator voltage relation U D S U l i n a c is also calculated within the FPGA to enable dynamic or unknown initial acceleration voltages UDS, which might be useful in future applications. An example for particle sources that produce particles of unknown acceleration potential are electrospray ionization sources [17,24,25].
If the initial acceleration voltage U0 or the particle’s charge-to-mass ratio is unknown, it can be calculated with Equation (A8) by implementing a single pre-acceleration stage of known potential Upreac and speed measurement before (v0) and after (vpreac):
U 0 = U p r e a c v p r e a c v 0 2 1
When calculating the pulse train for the LINAC afterwards, one has to keep in mind that Equation (A7) expects UDS to be the particle’s overall acceleration potential before the LINAC, which now includes the pre-accelerator potential. Therefore, UDS needs to be calculated as follows:
U D S = U 0 + U p r e a c

References

  1. Friichtenicht, J.F. Micrometeoroid Simulation using Nuclear Accelerator Techniques. Nucl. Instrum. Methods 1964, 28, 70–78. [Google Scholar] [CrossRef]
  2. Burchell, M.J.; Cole, M.J.; McDonnell, J.A.M.; Zarnecki, J.C. Hypervelocity impact studies using the 2 MV Van de Graaff accelerator and two-stage light gas gun of the University of Kent at Canterbury. Meas. Sci. Technol. 1999, 10, 41–50. [Google Scholar] [CrossRef]
  3. Hörz, F. Cratering and penetration experiments in aluminum and teflon: Implications for space-exposed surfaces. Meteorit. Planet. Sci. 2012, 47, 763–797. [Google Scholar] [CrossRef]
  4. Goldsworthy, B.; Burchell, M.; Cole, M.; Green, S.; Leese, M.; McBride, N.; McDonnell, J.; Müller, M.; Grün, E.; Srama, R.; et al. Laboratory Calibration of the Cassini Cosmic Dust Analyser (CDA) using new, low density Projectiles. Adv. Space Res. 2002, 29, 1139–1144. [Google Scholar] [CrossRef]
  5. Takechi, S.; Nogami, K.; Miyachi, T.; Fujii, M.; Hasebe, N.; Iwai, T.; Sasaki, S.; Ohashi, H.; Shibata, H.; Grün, E.; et al. Laboratory calibration measurements of a piezoelectric lead zirconate titanate cosmic dust detector at low velocities. Adv. Space Res. 2009, 43, 905–909. [Google Scholar] [CrossRef]
  6. Göller, J.R.; Grün, E. Calibration of the Galileo/Ulysses dust detectors with different projectile materials and at varying impact angles. Planet. Space Sci. 1989, 37, 1197–1206. [Google Scholar] [CrossRef]
  7. Fechtig, H.; Gault, D.E.; Neukum, G.; Schneider, E. Laboratory Simulation of Lunar Craters. Naturwissenschaften 1972, 59, 151–157. [Google Scholar] [CrossRef]
  8. Veysset, D.; Sun, Y.; Kooi, S.E.; Lem, J.; Nelson, K.A. Laser-Driven High-Velocity Microparticle Launcher in Atmosphere and Under Vacuum. Int. J. Impact Eng. 2020, 137, 103465. [Google Scholar] [CrossRef]
  9. Shu, A.; Collette, A.; Drake, K.; Grün, E.; Horányi, M.; Kempf, S.; Mocker, A.; Munsat, T.; Northway, P.; Srama, R.; et al. 3 MV hypervelocity dust accelerator at the Colorado Center for Lunar Dust and Atmospheric Studies. Rev. Sci. Instrum. 2012, 83, 075108. [Google Scholar] [CrossRef]
  10. Mocker, A.; Bugiel, S.; Auer, S.; Baust, G.; Colette, A.; Drake, K.; Fiege, K.; Grün, E.; Heckmann, F.; Helfert, S.; et al. A 2 MV Van de Graaff accelerator as a tool for planetary and impact physics research. Rev. Sci. Instrum. 2011, 82, 095111. [Google Scholar] [CrossRef]
  11. Horányi, M.; Szalay, J.R.; Kempf, S.; Schmidt, J.; Grün, E.; Srama, R.; Sternovsky, Z. A permanent, asymmetric dust cloud around the Moon. Nature 2015, 522, 324–326. [Google Scholar] [CrossRef] [PubMed]
  12. Bueno, A.; Krasowski, M.J.; Prokop, N.; Greer, L.C.; Adams, C.M.; Rennó, N.O. Instrument to Study Plume Surface Interactions (PSI) on the Lunar Surface: Science Motivation, Requirements, Instrument Overview, and Test Plans. Aerospace 2024, 11, 439. [Google Scholar] [CrossRef]
  13. Zhang, C.; Molla, T.; Brandl, C.; Watts, J.; McCully, R.; Tang, C.; Schaffer, G. Critical velocity and deposition efficiency in cold spray: A reduced-order model and experimental validation. J. Manuf. Process. 2025, 134, 547–557. [Google Scholar] [CrossRef]
  14. Assadi, H.; Gärtner, F.; Stoltenhoff, T.; Kreye, H. Bonding mechanism in cold gas spraying. Acta Mater. 2003, 51, 4379–4394. [Google Scholar] [CrossRef]
  15. Slattery, J.C.; Becker, D.G.; Hamermesh, B.; Roy, N.L. A Linear Accelerator for Simulated Micrometeors. Rev. Sci. Instrum. 1973, 44, 755–762. [Google Scholar] [CrossRef]
  16. Semkin, N.D.; Piyakov, A.V.; Voronov, K.E.; Bogoyavlenskii, N.L.; Goryunov, D.V. A linear accelerator for simulating micrometeorites. Instrum. Exp. Tech. 2007, 50, 275–281. [Google Scholar] [CrossRef]
  17. Adamson, B.D.; Miller, M.E.C.; Continetti, R.E. The aerosol impact spectrometer: A versatile platform for studying the velocity dependence of nanoparticle-surface impact phenomena. EPJ Tech. Instrum. 2017, 4, 2. [Google Scholar] [CrossRef]
  18. McDonnell, J.A.M.; Haddad, H.; Ashworth, D.G. A switched linear accelerator for microparticles: Design and computer simulated performance data. J. Phys. E Sci. Instrum. 1975, 8, 469–474. [Google Scholar] [CrossRef]
  19. Becker, D.G.; Friichtenicht, J.F.; Hamermesh, B.; Langmuir, R.V. Variable-Frequency Radially-Stable Micrometeoroid Accelerator. Rev. Sci. Instrum. 1965, 36, 1480–1481. [Google Scholar] [CrossRef]
  20. Stübig, M.; Schäfer, G.; Ho, T.-M.; Srama, R.; GrunGrün, E. Laboratory simulation improvements for hypervelocity micrometeorite impacts with a new dust particle source. Planet. Space Sci. 2001, 49, 853–858. [Google Scholar] [CrossRef]
  21. Li, Y.; Bauer, M.; Kelz, S.; Strack, H.; Simolka, J.; Mazur, C.; Sommer, M.; Mocker, A.; Srama, R. Upgrades of a Small Electrostatic Dust Accelerator at the University of Stuttgart. Appl. Sci. 2023, 13, 4441. [Google Scholar] [CrossRef]
  22. Srama, R.; Auer, S. Low-charge detector for the monitoring of hyper-velocity micron-sized dust particles. Meas. Sci. Technol. 2008, 19, 055203. [Google Scholar] [CrossRef]
  23. Strack, H. Entwicklung Eines Echtzeit-Triggersystems für Strahl- und Trajektoriensensoren zur Messung von Geladenen Mikropartikeln. Doctoral Dissertation, Universitätsbibliothek der Universität Stuttgart, Stuttgart, Germany, 2018. [Google Scholar]
  24. Kerby, J.D.; Daly, R.T.; Austin, D.E. A novel particle source based on electrospray charging for dust accelerators and its significance for cosmic dust studies. Earth Planets Space 2013, 65, 157–165. [Google Scholar] [CrossRef]
  25. Spesyvyi, A.; Žabka, J.; Polášek, M.; Charvat, A.; Schmidt, J.; Postberg, F.; Abel, B. Charged Ice Particle Beams with Selected Narrow Mass and Kinetic Energy Distributions. J. Am. Soc. Mass Spectrom. 2023, 34, 878–892. [Google Scholar] [CrossRef]
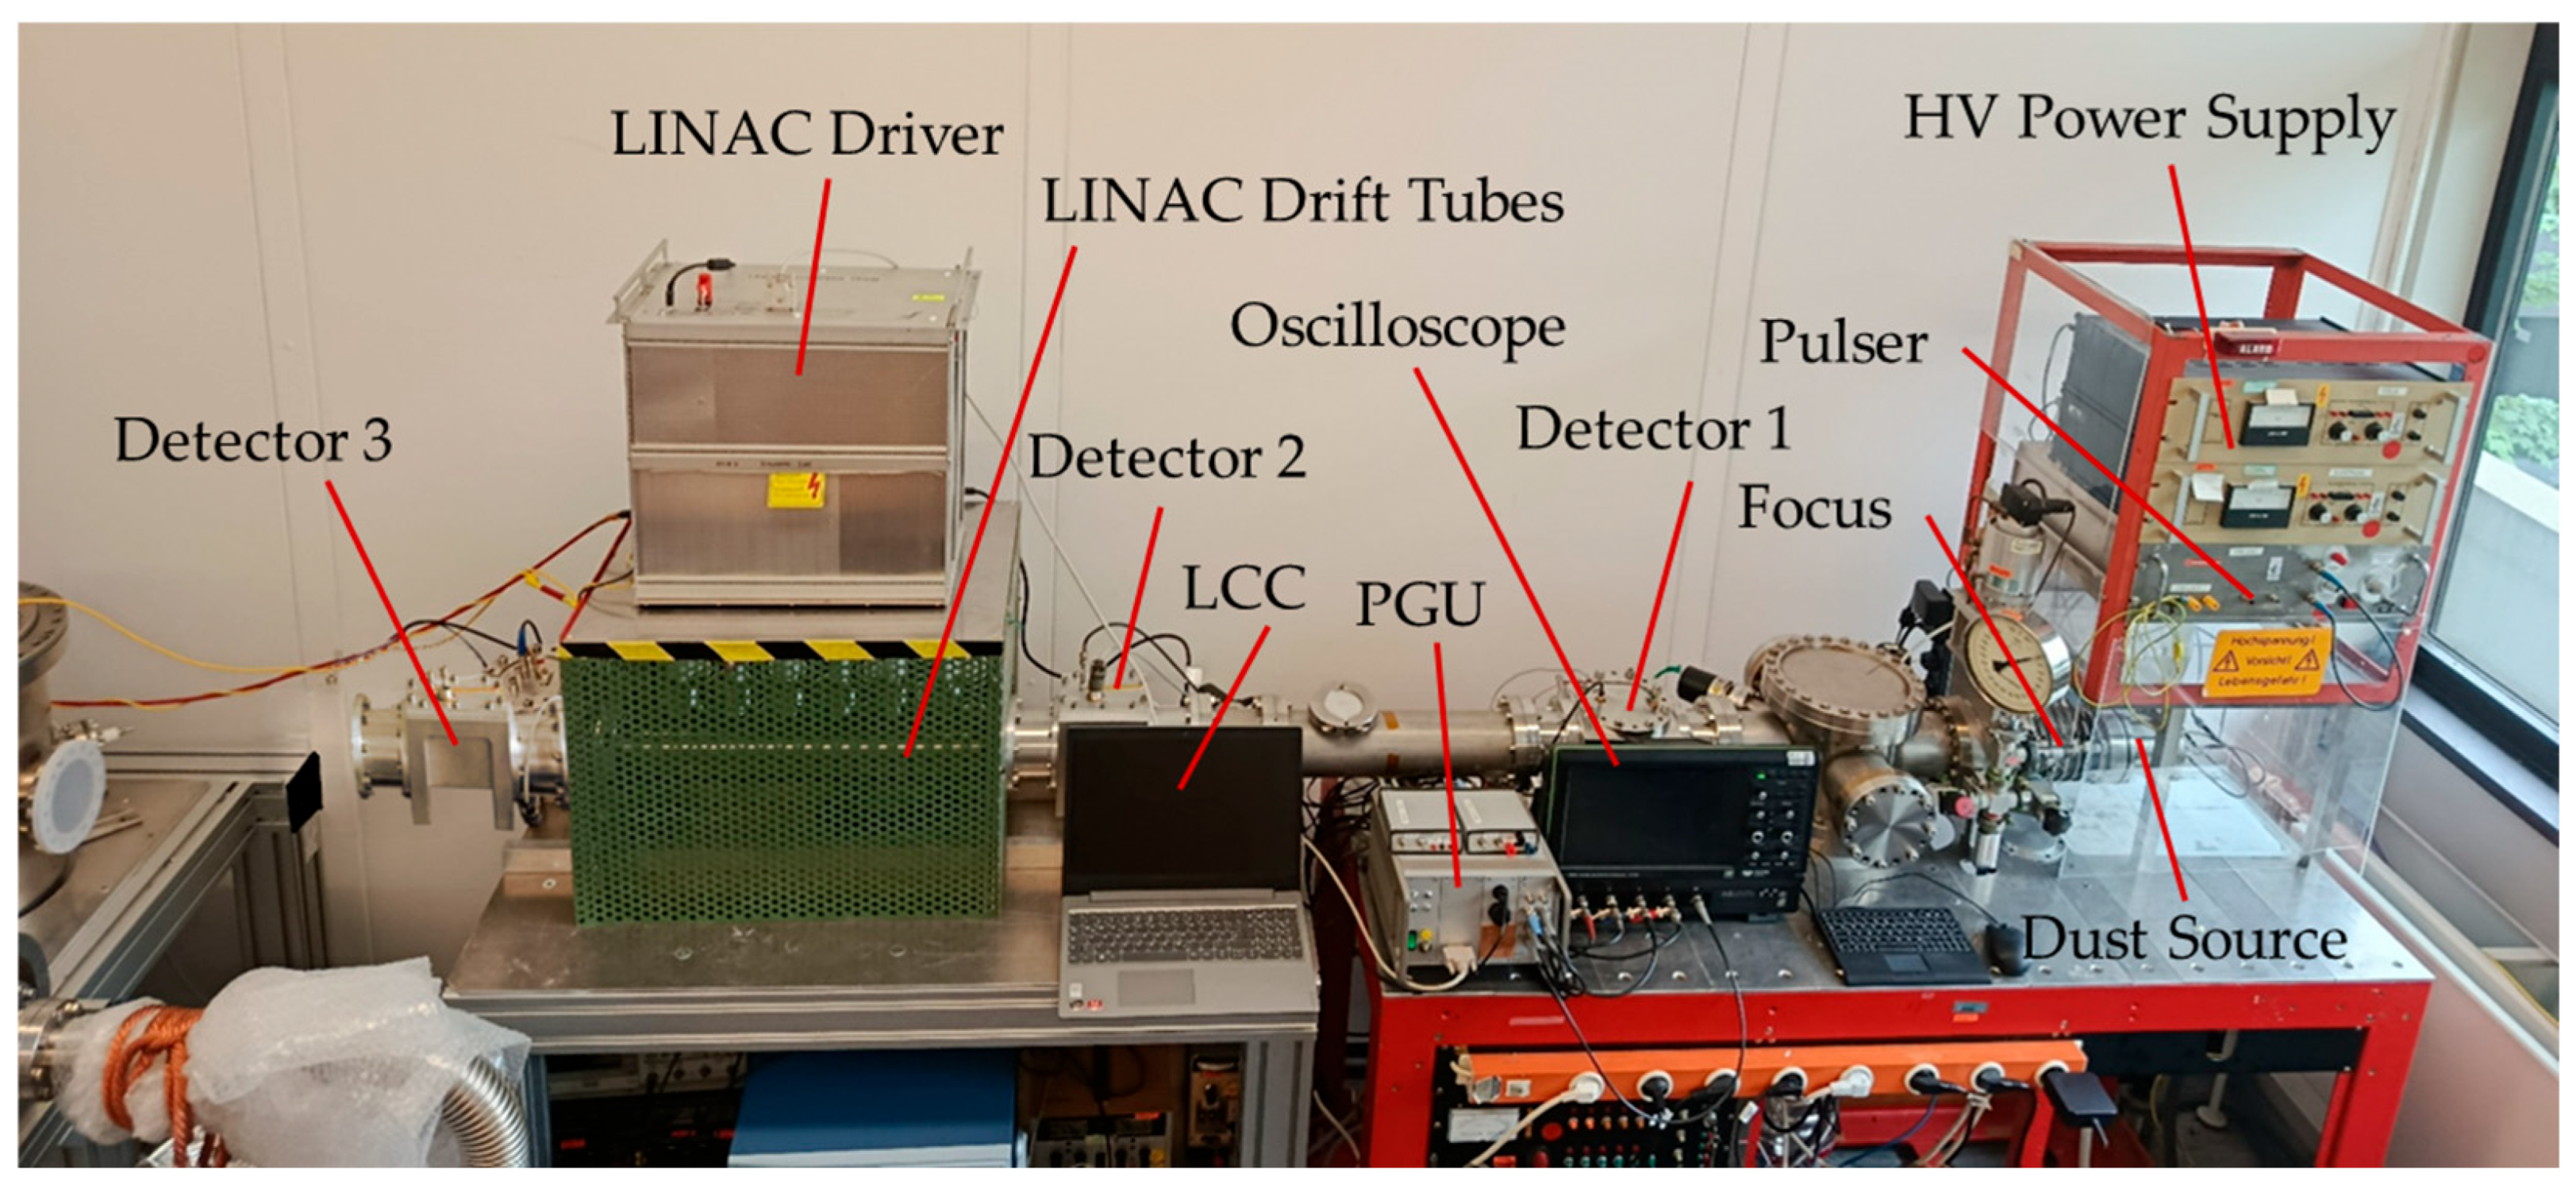
Figure 1. Basic Dust Accelerator with Linear Accelerator.
Applsci 15 11709 g001
Figure 2. Basic Dust Accelerator Beam Tube Assembly Scheme.
Applsci 15 11709 g002
Figure 3. Dust Source Scheme.
Applsci 15 11709 g003
Figure 4. Micron-Sized Iron Particles.
Applsci 15 11709 g004
Figure 5. Micron-Sized Coated Hollow Glass Spheres.
Applsci 15 11709 g005
Figure 6. Beam Detector Scheme.
Applsci 15 11709 g006
Figure 7. Linear Accelerator Electrode Assembly.
Applsci 15 11709 g007
Figure 8. Exemplaric High Voltage Circuit for one Drift Tube.
Applsci 15 11709 g008
Figure 9. GUI setup page. The top row allows the accelerator electronics setup. The top-center box allows for setting the LINAC Driver voltage, signal propagation delays and the recharge time of the tubes. The box on the top-right allows for dust source voltage input. In the GUI’s center, a simplified representation of the real setup is shown. Here, the user can draw the connections to the electronics. The bottom row is for input of the hardware’s distances, namely MSLs and the distance from the detectors to the LINAC.
Applsci 15 11709 g009
Figure 10. GUI operation page. The top row contains the buttons that activate the continuous and single operation modes and the stop operation button. The center row highlights the current LINAC status. An overview of the set voltages and acceleration stages is given. The bottom row is for setting the particle target speed window.
Applsci 15 11709 g010
Figure 11. Particle speed distributions for 15 kV dust source voltage and −20 kV LINAC voltage, using all 6 stages.
Applsci 15 11709 g011
Figure 12. Particle speed distribution for 18 kV dust source voltage, −20 kV LINAC voltage and a set target speed range of 500 to 600 m/s.
Applsci 15 11709 g012
Figure 13. Particle detector traces of one particle accelerated by 18 kV dust source potential passing through four detectors. The speed before the LINAC is determined by the time difference of the first two detector signals (black and magenta). With known MSL, the speed (V preLinac) calculates to 483 m/s. The LINAC runs at full potential (6 stages—120 kV total) and accelerates the particle. The blue and green traces show the output signals of the post-LINAC detectors. With the time difference between the signals and the known MSL, the speed (V postLinac) calculates to 1335 m/s. Dividing the post-LINAC speed by the pre-LINAC speed results in the acceleration ratio (Acc.Ratio) of 2.8.
Applsci 15 11709 g013
Figure 14. Particle detector traces and pulse train of one particle. It was accelerated by 18 kV dust source potential and passed through three detectors. The speed before the LINAC is determined by the time difference of the first two detector signals (black and magenta). With known MSL, the speed (V preLinac) calculates to 73 m/s. The LINAC runs at full potential (6 stages—120 kV total) and accelerates the particle. The blue trace shows the PGU’s control signal output, which toggles with each switch activation. The green trace shows the output signal of the post LINAC detector. With the time difference between the negative and positive flank and the known MSL, the speed (V postLinac) calculates to 207 m/s. Dividing the post-LINAC speed by the pre-LINAC speed results in the acceleration ratio (Acc.Ratio) of 2.8.
Applsci 15 11709 g014
Table 1. Particle Accelerator Types and the Particle Attributes they provide.
TypeVelocities [m/s]Masses [g]
Light-Gas Gunup to 1 × 10410−3 to 101
Plasma Gunup to 2 × 10410−8 to 10−4
Laser-Driven Launcherup to 3 × 10310−13 to 10−10
Electrostatic Acceleratorup to 1 × 10510−17 to 10−9
Table 2. LINAC performance data.
AttributeValue
acceleration potentialup to 120 kV
acceleration stages1 to 6
input voltage range−20 to 0 kV
particle entrance speed range20 to 10,000 m/s
particle output speed range20 to 50,000 m/s
maximum particle frequencyup to 33 particles per second
Table 3. Attributes of LINAC Accelerated Particles with Dust Source Potential of 18 kV.
LINAC Potential [kV]Diam [µm]Charge
[C]
Mass
[kg]
Speed Pre
LINAC [m/s]
Speed Post
LINAC [m/s]
Acceleration
Ratio
200.6827.19 × 10−151.30 × 10−154596641.45
0.6738.66 × 10−151.25 × 10−155137551.47
1.4551.36 × 10−141.26 × 10−142022941.46
1.4602.73 × 10−141.27 × 10−142854101.44
1.8212.73 × 10−142.47 × 10−142052941.43
401.5391.83 × 10−141.49 × 10−142163881.80
1.2445.89 × 10−157.85 × 10−151683021.80
1.0251.66 × 10−144.40 × 10−153796781.79
1.3912.55 × 10−141.10 × 10−142975271.77
0.6165.56 × 10−159.54 × 10−164708311.77
601.0851.52 × 10−145.21 × 10−153326772.04
1.4952.73 × 10−141.36 × 10−142755612.04
0.6415.93 × 10−151.07 × 10−154589652.11
1.6492.09 × 10−141.83 × 10−142084302.07
1.3741.22 × 10−141.06 × 10−142094272.04
800.7461.11 × 10−141.69 × 10−1549911942.39
1.2202.61 × 10−147.43 × 10−153658662.37
0.6418.00 × 10−151.08 × 10−1553112722.40
0.6076.20 × 10−159.14 × 10−1650712082.38
1.6332.73 × 10−141.78 × 10−142415582.32
1000.7498.86 × 10−151.71 × 10−1544311522.60
0.8561.30 × 10−142.56 × 10−1543911372.59
0.6656.07 × 10−151.20 × 10−1543811142.54
1.6662.73 × 10−141.89 × 10−142345952.54
0.9201.02 × 10−143.18 × 10−153498982.57
1201.5092.48 × 10−141.40 × 10−142597092.74
0.6286.21 × 10−151.01 × 10−1548213342.77
1.3482.51 × 10−141.00 × 10−143088692.82
1.4902.17 × 10−141.35 × 10−142467002.85
0.8578.03 × 10−152.57 × 10−153449662.81
Disclaimer/Publisher’s Note: The statements, opinions and data contained in all publications are solely those of the individual author(s) and contributor(s) and not of MDPI and/or the editor(s). MDPI and/or the editor(s) disclaim responsibility for any injury to people or property resulting from any ideas, methods, instructions or products referred to in the content.