Abstract
The pattern of the front contact metallization critically influences solar cell efficiency. This study introduces a novel explicit geometry optimization approach for designing the front contact metallization patterns. In the proposed approach, the front contact patterns are represented by wide Bezier curves with variable widths, where each curve’s geometry is defined by both control points and control circles. The control point coordinates and the control circle radii are taken as design variables. To ensure physical feasibility during the design process, one of the end control points of each curve is fixed at the current extraction point. Unlike geometry optimization techniques employing fixed-width Bezier curves, our approach provides enhanced design flexibility through continuous width modulation along the front contact paths. Simulation experimental validation across the simple solar cell geometries demonstrates the proposed method’s superior performance relative to both the solid isotropic material with penalization (SIMP) approach and geometry optimization method using a fixed-width Bezier. Furthermore, the optimized front contact metallization structures outperform the conventional H-pattern designs. Specifically, for a solar cell with a size of 3.5 cm, compared to a solar cell with conventional H-pattern front contact electrodes, the conversion efficiency, open-circuit voltage, short-circuit current, and fill factor of the solar cell with curve-shaped front contact metallization are relatively increased by 0.415%, 0.0011 V, and 5.091 A·m−2, and 0.904%, respectively, while the material coverage ratio is reduced by 1.974%. The methodology’s versatility is further evidenced by its successful adaptation to free-form solar cell configurations.
1. Introduction
Global socioeconomic development continues to escalate energy consumption while simultaneously exacerbating environmental degradation. Addressing these dual challenges requires urgent adoption of sustainable energy solutions that can fulfill growing power requirements while supporting carbon neutrality objectives. Among renewable alternatives, solar energy has emerged as a particularly promising clean energy resource due to its sustainability and environmental benefits [1]. A solar cell is a device that can directly convert solar energy into electrical energy. In the past few decades, despite substantial technological advancements, commercial silicon solar cells have approached their practical efficiency limits, with typical laboratory efficiencies for monocrystalline silicon cells reaching 26.8% [2] and commercial module efficiencies ranging between 22% and 24.5% [3], which is substantially below the fundamental Shockley–Queisser limit of 29.8% for single-junction devices [4]. Key performance parameters for state-of-the-art solar cells under Standard Test Conditions (STC: 1000 W/m2, AM 1.5G spectrum, 25 °C) include a short-circuit current density () often exceeding 40 mA/cm2, an open-circuit voltage () in the range of 0.700–0.750 V, and a fill factor () greater than 82% [3]. Therefore, shifting the research focus to minimizing resistance losses and optimizing the light management of solar cells is crucial to bridging this large gap between the efficiency of laboratory (or commercial) solar cells and the theoretical efficiency of solar cells.
The fundamental structure of a photovoltaic device, as illustrated in Figure 1, comprises three primary components: the front contact metallization layer, a semiconductor layer, and a back electrode layer. Sometimes, a transparent conductive oxide (TCO) layer is added to the surface of the semiconductor layer. TCO is beneficial in reducing resistance losses and allows more sunlight to pass through [5]. The back electrode is usually composed of highly conductive metals. It is generally considered that the potential in the back electrode layer is equal everywhere. The introduction of the front contact metallization reduces the resistance loss, and at the same time, it also causes shielding losses. Optimizing the pattern of the front contact metallization to minimize the sum of the resistance and shielding losses of the solar cell is an ongoing problem in the development of solar cells. Many researchers are devoted to the printing technology of the front contact metallization [6,7,8,9] and design simulation based on the contact physics model [10,11] to improve the conversion efficiency of solar cells. At the same time, a large number of researchers have conducted optimization studies for the layout of the front contact metallization of solar cells [12,13,14,15]. Notable developments include the multilayer front contact metallization architecture introduced by Flat and Milnes [16] and Green’s theoretical framework for power loss minimization [17]. Subsequent work by Djeffal et al. implemented Green’s model through genetic algorithms, particularly for high-irradiance conditions [18], while Liu’s team analyzed loss mechanisms in alternative front contact metallization configurations [19]. However, these studies primarily examine conventional linear front contact metallization designs, neglecting the critical impacts of front contact metallization geometry and TCO conductivity limitations on potential and current density distributions [20,21].
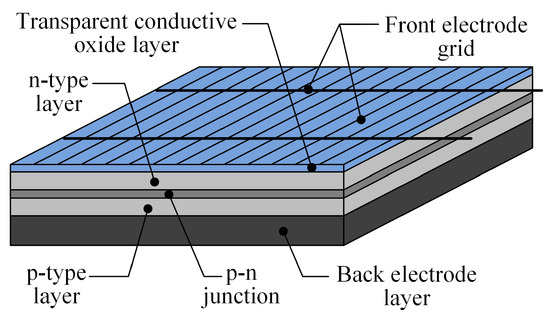
Figure 1.
Typical solar cell configuration.
The distribution of potential and current density across solar cell surfaces can be effectively characterized through the finite element method (FEM) [22]. The FEM computational approach has enabled researchers to perform optimizations of both device dimensions and front contact metallization configurations. For instance, a hybrid finite element–genetic algorithm methodology was employed by Li et al. to determine optimal solar cell dimensions and front contact metallization configurations [23]. Similarly, van Deelen et al. achieved notable efficiency improvements by utilizing COMSOL Multiphysics integrated with MatLab to optimize key parameters, including cell size, grid finger width, and spacing [24,25]. However, these investigations predominantly focused on traditional H-pattern front contact metallization geometries, which may not represent the most efficient design solution, particularly for unconventional solar cell architectures [26,27].
As a mathematical approach for material distribution optimization, topology optimization (TO) determines optimal configurations within the predefined design domain by considering load conditions, constraint boundaries, and performance targets [28,29,30]. Unlike conventional size or shape optimization methods, the geometry optimization in this study is similar to TO, which eliminates designer influence while achieving superior outcomes. Recent applications have extended TO techniques to front contact metallization design in solar cells, with Gupta et al. demonstrating its capability to produce intricate front contact metallization patterns surpassing traditional H-pattern limitations [31]. The solid isotropic material with penalization (SIMP) approach adopted in these studies [27,31], however, presents inherent limitations including mesh dependency, intermediate-density artifacts, checkerboard patterns, and unclear and non-smooth boundaries [32,33]. These drawbacks make the optimized results unsuitable for direct fabrication, and additional techniques are required to eliminate these drawbacks [33,34,35]. Furthermore, the SIMP-based results exhibit poor compatibility with CAD systems [36,37,38]. To overcome the above issues, Li et al. proposed using moving wide Bezier curves with constrained ends (MWB-CE) to represent the front contact metallization patterns [39]. This study is based on the moving morphable component (MMC) method, which can explicitly express the front contact metallization pattern [37]. The shape of the wide Bezier curve is controlled by the coordinates of the control points and the width of the curve. The optimized results obtained in [39] are better than those obtained by using the SIMP method and the conventional H-pattern. However, in [26,39], only curves with uniform width were used as building blocks of optimization. The optimal results cannot be obtained by using curves with uniform widths. Therefore, more efficient geometry models must be developed to reduce the limitations of the current curves with uniform widths.
Another motivation for this work comes from the following considerations. In addition to conventional solar panels installed in deserts and fields around the world, building-integrated photovoltaic (BIPV) systems are increasingly being installed in residential and commercial buildings [40]. The installation of the BIPV system does not require additional space, and the electrical energy generated by the BIPV system is utilized locally, which effectively reduces the loss caused by long-distance transmission [41]. Esthetics is an important consideration when buying homes or commercial buildings. Therefore, the BIPV panels cannot affect the architectural esthetics of buildings. Nowadays, many solar panels of unconventional shapes (e.g., hexagons and circles) are used to meet esthetic requirements. The optimum design of the front contact metallization for these solar panels will be more challenging. The traditional front contact metallization optimization methods are unsuitable for these solar panels [42].
Based on the above considerations, the present study develops a geometry optimization framework employing variable-width Bezier curves within the MMC method. This innovative approach demonstrates two key advantages over existing optimization techniques: enhanced solar cell conversion efficiency and reduced front contact material consumption. Moreover, the proposed method’s applicability is expanded to enable performance optimization for free-form solar cell configurations.
The section structure for the remainder of this paper is as follows. Section 2 briefly describes the equivalent circuit and finite element model of the solar cell. The preliminary formulation of the proposed geometry optimization method is presented in Section 3. In Section 4, several examples are provided to illustrate the proposed method’s effectiveness. Section 5 presents the conclusions.
2. Equivalent Circuit and Finite Element Model of Solar Cells
2.1. Equivalent Circuit
Figure 1 shows the typical solar cell configuration. It mainly includes the semiconductor layer, TCO layer, front contact metallization, and back electrode layer. Under photoillumination, the semiconductor layer generates a photoillumination current, which is collected by the front contact and back electrodes and transmitted to adjacent solar cells or external loads. For performance analysis, researchers usually employ the equivalent circuit model depicted in Figure 2, which serves as the foundation for analyzing the characteristics of solar cells [43]. From the equivalent circuit, the solar cell characteristic equation [43] is stated as
where I and represent the net current and photoillumination current, respectively. and represent the saturation currents dependent on the recombination process indicated by the diode ideality factors and . q, K, and T denote the electric charge, Boltzmann constant, and absolute temperature, respectively. V is the operating voltage, is the lumped series resistance, and is the shunt resistance. These parameters can be used to evaluate the performance of solar cells [44].
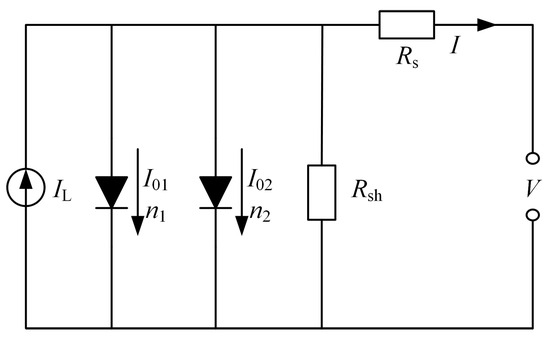
Figure 2.
Equivalent circuit of a solar cell [43].
Due to the limited conductivity of the TCO layer and front contact metallization, the local potential of each part on the solar cell surface is different, and the local current density at different positions is also different. Figure 2 shows the two-diode equivalent circuit model, which is commonly used to describe the overall I-V characteristics of a solar cell. To accurately analyze the spatial distribution of the potential and current density of solar cells, which is crucial for optimizing the front contact metallization pattern, we adopted a distributed modeling approach [31], as described in Figure 3. This modeling approach discretizes the entire solar cell into a series of small unit solar cells, which are interconnected in parallel configurations via the back electrode layers and front contact metallization. The current–voltage relationship for the unit cell is mathematically expressed as
where is the photoillumination current density. and are the reverse bias current densities. and are the diode ideality factors, and is the shunt resistance.
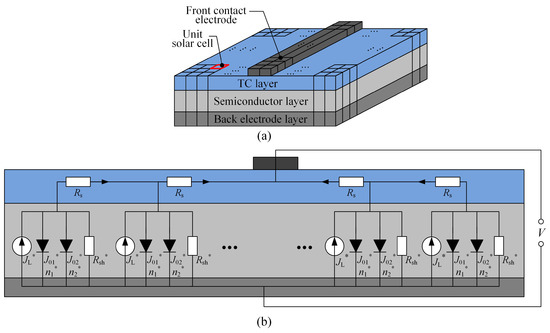
Figure 3.
A distributed two-diode model: (a) a solar cell divided into a series of unit solar cells; (b) equivalent circuit of the front row of the distributed two-diode model.
The proposed methodology employs bilinear quadrilateral elements to model the unit solar cell [45], with the current density characterized by nodal values at four discrete points. The current density is given as
where is the metal electrode material’s volume fraction within each unit solar cell, see [31].
2.2. Finite Element Model
As the TCO layer and front contact metallization exhibit conductivity exceeding that of the semiconductor layer by several orders of magnitude, charge carriers flow vertically to the solar cell’s front surface [20]. Once they arrive at the front surface, the charge carriers flow through the TCO layer to the front contact metallization and then along the front contact metallization to the current extraction point. Therefore, we can use 2D finite elements to describe the distribution of the electric potential and current density of the solar cell. The distribution characteristics of the electrical potential of a solar cell can be described by a Poisson equation [31] as
where V is the electrical potential and is the charge carrier density. The distribution of voltage and current can also be expressed as a matrix equation and written as
where is the symmetric global conductivity matrix, is the voltage vector, and is the current vector. For the detailed construction of matrix , see [31]. Due to the nonlinear current–voltage relationship in (2), in order to solve (5), the matrix equation is rewritten as
where is the residual.
3. Formulations for Geometry Optimization
3.1. Geometry Description of the Front Contact Metallization Pattern
The front contact metallization optimization aims to maximize solar cell output power through optimizing the front contact material distribution. In the MMC-based method, the front contact metallization pattern domain can be described by using movable components [46]
where denotes the front contact metallization pattern domain occupied by the nth component. N is the total number of movable components. The domain is defined by using a geometric description function (GDF) as
where D represents a prescribed design domain, and denotes a coordinate in the prescribed design domain. In this case, the front contact metallization pattern domain is defined by a GDF as
In order to obtain greater design freedom, in the present paper, we propose to use variable-width Bezier curves to represent components. We use a Bezier curve as the skeleton to build a component (as shown in Figure 4). The Bezier curve is determined by its control points . The width of the variable-width Bezier curve is determined by a set of control circles located at centers with radii . Therefore, the geometry of the nth component is controlled by a vector . The front contact metallization geometry is parameterized by a vector as
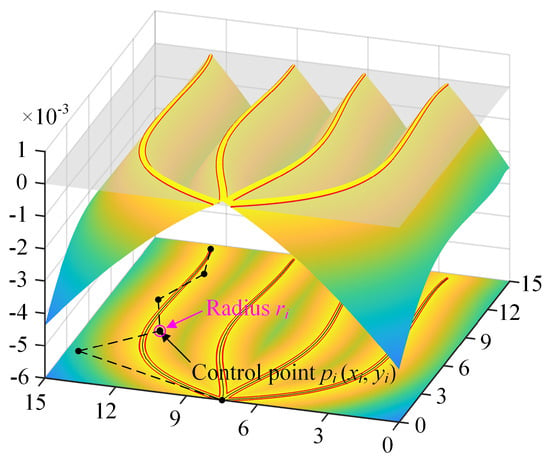
Figure 4.
Moving morphable wide Bezier curves with variable width and their geometric description function images.
The geometry of the nth component can be described by the following GDF:
where denotes the vertical distance from point to the centerline of the Bezier curve, t represents the intrinsic parameter that varies from 0 to 1, and represents the half-width of the variable-width Bezier curve, which can be expressed as
where is the coefficient. can be expressed as
The terms and in (11) are the coordinates of any point on the centerline of the Bezier curve, which can be expressed as
As the generated current must exit via the current extraction point, one of the end control points of each Bezier curve is constrained there. Therefore, the vector of the nth variable-width Bezier curve can be divided into two parts:
where represents the predefined design variables, . represents the free design variables, .
3.2. Optimization Problem
Based on the discussion above, the front contact metallization pattern optimization problem can be mathematically formulated within the MMC framework as follows:
where is the output power, is the operating voltage, is the unit solar cell area, and is the current density of the unit solar cell. The metal electrode material’s volume fraction can be expressed as
where is the domain occupied by the unit solar cell e and is the Heaviside function. For numerical implementation purposes, is replaced by a smooth and differentiable Heaviside function [47]
where is a parameter to control smoothness. is a small positive number to avoid the singularity of the global conductivity matrix.
3.3. Sensitivity Analysis
The optimization problem of the front contact metallization pattern can be solved by using the gradient-based optimization algorithm. According to the adjoint sensitivity analysis method [48], the sensitivity of the objective function with respect to any design variable a can be written as
where is a Lagrange multiplier vector. The subscript notations f and p represent the free and predefined design variables, respectively. For the detailed solution process, see [31].
3.4. Optimization Algorithm
In this study, the front contact metallization pattern optimization using the geometry optimization method is an iterative process, with the pseudocode as shown in Algorithm 1. It begins with defining the boundary conditions and the relevant parameters of the design problem. Then, the GDF is calculated, and the front contact metallization pattern is obtained. After that, finite element analysis is performed (the output power of the solar cell corresponding to the front contact metallization pattern is calculated), and sensitivity analysis is performed. We employ the method of moving asymptotes (MMA) to iteratively update all design variables [49]. The updated design variables are again used to build a new front contact metallization pattern. Finally, the optimized results are output and visualized. The optimization process terminates when the iteration count reaches the predefined maximum iteration step.
| Algorithm 1: Geometry optimization pseudocode of front contact metallization pattern. |
| Input: |
| Solar cell geometry, material properties |
| Current density-voltage relationship parameters |
| Optimization parameters: Maximum iteration, tolerance |
| Initial design variable vector (control points and radii) |
| Boundary conditions |
| Begin |
| 1: iteration counter k→0 |
| 2: (k < Maximum iteration) |
| 3: |
| 4: n = 1 N ( Loop over all Bezier components) |
| 5: Calculate for component n using Equations (11)–(14) |
| 6: |
| 7: Calculate the global GDF (using Equation (9)) |
| 8: |
| 9: Assemble global conductivity matrix C based on Equations (17) and (18) |
| 10: Solve the nonlinear system (Equation (6)) for |
| nodal voltages using the Newton-Raphson method |
| 11: Compute output power and objective function |
| 12: |
| 13: (1) |
| 14: f (k) − f (k − 1) f (k) | < tolerance) |
| 15: converged==True |
| 16: |
| 17: |
| 18: |
| 19: (converged==False) |
| 20: Compute sensitivity d for each design variable a using adjoint sensitivity |
| method (Equation (19)) |
| 21: Update design variables using the Method of Moving Asymptotes (MMA) |
| 22: |
| 23: |
| 24: |
| 25: |
| 26: = |
| 27: Generate optimized front contact metallization pattern from |
| 28: Output , , and performance metrics of solar cells |
| End |
4. Examples and Discussions
The validity of the proposed approach is established through representative case studies. Initial verification focuses on geometrically simple solar cell configurations. Then, we conduct front contact metallization pattern optimization research on solar cells with unconventional geometric shapes. For solar cells with unconventional geometries, we take the hexagonal and circular design domains as examples. In all the case studies, the current density–voltage relationship for solar cell is expressed as
In (20), the units of j and V are A·m−2 and volts. This current–voltage relationship is based on the measurements performed at TNO Eindhoven. The key material properties and simulation parameters used consistently across all case studies, unless otherwise specified, are summarized in Table 1. The parameters used in this paper are consistent with those used in [31]. It is worth noting that the current–voltage relationship was obtained under the global AM1.5 spectrum () at 25 °C. Although temperature has a significant impact on the performance of solar cells, to isolate and address the trade-off between resistance loss and shielding loss directly affected by the front contact metallization pattern, we assume that the solar cells operate under fixed isothermal conditions (25 °C).

Table 1.
Simulation parameters used for the finite element model.
The conversion efficiency () of the solar cell is calculated as follows:
where is the solar cell area. denotes the input power density, and its value is 1000 W·m−2.
In addition, the information about the computer used for all the experiment cases is described as follows: Windows 10, 64-bit operating system, two AMD EPYC 7542 Processors @ 2.90 GHz (64 cores in total), and 256 GB of DDR4 memory. The software platform is MATLAB R2020b.
4.1. Simple Geometry Solar Cell
Two solar cell configurations (Figure 5) serve as test cases for the proposed method in this section. The first one is a side-contact square model (Figure 5a). The current extraction point of the solar cell is located at the left midpoint, and the operating voltage is kept at . According to the boundary conditions, the left-end control points of all Bezier curves are fixed at the left midpoint. The second is a pin-up module (PUM) square model (Figure 5b). The current extraction point of the solar cell is located at the centroid of the design domain, and the operating voltage is kept at .
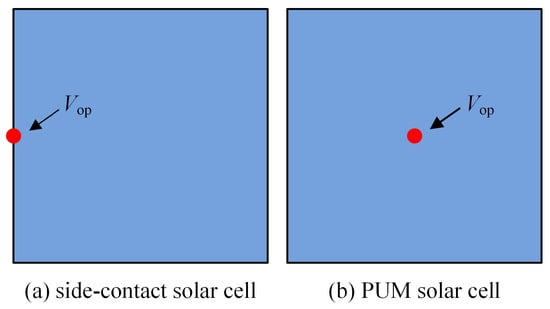
Figure 5.
Two solar cells with simple geometry.
4.1.1. Effect of the Number of Control Points
A parametric study investigates how control point number () influences both the front contact metallization pattern geometry and conversion efficiency in side-contact square solar cells. Five distinct configurations are examined, with values ranging from 3 to 12 (specifically 3, 4, 6, 8, and 12). The analysis maintains a constant 1.5 cm × 1.5 cm design domain discretized into 100 × 100 finite elements. The initial front contact metallization geometry comprises six variable-width Bezier curves (Figure 6). The optimization constraints impose a 25 μm minimum half-width for all Bezier curves. These simulation parameters align with the benchmark conditions established in [39].
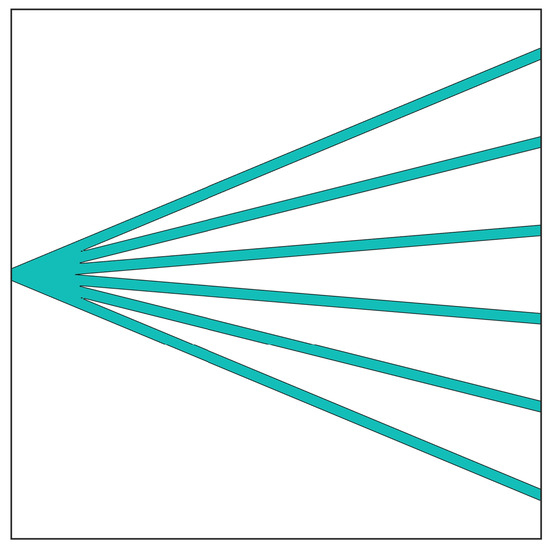
Figure 6.
The initial geometry of the front contact metallization pattern of the side-contact solar cell.
Table 2 presents the optimization results, with the second column displaying the obtained front contact metallization geometries, while the third and fourth columns document the corresponding operating voltages () and conversion efficiencies (). Analysis reveals a clear dependence of these performance metrics and front contact metallization patterns on the control point count. Notably, configurations with fewer control points (e.g., = 3) yield the poorest efficiency among all cases, mainly due to the lack of sufficient degrees of freedom in the Bezier curve to form a complex and efficient current collection path, which limits solar cell performance. As the increases (to 6 or 8), the Bezier curve has more degrees of freedom to form complex current collection paths, allowing the electrode patterns to better adapt to the uneven current density distribution of the solar cell, thereby forming a better, lower-resistance current collection network and improving efficiency. However, when continues to increase to high levels (e.g., = 12), a twisted Bezier curve will appear. The twisted curve can be physically explained as excessive optimization leading to redundancy in local current paths. The twisted curve may slightly improve local current collection efficiency, but it also increases the total length of the electrode and shielding loss. More importantly, the twisted curve increases the overall series resistance of the current as it flows towards the current extraction point. Therefore, the slight improvement in current collection efficiency will be offset by the corresponding increase in shielding loss and series resistance loss, leading to a plateau or even a slight decrease in the conversion efficiency of solar cells.

Table 2.
Results of the side-contact solar cells with different numbers of control points.
From Table 2, it can be seen that some optimized front contact metallization geometries are quite similar. When the number of control points exceeds a certain number ( > 6), the convergence of solar energy conversion efficiency indicates that the optimization problem is approaching a local or near-global optimum for the given constraints and initial conditions. The fact that different configurations (e.g., = 6, 8) yield similar efficiencies and similar optimized geometries indicates that the proposed optimization method has a certain degree of robustness. The emergence of twisted curves at high without performance gain is a critical observation: it reveals the diminishing returns in design freedom. The optimizer utilizes excessive degrees of freedom to create complex shapes that do not substantially improve the solar cell performance. This mathematically proves that our recommendation to use moderate is reasonable.
In addition, to visually demonstrate the increase in computational costs with the increase in , we record the computation time of each step () under different s in the fifth column of Table 2. It can be seen that the calculation time for each step increases with the increase in the number of control points. The author’s research experience suggests an optimal range of 6–10 for balancing design quality and processing efficiency. Consequently, subsequent analyses adopt = 6 as the standard configuration to maintain reasonable computation times without compromising optimization effectiveness.
The and obtained in [39] are also recorded in Table 2. It can be seen that the and of the five studied cases are higher than those obtained in [39]. The improvement stems from the strategic use of the variable-width Bezier curves.
Figure 7 depicts the convergence behavior of the objective function () and some intermediate designs at steps 1, 50, 350, 700, 1050, and 3500. The curves are clustered together in the initial configuration, and the solar cell efficiency is 11.241%. As optimization progresses, the curves gradually spread out, and the width of each component gradually decreases. The conversion efficiency first rapidly increases and then gradually flattens out. Finally, the optimized front contact metallization pattern is obtained, and the operating voltage and the solar cell efficiency are 0.509 V and 13.730%, respectively.
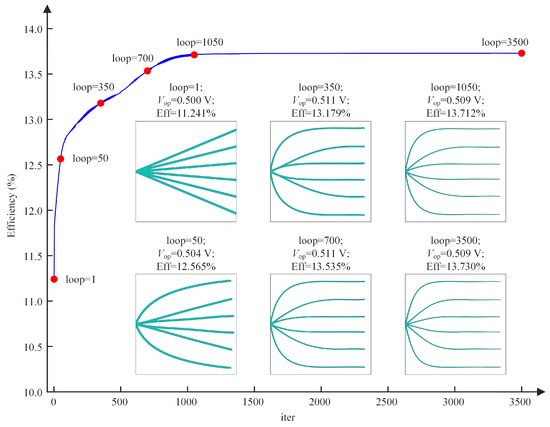
Figure 7.
The convergence history of the objective function and some intermediate designs ( = 6).
4.1.2. Effect of the Number of Wide Bezier Curves
In this section, we examine the effect of the number of wide Bezier curves () on the solar cell efficiency. We examine four distinct configurations employing 4, 6, 8, and 10 Bezier curves.
Table 3 presents the optimization results, with columns two and three displaying the initial and optimized geometries, respectively, while columns four and five document the corresponding operating voltages () and conversion efficiencies (). The results demonstrate a positive correlation between Bezier curve quantity and conversion efficiencies, though with diminishing marginal gains in efficiency enhancement. However, employing an excessive quantity of wide Bezier curves leads to a sharp growth in design variables that substantially degrades calculation speed [50]. But this problem can be solved through parallel computing (if the computer’s processor has enough cores). The computation time of each step with different numbers of wide Bezier curves is recorded in the sixth column of Table 3. It can be seen that the difference in calculation time for each step is not significant for different numbers of curves. For 1.5 cm × 1.5 cm side-contact solar cells, comprehensive analysis of both the calculation speed and optimization results suggests an optimal configuration utilizing approximately eight Bezier curves.

Table 3.
Results of the side-contact solar cells with different numbers of wide Bezier curves.
For the optimization problem, the optimization results obtained in [39] are also recorded in Table 3. It can be seen that the conversion efficiencies of the four cases exceed those obtained in [39], and the operating voltages of the four cases are not lower than those obtained in [39].
4.1.3. Effect of Solar Cell Size
In this section, we investigate the scaling effects on optimization results by evaluating four PUM square solar cells with progressively increasing dimensions: 1.5 cm × 1.5 cm, 3 cm × 3 cm, 6 cm × 6 cm, and 9 cm × 9 cm. To maintain consistent element resolution across all cases, the computational meshes are correspondingly discretized into 100 × 100, 200 × 200, 400 × 400, and 600 × 600 elements, respectively. The initial geometries of the front contact metallization patterns of the four studied cases are represented by 16, 32, 40, and 48 curves, respectively. Geometrically, the initial geometry of these Bezier curves is arranged with uniform angular spacing (2pi/k between adjacent curves, where k represents the number of curves) and the initial curve length is constrained to 0.5 times the side length of solar cells (Figure 8).
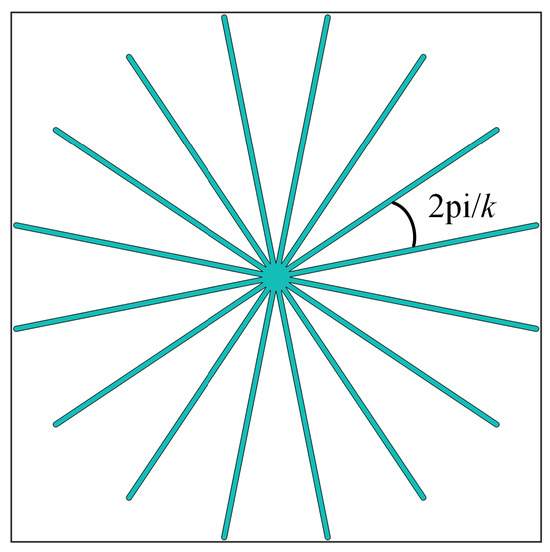
Figure 8.
The initial geometry of the front contact metallization patterns of the PUM solar cell.
Table 4 presents the optimization results across different solar cell scales, with the second row displaying the obtained front contact metallization patterns and subsequent rows documenting the corresponding conversion efficiencies (), operating voltages (), and front contact electrode material coverage ratio (CR) and a comparison of their variations. The data reveals an inverse relationship between solar cell dimensions and conversion efficiency—while larger solar cells exhibit greater metal electrode material coverage, their efficiency systematically declines. This phenomenon primarily stems from increased resistance losses, as generated currents must traverse longer paths to reach the current extraction point in expanded geometries. To mitigate the resistance losses in large solar cells, the optimization framework needs to develops wider metal electrodes with more extensive branching networks to maintain current collection efficiency. While this increases shielding loss, it partially offsets resistance losses to some extent. In addition, the optimization results obtained in [31,39] are also recorded in Table 4. It can be seen that the conversion efficiencies and operating voltages of the four studied cases are higher than those obtained in [31,39], and the improvement in conversion efficiency becomes more significant with the increase in solar cell size. It is worth noting that for large-sized solar cells, these improvements are achieved while maintaining a lower material CR.

Table 4.
Results of the PUM square solar cells with different sizes.
To visually demonstrate the increase in computational costs with the increase in solar cell size, we record the computation time of each step under different solar cell sizes in the last row of Table 4. It can be seen that the calculation time for each step significantly increases with the increase in solar cell size. However, for this offline optimization problem of solar cell front contact metallization patterns, such time consumption is acceptable.
We can also discuss the solar cell size effects on conversion efficiency from the voltage and current density distributions. Compared with small solar cells (1.5 cm × 1.5 cm), the voltage difference of large solar cells (9.0 cm × 9.0 cm) is higher, as shown in Figure 9. For large solar cells, the higher voltage difference will reduce current density, as shown in Figure 9. Although small solar cells have higher conversion efficiency, constructing solar panels with small solar cells will increase the spacing between solar cells. To maximize the performance of a solar panel, solar cell size and front contact metallization pattern must be co-optimized.
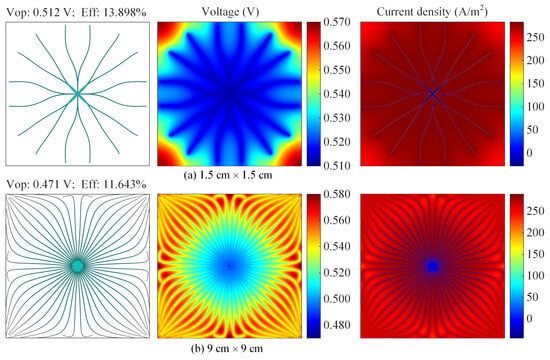
Figure 9.
Front contact metallization patterns and voltage and current density distributions for PUM square solar cells with different sizes.
4.2. Preliminary Comparison with the H-Pattern Solar Cell
This comparative study examines the performance differences between conventional H-pattern electrodes (Figure 10) and our geometry-optimized results. For the H-pattern configurations, comprehensive optimization was performed on all critical geometric parameters, including busbar dimensions, finger number, finger width, and operating voltage (). The study examines four solar cells with dimensions of 1.5 cm × 1.5 cm, 2.0 cm × 2.0 cm, 2.5 cm × 2.5 cm, and 3.5 cm × 3.5 cm, respectively. To maintain consistent element resolution across all cases, the computational meshes are correspondingly discretized into 300 × 300, 400 × 400, 500 × 500, and 700 × 700, respectively. For the proposed method, each case employs 10, 16, 18, and 20 curves, respectively.
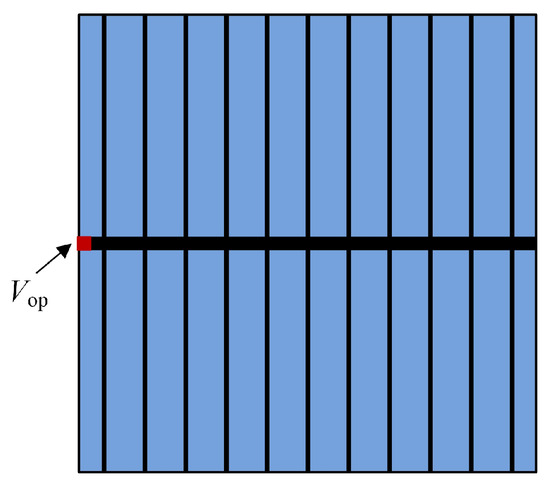
Figure 10.
Conventional H-pattern electrode.
Table 5 presents a comprehensive performance comparison between the proposed front contact metallization designs and conventional H-pattern configurations across four solar cells. The second row displays the optimized geometries obtained through our methodology, while subsequent rows quantify their conversion efficiency (), open-circuit voltage (), short-circuit current density (), fill factor (), and front contact electrode material coverage ratio (CR) and a comparison of their variations. All cases demonstrate superior conversion efficiency, open-circuit voltage, short-circuit current density, and fill factor compared to their H-pattern counterparts, with the performance gap widening proportionally with solar cell dimensions. While the absolute conversion efficiency gains (e.g., 0.233–0.415%) may appear modest from an academic perspective, the significance must be evaluated in the context of industrial photovoltaic manufacturing. In this high-volume, cost-driven industrial photovoltaic manufacturing, an absolute efficiency gain of 0.1% is considered economically significant. Notably, these improvements are achieved while maintaining substantially lower material CR. This reduction in electrode material usage provides a direct cost saving on silver paste, which is a significant contributor to the front contact metallization cost.

Table 5.
Results of the preliminary comparison with the H-pattern electrode solar cell.
4.3. Unconventional Geometry Solar Cell
To validate the method’s effectiveness for unconventional geometry solar cells, we use it to optimize the front contact metallization patterns of two types of solar cells (hexagonal and circular solar cells). In these unconventional geometry solar cell cases, the same finite element model, material parameters, and current density–voltage relationship as those for traditional square solar cells were used.
4.3.1. Hexagonal Solar Cell
Here, we apply the proposed method to two different hexagonal solar cell configurations, as shown in Figure 11. The side length of the hexagon is set to 1 cm. For each solar cell, the current extraction point is indicated by a red dot. The initial geometries of the front contact metallization patterns of the two studied cases are represented by eight curves, and each curve maintains a consistent six control points.
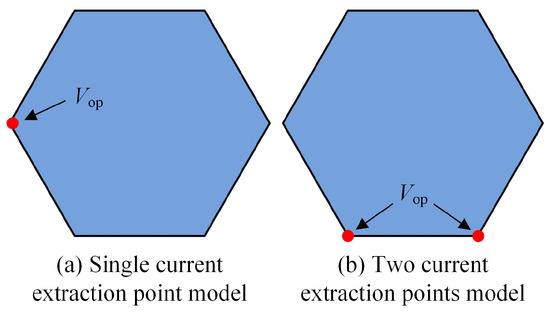
Figure 11.
Two hexagonal solar cells.
Figure 12 shows the initial (first row) and optimized (second row) front contact metallization geometries of the two hexagonal solar cells. The conversion efficiencies of the two solar cells are 13.553% and 13.604%, respectively. It can be seen that increasing the current extraction points helps to enhance the solar cell efficiency by reducing the average distance from the location of current generation to the current extraction point.
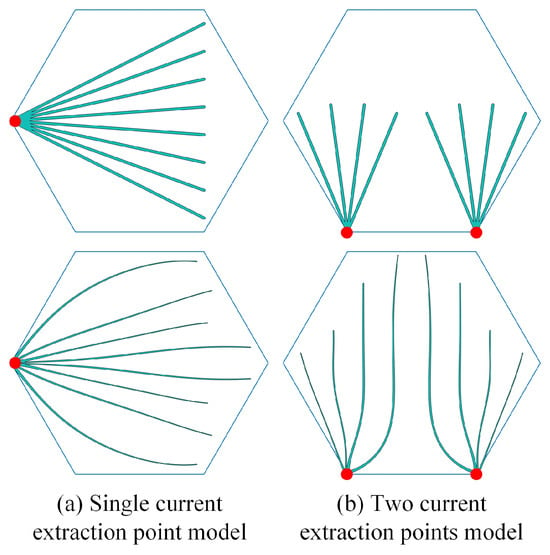
Figure 12.
The initial and optimized front contact metallization patterns of the two hexagonal solar cells.
4.3.2. Circular Solar Cell
This investigation extends to circular solar cells, exemplified by the 1.5 cm diameter configuration in Figure 13a, with its current extraction point marked in red dot. The initial front contact metallization pattern employs 16 curves (each curve has six control points), as shown in Figure 13b. The optimized front contact metallization pattern shown in Figure 13c achieves superior performance metrics (14.043% conversion efficiency at 0.517 V operating voltage). These values exceed those of comparable 1.5 cm × 1.5 cm PUM square cells (in Table 4), primarily attributable to the circular geometry’s reduced average charge transport distance to the central extraction node compared to rectangular configurations. For solar cells with complex geometry, the computation time does not increase compared to PUM solar cells with similar sizes. Specifically, for a circular solar cell with a diameter of 1.5 cm, the calculation time for each step is 1.613 s, while for a PUM solar cell with a size of 1.5 cm × 1.5 cm, the calculation time for each step is 1.736 s. It can be seen that the complex solar cell geometry does not cause an increase in computation time.
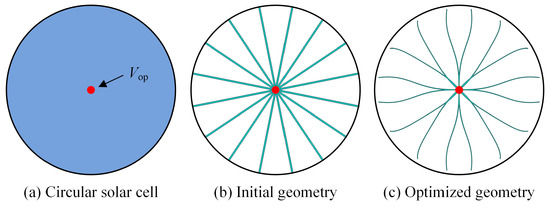
Figure 13.
The circular solar cell.
5. Conclusions
This paper introduces a solar cell model based on the finite element method to analyze the operational behavior of solar cells across various spatial locations. Additionally, a geometry optimization approach is developed to enhance the design of the front contact metallization. The finite element model accurately describes the spatial variations in the operating voltage and current density of the solar cell. The optimization framework employs variable-width Bezier curves to represent the front contact metallization layout, where the curve shape is defined by control point coordinates and associated control circle radii. The front contact metallization pattern is iteratively refined by modifying the relevant design variables by the MMA.
To validate the efficiency of the proposed method, two basic solar cell configurations (side-contact and PUM solar cells) were employed for numerical verification. The presented geometry optimization technique offers superior geometric modeling flexibility compared to conventional approaches by enabling the use of variable-width Bezier curves. Simulation results confirm that the proposed method significantly enhances solar cell efficiency.
Compared with the H-pattern electrode, using the variable-width Bezier curve to describe the front contact metallization patterns can effectively improve the performance of solar cells and minimize the usage of metal electrode materials.
Furthermore, we extend the proposed method to optimize the front contact metallization patterns of unconventional geometry solar cells. Numerical examples indicate that the proposed method can also generate front contact metallization patterns with clear boundaries and high efficiency.
This study optimized the front contact electrode patterns at the device level; a multi-scale understanding could provide deeper insights. In the future, we will integrate drift–diffusion models incorporating interface states, kinetic simulation, and optical models with the current geometry optimization framework and study the robustness of the optimized electrode patterns under different light incidence angles and irradiance spectra. We will also extend the geometry optimization approach by changing the thickness of the curve and introducing free components and apply the geometry optimization approach to a wider range of fields (e.g., transparent conductive electrodes in optoelectronics and heat conduction problems).
Author Contributions
Conceptualization, K.L.; methodology, K.L. and Y.L.; validation, K.L., Y.L., and P.L.; formal analysis, K.L., Y.L., and P.L.; writing—original draft preparation, K.L. and Y.L.; writing—review and editing, K.L. and Y.L.; visualization, K.L., Y.L., and P.L.; supervision, K.L.; project administration, K.L.; funding acquisition, K.L. All authors have read and agreed to the published version of the manuscript.
Funding
This research was funded by the Natural Science Foundation of Xinjiang Uygur Autonomous Region (No. 2022D01C682), the Open Project of Guangdong Key Laboratory of Precision Equipment and Manufacturing Technology (No. PEMT202403), and the Tianchi Program.
Data Availability Statement
Data will be made available on reasonable request.
Conflicts of Interest
The authors declare no conflicts of interest.
References
- Zhao, S.; Li, Q.; Sun, Y.; Wang, D.; Song, Q.; Zhou, S.; Li, J.; Li, Y. Application of multi-objective optimization based on Sobol sensitivity analysis in solar single-double-effect LiBr-H2O absorption refrigeration. Front. Energy 2025, 19, 69–87. [Google Scholar] [CrossRef]
- Procel-Moya, P.; Zhao, Y.; Isabella, O. Unlocking the potential of carrier-selective contacts: Key insights for designing c-Si solar cells with efficiency beyond 28%. Sol. Energy Mater. Sol. Cells 2025, 285, 113504. [Google Scholar] [CrossRef]
- Green, M.A.; Dunlop, E.D.; Yoshita, M.; Kopidakis, N.; Bothe, K.; Siefer, G.; Hao, X.; Jiang, J. Solar cell efficiency tables (version 65). Prog. Photovoltaics: Res. Appl. 2025, 33, 3–15. [Google Scholar] [CrossRef]
- Su, Q.; Lin, H.; Wang, G.; Tang, H.; Xue, C.; Li, Z.; Xu, X.; Gao, P. Theoretical limiting-efficiency assessment on advanced crystalline silicon solar cells with Auger ideality factor and wafer thickness modifications. Prog. Photovoltaics Res. Appl. 2024, 32, 587–598. [Google Scholar] [CrossRef]
- van Deelen, J.; Klerk, L.A.; Barink, M.; Rendering, H.; Voorthuijzen, P.; Hovestad, A. Improvement of transparent conducting materials by metallic grids on transparent conductive oxides. Thin Solid Film. 2014, 555, 159–162. [Google Scholar] [CrossRef]
- Munoz-Garcia, C.; Torres, I.; Canteli, D.; Molla, J.M.; Fernández, S.; Gandía, J.J.; Molpeceres, C. LIFT metallization as an alternative to screen-printing for silicon heterojunction solar cells. Opt. Laser Technol. 2024, 175, 110838. [Google Scholar] [CrossRef]
- Pordan, S.; Mosig, M.; Heitmann, F.; Palme, M.; Heuser, N.; Weil, M.; Steffens, R.; Zuaiter, O.; Kuchler, M.; Pospischil, M. Optimizing solar cell metallization by parallel dispensing. Sol. Energy Mater. Sol. Cells 2024, 266, 112685. [Google Scholar] [CrossRef]
- Lee, Y.; Kim, C.U.; Woo, Y.; Kim, W.M.; Jeong, J.h.; Kim, D.h.; Lee, D.K.; Choi, K.J.; Kim, I. Lithography-free fabrication of a local contact interlayer for Si-based tandem solar cells. Prog. Photovolt. Res. Appl. 2024, 32, 406–416. [Google Scholar] [CrossRef]
- Shan, Y.; Zhang, X.; Chen, G.; Li, K. Laser induced forward transfer of high viscosity silver paste on double groove structure. Opt. Laser Technol. 2022, 148, 107795. [Google Scholar] [CrossRef]
- Alanazi, T.I.; Shaker, A.; Zein, W. Design and simulation of 2D Ruddlesden–Popper perovskite solar cells under LED illumination: Role of ETL and front contact band alignment. Sol. Energy Mater. Sol. Cells 2024, 274, 112992. [Google Scholar] [CrossRef]
- Zhang, D.; Li, B.; Hang, P.; Xie, J.; Yao, Y.; Kan, C.; Yu, X.; Zhang, Y.; Yang, D. Mitigated front contact energy barrier for efficient and stable perovskite solar cells. Energy Environ. Sci. 2024, 17, 3848–3854. [Google Scholar] [CrossRef]
- da Silva Filho, J.M.C.; Gonçalves, A.D.; Marques, F.C.; de Freitas, J.N. A Review on the Development of Metal Grids for the Upscaling of Perovskite Solar Cells and Modules. Sol. RRL 2022, 6, 2100865. [Google Scholar] [CrossRef]
- Liu, Y.; Li, K.; Zhou, B.; Li, X.; Li, P. Optimal design of solar cells grid electrodes based on quadratic curves. Results Eng. 2025, 27, 106322. [Google Scholar] [CrossRef]
- Liu, Y.; Li, K.; Li, X.; Li, P. Optimization design of electrode grid lines for busbar-less solar cells. AIP Adv. 2025, 15, 105125. [Google Scholar] [CrossRef]
- Nakano-Baker, O.; Boyd, C.; Cramer, C.; Brush, L.; MacKenzie, J.D. Isotropic Grids Revisited: A Numerical Study of Solar Cell Electrode Geometries. IEEE Trans. Electron Devices 2022, 69, 3783–3790. [Google Scholar] [CrossRef]
- Flat, A.; Milnes, A.G. Optimization of multi-layer front-contact grid patterns for solar cells. Sol. Energy 1979, 23, 289–299. [Google Scholar] [CrossRef]
- Green, M.A. Solar Cells: Operating Principles, Technology, and System Applications; Prentice-Hall, Inc.: Englewood Cliffs, NJ, USA, 1982. [Google Scholar]
- Djeffal, F.; Bendib, T.; Arar, D.; Dibi, Z. An optimized metal grid design to improve the solar cell performance under solar concentration using multiobjective computation. Mater. Sci. Eng. B 2013, 178, 574–579. [Google Scholar] [CrossRef]
- Liu, W.; Li, Y.; Chen, J.; Chen, Y.; Wang, X.; Yang, F. Optimization of grid design for solar cells. J. Semicond. 2010, 31, 014006. [Google Scholar] [CrossRef]
- Malm, U.; Edoff, M. Influence from front contact sheet resistance on extracted diode parameters in CIGS solar cells. Prog. Photovolt. Res. Appl. 2008, 16, 113–121. [Google Scholar] [CrossRef]
- Li, B.; Xuan, C.; Liu, G.; Hong, J. Generating Constructal Networks for Area-to-Point Conduction Problems Via Moving Morphable Components Approach. J. Mech. Des. 2019, 141, 051401. [Google Scholar] [CrossRef]
- Gupta, D.K.; Barink, M.; Langelaar, M. CPV solar cell modeling and metallization optimization. Sol. Energy 2018, 159, 868–881. [Google Scholar] [CrossRef]
- Li, K.; Yang, Z.; Zhang, X. Size optimization of the front electrode and solar cell using a combined finite-element-genetic algorithm method. J. Photonics Energy 2021, 11, 034502. [Google Scholar] [CrossRef]
- van Deelen, J.; Barink, M.; Klerk, L.; Voorthuijzen, P.; Hovestad, A. Efficiency loss prevention in monolithically integrated thin film solar cells by improved front contact. Prog. Photovoltaics: Res. Appl. 2015, 23, 498–506. [Google Scholar] [CrossRef]
- van Deelen, J.; Frijters, C. CIGS cells with metallized front contact: Longer cells and higher efficiency. Sol. Energy 2017, 143, 93–99. [Google Scholar] [CrossRef]
- Li, K.; Liu, Y.; Li, P. Design of the Front Electrode Patterns of Solar Cells Using Geometry-Driven Optimization Method Based on Wide Quadratic Curves. Appl. Sci. 2025, 15, 11154. [Google Scholar] [CrossRef]
- Gupta, D.K.; Barink, M.; Galagan, Y.; Langelaar, M. Integrated Front-Rear-Grid Optimization of Free-Form Solar Cells. IEEE J. Photovolt. 2017, 7, 294–302. [Google Scholar] [CrossRef]
- Liang, J.; Zhang, X.; Zhu, B.; Zhang, H.; Wang, R. Topology Optimization Method for Designing Compliant Mechanism with Given Constant Force Range. J. Mech. Robot.-Trans. ASME 2023, 15, 1942–4302. [Google Scholar] [CrossRef]
- Wang, R.; Zhang, X.; Zhu, B.; Li, H.; Zhong, X.; Xu, N. A Topology-Optimized Compliant Microgripper with Replaceable Modular Tools for Cross-Scale Microassembly. IEEE-ASME Trans. Mechatron. 2024, 29, 2067–2078. [Google Scholar] [CrossRef]
- Zhang, X.; Zhu, B. Topology Optimization of Compliant Mechanisms, 1st ed.; Springer: Singapore, 2018; p. 192. [Google Scholar]
- Gupta, D.K.; Langelaar, M.; Barink, M.; van Keulen, F. Topology optimization of front metallization patterns for solar cells. Struct. Multidiscip. Optim. 2015, 51, 941–955. [Google Scholar] [CrossRef]
- Sigmund, O.; Petersson, J. Numerical instabilities in topology optimization: A survey on procedures dealing with checkerboards, mesh-dependencies and local minima. Struct. Optim. 1998, 16, 68–75. [Google Scholar] [CrossRef]
- Rozvany, G.I.N. A critical review of established methods of structural topology optimization. Struct. Multidiscip. Optim. 2009, 37, 217–237. [Google Scholar] [CrossRef]
- Liang, J.; Zhang, X.; Zhu, B. Nonlinear topology optimization of parallel-grasping microgripper. Precis. Eng. 2019, 60, 152–159. [Google Scholar] [CrossRef]
- Xia, L.; Xia, Q.; Huang, X.; Xie, Y.M. Bi-directional Evolutionary Structural Optimization on Advanced Structures and Materials: A Comprehensive Review. Arch. Comput. Methods Eng. 2018, 25, 437–478. [Google Scholar] [CrossRef]
- Zhang, W.; Zhang, S.; Youn, S.K.; Guo, X. Non-parametric geometry patching technique for MMC topology optimization. Struct. Multidiscip. Optim. 2024, 67, 77. [Google Scholar] [CrossRef]
- Zhang, W.; Tian, H.; Zhu, B.; Guo, X.; Youn, S.K. Multi-Set MMV Topology Optimization Approach for Sliding Surface Texture Design. Int. J. Numer. Methods Eng. 2025, 126, e7612. [Google Scholar] [CrossRef]
- Wang, R.; Zhang, X.; Zhu, B. A projective transformation-based topology optimization using moving morphable components. Comput. Methods Appl. Mech. Eng. 2021, 376, 113646. [Google Scholar] [CrossRef]
- Li, K.; Wang, R.; Zhang, X.; Zhu, B.; Liang, J.; Yang, Z. Topology optimization of the front electrode patterns of solar cells based on moving wide Bezier curves with constrained end. Struct. Multidiscip. Optim. 2022, 65, 57. [Google Scholar] [CrossRef]
- Rounis, E.D.; Athienitis, A.K.; Stathopoulos, T. BIPV/T curtain wall systems: Design, development and testing. J. Build. Eng. 2021, 42, 103019. [Google Scholar] [CrossRef]
- Gholami, H.; Røstvik, H.N. Economic analysis of BIPV systems as a building envelope material for building skins in Europe. Energy 2020, 204, 117931. [Google Scholar] [CrossRef]
- Gupta, D.K.; Langelaar, M.; Barink, M.; van Keulen, F. Optimizing front metallization patterns: Efficiency with aesthetics in free-form solar cells. Renew. Energy 2016, 86, 1332–1339. [Google Scholar] [CrossRef]
- Macabebe, E.Q.B.; Sheppard, C.J.; van Dyk, E.E. Parameter extraction from I–V characteristics of PV devices. Sol. Energy 2011, 85, 12–18. [Google Scholar] [CrossRef]
- Huang, G.; Liang, Y.; Sun, X.; Xu, C.; Yu, F. Analyzing S-Shaped I–V characteristics of solar cells by solving three-diode lumped-parameter equivalent circuit model explicitly. Energy 2020, 212, 118702. [Google Scholar] [CrossRef]
- Li, K.; Zhang, X.; Yang, Z. Finite element method description and intrinsic parameters extraction of solar cells with different sizes and metallization patterns. Sol. Energy 2022, 247, 261–268. [Google Scholar] [CrossRef]
- Guo, X.; Zhang, W.; Zhong, W. Doing Topology Optimization Explicitly and Geometrically—A New Moving Morphable Components Based Framework. J. Appl. Mech.-Trans. ASME 2014, 81, 081009. [Google Scholar] [CrossRef]
- Zhu, B.; Wang, R.; Wang, N.; Li, H.; Zhang, X.; Nishiwaki, S. Explicit structural topology optimization using moving wide Bezier components with constrained ends. Struct. Multidiscip. Optim. 2021, 64, 53–70. [Google Scholar] [CrossRef]
- van Keulen, F.; Haftka, R.T.; Kim, N.H. Review of options for structural design sensitivity analysis. Part 1: Linear systems. Comput. Methods Appl. Mech. Eng. 2005, 194, 3213–3243. [Google Scholar] [CrossRef]
- Svanberg, K. The method of moving asymptotes—a new method for structural optimization. Int. J. Numer. Methods Eng. 1987, 24, 359–373. [Google Scholar] [CrossRef]
- Zhu, B.; Wang, R.; Liang, J.; Lai, J.; Zhang, H.; Li, H.; Li, H.; Nishiwaki, S.; Zhang, X. Design of compliant mechanisms: An explicit topology optimization method using end-constrained spline curves with variable width. Mech. Mach. Theory 2022, 171, 104713. [Google Scholar] [CrossRef]
Disclaimer/Publisher’s Note: The statements, opinions and data contained in all publications are solely those of the individual author(s) and contributor(s) and not of MDPI and/or the editor(s). MDPI and/or the editor(s) disclaim responsibility for any injury to people or property resulting from any ideas, methods, instructions or products referred to in the content. |
© 2025 by the authors. Licensee MDPI, Basel, Switzerland. This article is an open access article distributed under the terms and conditions of the Creative Commons Attribution (CC BY) license (https://creativecommons.org/licenses/by/4.0/).
