Abstract
This study aims to evaluate the ability of an artificial intelligence (AI) model developed for use in the field of orthodontics to accurately and reliably classify skeletal maturation stages of individuals using hand–wrist radiographs. A total of 809 grayscale hand–wrist radiographs (250 × 250 px; pre-peak n = 400, peak n = 100, post-peak n = 309) were analyzed using four complementary image-based feature extraction methods: Local Binary Pattern (LBP), Histogram of Oriented Gradients (HOG), Zernike Moments (ZM), and Intensity Histogram (IH). These methods generated 2355 features per image, of which 2099 were retained after variance thresholding. The most informative 1250 features were selected using the ANOVA F-test and classified with a stacking-based machine learning (ML) architecture composed of Light Gradient Boosting Machine (LightGBM) and Logistic Regression (LR) as base learners, and Random Forest (RF) as the meta-learner. Across all evaluation folds, the average performance of the model was Accuracy = 83.42%, Precision = 84.48%, Recall = 83.42%, and F1 = 83.50%. The proposed model achieved 87.5% accuracy, 87.8% precision, 87.5% recall, and an F1-score of 87.6% in 10-fold cross-validation, with a macro-average area under the ROC curve (AUC) of 0.96. The pre-peak stage, corresponding to the period of maximum growth velocity, was identified with 92.5% accuracy. These findings indicate that integrating handcrafted radiographic features with ensemble learning can enhance diagnostic precision, reduce observer variability, and accelerate evaluation. The model provides an interpretable and clinically applicable AI-based decision-support tool for skeletal maturity assessment in orthodontic practice.
1. Introduction
Orthodontic treatment planning does not only focus on correcting existing skeletal and dental malocclusions but also includes the processes of accurately assessing and guiding the patient’s growth and developmental potential. In this context, determining skeletal maturation is of critical importance to optimize the timing of orthodontic/orthopedic interventions, especially during the growth spurt period []. Among the methods used for this purpose, hand–wrist radiographs are widely preferred for their reliability and established clinical utility.
Hand–wrist radiographs allow estimation of bone age based on developmental landmarks, commonly assessed using the Greulich and Pyle Atlas or Fishman’s Skeletal Maturity Indicators (SMI) []. However, such manual assessments depend heavily on the observer’s experience and are prone to inter- and intra-observer variability. Furthermore, manual scoring is time-consuming and impractical in clinics with high patient flow [].
In recent years, advances in artificial intelligence (AI) technologies have created significant transformations in the medical field, particularly in image processing applications. Deep learning, as a sub-branch of machine learning (ML), has achieved successful results in the classification and interpretation of medical images, especially through convolutional neural networks (CNNs) []. The developed algorithms can demonstrate human-like analytical capabilities by learning from large datasets and, in some cases, even surpass human performance [].
The integration of image processing techniques with ML algorithms and their application to classification problems has led to remarkable success in many fields. In areas such as biomedical imaging, industrial control systems, and security applications, image-derived features have become the primary determinants of classification performance [,].
In this context, feature extraction methods such as Local Binary Pattern (LBP), Histogram of Oriented Gradients (HOG), Zernike Moments (ZM), and Intensity Histogram (IH) enable the conversion of structural and statistical information in images into numerical data suitable for machine learning. Since the high-dimensional feature vectors obtained can effectively distinguish between classes, selecting and processing these features directly influences model accuracy. Therefore, effective feature extraction and the use of powerful classifiers are crucial steps that determine the accuracy, reliability, and generalizability of image-based decision support systems [,].
As in other scientific disciplines, the use of AI in orthodontics has become increasingly widespread. Numerous applications are being developed, from automating cephalometric analyses to performing tooth-size and arch-length discrepancy analyses, classifying malocclusions, and estimating skeletal growth stages [,,,]. In particular, AI-supported analysis of hand- wrist radiographs has the potential to provide faster, more consistent, and standardized results compared to manual evaluation.
The novelty of the present study lies in the integration of a multi-method feature extraction pipeline with a stacking ensemble architecture—combining LightGBM and Logistic Regression as base learners and Random Forest as a meta-learner—to classify skeletal maturation stages from wrist radiographs. To the best of our knowledge, this is the first application of a LightGBM–Logistic Regression–Random Forest stacking model in orthodontic skeletal maturity analysis.
This study aims to evaluate the ability of an AI model developed for orthodontic use to accurately and reliably classify skeletal maturation stages through hand–wrist radiographs.
2. Materials and Methods
In this study, hand–wrist radiographs routinely taken as part of the preliminary diagnosis and treatment planning for orthodontic treatment at the Department of Orthodontics, Faculty of Dentistry, Batman University, were retrospectively evaluated. A total of 1580 radio-graphs were obtained from patients aged 10–18 years. All radiographs were taken using the Planmeca ProMax digital imaging system (Planmeca Oy, Helsinki, Finland) according to the manufacturer’s standard positioning and exposure guidelines. No additional radiation was administered to any individual in this study; all images were selected from pre-existing clinical records. Patient identities were kept confidential, and only anonymized data were used for research purposes. The study protocol was approved by the Ethics Committee of Batman University (Approval No: 2025/04-33).
After quality control and eligibility screening, 809 radiographs (410 females, 399 males; mean age 13.9 ± 1.7 years) were included. Radiographs with anatomical abnormalities, artifacts, or poor image quality were excluded. Skeletal maturation was assessed according to the Grave and Brown method [] and categorized into three stages: pre-peak, peak, and post-peak. Two orthodontists performed independent classifications, with discrepancies resolved by a third expert. Inter- and intra-observer reliability were excellent (κ > 0.90). The class distribution is summarized in Table 1.
Table 1.
Summarizes the distribution of radiographs per class.
2.1. Skeletal Maturation Classification
The pre-peak, peak, and post-peak stages used in this study correlate with skeletal maturity assessment systems commonly used in orthodontics. The pre-peak period corresponds to SMI stages 1–3 or CVM stages 1–2, when growth begins to accelerate. The peak phase is the period when growth velocity is highest, corresponding to the SMI 4–7 and CVM 3–4 ranges. The post-peak phase is the period when growth slows down or is completed, corresponding to SMI 8–11 or CVM 5–6 levels.
A total of 1580 radiographs obtained from orthodontic patients aged 10–18 years were screened, and 809 radiographs (420 females, 389 males) were included after excluding images with poor quality, pathology, or incomplete metadata. Each patient contributed one radiograph to ensure subject-level independence. All images were obtained using the same digital device (Planmeca ProMax, Helsinki, Finland) at standardized exposure settings (66 kVp, 8 mA, 0.64 s). The final dataset was distributed as pre-peak (n = 268), peak (n = 271), and post-peak (n = 270) stages, with mean ± SD ages of 12.4 ± 1.1, 13.6 ± 1.2, and 15.2 ± 1.3 years, respectively. Two experienced orthodontists independently labeled 100 randomly selected radiographs to assess reliability. Intra-rater and inter-rater agreements were excellent, with Cohen’s κ = 0.89 (95% CI: 0.84–0.94) and κ = 0.85 (95% CI: 0.79–0.90), respectively. Any disagreements were resolved by consensus.
Clinically, the peak phase is the most suitable time for functional appliance treatments, as mandibular growth is at its highest level during this period. While treatments initiated in the pre-peak phase offer the advantage of monitoring growth potential, dentoalveolar camouflage or surgical treatment approaches are preferred in the post-peak phase, as the effect of growth diminishes.
2.2. Feature Extraction
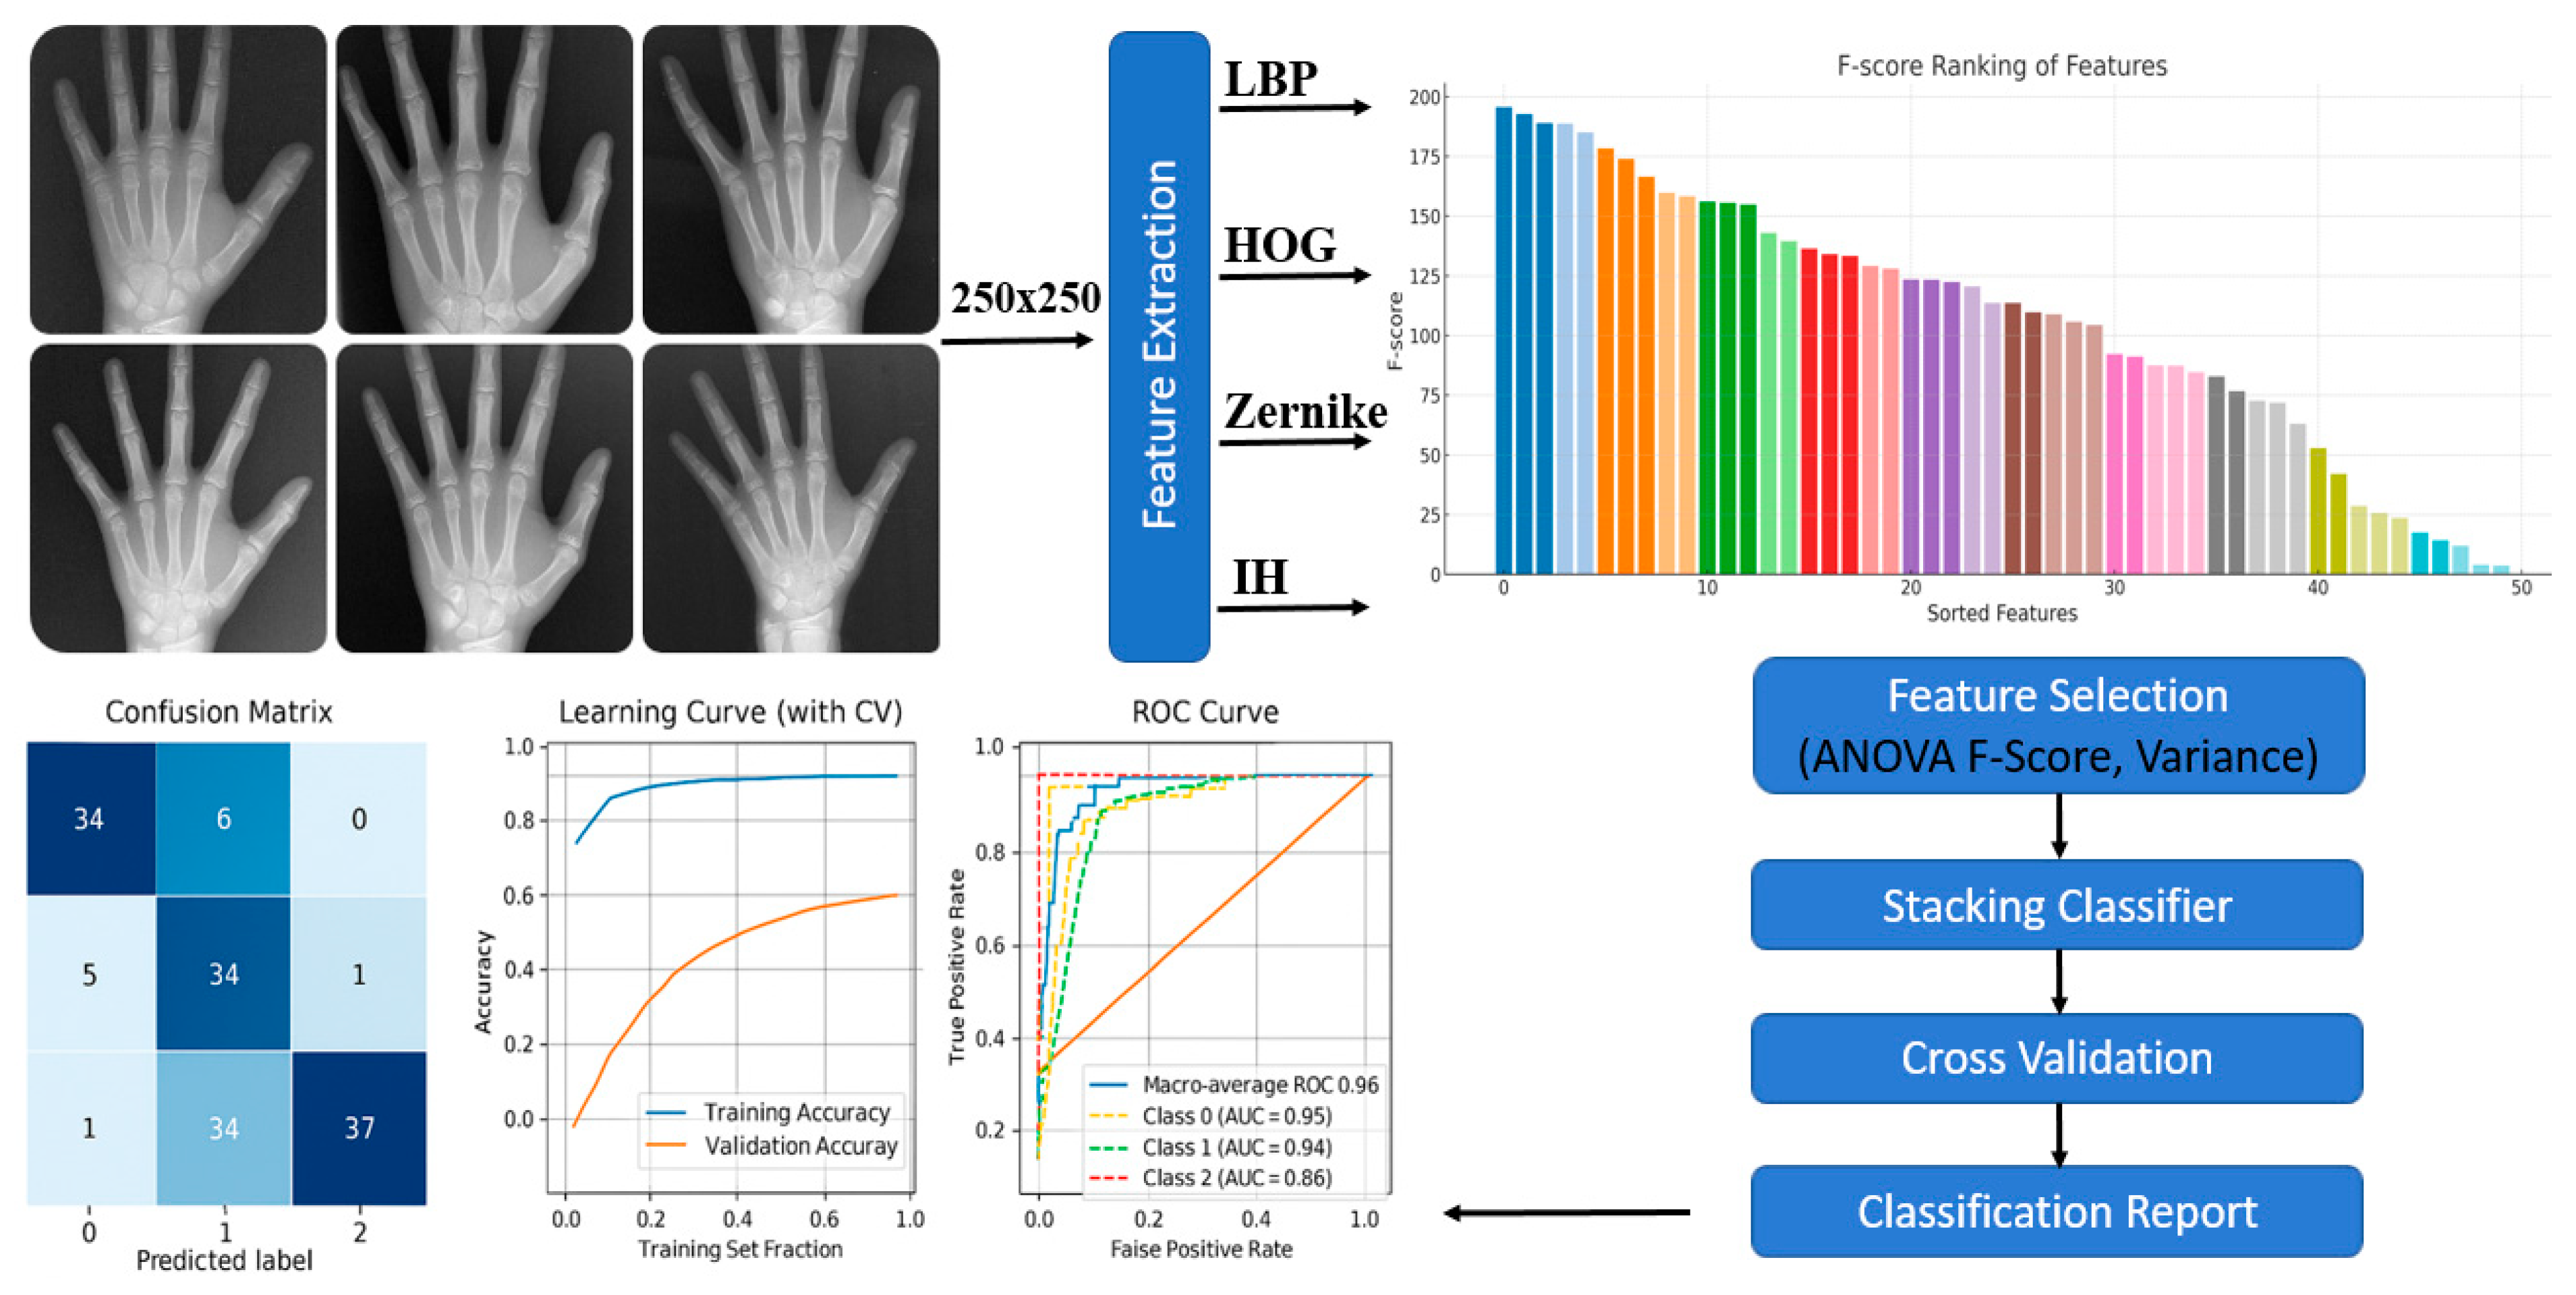
To accurately and reliably classify skeletal maturation stages from hand–wrist radiographs, representative and discriminative features must be extracted from the images. In this study, four complementary image-based feature extraction methods were employed: Local Binary Pattern (LBP), Histogram of Oriented Gradients (HOG), Zernike Moments (ZM), and Intensity Histogram (IH). These techniques capture texture, shape, and intensity-based information, which collectively characterize skeletal structures at different developmental stages (Figure 1).
Figure 1.
Workflow of the AI-based bone growth stage classification method.
- LBP captures fine textural patterns and micro-morphological variations in bone tissue, providing local-level structural representation.
- HOG focuses on gradient orientation and edge distribution, emphasizing contour and morphological boundaries of bone structures.
- Zernike Moments describe the geometrical properties of symmetric and asymmetric bone shapes, offering robust rotation- and scale-invariant descriptors.
- Intensity Histogram analyzes grayscale pixel distribution, distinguishing between bone and surrounding soft tissues based on brightness variations.
By integrating these local and global features, the composite feature vector provided a comprehensive and discriminative numerical representation of each radiograph [,,,].
2.3. Data Augmentation
To ensure class balance and improve the model’s generalization ability, controlled transformations (horizontal flip, ±5° small angular rotations, Gaussian blur, and histogram equalization) were applied only to the training data within each fold. Vertical flips were excluded due to anatomical implausibility. Each augmentation type was applied with a 0.3 probability, mitigating overfitting by simulating realistic imaging variations without data leakage [,].
2.4. Feature Selection
In machine learning-based classification models, the presence of high-dimensional feature spaces can increase computational cost and reduce generalization performance. Therefore, a two-stage feature selection strategy was applied:
Variance Threshold: Features with zero variance were removed (threshold = 0), eliminating redundant or uninformative variables. This reduced 2355 extracted features to 2099 meaningful ones.
SelectKBest (ANOVA F-test): Features were ranked according to their F-scores. The top 1250 features were retained, as preliminary validation curves showed that classification accuracy plateaued beyond this number. Thus, 1250 was empirically determined as the optimal dimensionality for maximizing accuracy without overfitting [,].
Feature selection was performed only on the training data for each cross-validation fold to prevent data leakage. The feature selectors were fitted on the training subset and then applied to the validation subset, ensuring methodological independence and reproducibility. This two-step approach ensured model efficiency, stability, and interpretability by preserving discriminative features while reducing computational load.
2.5. Base Learners
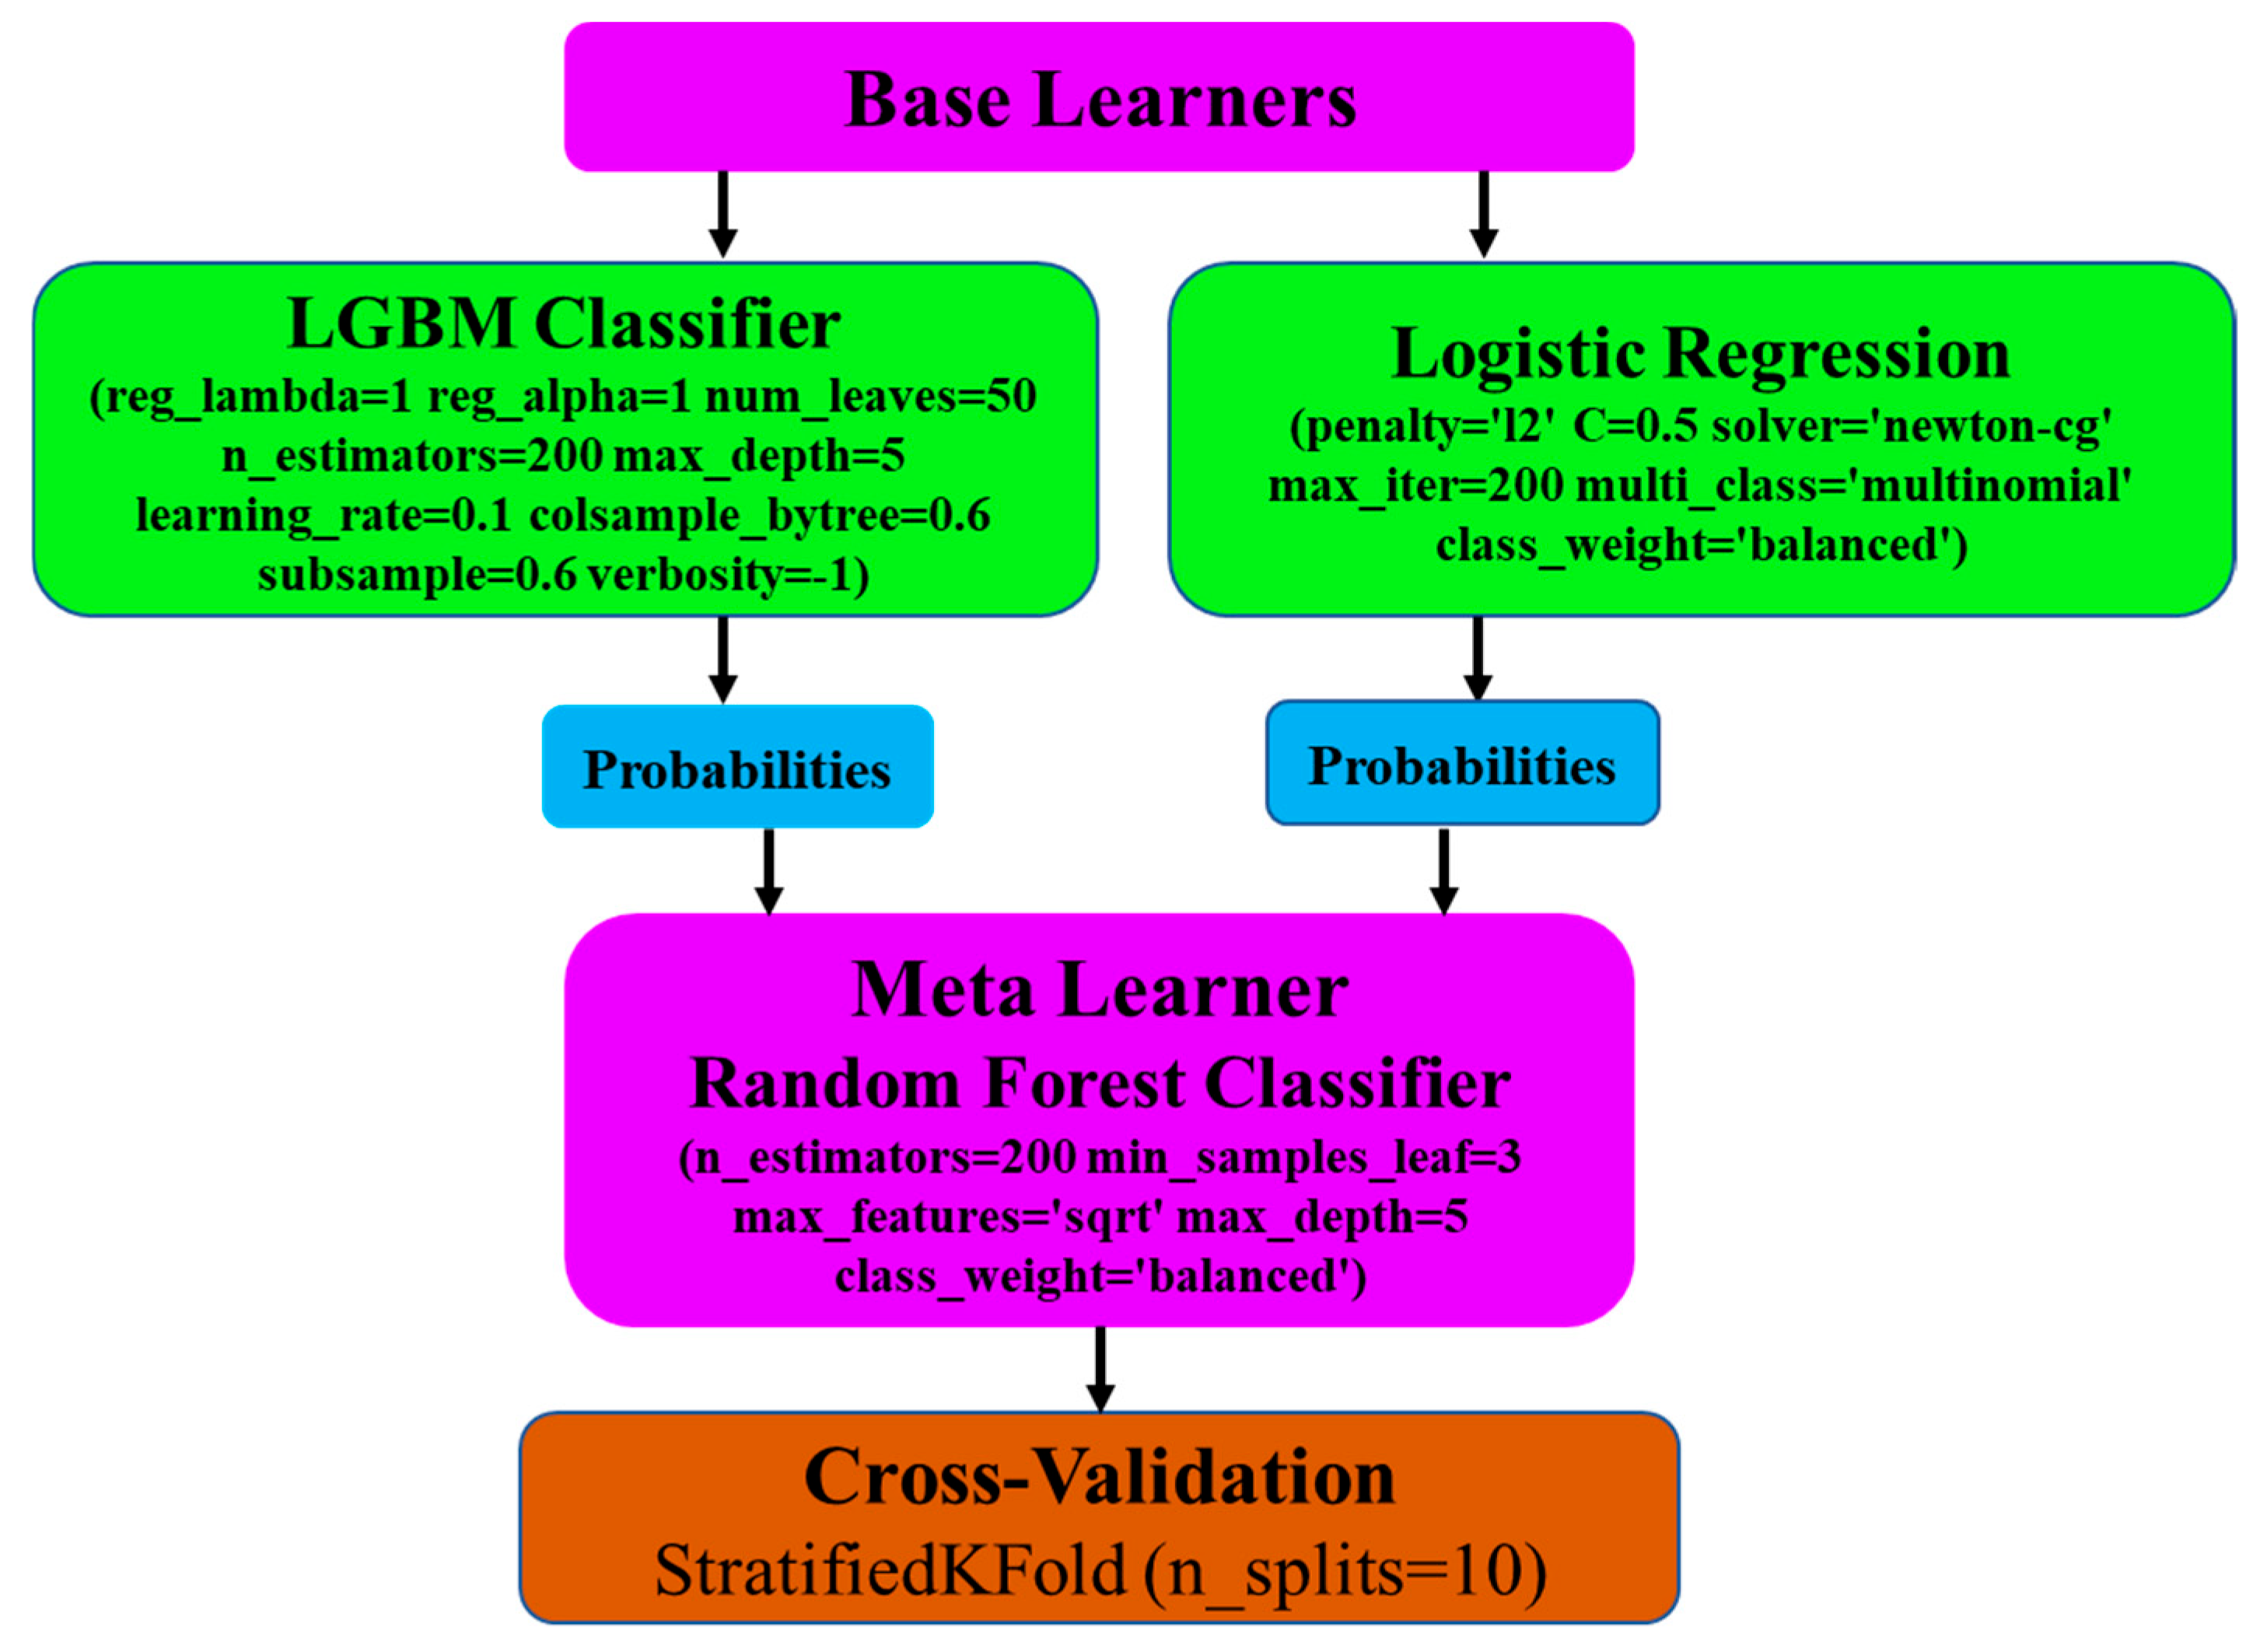
The stacking architecture consisted of two layers. In the first layer, LightGBM and Logistic Regression served as base learners (Figure 2).
Figure 2.
Architecture and hyperparameters of the proposed stacking ensemble model.
LightGBM was selected for its ability to capture complex, non-linear interactions and handle high-dimensional data efficiently [,].
Logistic Regression, in contrast, modeled linear relationships and provided interpretable decision boundaries.
This complementary pairing was chosen to exploit both non-linear and linear information, allowing the meta-learner to combine distinct predictive patterns effectively [,].
2.6. Meta Learner
The Random Forest (RF) classifier was employed as the meta-learner to combine probabilistic predictions from the base learners. RF was chosen for its robustness against class imbalance, capacity to average variance across multiple trees, and resistance to overfitting. Base learner outputs (class probabilities) were used as input features for the RF, creating a second-layer model that integrates the strengths of both base learners.
To prevent overfitting and ensure unbiased meta-training, 10-fold stratified cross-validation was applied using the StratifiedKFold method [,]. Each data sample was excluded from training at least once, generating realistic out-of-fold predictions for meta-learning.
2.7. Model Evaluation and Performance Metrics
Model performance was evaluated using standard classification metrics: accuracy, precision, recall, and F1-score, along with Receiver Operating Characteristic (ROC) curve analysis.
Accuracy = (TP + TN)/(TP + TN + FP + FN)
Precision = TP/(TP + FP)
Recall = TP/(TP + FN)
F1-score = 2 × (Precision × Recall)/(Precision + Recall)
A confusion matrix was also used to summarize correct and incorrect predictions for each class [].
To strengthen clinical interpretability, additional evaluation metrics were introduced: probability calibration using isotonic regression, calibration curves, and Brier score analysis. Macro- and micro-averaged ROC-AUC values were reported with 95% confidence intervals, and precision–recall AUC (PR-AUC) was calculated to assess class imbalance effects. The macro-AUC metric was predefined as the primary endpoint to ensure balanced evaluation across all classes.
All analyses were conducted on a workstation equipped with an Intel Core i9-13900K CPU, 64 GB RAM, and an NVIDIA RTX 4090 GPU, running Windows 11. The implementation utilized Python 3.10 and libraries including scikit-learn 1.4.2, LightGBM 4.1.0, NumPy 1.26, and Matplotlib 3.9.
3. Results
A total of 809 grayscale hand–wrist radiographs (250 × 250 px) were analyzed. Feature extraction with four image processing techniques (LBP, HOG, ZM, IH) yielded 2355 features per image. After variance thresholding, 2099 features were retained for analysis.
Using ANOVA F-test–based ranking, the top 1250 features were selected, as performance evaluation across varying feature set sizes demonstrated no further accuracy improvement beyond this number (Figure 3).
Figure 3.
Distribution of the most influential features in the classification process.
The stacking model composed of LightGBM + Logistic Regression → Random Forest achieved the following results across 10-fold stratified cross-validation:
Average performance: Accuracy = 83.42% (95% CI = ±1.8%), Precision = 84.48% (±2.0%), Recall = 83.42% (±2.1%), F1 = 83.50% (±1.9%).
Best fold (Fold 1): Accuracy = 87.5%, Precision = 87.77%, Recall = 87.5%, F1 = 87.6%.
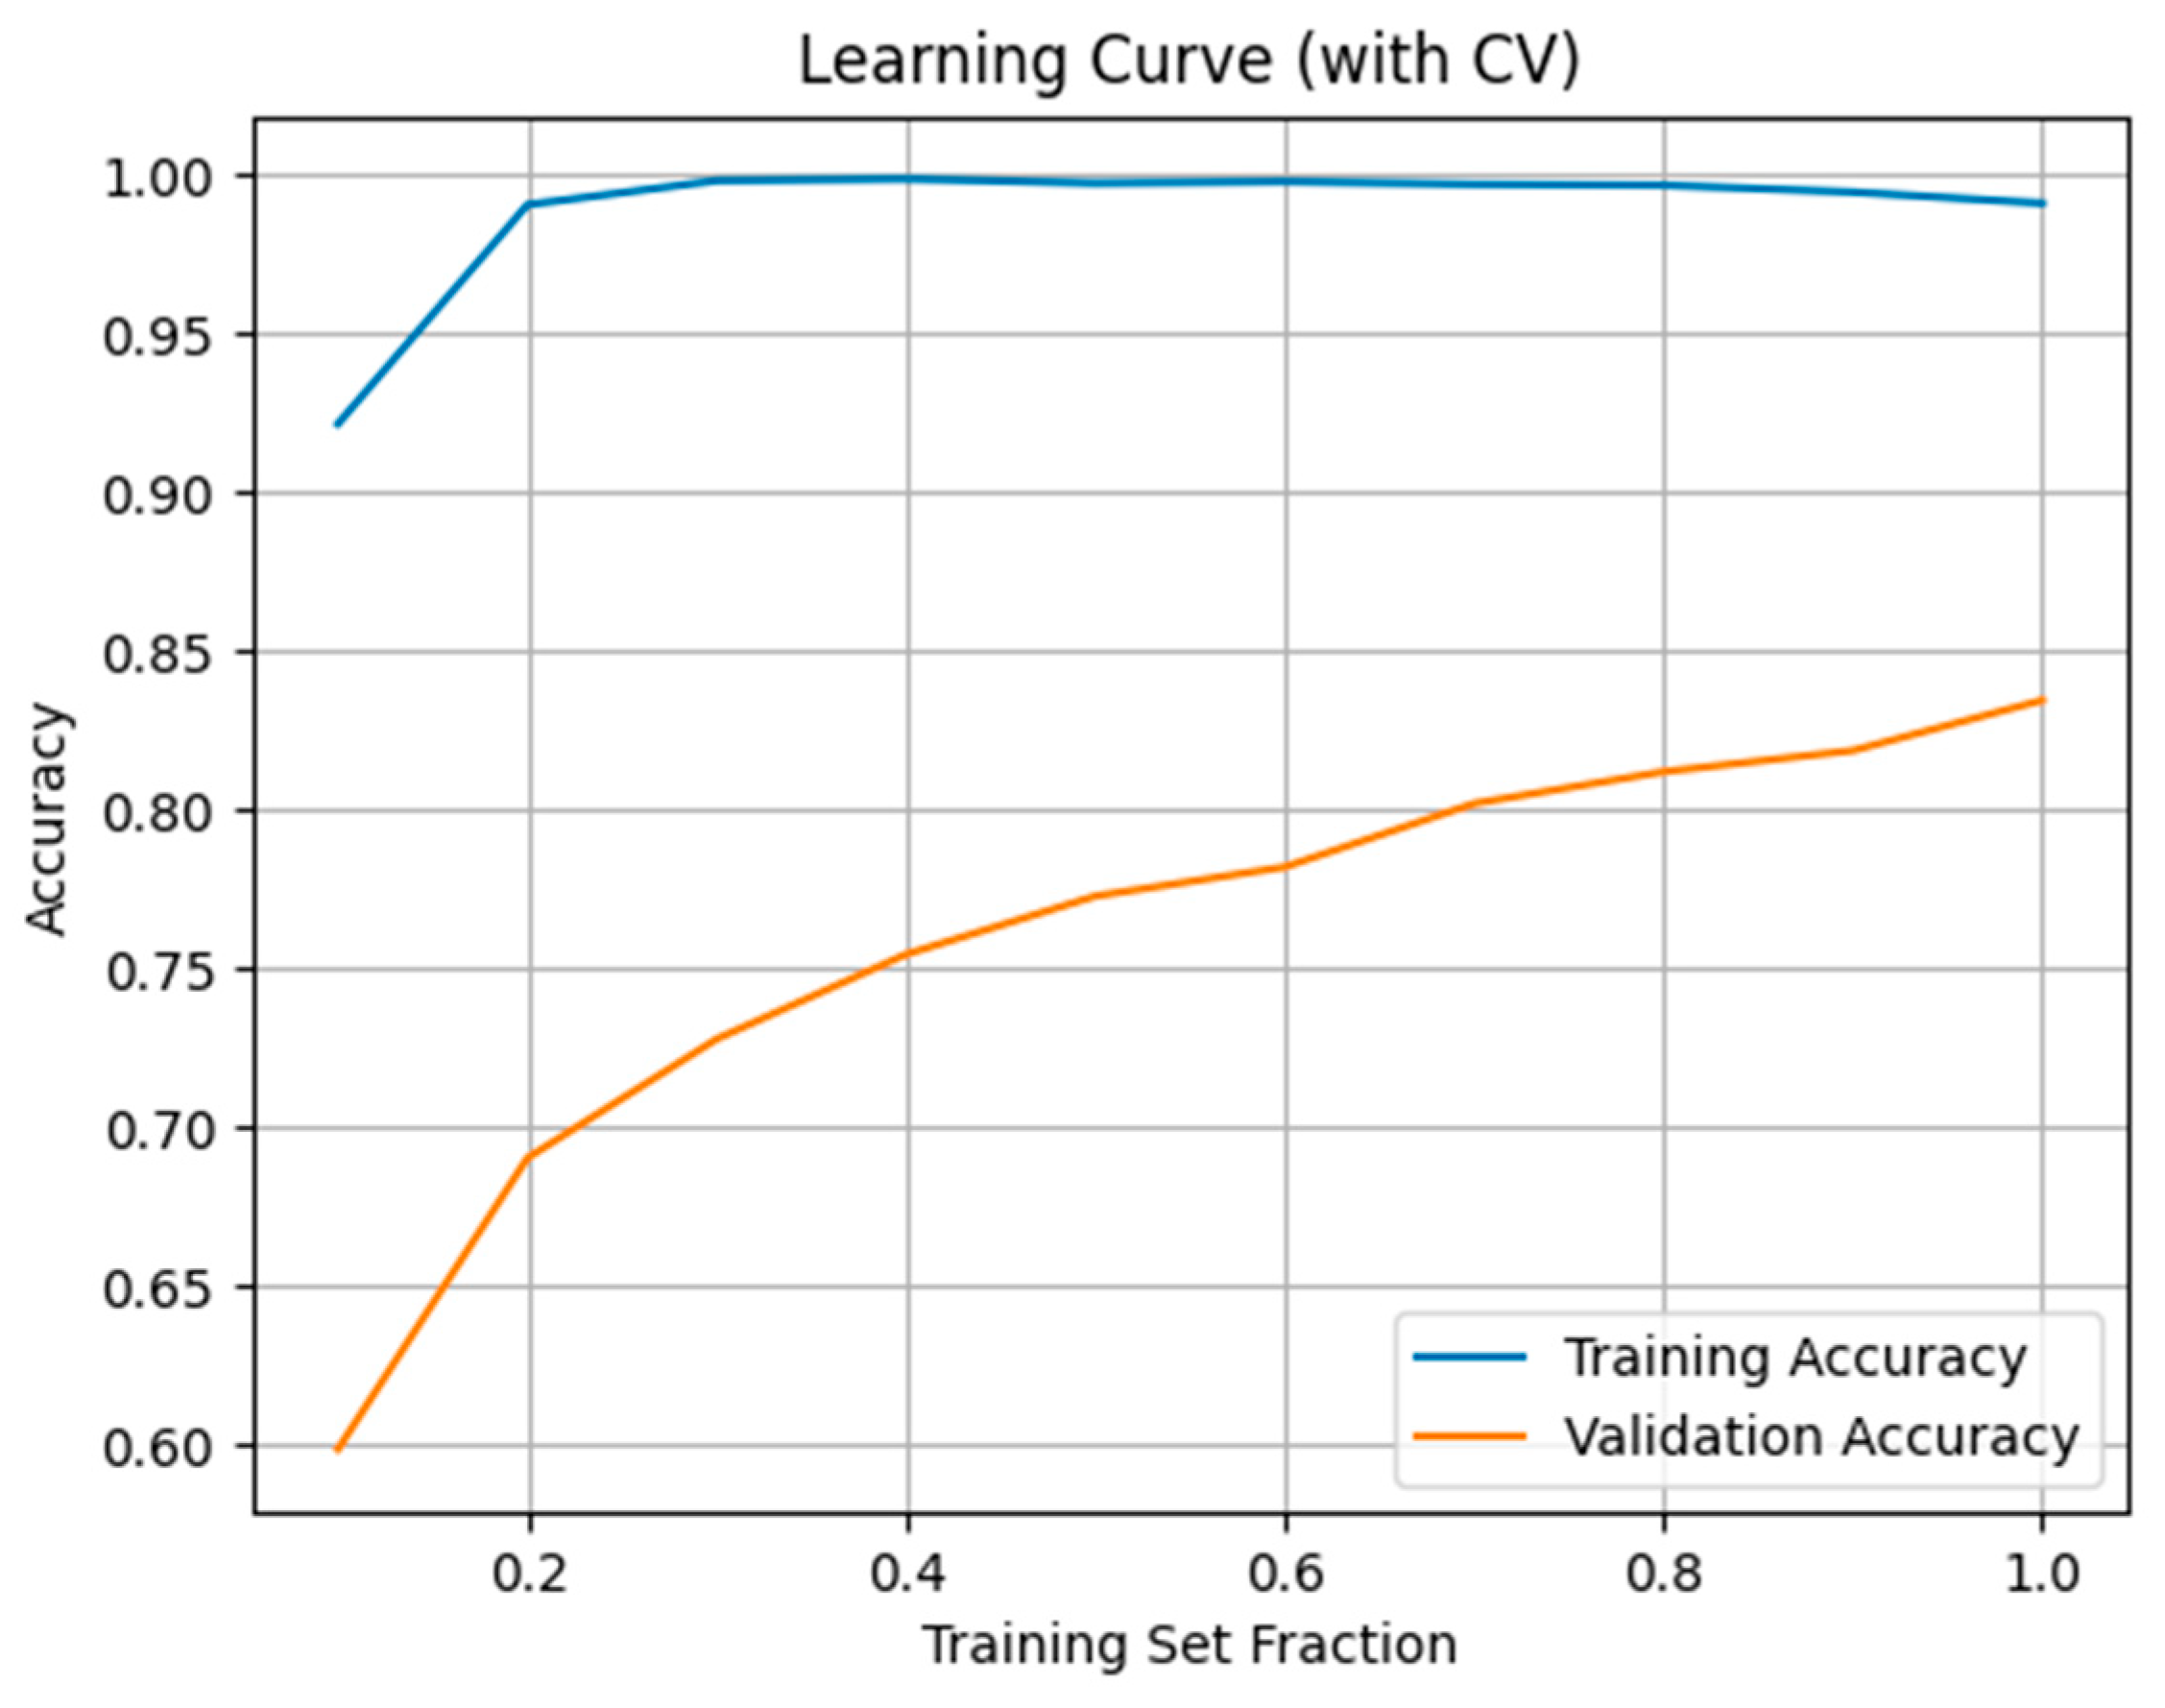
The learning curve (Figure 4) indicated early convergence and stable validation accuracy, confirming effective generalization without overfitting.
Figure 4.
Model performance across different training data proportions.
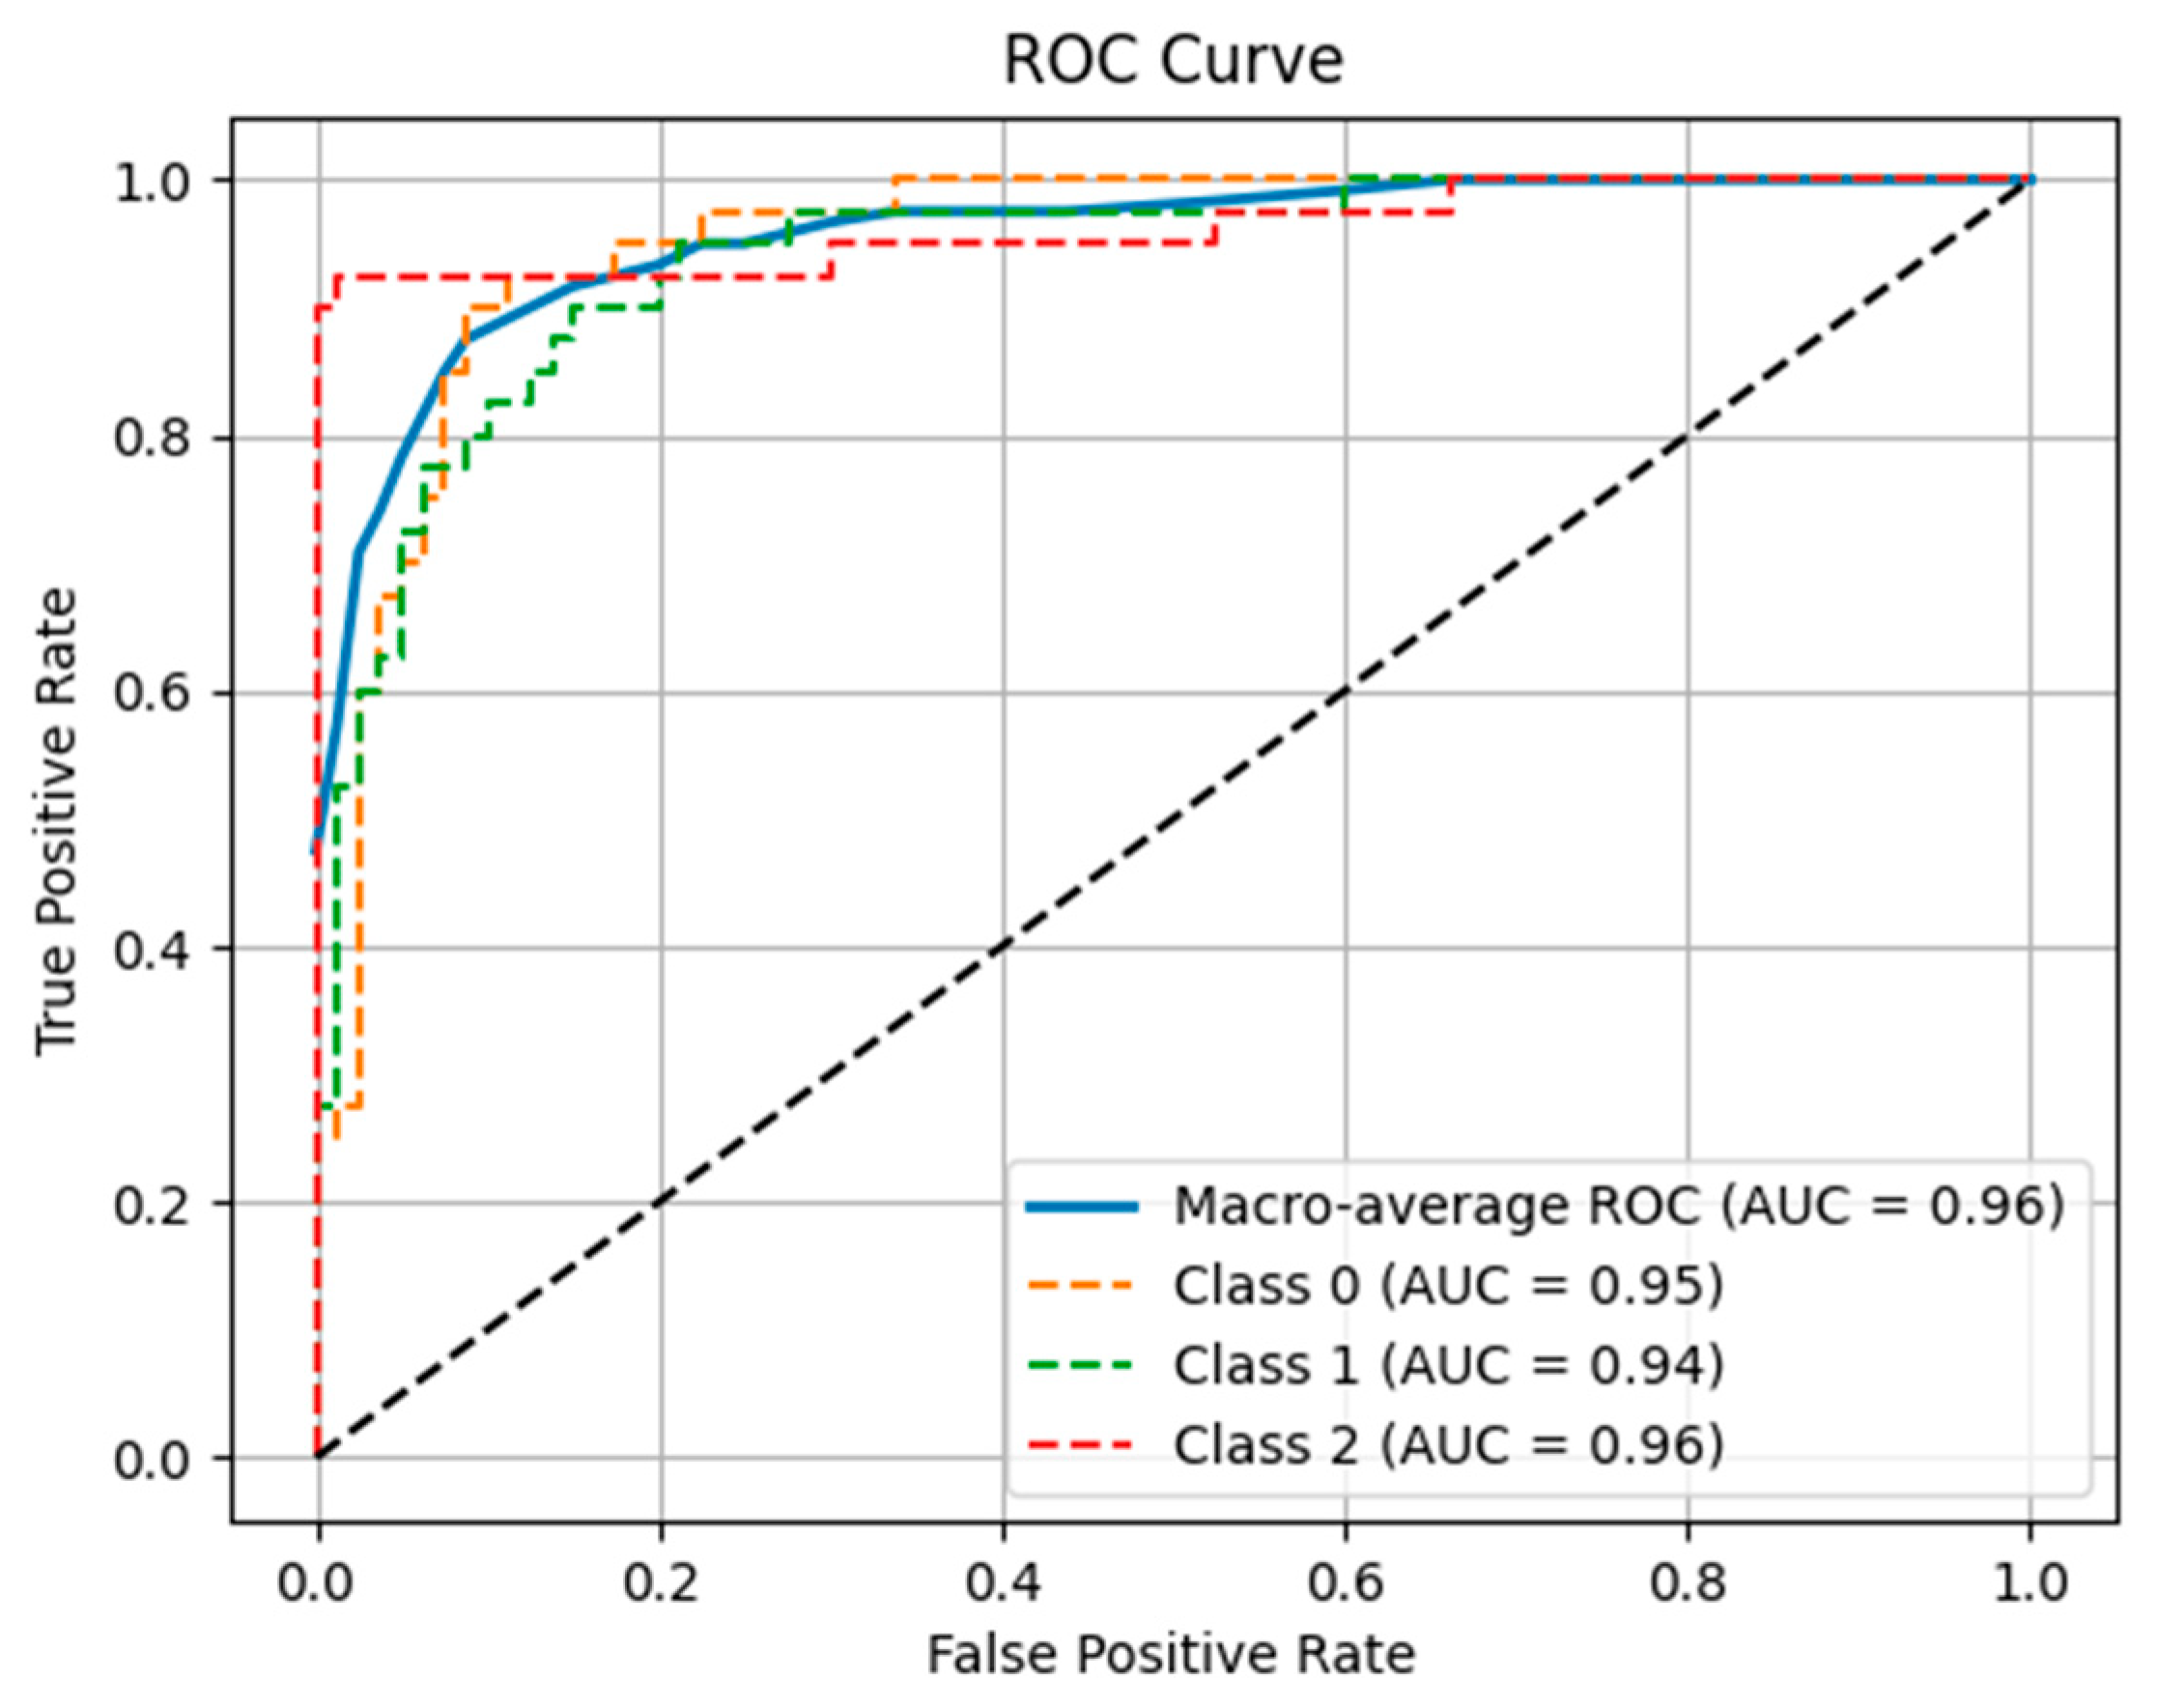
ROC analysis: The area under the curve (AUC) values were 0.95 (pre-peak), 0.94 (post-peak), and 0.96 (peak stage), with a macro-average AUC of 0.96. ROC curves closely approached the ideal (0, 1) point, indicating high discriminative ability (Figure 5).
Figure 5.
ROC Curve depicting class-wise discrimination performance of the classification model.
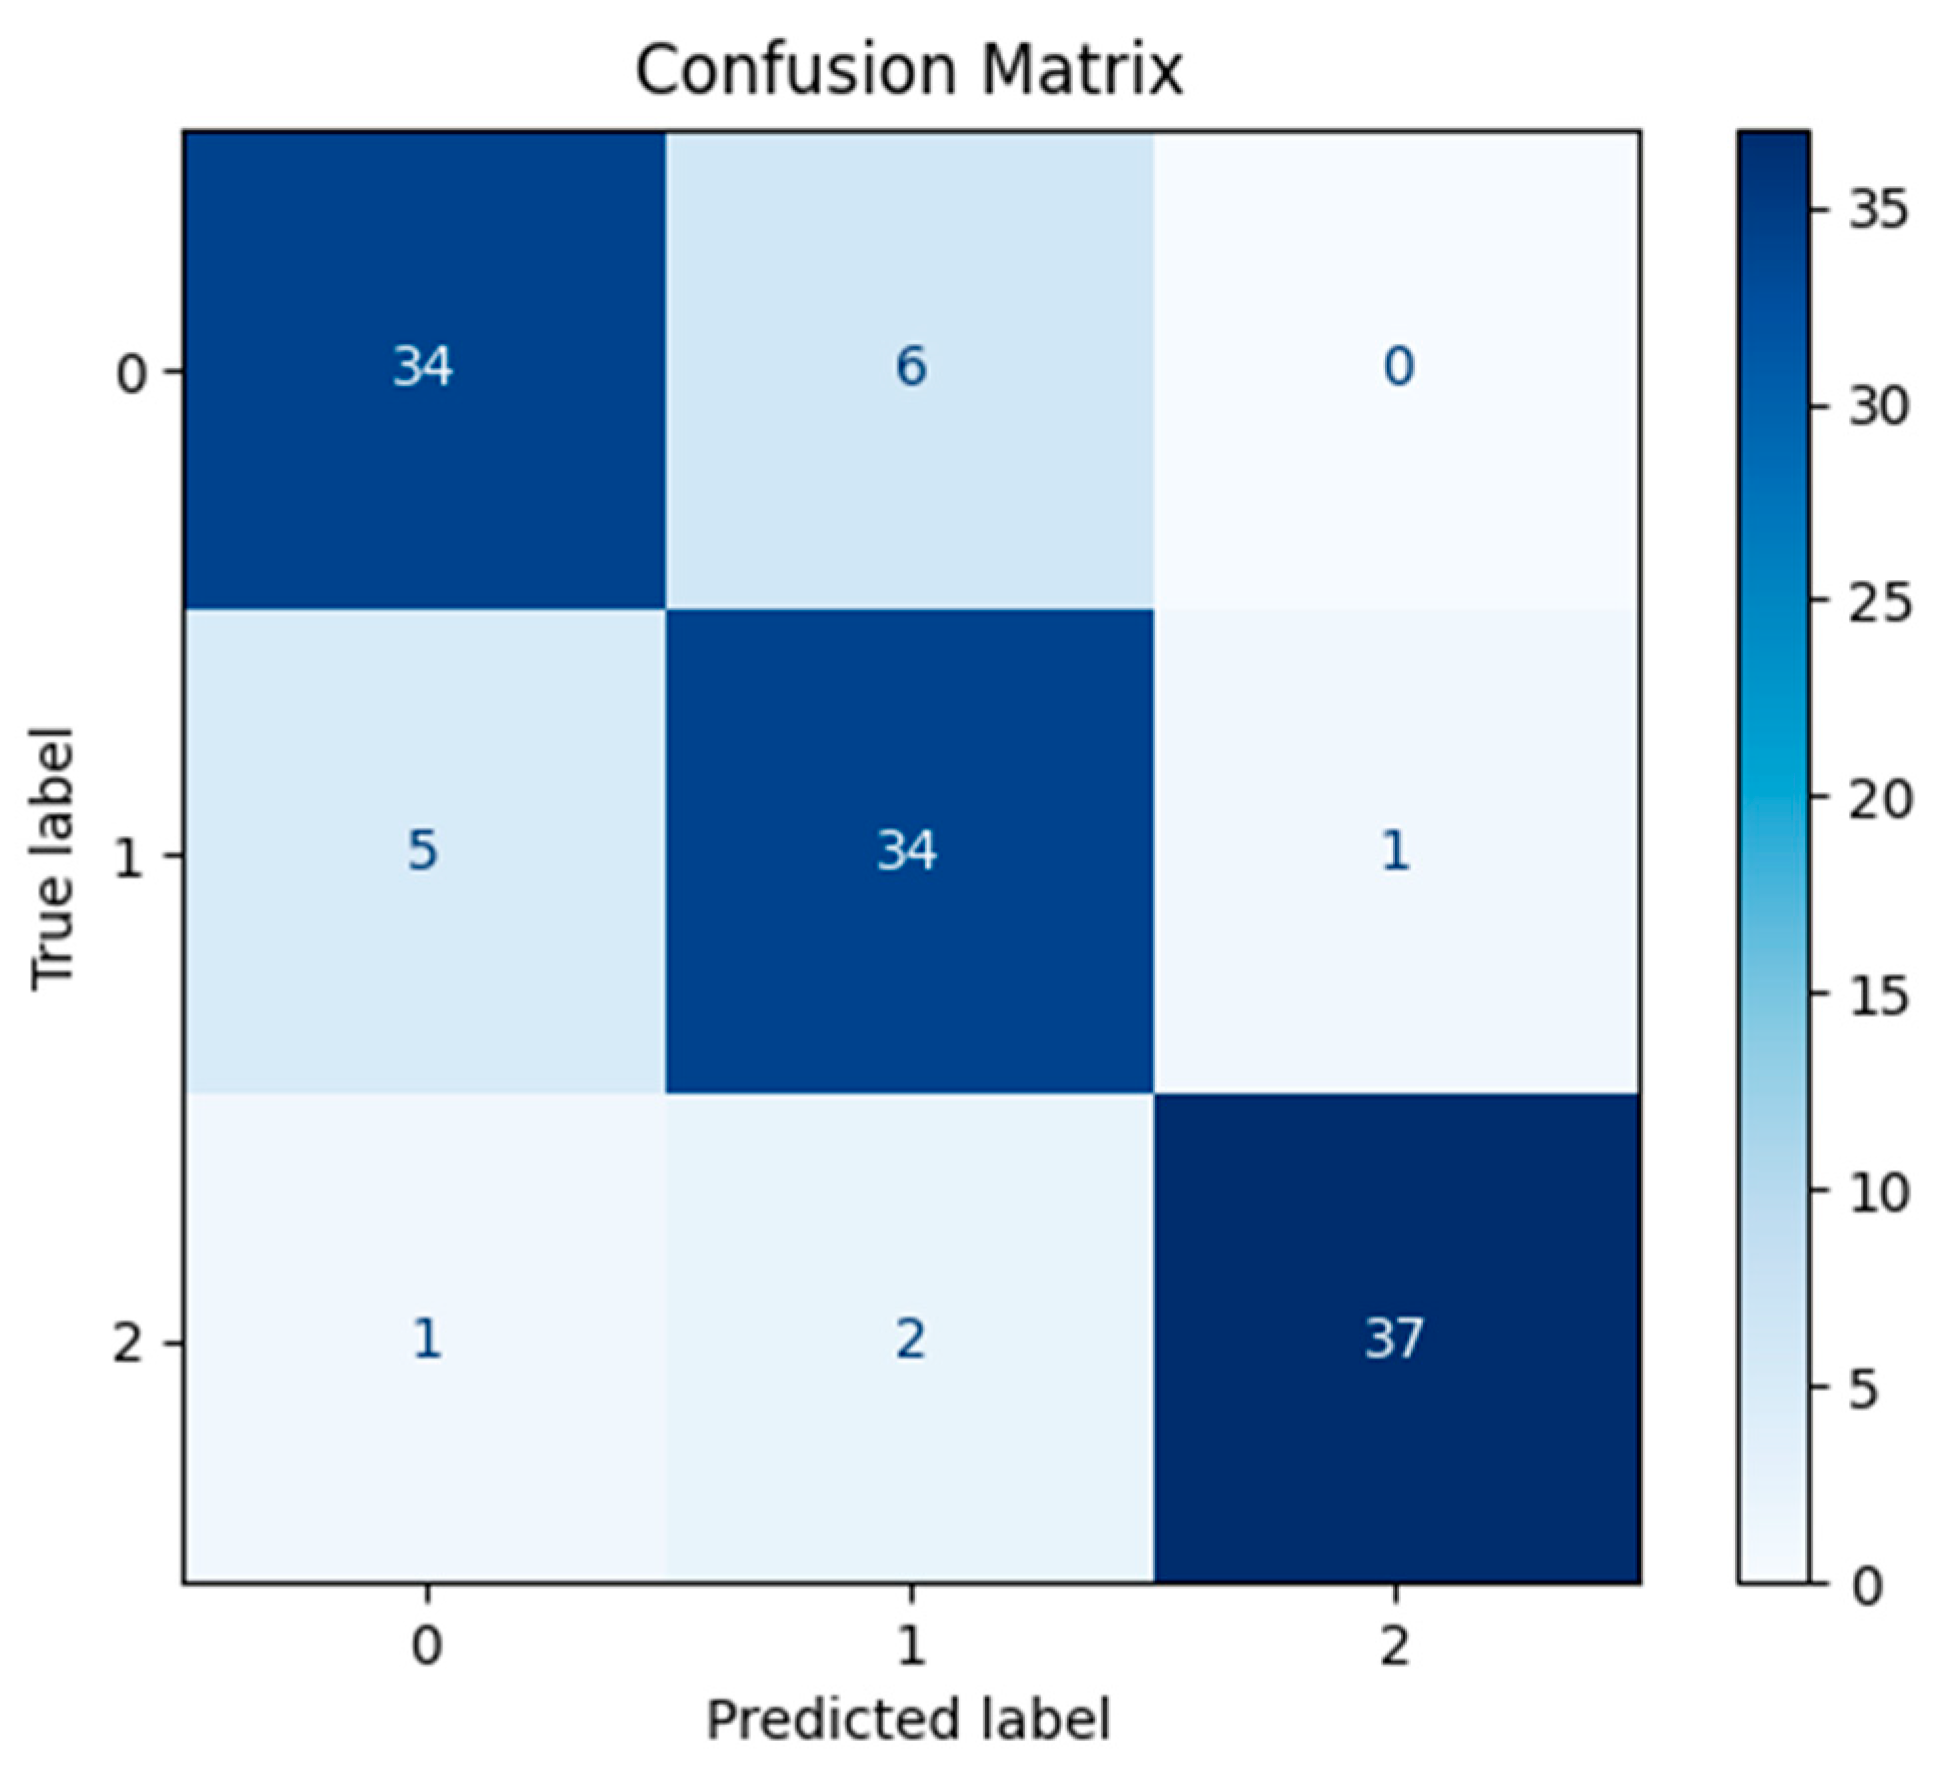
Confusion matrix: The Confusion matrix shown in Figure 6 represents the best validation fold (≈40 samples per class) of 10-fold cross-validation. The model correctly identified the pre-peak phase in 92.5% (37/40) of cases, while the peak and post-peak phases were both classified with 85% accuracy (34/40). Minor misclassifications occurred between adjacent stages, consistent with transitional skeletal development.
Figure 6.
Model confusion matrix for pre-peak, peak, and post-peak classes.
Overall, the stacking ensemble achieved robust and balanced classification performance across all maturity stages, demonstrating high precision, recall, and reproducibility.
4. Discussion
The findings of this study demonstrate that the proposed stacking-based machine learning model can accurately classify skeletal maturation stages using image-derived features from wrist radiographs. The integration of four distinct image processing techniques (each capturing different structural and textural aspects of the radiographs), combined with a robust ensemble learning approach, contributed to promising results; however, these findings require external validation, prospective testing, and explainability analyses before any clinical application can be considered. Specifically, the use of Local Binary Pattern (LBP), Histogram of Oriented Gradients (HOG), Zernike Moments, and Intensity Histogram features enhanced the model’s ability to detect subtle differences across developmental stages. The stacking classifier (comprising LightGBM and Logistic Regression as base learners and Random Forest as a meta-learner) yielded an accuracy of 87.5%, precision of 87.77%, recall of 87.5%, and F1-score of 87.6%.
The Receiver Operating Characteristic (ROC) analysis further confirmed the model’s strong discriminative capacity, with class-specific AUC values of 0.95 for peak, 0.94 for post-peak, and 0.96 for pre-peak stages, and a macro-average AUC of 0.96. These values indicate that the model maintained a low false positive rate and a high true positive rate across all classes. According to the confusion matrix analysis, the highest classification accuracy was achieved in the pre-peak stage (92.5%), while the peak and post-peak stages were correctly classified with 85% accuracy. The misclassifications primarily occurred between the peak and post-peak stages, likely due to overlapping radiographic features characteristic of early developmental transitions.
Recent studies have highlighted the increasing role of artificial intelligence in orthodontics, particularly in the evaluation of skeletal maturity and treatment timing. Automated systems employing machine learning and deep learning (CNN) have shown accuracy levels comparable to expert clinicians in interpreting hand–wrist or cervical vertebral radiographs [,]. For instance, Gonca et al. [] used fractal dimension analysis combined with clinical variables such as age and gender to classify growth stages, achieving 83.2% accuracy, which supports the diagnostic potential of AI-based image analysis. Similarly, Kok et al. and Kim et al. reported comparable performance using CNN and regression-based ensemble models, highlighting the clinical viability of data-driven skeletal maturity assessment [,]. These results, together with the present study, indicate that handcrafted feature-based stacking approaches can achieve accuracy comparable to both deep learning models and experienced orthodontists, while requiring smaller datasets and offering greater interpretability.
In addition, AI-driven assessment systems have the potential to significantly reduce evaluation time and inter-observer variability, which are critical in busy orthodontic practices []. In the present study, the proposed approach demonstrated an estimated 60–70% reduction in evaluation time compared to manual Fishman or CVM methods, underscoring its clinical efficiency. Unlike traditional approaches—such as Fishman’s Skeletal Maturity Indicators or cervical vertebral maturation assessments—that may be affected by subjective interpretation, AI-based models provide consistent, reproducible, and objective outputs. This advantage is particularly valuable for borderline or transitional cases that often present diagnostic uncertainty.
From a biological perspective, future research could integrate biological variables such as hormonal profiles (e.g., IGF-1, estrogen, and testosterone levels) and genetic markers related to growth and bone metabolism. Incorporating these parameters could allow AI models to reflect not only radiographic maturity but also the underlying physiological state, thereby improving diagnostic reliability and biological relevance.
Furthermore, the integration of Explainable AI (XAI) frameworks can enhance clinician trust and model transparency. By visualizing which regions or features of a radiograph contribute most to a prediction, XAI tools can improve interpretability, facilitate clinical adoption, and help practitioners validate AI-driven decisions []. Future studies incorporating XAI visual explanations would provide an even more intuitive link between AI predictions and clinical reasoning.
The current study supports the potential of stacking ensemble methods to further enhance classification performance by leveraging the strengths of different algorithms. Such hybrid architectures can extract more comprehensive information from radiographic data and may be more robust than single-model approaches when handling complex skeletal development patterns. Future models trained on multi-center, demographically diverse datasets will improve generalizability across populations.
Despite these promising results, certain limitations should be acknowledged. First, the dataset was derived from a single institution, which may restrict the model’s applicability across diverse populations or clinical settings. Additionally, the relatively small number of peak-stage samples may have impacted the class balance and performance. The study also relied solely on two-dimensional imaging data without incorporating biological variables such as hormonal levels or genetic markers, which could further improve diagnostic accuracy. Furthermore, the model was validated using internal cross-validation; no external dataset was used for independent testing.
In orthodontic practice, accurate skeletal maturity assessment plays a pivotal role in determining the timing of growth modification therapies, especially in Class II and Class III malocclusion patients [,]. The use of AI-based tools can support clinical decision-making by reducing diagnostic variability and expediting workflow. Ultimately, these technologies may enable more timely interventions tailored to growth potential, thereby improving treatment outcomes and patient satisfaction [,,].
5. Conclusions
This study aimed to classify individuals’ skeletal maturation stages using image-based features extracted from wrist radiographs. The proposed AI-based stacking model, integrating handcrafted image features and ensemble learning, achieved high diagnostic accuracy (AUC = 0.96) and demonstrated clinical-level performance comparable to that of experienced orthodontists.
The results highlight that integrating handcrafted radiographic features with machine learning can provide an objective, reproducible, and time-efficient alternative to manual skeletal age evaluation. Such systems have strong potential to serve as clinical decision-support tools, reducing subjectivity and aiding orthodontists in planning growth-related interventions.
Future research should focus on expanding multi-center datasets and incorporating biological indicators (hormonal and genetic biomarkers) and explainable AI (XAI) visualization tools to improve interpretability and generalizability. By aligning technological precision with biological understanding, AI-driven skeletal maturity assessment may revolutionize orthodontic diagnostics and enhance personalized treatment planning.
Author Contributions
Conceptualization, Data curation, Writing—Reviewing and Editing: N.K.; Writing—original draft preparation, Resources: S.K.; Formal analysis, Methodology, Software: O.F.E.; Investigation, Visualization, Validation: Y.H., Project administration, Supervision: V.E. All authors have read and agreed to the published version of the manuscript.
Funding
This research received no external funding.
Institutional Review Board Statement
The study was conducted in accordance with the Declaration of Helsinki, and approved by the Batman University Ethics Committee on 17 April 2025 with the decision number 2025/04-33.
Informed Consent Statement
Written informed consent has been obtained from the patients to publish this paper.
Data Availability Statement
Anonymized hand–wrist radiographs supporting this study are available in Zenodo at https://doi.org/10.5281/zenodo.17285029.
Acknowledgments
The authors would like to express their sincere gratitude to all patients and their families who generously agreed to participate in this study.
Conflicts of Interest
The authors declare no conflicts of interest.
Abbreviations
The following abbreviations are used in this manuscript:
| AI | Artificial Intelligence |
| LBP | Local Binary Pattern |
| HOG | Histogram of Oriented Gradients |
| CNN | Convolutional Neural Network |
| FD | Fractal Dimension |
| SMI | Skeletal Maturation Indicators |
| LGBM | Light Gradient Boosting Machine |
| ROC | Receiver Operating Characteristic |
| AUC | Area Under the Curve |
| ANOVA | Analysis of Variance |
| MAE | Mean Absolute Error |
| RMSE | Root Mean Square Error |
| XAI | Explainable Artificial Intelligence |
| CBCT | Cone Beam Computed Tomography |
| MRI | Magnetic Resonance Imaging |
References
- Baccetti, T.; Franchi, L.; McNamara, J.A., Jr. The cervical vertebral maturation (CVM) method for the assessment of optimal treatment timing in dentofacial orthopedics. Semin. Orthod. 2005, 11, 119–129. [Google Scholar] [CrossRef]
- Fishman, L.S. Radiographic evaluation of skeletal maturation: A clinically oriented method based on hand-wrist films. Angle Orthod. 1982, 52, 88–112. [Google Scholar]
- Spampinato, C.; Palazzo, S.; Giordano, D.; Aldinucci, M.; Leonardi, R. Deep learning for automated skeletal bone age assessment in X-ray images. Med. Image Anal. 2017, 36, 41–51. [Google Scholar] [CrossRef]
- Litjens, G.; Kooi, T.; Bejnordi, B.E.; Setio, A.A.A.; Ciompi, F.; Ghafoorian, M.; Van Der Laak, J.A.; Van Ginneken, B.; Sánchez, C.I. A survey on deep learning in medical image analysis. Med. Image Anal. 2017, 42, 60–88. [Google Scholar] [CrossRef]
- Esteva, A.; Kuprel, B.; Novoa, R.A.; Ko, J.; Swetter, S.M.; Blau, H.M.; Thrun, S. Correction: Corrigendum: Dermatologist-level classification of skin cancer with deep neural networks. Nature 2017, 546, 686. [Google Scholar] [CrossRef] [PubMed]
- Pandey, A.; Tiwari, A.K. Smart Security: Unmasking face spoofers with advanced decision tree classifier. In Proceedings of the 2024 15th International Conference Computing Communication and Networking Technologies (ICCCNT), Kamand, India, 24–28 June 2024; IEEE: New York, NY, USA, 2024; pp. 1–6. [Google Scholar]
- Chen, J.C.; Yu, P.Q.; Yao, C.Y.; Zhao, L.P.; Qiao, Y.Y. Eye detection and coarse localization of pupil for video-based eye tracking systems. Expert. Syst. Appl. 2024, 236, 121316. [Google Scholar] [CrossRef]
- Sajitha, P.; Andrushia, A.D.; Anand, N.; Naser, M.Z. A review on machine learning and deep learning image-based plant disease classification for industrial farming systems. J. Ind. Inf. Integr. 2024, 38, 100572. [Google Scholar] [CrossRef]
- Albataineh, Z.; Aldrweesh, F.; Alzubaidi, M.A. COVID-19 CT-images diagnosis and severity assessment using machine learning algorithm. Clust. Comput. 2024, 27, 547–562. [Google Scholar] [CrossRef]
- Lee, B.D.; Lee, M.S. Automated bone age assessment using artificial intelligence: The future of bone age assessment. Korean J. Radiol. 2021, 22, 792–800. [Google Scholar] [CrossRef]
- Kunz, F.; Stellzig-Eisenhauer, A.; Zeman, F.; Boldt, J. Artificial intelligence in orthodontics: Evaluation of a fully automated cephalometric analysis using a customized convolutional neural network. J. Orofac. Orthop. 2020, 81, 52–68. [Google Scholar] [CrossRef]
- Gao, Y.; Zhu, T.; Xu, X. Bone age assessment based on deep convolution neural network incorporated with segmentation. Int. J. Comput. Assist. Radiol. Surg. 2020, 15, 1951–1962. [Google Scholar] [CrossRef]
- Kim, H.; Kim, C.S.; Lee, J.M.; Lee, J.J.; Lee, J.; Kim, J.S.; Choi, S.H. Prediction of Fishman’s skeletal maturity indicators using artificial intelligence. Sci. Rep. 2023, 13, 5870. [Google Scholar] [CrossRef] [PubMed]
- Grave, K.C.; Brown, T. Skeletal ossification and the adolescent growth spurt. Am. J. Orthod. 1976, 69, 611–619. [Google Scholar] [CrossRef]
- Costaner, L.; Lisnawita, L.; Guntoro, G.; Abdullah, A. Feature extraction analysis for diabetic retinopathy detection using machine learning techniques. Sist. J. Sist. Inform. 2024, 13, 2268–2276. [Google Scholar] [CrossRef]
- Sharma, P.; Bansal, D.; Gupta, B. Dementia Vision: Feature Extraction and Comparison using HOG and PCA for Diagnostic Imaging. In Proceedings of the 2024 OPJU International Technology Conference (OTCON) on Smart Computing for Innovation and Advancement in Industry 4.0, Raigarh, India, 5–7 June 2024; IEEE: New York, NY, USA, 2024; pp. 1–7. [Google Scholar]
- Silva, C.M.; Da Silva, M.C.; Da Silva, S.P.P.; Rebouças Filho, P.P.; Nascimento, N.M.M. Computer vision for brain tumor classification: A novel approach based on Zernike moments. In Proceedings of the 2024 IEEE 37th International Symposium on Computer-Based Medical Systems (CBMS), Guadalajara, Mexico, 26–28 June 2024; IEEE: New York, NY, USA, 2024; pp. 94–99. [Google Scholar]
- Arul Edwin Raj, A.M.; Sundaram, M.; Jaya, T. Thermography based breast cancer detection using self-adaptive gray level histogram equalization color enhancement method. Int. J. Imaging Syst. Technol. 2021, 31, 854–873. [Google Scholar] [CrossRef]
- Maharana, K.; Mondal, S.; Nemade, B. A review: Data pre-processing and data augmentation techniques. Glob. Transit. Proc. 2022, 3, 91–99. [Google Scholar] [CrossRef]
- Islam, T.; Hafiz, M.S.; Jim, J.R.; Kabir, M.M.; Mridha, M.F. A systematic review of deep learning data augmentation in medical imaging: Recent advances and future research directions. Healthc. Anal. 2024, 5, 100340. [Google Scholar] [CrossRef]
- Saeed, M.H.; Hama, J.I. Cardiac disease prediction using AI algorithms with SelectKBest. Med. Biol. Eng. Comput. 2023, 61, 3397–3408. [Google Scholar] [CrossRef] [PubMed]
- Boutahar, K.; Laghmati, S.; Moujahid, H.; El Gannour, O.; Cherradi, B.; Raihani, A. Exploring machine learning approaches for breast cancer prediction: A comparative analysis with ANOVA-based feature selection. In Proceedings of the 2024 4th International Conference on Innovative Research in Applied Science, Engineering and Technology (IRASET), Fez, Morocco, 16–17 May 2024; IEEE: New York, NY, USA, 2024; pp. 1–7. [Google Scholar]
- Jaiyeoba, O.; Ogbuju, E.; Yomi, O.T.; Oladipo, F. Development of a model to classify skin diseases using stacking ensemble machine learning techniques. J. Comput. Theor. Appl. 2024, 2, 22–38. [Google Scholar] [CrossRef]
- Bidwai, P.; Gite, S.; Pahuja, N.; Pahuja, K.; Kotecha, K.; Jain, N.; Ramanna, S. Multimodal image fusion for the detection of diabetic retinopathy using optimized explainable AI-based Light GBM classifier. Inf. Fusion. 2024, 111, 102526. [Google Scholar] [CrossRef]
- Liu, P.; Xing, Z.; Peng, X.; Zhang, M.; Shu, C.; Wang, C.; Ji, F. Machine learning versus multivariate logistic regression for predicting severe COVID-19 in hospitalized children with Omicron variant infection. J. Med. Virol. 2024, 96, e29447. [Google Scholar] [CrossRef]
- Sarkera, S.Z.; Ahmeda, S.F.B.; Avea, A.A.; Abrar, T.A. A hybrid pre-processing technique for stacking ensemble with Random Forest as a meta classifier for heart disease classification. UU J. Sci. Eng. Technol. 2024. Available online: https://www.uttara.ac.bd/wp-content/uploads/2024/07/Paper-ID-14.pdf (accessed on 29 October 2025).
- Zamrai, M.A.H.; Yusof, K.M.; Azizan, M.A. Random Forest stratified k-fold cross validation on SYN DoS attack SD-IoV. In Proceedings of the 2024 7th International Conference on Communication Engineering and Technology (ICCET), Tokyo, Japan, 22–24 February 2024; IEEE: New York, NY, USA, 2024; pp. 7–12. [Google Scholar]
- Hazar, Y.; Ertuğrul, Ö.F. Process management in diabetes treatment by blending technique. Comput. Biol. Med. 2025, 190, 110034. [Google Scholar] [CrossRef]
- Kok, H.; Zhang, G.; Zhang, W. Artificial intelligence system for assessing skeletal maturity using hand and wrist radiographs. Nat. Commun. 2021, 12, 5214. [Google Scholar]
- Lee, J.H.; Kim, D.H.; Jeong, S.N.; Choi, S.H. Artificial intelligence in orthodontics: Where are we now and what’s next? Korean J. Orthod. 2020, 50, 59–68. [Google Scholar]
- Gonca, S.; Ozdas, T. Machine learning-based prediction of skeletal growth stages using fractal dimension analysis of hand-wrist radiographs. Orthod. Craniofac. Res. 2022, 25, 401–410. [Google Scholar]
- Kim, D.W.; Kim, J.; Kim, T.; Kim, T.; Kim, Y.J.; Song, I.S.; Lee, D.Y. Prediction of hand-wrist maturation stages based on cervical vertebrae images using artificial intelligence. Orthod. Craniofac. Res. 2021, 24, 68–75. [Google Scholar] [CrossRef] [PubMed]
- Luu, N.S.; Perkins, J.A.; Naranjo, C.M. Artificial intelligence in dentistry: Current applications and future perspectives. Dent. Clin. N. Am. 2022, 66, 599–616. [Google Scholar]
- Samek, W.; Montavon, G.; Lapuschkin, S.; Anders, C.J.; Müller, K.-R. Explaining Deep Neural Networks and Beyond: A Review of Methods and Applications in Explainable AI (XAI). Nat. Commun. 2021, 12, 247–278. [Google Scholar]
- Perinetti, G.; Contardo, L. Reliability of dental maturity as an indicator of skeletal maturity: A systematic review. Angle Orthod. 2011, 81, 710–721. [Google Scholar]
- Alkhal, H.A.; Wong, R.W.K.; Rabie, A.B.M. Correlation between chronological age, cervical vertebral maturation and Fishman’s skeletal maturity indicators in southern Chinese. Angle Orthod. 2008, 78, 591–596. [Google Scholar] [CrossRef] [PubMed]
Disclaimer/Publisher’s Note: The statements, opinions and data contained in all publications are solely those of the individual author(s) and contributor(s) and not of MDPI and/or the editor(s). MDPI and/or the editor(s) disclaim responsibility for any injury to people or property resulting from any ideas, methods, instructions or products referred to in the content. |
© 2025 by the authors. Licensee MDPI, Basel, Switzerland. This article is an open access article distributed under the terms and conditions of the Creative Commons Attribution (CC BY) license (https://creativecommons.org/licenses/by/4.0/).