Article

Leveraging Artificial Intelligence for Real-Time Risk Detection in Ship Navigation

Department of Engineering, University of Messina, Contrada di Dio, 98166 Messina, Italy
*
Author to whom correspondence should be addressed.
Appl. Sci. 2025, 15(21), 11674; https://doi.org/10.3390/app152111674 (registering DOI)
Submission received: 29 September 2025 / Revised: 22 October 2025 / Accepted: 30 October 2025 / Published: 31 October 2025

Abstract

The desire to improve the safety of navigation, especially in restricted and very busy areas like the straits, leads researchers to evaluate possible uses of Artificial Intelligence as an alternative to the traditional probabilistic methods. This is possible thanks to the large amount of available AIS data generated by ships in transit. In this work, a Machine Learning algorithm (Classification Decision Tree) was trained with eight features coming from AIS data of the Strait of Messina (Italy), with the aim of carrying out a two-class classification of the single AIS data to find anomalies in ship transits that could compromise navigation safety. Since anomalous events are relatively rare, compared to the large amount of information related to the normal navigation situations, the challenge of this work was to obtain an artificial dataset with the aim of simulating the possible anomalous navigation conditions for the Strait investigated, known the active risk mitigation means one. For this reason, the dataset containing abnormal events was obtained simulating different risk scenarios. A hyperparameters tuning with a Bayesian optimization approach and a 5-fold cross validation have been performed to improve the quality of the model and a large dataset has been tested. The accuracy of both validation and test phases is <99.5% and <95.9%, respectively. This can make it possible to identify anomalous navigation conditions in real time, in order to quickly classify possible conditions of risk. The method can be used as a Decision Support Tool by the authority in order to improve the capacity of the single operator to identify the possible risk situation inside the Strait of Messina.

1. Introduction

Maritime transport is universally recognized as the backbone of international trade, being the most efficient and cost-effective means of moving large quantities of goods across long distances [1,2]. Currently, more than 90% of global merchandise trade is carried by sea, highlighting its crucial role in sustaining the global economy and ensuring the interconnection of markets worldwide [3].
In addition to the transport of commodities, maritime traffic also serves an important function in the mobility of people, particularly in coastal and insular regions where ferry systems and passenger vessels represent a fundamental mode of connection.
The increasing reliance on maritime transport, however, comes with significant challenges in terms of safety and environmental protection. Navigation risks include collisions, groundings, and accidents that may lead not only to loss of human life but also to severe economic consequences due to damaged or lost cargo [4,5]. Moreover, maritime accidents can generate oil spills, hazardous material leakages, and other forms of pollution with long-lasting negative impacts on marine and coastal ecosystems. The International Maritime Organization (IMO) and other regulatory bodies have therefore placed growing emphasis on the adoption of technological solutions and operational practices aimed at ensuring safe and sustainable navigation [6].
In light of this context, the Automatic Identification System (AIS) has emerged as a critical technological advancement, providing instantaneous information that is essential for preventing collisions, regulating traffic, and safeguarding the environment [7,8,9]. AIS is a system capable of automatically providing information relating to the ship on which it is installed to other ships and to coastal authorities. AIS is mandatory according to the tonnage and type of ship [10]. The main purpose of AIS is to increase safety and efficiency in navigation and protect the maritime and coastal environment [11,12]. More details on AIS data will be shown later. The large amount of the available AIS data provided the input to carry out this work using Artificial Intelligence (AI). AI is a discipline that studies the theoretical foundations, methods, and techniques which allow for the design of systems capable of conferring to the computer certain skills that to any non-expert observer would appear as exclusive prerogatives of human intelligence [13]. ML is a branch of AI that studies those systems capable of learning through experience. This peculiarity makes it different from classical computer programming. In fact, while computer programming can only recognize the conditions for which it was designed, ML can work even in conditions it has never seen before, obviously with a certain level of accuracy. So, ML algorithms are used when it is impossible to know a priori all those conditions that the system will encounter during its operation. The introduction of ML represents an important period of change in the realm of marine navigation safety. Through the utilization of the large amounts of data produced by AIS, ML algorithms offer unique possibilities for identifying and categorizing navigational irregularities, therefore improving marine safety and operational effectiveness. These technologies offer innovative avenues for progressing beyond conventional probabilistic approaches, enabling the adaptation to intricate and constantly evolving maritime environments [14].
Therefore, the aim of the present study is to pioneer the use of a Classification Decision Tree algorithm trained on AIS data from the Strait of Messina, Italy, to identify anomalies in ship transits that could compromise navigation safety. Unique to our approach is the creation of an artificial dataset simulating various risk scenarios, enhancing the algorithm’s ability to recognize potential hazards in real-time. The need for an artificial dataset arises from the paucity of data related to risky events, which are often of low quality [15,16].
This innovative methodology stands to significantly contribute to the development of AI-driven decision support tools for maritime authorities, potentially setting new benchmarks in the field of maritime safety and AI applications [17].
The paper is structured as follows: the Section 1 provides a comprehensive examination of the existing body of literature. The Section 2 explores the methodology, particularly the data acquisition process from AIS, the preparation of the artificial dataset simulating various navigational anomalies, and the statistical underpinnings of the ML model, the Classification Decision Tree algorithm. and the model adopted. The following section illustrates the empirical findings derived from the investigation. This section not only emphasizes the effectiveness of the approach but also examines the practical consequences of the results in improving marine navigation safety. In conclusion, a comprehensive analysis of the research findings is provided, highlighting the substantial contributions of our study to the fields of maritime safety and artificial intelligence, both in academic and practical contexts.

1.1. Literature Review

The utilization of AIS data for enhancing maritime safety has been a focal point of contemporary research, underscoring a pivotal shift from traditional navigational practices to more sophisticated, data-driven approaches [18]. Notably, the advent of ML technologies has introduced a paradigm shift in how maritime anomalies are detected and addressed, fostering a more resilient and efficient maritime navigation system. Several authors have studied how to improve safety in navigation by performing various data-driven algorithms using the large availability of AIS data [19]. One of the ways utilized in previous papers is the statistical approach. About this type of approach, in scientific literature it is possible to see that Smith et al. [20] proposed a combination of Gaussian processes and extreme value theory to detect maritime abnormality, and Ristic et al. [21] used a statistical approach based on the adaptive kernel density estimation using AIS data to generate a predictor of anomalies in vessel motion. There are other methods, which use AIS data, based on Bayes’ theorem. Lane et al. [22] used Bayesian Network on five common ship behaviors to calculate the probability that they are anomalous; in [21] it is possible to see the use of a data-driven non-parametric Bayesian model for anomaly detection; Özlem et al. [23] used a Bayesian Network to calculate the causation probability of grounding events in the Strait of Istanbul. Other than statistical methods, several ML methods have also been used in scientific literature with the aim of detecting dangerous and/or illegal anomalies in navigation to take advantage of the large amount of AIS data coming from vessel transits [24]. In Obradović et al. [14] it is possible to see a review of various papers in which ML approaches are used to increase safety and security in navigation. Among these methods, the following works are mentioned. Ginoulhac et al. [25] used a Gradient Boosting classifier, an ML technique, with the aim of classifying ships according to their type, labelling trajectories. Zhang et al. [26] used a random forest-based algorithm for ships’ destination prediction. In Singh et al. [17] there is the use of AIS data to perform a multi-class Artificial Neural Network (ANN) to classify intentional and non-intentional AIS on–off switching anomalies using sailing route, speed, and timing information. Zhang et al. [27] introduced an “Avoidance Behavior-based Grounding Detection Model” for the identification of potential grounding scenarios in the Gulf of Finland, using both AIS data and bathymetric maps. The authors used an ML approach (K-Means algorithm) to cluster ship trajectories. Tritsarolis et al. [28] dealt with Vessel Collision Risk Assessment problem using an ML approach based on the Multi-Layered Perceptron (MLP) model exploiting AIS data belonging to “Pireus” dataset [29]. Rawson et al. [30] proposed an ML classification model to assess the risk for vessels in navigation under extreme weather events. Among the various techniques of ML, there is one called Deep Learning (DL) based on ANNs. Xie et al. [31] used a DL approach to detect AIS data related to an anomalous behavior of vessels considering as “normal behavior” the historical data in the area investigated. In Yang et al. [32], a DL method was used to predict vessel trajectory exploiting clustered AIS data. In the work of Nguyen et al. [33], a comparison has been made between vessels’ abnormal behaviors detected by GeoTrackNet, a probabilistic neural network, with respect to expert interpretations. Chen et al. [34] proposed a DL approach, with a Convolutional Neural Network (CNN), to carry out a ship’s movement multi-class classification thanks to the conversion of AIS trajectories into images with a Ship Movement Image Generation and Labelling (SMIGL) algorithm. Murray et al. [35] presented a DL framework, based on the use of a Recurrent Neural Network (RNN), for the prediction of ships behavior using historical AIS data in order to improve the safety of proactive collision avoidance: given a certain ship’s trajectory, the framework can predict its next. In Yu et al. [3] it is possible to see two DL methods to predict ships’ position using longitude, latitude, and time. In the scientific literature, mixed methods (statistical and ML-based) have also been used and, despite the fact that these typologies are difficult to implement [24], it is possible to find some of its applications like in the work of Vries et al. [36]. Other approaches regard the use of genetic algorithms on AIS data [37]. In Zhang et al. [38], an “Avoidance behavior-based collision detection model” is proposed for the assessment of damage and flooding risk caused by ship collision, using AIS data to estimate the collision probability. Rong et al. [39] proposed a novel approach for the automatic identification of ship collision avoidance behavior using ships’ routes. From both dynamic and static data, coming from AIS data, the encounter scenario is extracted, and the ship’s evasive behavior is carried out through a Sliding Window algorithm.

1.2. Aim of the Work

The purpose of this work is to exploit AIS data to detect anomalous situations that could compromise safety and security of navigation. From the literature review, it is possible to see the different ways in which AIS data are used for the same purpose. These methods are based on the detection of anomalies in the behavior of ships which could represent both potentially hazardous situations for navigation and the occurrence of illegal activities. In the scientific literature, anomalies are detected mainly by route analysis, comparing the planned routes (obtained by different algorithms) and the actual routes (detected by the sequence of AIS data). The work presented in this paper proposes instead a different approach. The idea is to train an ML algorithm in a specific sea area using different elements coming from AIS data recorded in that area during a certain period. The main novelty of the method is to use ML techniques like Decision Tree to make available to the authorities a tool useful for mitigating the risk of accidents inside the Strait of Messina and using it to support the decisions during the control of Vessel Traffic Service (VTS) stations [40]. These data are classified as “Normal” or “Anomalous” data, in order to help to use the AI to identify each new subsequent piece of AIS data as normal or anomalous. This method could increase not only safety, reducing the risk of accidents during navigation, but also security, detecting anomalies of malicious origin [41]. The algorithm can also be implemented with new risk scenarios. The implemented strategy concerns the training, validation, and test of decision tree-based ML algorithm which can find the anomalies in restricted and very busy areas taking advantage of the large amount of available AIS data coming from ships. So, a classification in supervised learning was carried out. In this work the information used from AIS data is relative to position, sailing route, speed, navigational status, size, and cargo type of ships. Table 1 provides a detailed comparative analysis of the AIS data features employed in this study against those utilized in previous research.
Hence, the application of ML to AIS data is not without its challenges, notably in the detection of anomalies indicative of hazardous situations or illegal activities. The scientific literature reveals a diverse array of strategies for anomaly detection, primarily through the analysis of ship routes. By comparing planned routes with actual navigation data, researchers have developed models that can identify deviations indicative of potential risks. This paper proposes a novel approach by employing a Classification Decision Tree algorithm, specifically tailored for the Strait of Messina. Unlike previous studies that primarily focused on general anomaly detection, our methodology emphasizes the creation of an artificial dataset to simulate specific navigational anomalies within a defined maritime area. The novelty of this work lies in the scenario-based generation of anomalous AIS data, the tailored optimization of a decision tree algorithm for a high-density maritime corridor, and the practical implementation as a decision support tool (DST) to assist VTS operators in real-time anomaly detection.

2. Materials and Methods

2.1. Materials

The Strait of Messina is a stretch of sea interposed between peninsular Italy and the major Italian island, Sicily. The strait connects the Ionian Sea, to the south, with the Tyrrhenian Sea, to the north, going to lap the cities of Messina and Reggio Calabria. It is funnel-shaped with the narrowest part in the north, with a minimum width of about 3150 m. In the Strait of Messina there are five harbors: three in Sicily and two in Italy’s mainland—Port of Messina, dock of Tremestieri, the dock of San Francesco in Sicily and port of Reggio Calabria, and port of Villa San Giovanni in Italy mainland. The harbors are shown in Figure 1.
Maritime traffic within the Strait of Messina can be divided into two main categories: the first that passes longitudinally, from Ionian to Tyrrhenian Sea or vice versa, and the second that passes transversely, linking Sicily and Italy’s mainland or vice versa. The first one, with a North-South direction, consists of ships that cross the Mediterranean Sea, as an alternative sailing route with respect to the Sicilian Channel, avoiding circumnavigating Sicily. The second includes the maritime connections between Sicily and the Italian mainland, mostly characterized by passenger ships, Ro-Ro and Ro-Pax vessels, it connects the two coasts along the East-West direction. The Strait of Messina, because of its high density of maritime traffic, is not immune to grounding and ship collision phenomena. From the 1950s to today, fifty accidents were registered in the strait, Table 2 shows the number of accidents that occurred from the 1950s to 2000s.
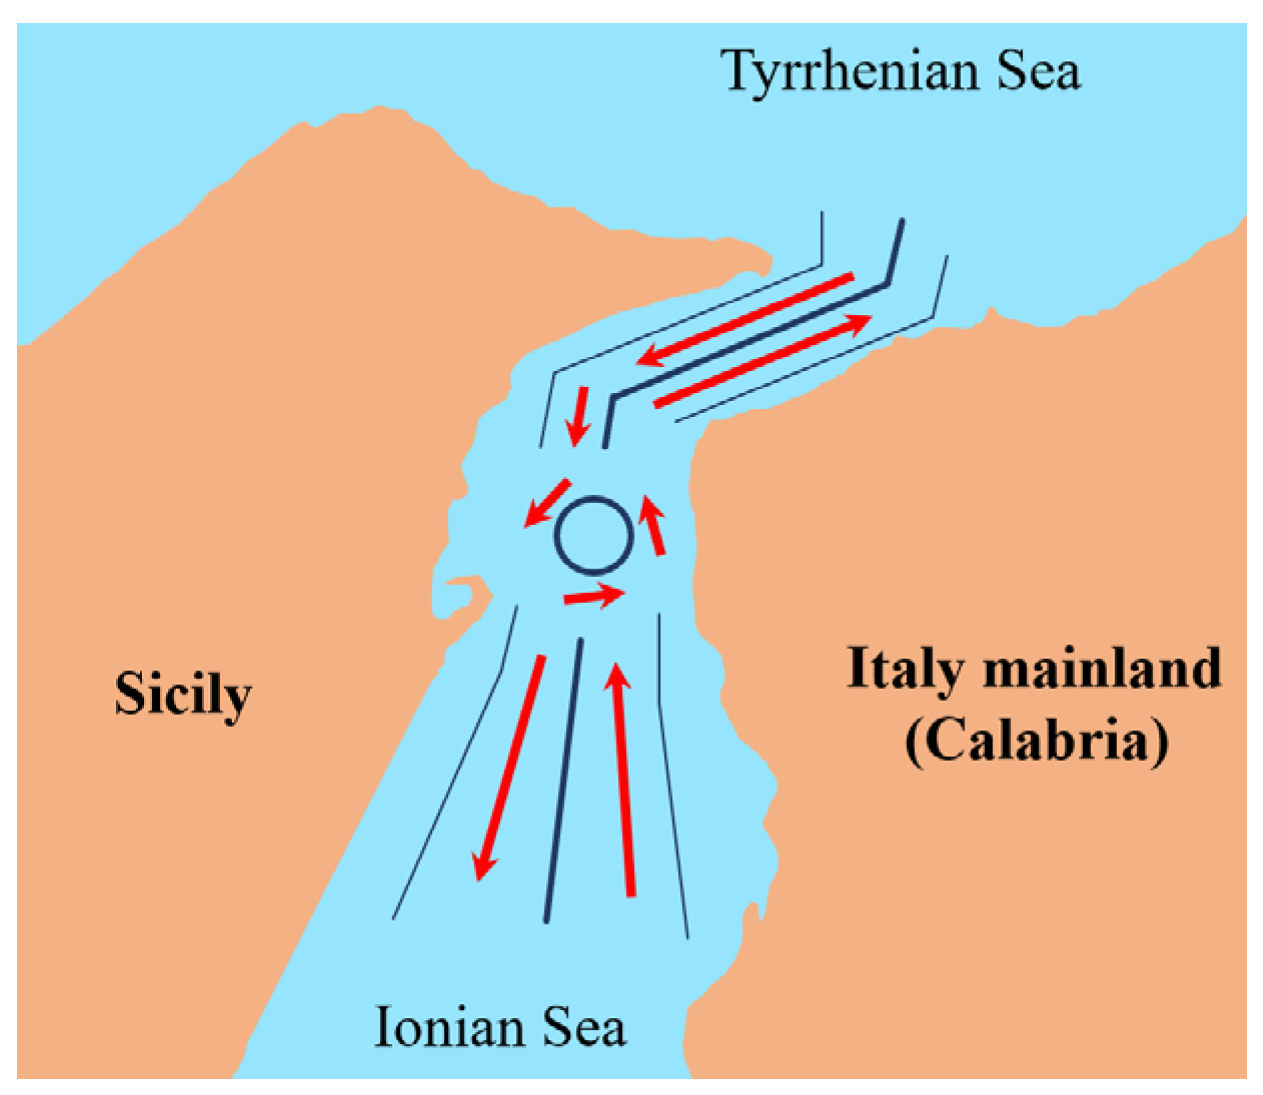
An assessment of ships’ collision rate of this stretch of sea with a related risk analysis was carried out in the work of Cucinotta et al. [46]. It used the International Association of Lighthouse Authorities Waterways Risk Assessment Program (IWRAP) approach to evaluate the geometric collisions in different scenarios to get the actual collision probability using a literature causation factor. The IWRAP approach is based on the pioneering works of Fuji and MacDuff in the 1970s [5,47]. These scholars introduced a probabilistic method for the quantitative evaluation of collision events between ships and grounding. Table 2 shows that there is a decrease in collisions from the 1970s to 2000s, thanks to the introduction of risk mitigation systems. Since 1985 the Strait of Messina has been equipped with a Traffic Separation Scheme (TSS) [48] and during 2008 the VTS has been introduced. Furthermore, at this stretch of sea the pilotage service is also available, mandatory for certain types of ships. Figure 2 shows the active TSS in the Strait of Messina.
The VTS is a set of services, implemented and managed by an authority (Italian Coast Guard) activated to improve the safety and efficiency of maritime traffic and also to protect the environment. The VTS system is structured in three specific areas of intervention: information service, organization of traffic and navigation support. The first service provides information to the on-board command useful for navigation inside the VTS area and useful for assisting the decision-making process on board. The second service is implemented to avoid dangerous situations in the VTS area; thanks to this service each operator of the VTS office manages the traffic flow guaranteeing safety during all the vessel’s movements. The last service is complementary to the other two, and it is provided on request of the on-board command or on request of VTS operator. All services provided by the VTS office are possible thanks to the use of the AIS. It tracks the position of the ship by the GPS system or with specific sensors provided in an AIS unit. The unit also manages the data with a standard configuration, the data contained in the AIS unit are reported in Table 3 as referred by Resolution A.1106(29) 2015 released by the IMO.
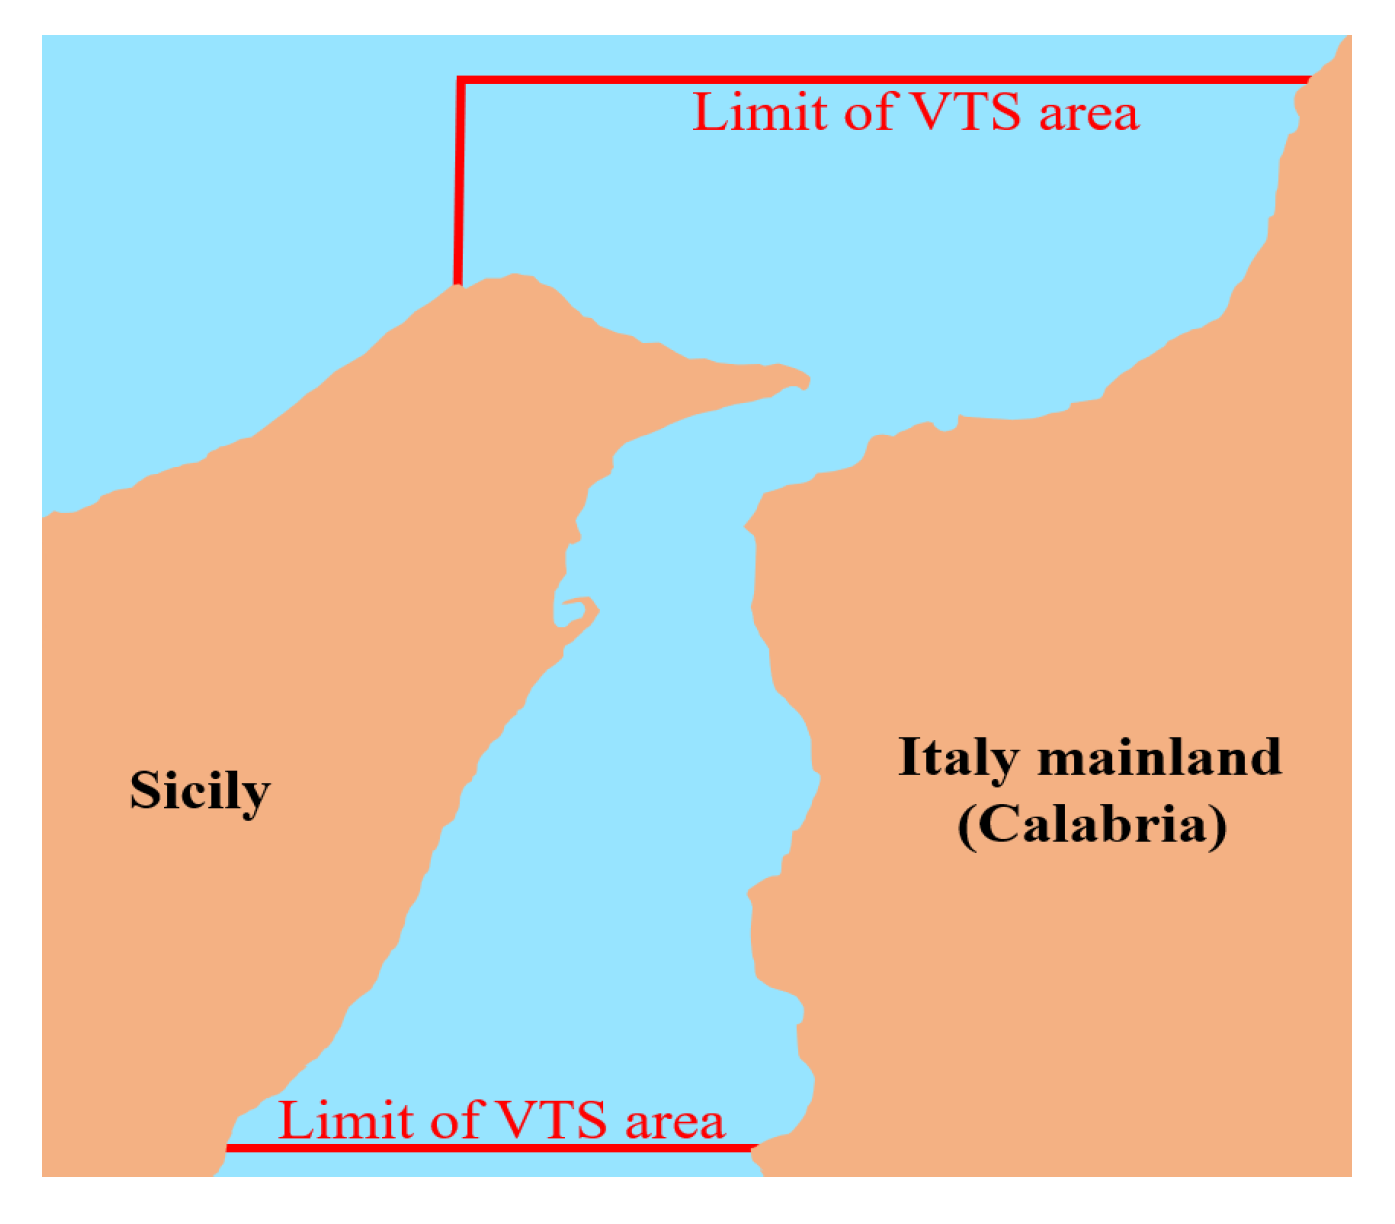
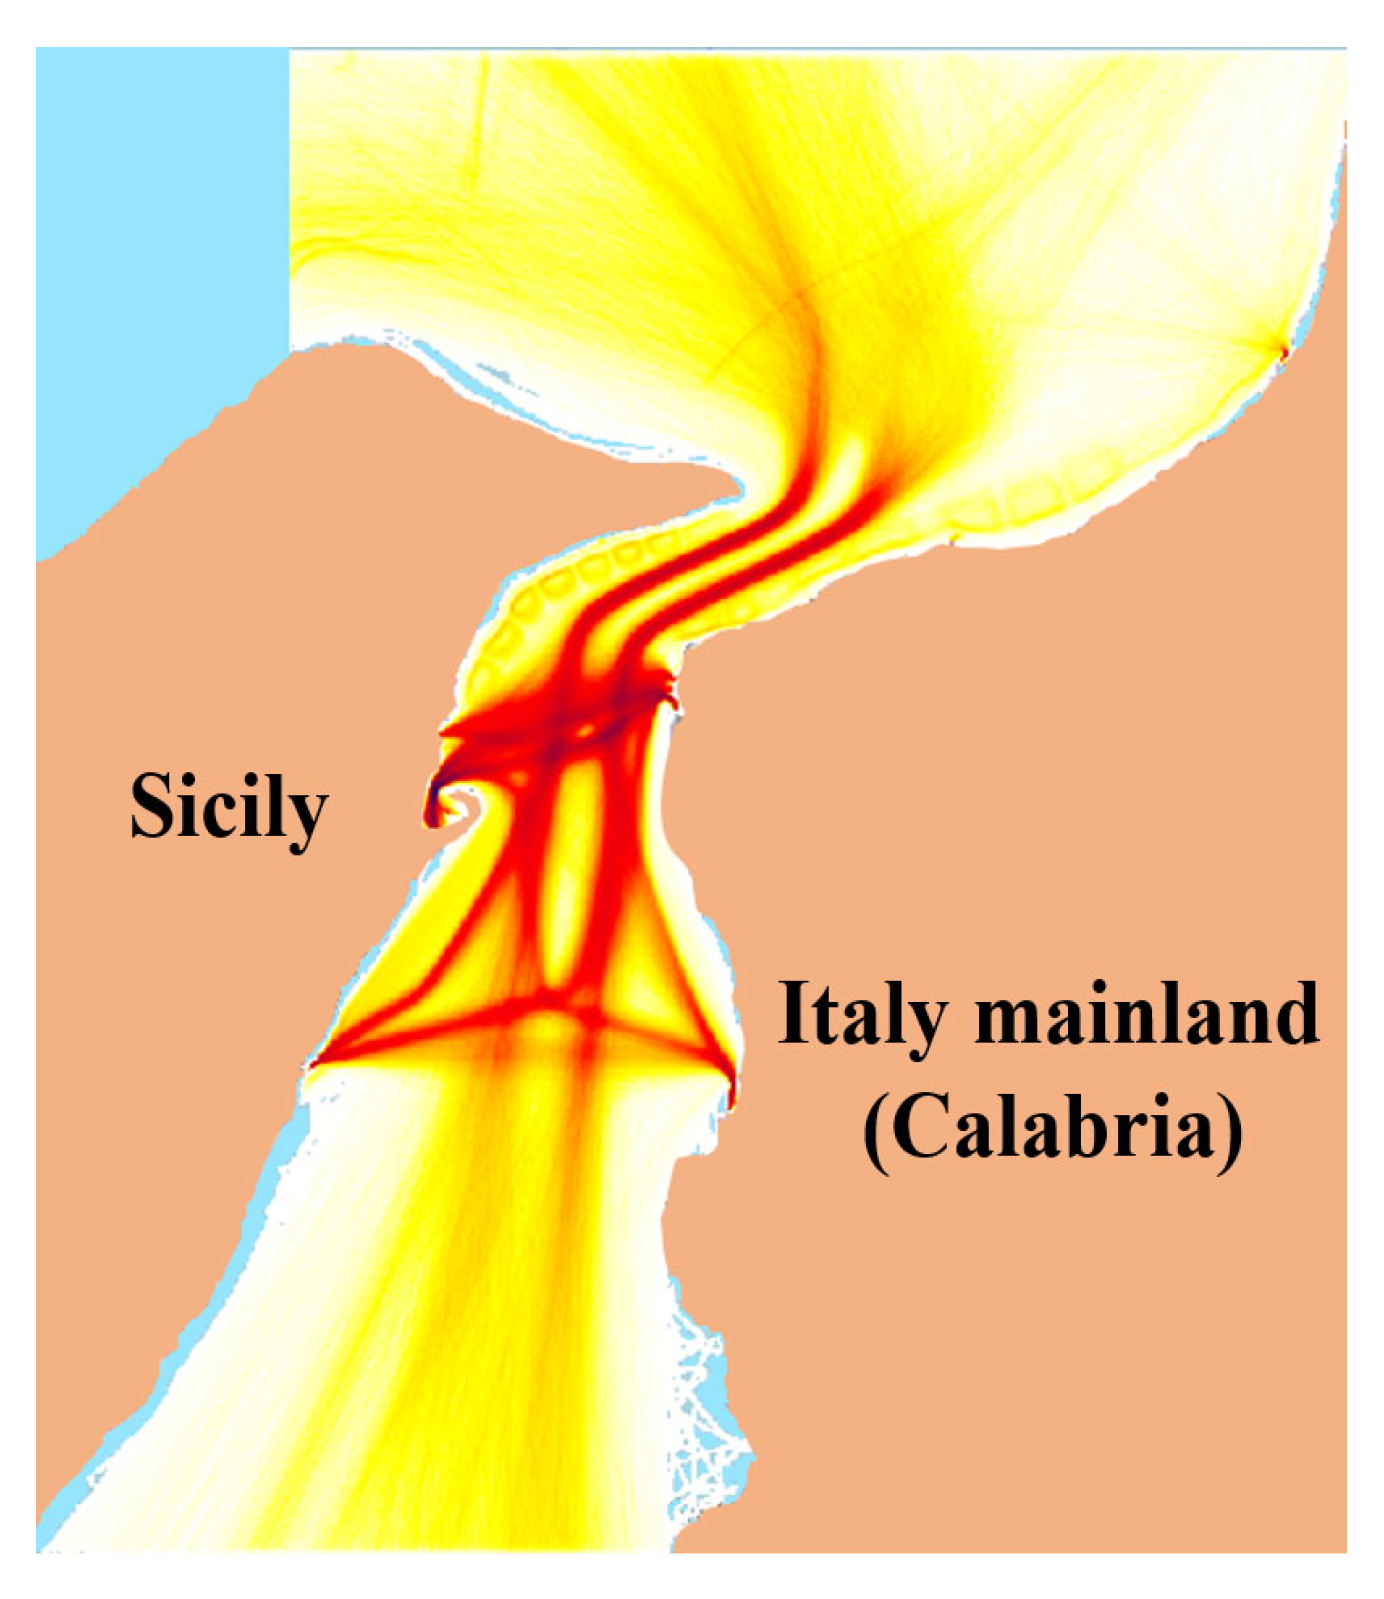
As reported in Table 3, there are four types of information transmitted by a ship that uses the AIS system: static information, dynamic information, voyage-related information and safety-related information. The static information is fixed during the installation of the system on board, and it is changed only in case of a change in the Maritime Service Identity of the ship, change in the position of EPFS, or in case of conversion of the ship type in another way. The dynamic information is automatically updated during the voyage, only the navigational status is manually entered and changed as necessary. The voyage-related information is manually entered and updated during the voyage. The transmission of the data can occur with a specific antenna taking advantage of Very High Frequency (VHF) channels. Usually, the transmission of the AIS data takes place via two specific channels, but it is always possible for the unit to switch the transmission into other channels in case of necessity. In the Strait of Messina, the AIS system is mandatory for all vessels over 300 GT and for all the passenger ships (Messina VTS User’s Manual 2015). The transmission of the data can be conducted between ships and also between ships and shore stations. This last condition offers the port authority the possibility to manage maritime traffic. The VTS office stores these data in a daily-recorded database. Figure 3 shows the geographical limits of the VTS area in the Strait of Messina and Figure 4 the density map of AIS traces in VTS zone of the Strait of Messina. AIS data related to this density map covers a period of 12 months (June 2018–May 2019).
The aim of this paper is to take advantage of the great quantity of data produced by the VTS control and use ML techniques to increase the packaging of instruments for mitigating the risk of collision. The AIS data used in this work (courtesy of the Italian Coast Guard of Messina) cover a period of two thirty-one-day months (January and March), chosen arbitrarily, in 2019 and refer to the Strait of Messina. More specifically, the January dataset contains 1,786,822 AIS data (instances for ML), and the March dataset contains 1,875,403.

2.2. Methods for Dataset Creation

The ML algorithm used in this work has the purpose of carrying out a classification of the AIS data into two classes (Normal and Anomalous). This classification operation was conducted by means of supervised learning [49]. Supervised learning trains a machine learning model using datasets with known labels. In this way, the trained algorithm can classify new AIS data that it has never seen in the examples, by labeling them in one of the two classes above which it was trained. The process leading to the achievement of a working algorithm is composed by three phases called “Train”, “Validation”, and “Test”. During the first phase, the algorithm learns through a first set of labelled data (train dataset) and tries to find a correlation between input data (features) and output data (labels). Then, using a second set of data (different from the previous one), the algorithm evaluates its classification ability by trying to classify these new data and comparing the answers with the labels associated and improves its classification performance by evaluating the errors committed. To achieve an efficient classification algorithm, the first two phases are usually repeated several times. When the training and validation phases are completed, the algorithm stops the learning process, and it is ready to be used. In order to verify the learning process, it is fundamental to carry out the test phase with a third set of labelled data (test dataset). During this last phase, the algorithm classifies the new data and compares the answers (predicted classes) with the associated labels (true classes).
A fundamental pre-processing in classification problem is the labelling. Each instance of the AIS dataset must be labelled with the name of one of the two classes. In a binary classification like this, the classes are two and in this case are: Normal and Anomalous. The AIS data considered belonging to the class Normal are those related to safe passages of ships, since in that considered period of time no accident or negative event occurred. Concerning the AIS data considered belonging to the class Anomalous, creating the dataset is not simple due to the limited availability of data on risk events. The number of accidents is not large enough to balance transit without accidents and the authority does not have a database where it is possible to verify all the dangerous situations that occurred during the period under investigation. For these two reasons a set of potentially dangerous situations was created to test the method developed by mean ML. The technique used is to oversample the AIS data belonging to the Anomalous group. For this reason, it has been necessary to create an artificial group of data composed of risky events, where “risky event” refers to an abnormal event that is not usual in the history of the sea area under consideration. What has been done is to generate a new dataset by modifying the dataset of the class Normal assuming three types of risk scenario defined thanks also to the experience of the Coast Guard. More specifically, what has been done is:
  • To reverse the COG of the ships (addition of 180° to the route), keeping all the other features unchanged.
  • To assign very low SOG value to those ships that were in navigation with a SOG greater to a certain threshold, by replacing the original value with a new random value between 0 and 0.2 kn.
  • To assign high SOG value to those that had very low speed, by replacing the original value with a new random value between 5 and 30 kn.
The changes (addition of 180°) of the COG, the position of the ship and type of ship can indicate that a vessel is in a wrong line with respect to its route inside the TSS zone. Since inside the Strait of Messina there are areas with a range of velocity fixed by the authority, the modified values of SOG, together with information about the position, type (including geometric dimensions) and status of the ship can indicate two scenarios. The first regards, for example, a ship near the coast with a speed value higher than allowed. The second could be the presence of a ship stopped or at a low speed in a position in which this is not permitted. In this way, starting from the January and March datasets, two new datasets have been created that will be defined, from now on, as January balanced and March balanced, respectively. The new datasets contain 3,573,644 AIS and 3,750,806 instances, respectively. Table 4 shows an overview of the datasets.
The number of features for each dataset is eight: cargo type, latitude, longitude, COG, SOG, length, beam, and ship max static draught, indicated and referred from now on respectively as: type (X1), Lat (X2), Lon (X3), COG (X4), SOG (X5), length (X6), beam (X7), and draught (X8). An example of the dataset fed to the ML algorithm is shown in the following matrix:
t y p e 1 L a t 1   L o n 1   C O G 1   S O G 1   l e n g t h 1   b e a m 1   d r a u g h t 1   t y p e n L a t n   L o n n   C O G n   S O G n   l e n g t h n   b e a m n   d r a u g h t n
For the case of January, the matrix is 3,573,644 × 8 and in the case of March dataset the dimension of matrix is 3,750,806 × 8.
It should be noted that the artificial anomalies were generated based on the operational layout of the Strait of Messina, considering the Traffic Separation Scheme, vessel routes, and speed limits. Modifying course or speed values simulates realistic navigational risks, enabling the model to anticipate hazardous situations in real time. While trained on Strait of Messina data, the same approach can be adapted to other high-density maritime corridors, supporting the generalization of the method.
It is useful to remember that all AIS data in each dataset were labelled and, for convenience, given the binary classification, the class Anomalous and the class Normal will be called, from now on, respectively, Positive Class (PC) and Negative Class (NC). The January balanced dataset was used to train and validate the model, and it has been divided into two datasets (train and validation dataset). These datasets contain 75% and 25% of the January balanced dataset respectively (Figure 5).

2.3. Methods for ML

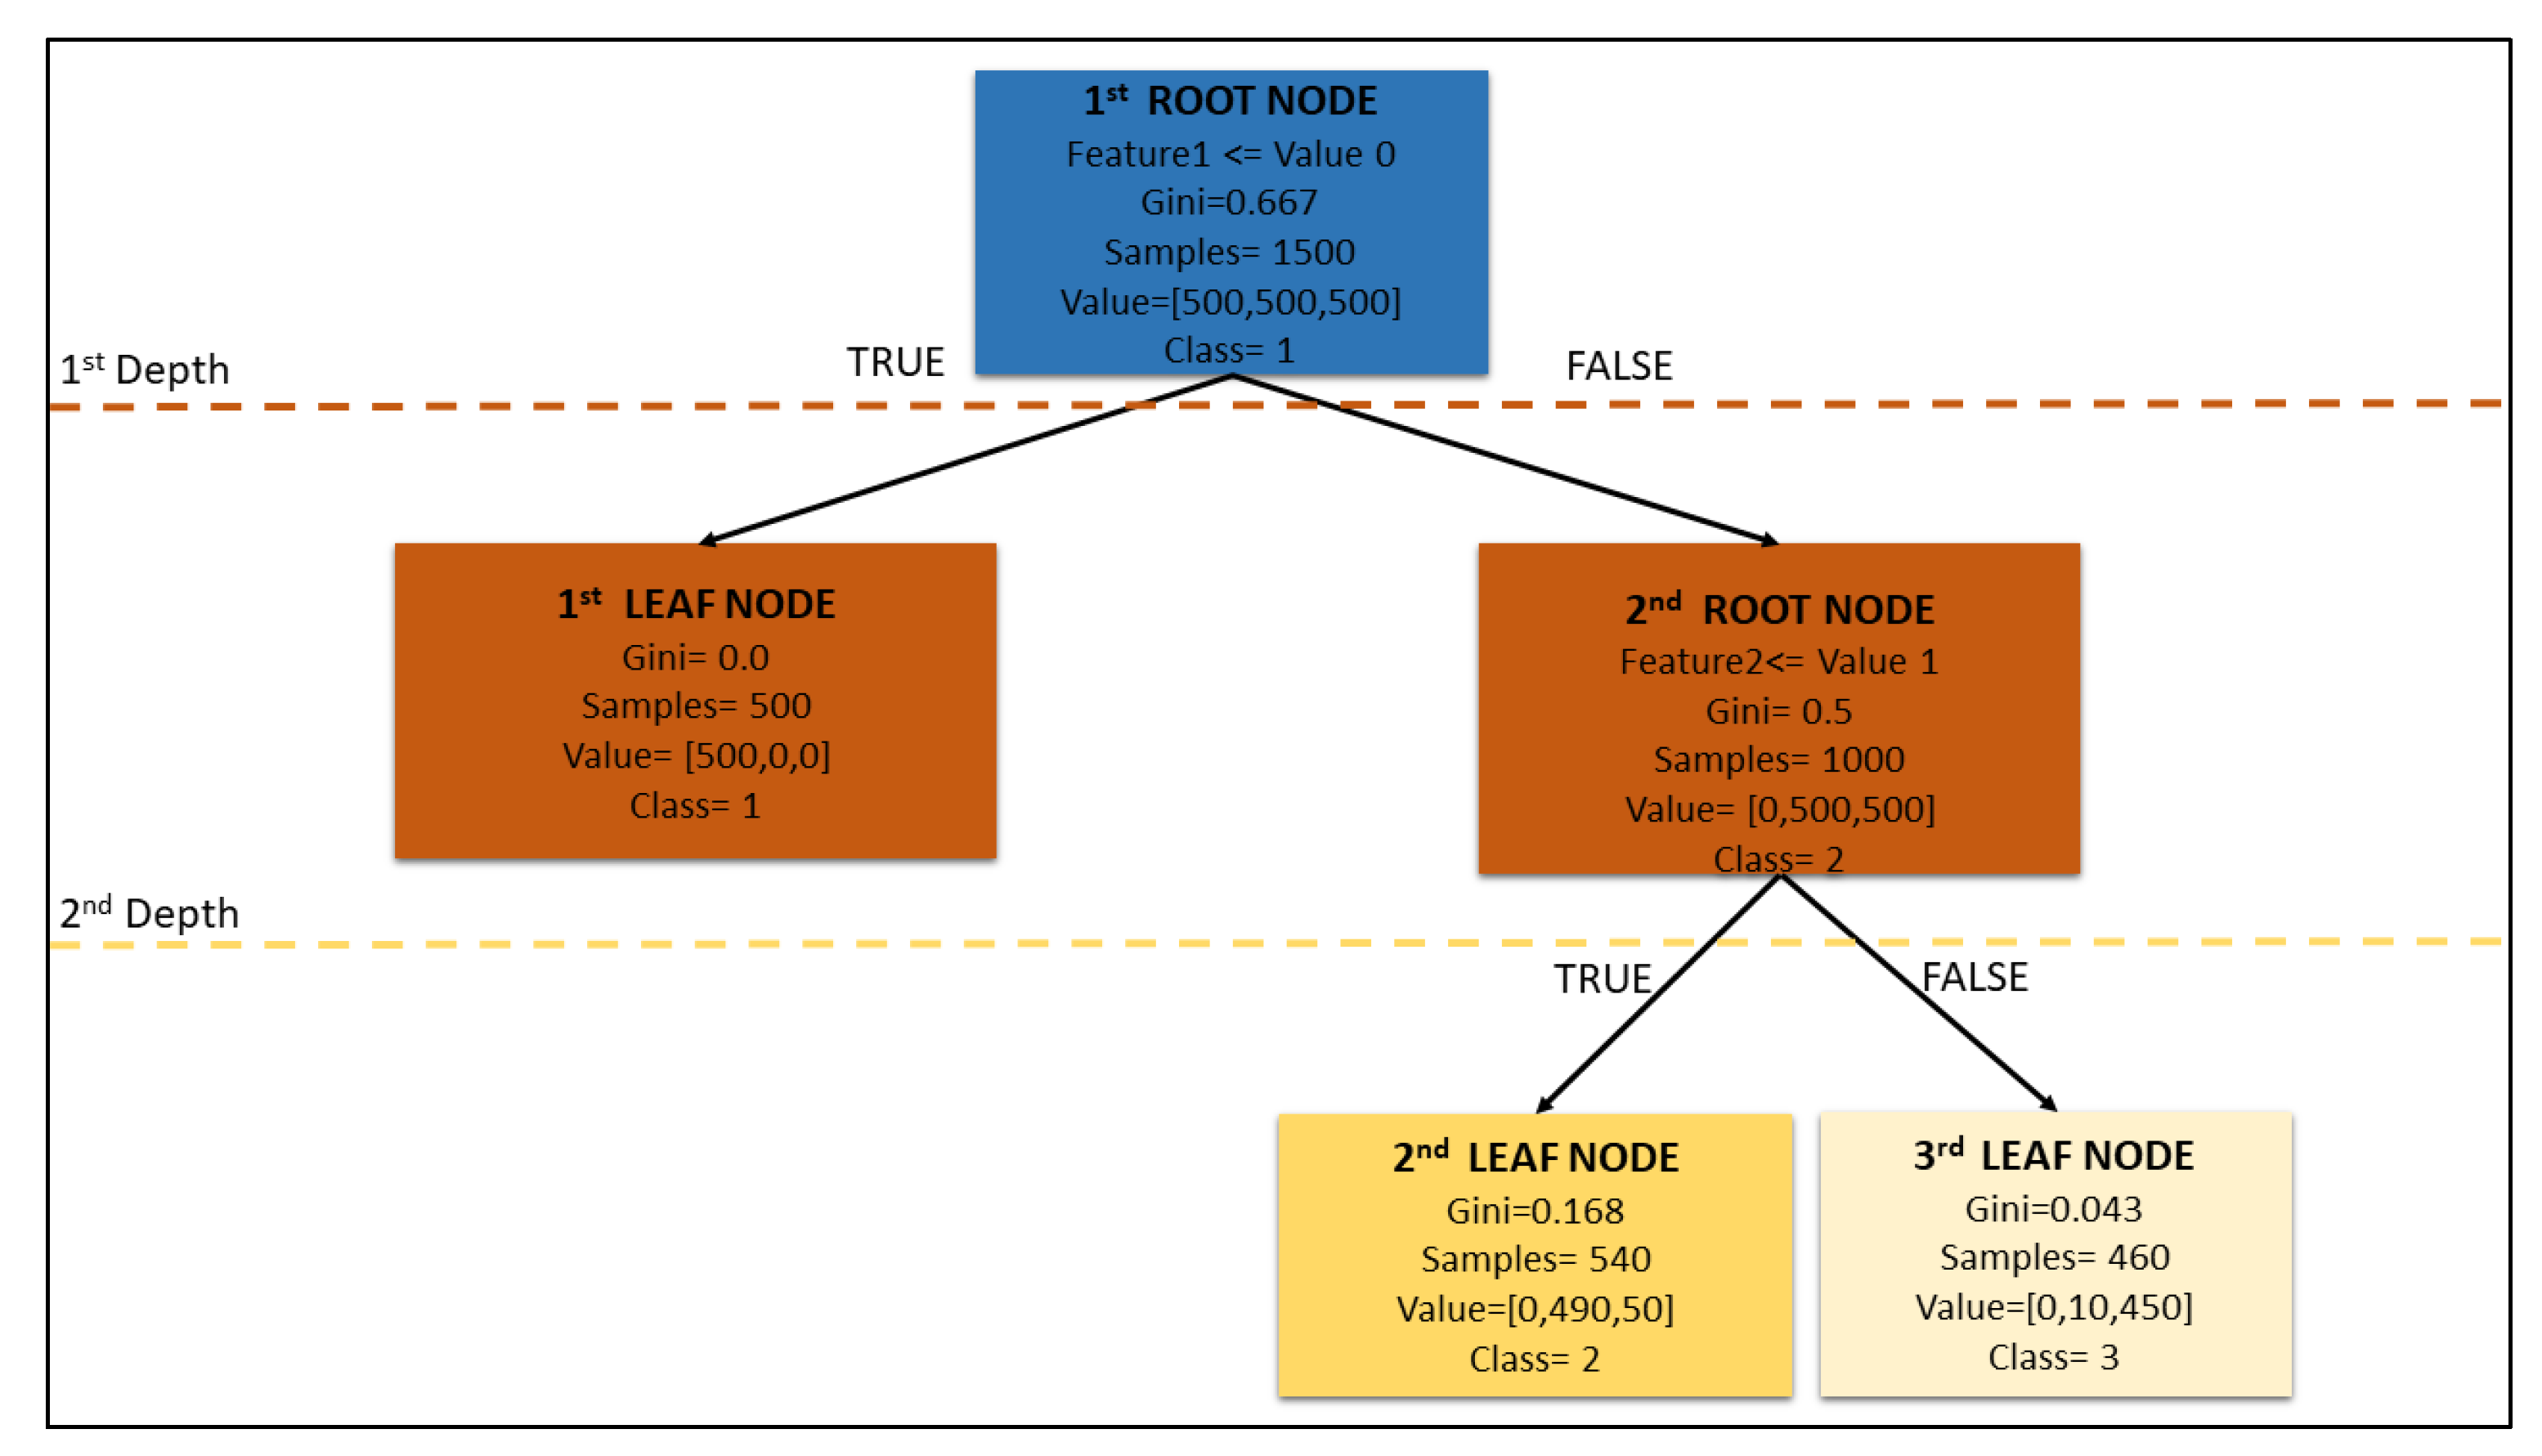
The ML model used in this work for AIS binary classification is a decision tree-based algorithm, given its wide use and its relative simplicity even in terms of computational weight. The input variables derive from the observation of the event; in the case of this work, they are represented by the features extracted from the AIS data. The output variables, in this case, are the two established classes. A decision tree classifies data using a logical structure in which each node applies a condition to determine the outcome. The model used is contained in the Classification Learner App in MATLAB (The MathWorks Inc., Natick, Massachusetts, v. 2022b). The function is the fit binary decision tree (fitctree). It takes advantage of the decision tree algorithm to perform a classification. The main goal of the decision tree is to model a tree on the data for classification purposes. A typical result of a trained decision tree is reported in Figure 6.
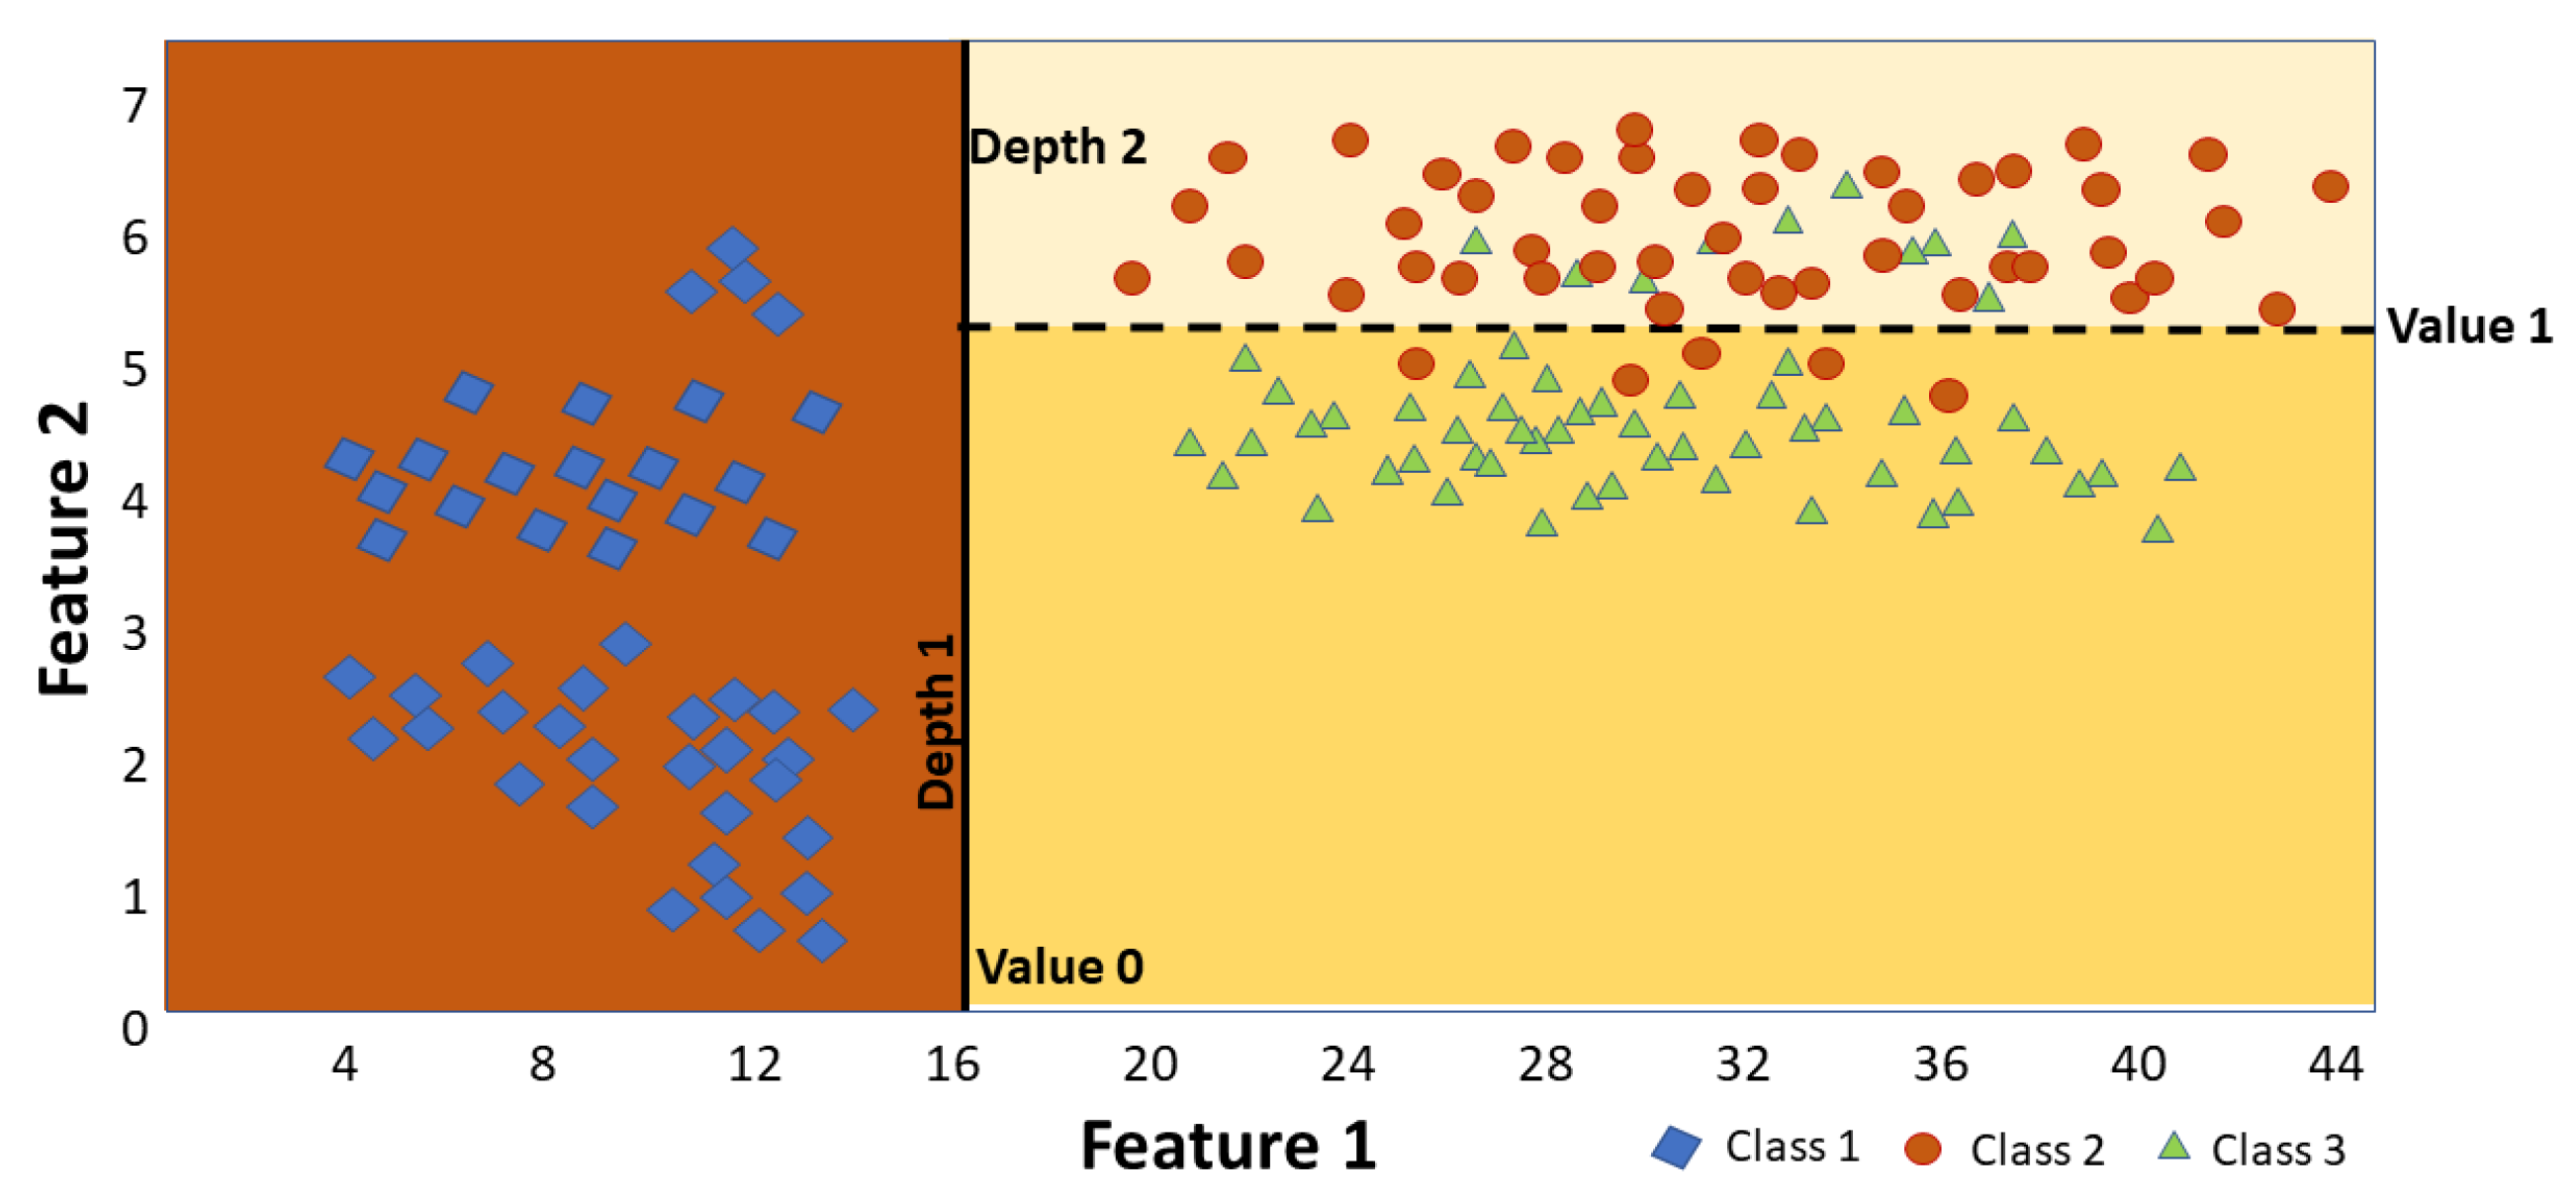
It is possible to see an example of the final structure, and so the typical nodes used by the model to make predictions. Thanks to this structure the model decides which class the input instance belongs to. In particular, Figure 6 shows a model with a maximum depth of 2, trained on a dataset with 1500 instances. Each instance has only two features (k1 and k2) and it can belong to one of three classes labelled (“1”, “2”, and “3”, just for a better understanding). The nodes usually involved in the decision tree are root nodes or leaf nodes. The root nodes usually have a splitting criterion and so consequently child nodes, the leaf nodes have no split criteria and so do not split any further. Each node has several parameters: splitting criteria if the node is not a leaf node (in the image, for example, the first splitting criteria is on Feature 1), the Gini value of the node that measures the impurity of the node (Equation (1)), in this equation the value of pi,j is the ratio of the class j instances among the training instances in the i-th node (for example in 2nd leaf node: 1 − (580/630)2 − (50/630)2).
  G i = 1 j = 1 n p i , j 2
The other parameters are the number of instances involved in the node (for example in the third leaf node it is 460), the number of instances belonging to each class (for example in the second leaf node: 0 in Class 1–580 in Class 2 and 50 in Class 3), the predicted class for the node (for example in the first leaf node: Class 1). The process of prediction starts with the first root node and the question is: the instance entered by the user has a value of Feature 1 lower or equal than the Value 0; in the case of the true condition the model moves down to the left part of the tree (root’s left child node), in the case of the false condition, the model moves down to the right part of the tree (root’s right child node). From the image, it is possible to see that the root’s left child node is a leaf node, it is a node where there is not another split (no child from this node), so there is not another question and the attributed class of the instance is the one defined by the node, in this case Class 1. In the second case, the root’s right child node has another condition and in this case the question is: the instance entered by the user has a value of Feature 2 lower or equal than Value 1, in case of the true condition, the model moves on the left part, in case of the false condition the model moves to the right side. In the first case there is a leaf node with Class value equal to 2, in the second case there is another leaf node with value Class of 3. For each root node there is a threshold of one of the features that defines a boundary for the decision tree; Figure 7 shows the graphic representation of the tree of the example proposed above, with the two decision boundaries defined by Value 0 and Value 1.
The algorithm used is the CART—Classification and Regression Tree algorithm; the core of the algorithm is to find the boundaries that minimize the cost function. The measure to minimize can be the Gini Diversity Index (Equation (2)—J1), the Towing rule (Equation (3)—J2) or the Entropy (Equation (4)—J3).
J 1 k , t k = m l e f t m G l e f t + m r i g h t m G r i g h t
J 2 k , t k = P L e f t P R i g h t 4 j = 1 n |   p j | L e f t p j | R i g h t | 2
  J 3 k , t k = k = 1 p i , k = 0 n p i , k l o g 2 ( p i , k )
The first step of the algorithm is to split the training set using the feature (k) and the threshold (tk) that produces the purest subset. Defining the first split of the training set, the algorithm splits the subset with the same logic until reaching the stopping criteria defined by the user. The main hyperparameters that control the method are: the maximum depth, minimum sample leaf, the minimum sample split, and the cost function. The algorithm has an optimization method to find the best hyperparameters for the decision tree. The hyperparameters tuned during the process of optimization are the maximum number of splits and the criterion for the split (Gini’s diversity index, Towing rule, Maximum deviance reduction). For the first hyperparameter, the algorithm searches the best choice of depth of the tree in a range between one and the number of instances. The second hyperparameter is the variation of the split criterion between the three described above. The optimization algorithm used is the Bayesian one, the main goal is to reduce the objective function that in our case is classification error. In general, the algorithm of optimization has three fundamental steps: the process model of the objective function (in this case a Gaussian process), the Bayesian update for changing the Gaussian structure at each evaluation of the objective function, and an acquisition function to determine the next point to evaluate. The algorithm repeats these steps until it reaches a number of fixed iterations or a fixed time. In this case a maximum number of iterations was fixed. The maximum number of evaluations of the objective function imposed is 80. An example of an optimization graph is shown in Figure 8. It is possible to see the minimum classification error trend in function of Iteration; the yellow point in the graph shows the iteration where the algorithm finds the minimum value of the classification error.
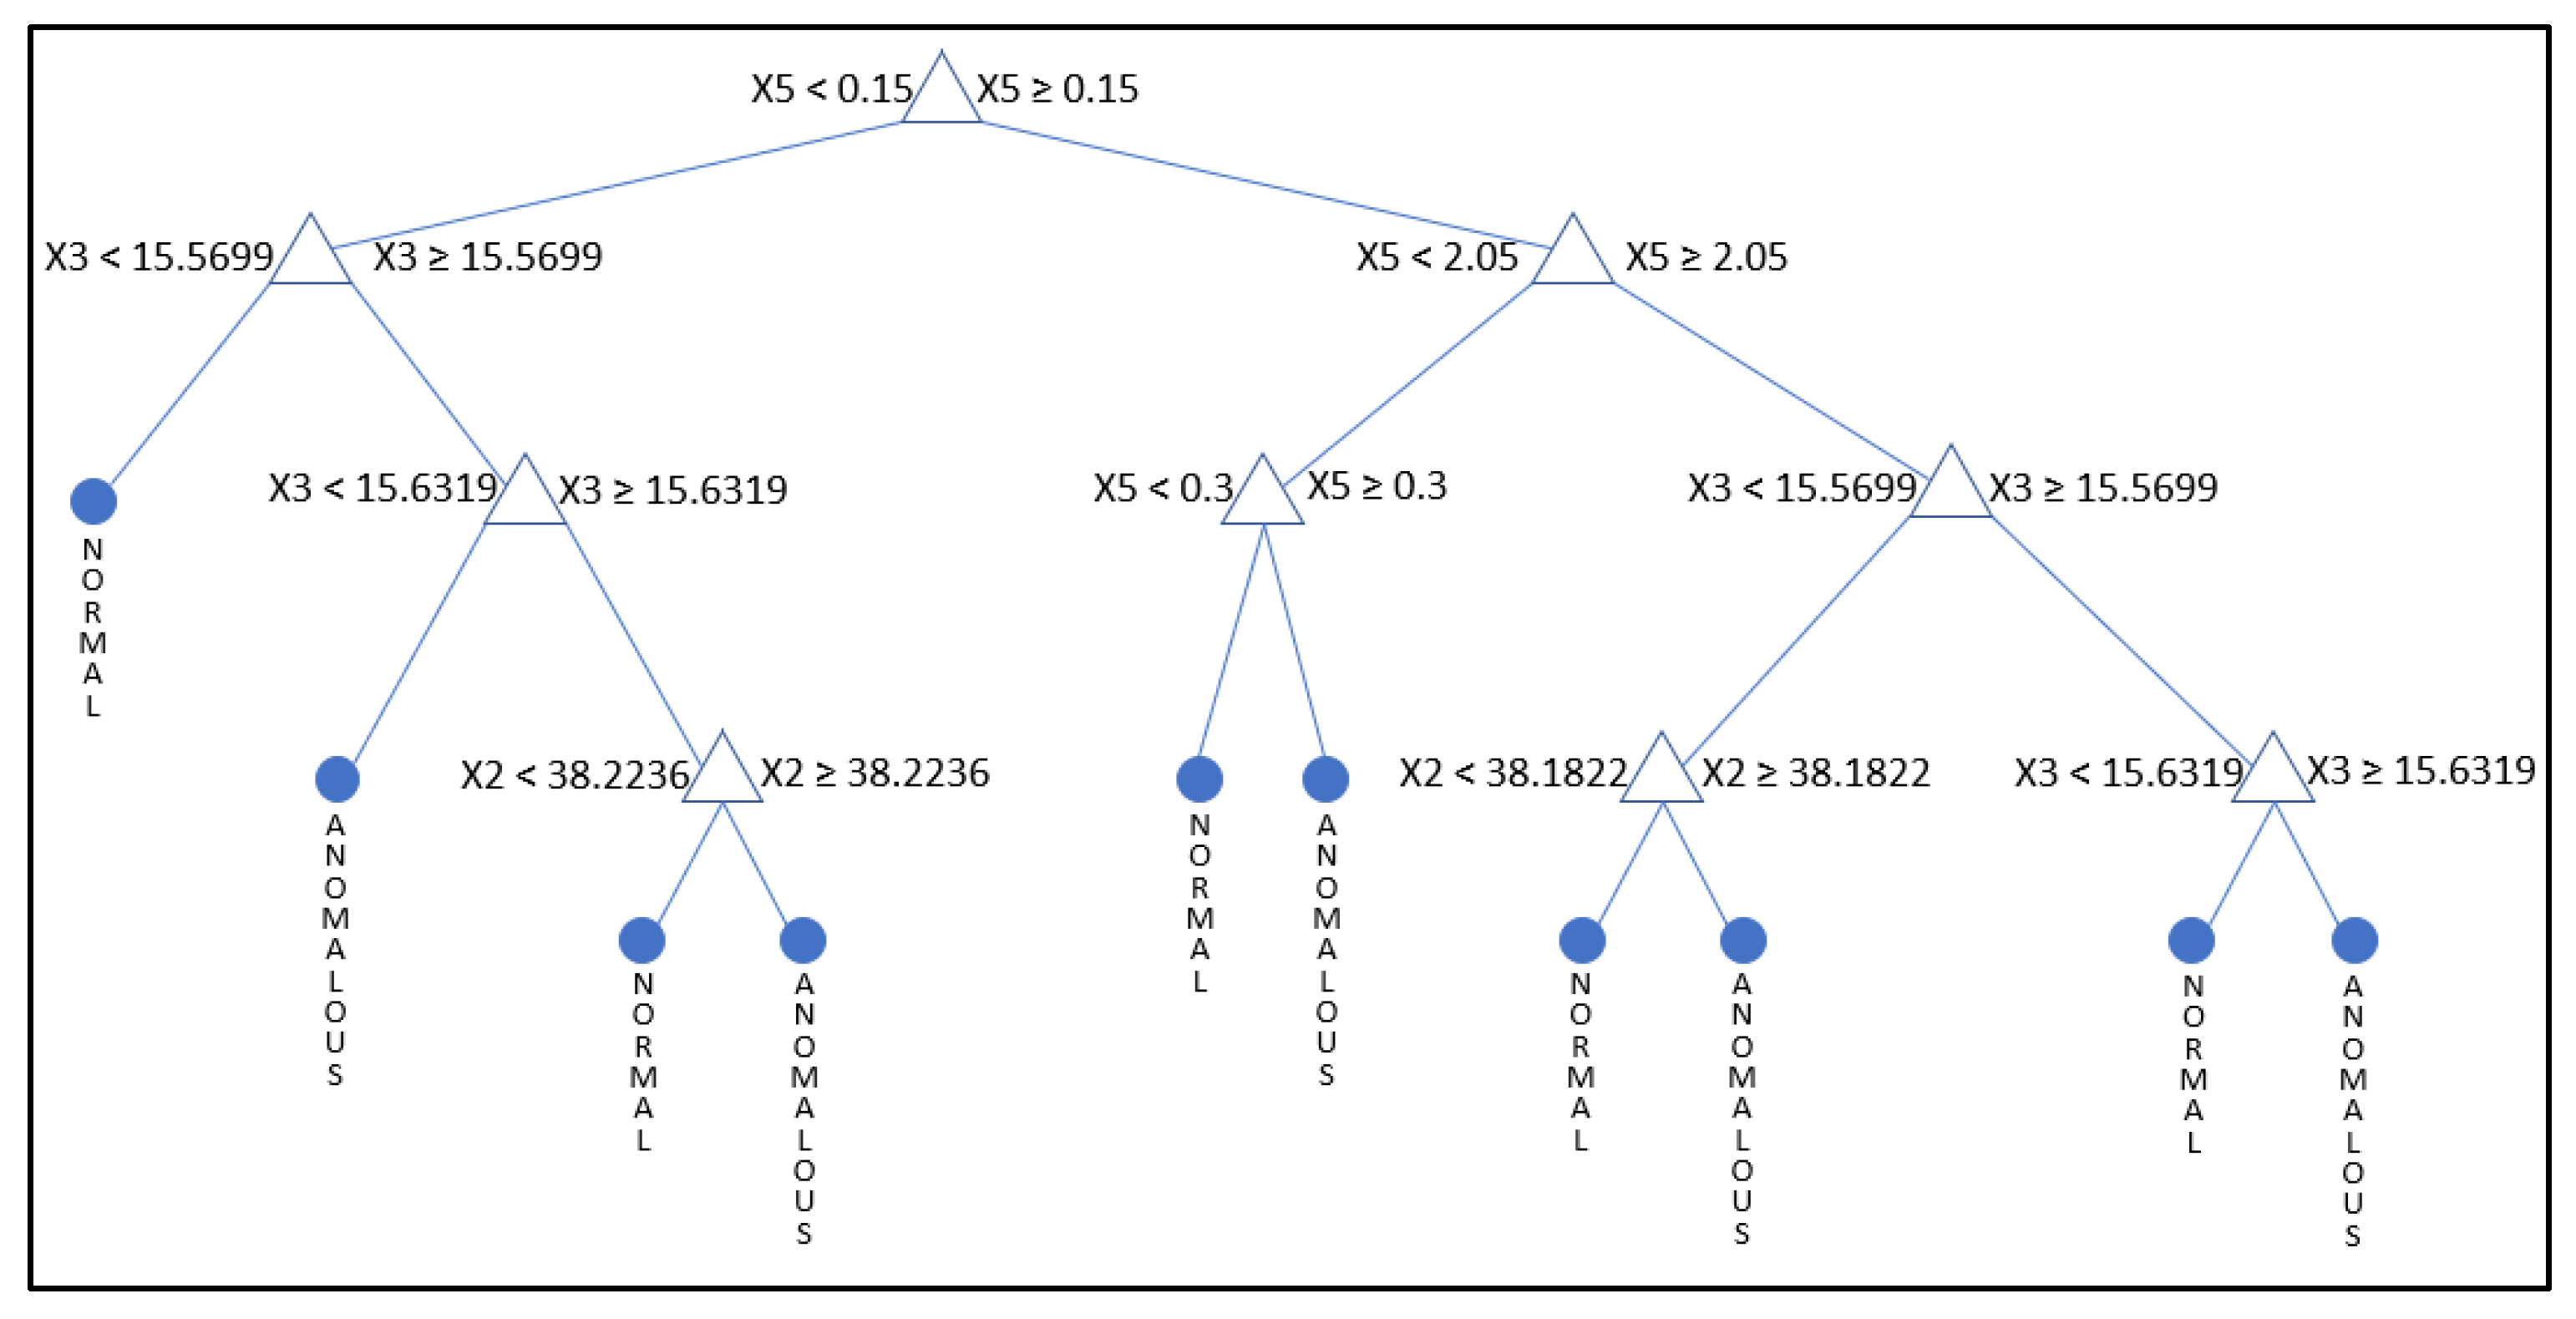
Figure 9 shows an example of an obtained decision tree with a low dept. From the figure, it is possible to see the great potentiality of the decision tree: the complete knowledge of the features used during the process. For example, the figure shows the splitting criteria for each node, in this case the three features used for the splitting are SOG (X5), Lon (X3) and Lat (X2).
The method used could be subjected to overfitting and so a method for avoiding this occurrence is cross-validation. The January balanced dataset has been randomly divided into k = 5 disjoint folds containing approximately the same number of elements. So, five trainings, with the aforementioned algorithm, were done using four folders for the training and the other one for the validation phase. Cross-validation allows us to obtain a model that can reduce the overfitting and increase the capacity to generalize the tree. All the operational phases described so far (datasets creation, features extraction, model training, and test) were conducted on the same hardware, which consists of a 2.6 GHz Intel i7 processor (9th Gen; Intel Corporation, Santa Clara, CA, USA), with 16 GB of memory, and an NVIDIA Ge-Force GTX 1650 GPU with 4 GB of memory (NVIDIA Corporation, Santa Clara, CA, USA). The software utilized to pre-process data, train, and test the ML algorithm is MATLAB (The MathWorks Inc., v. 2022b).

3. Results

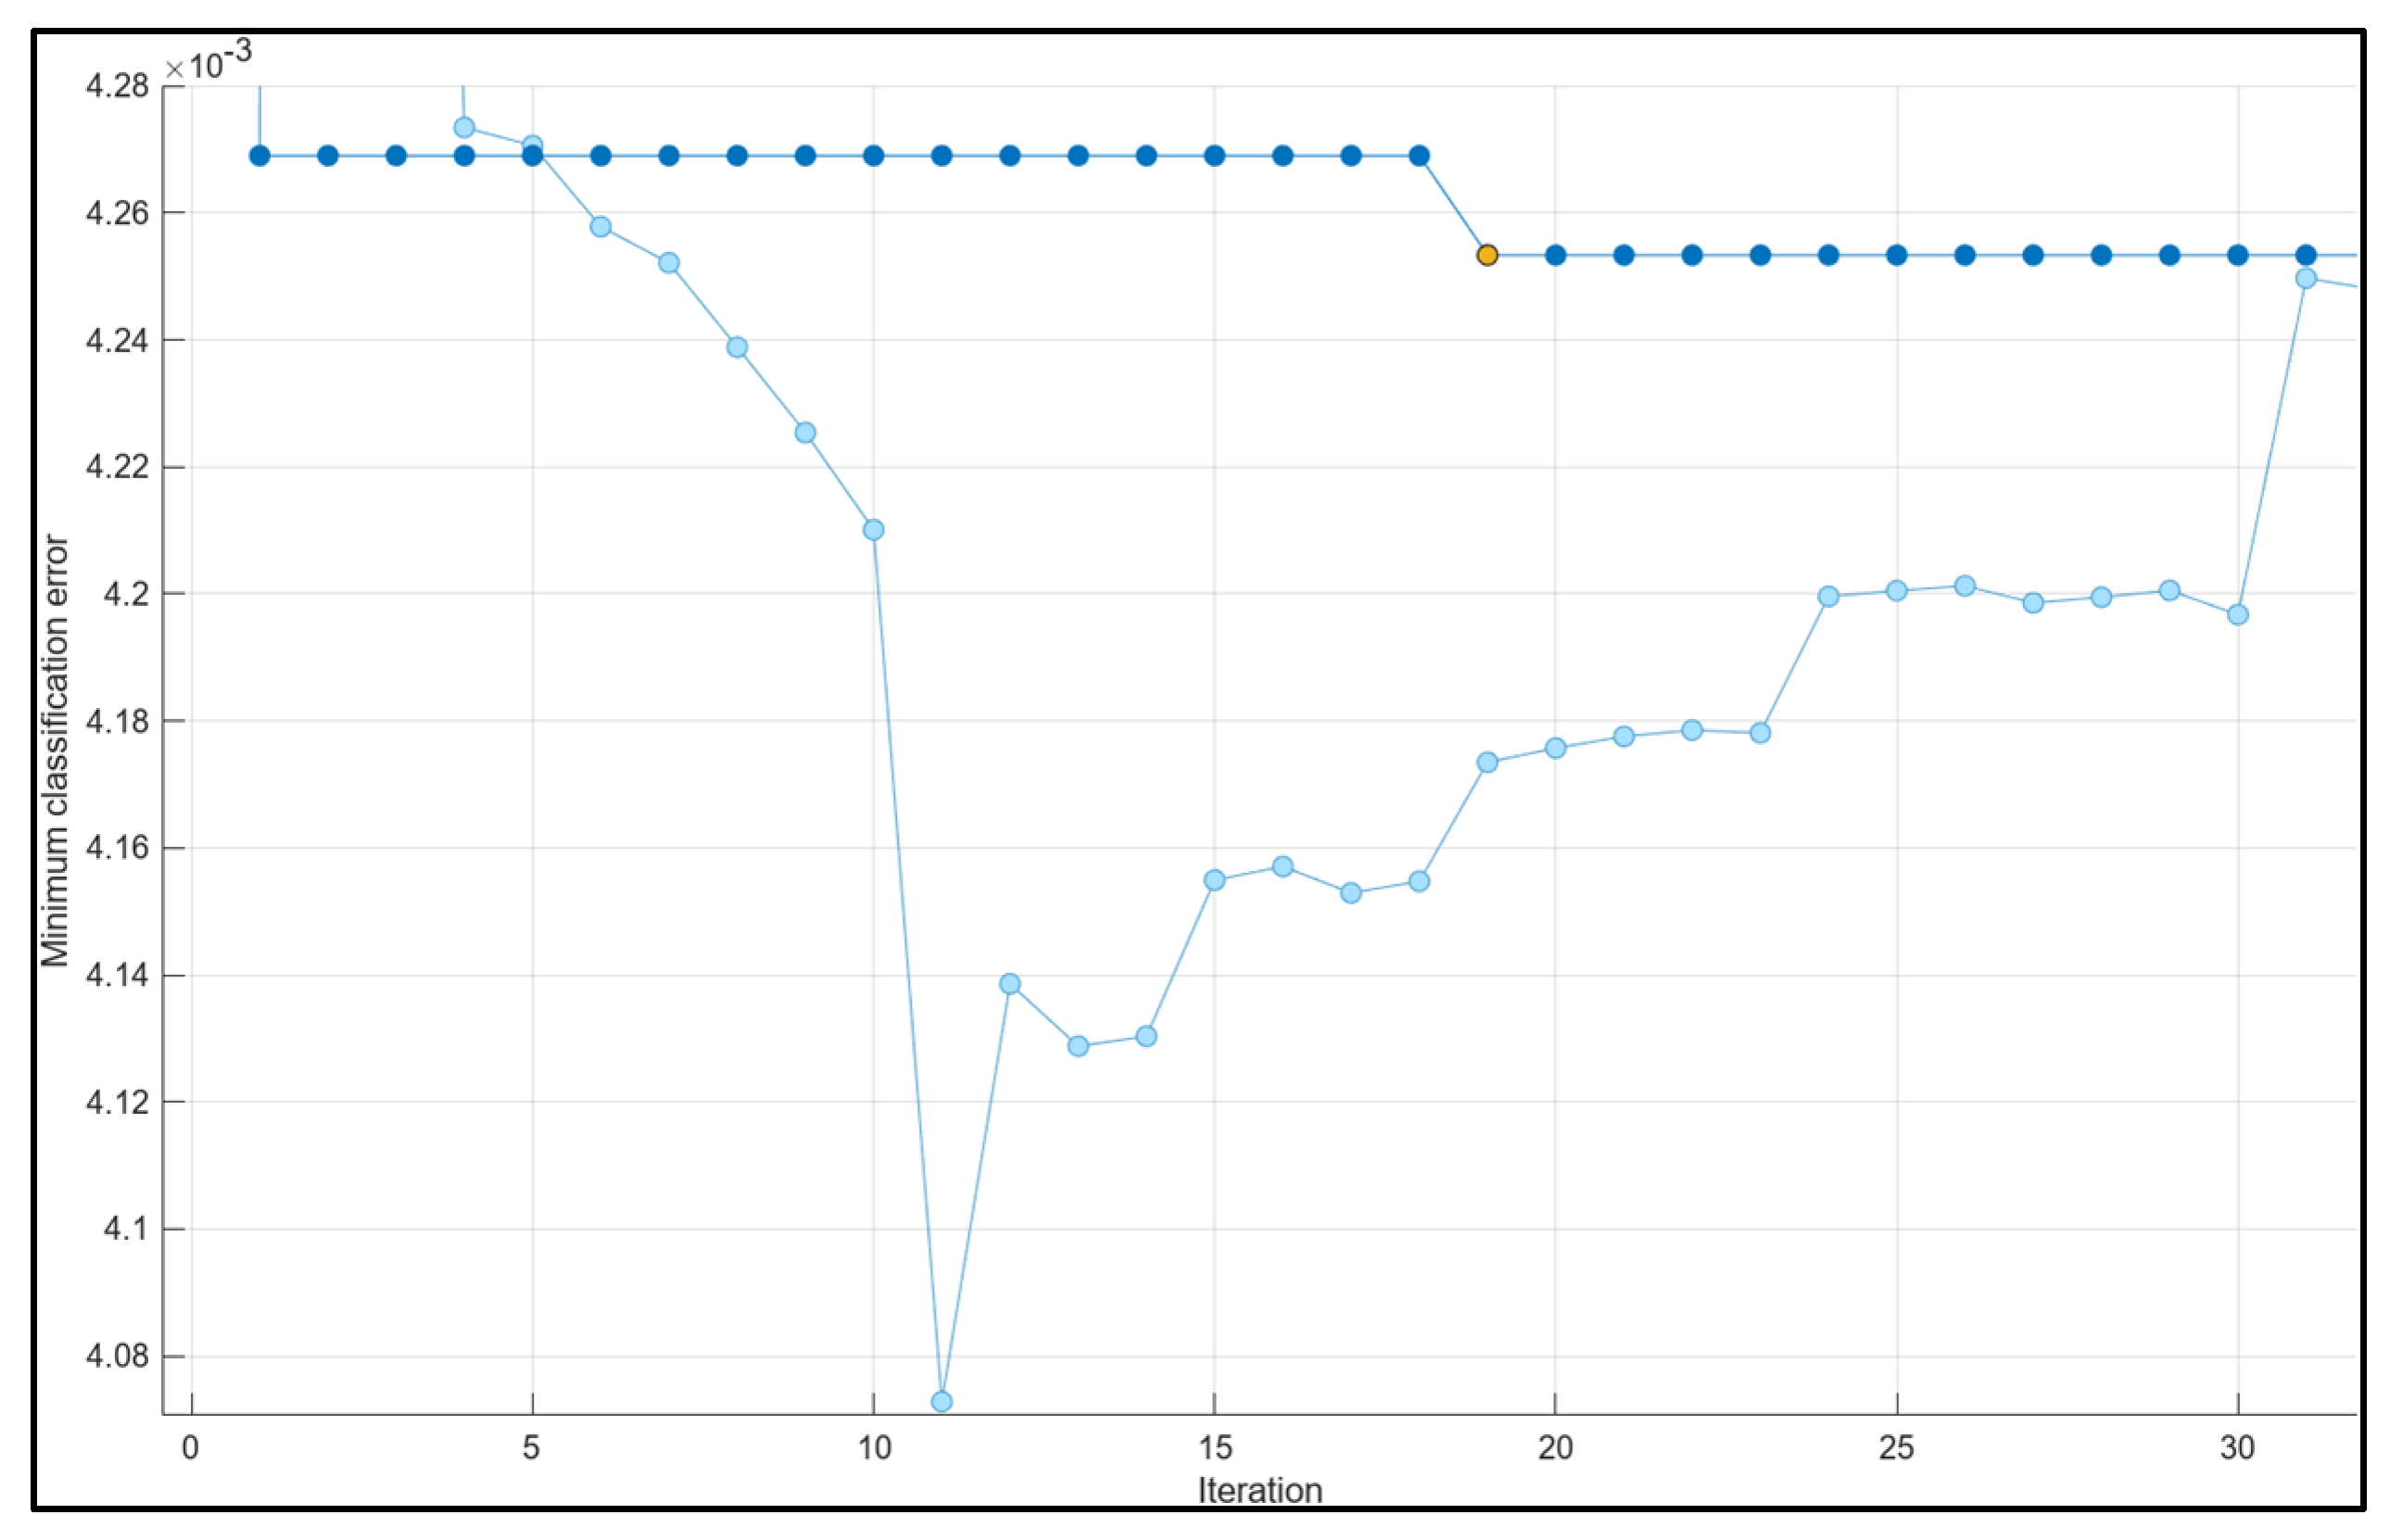
The results of the model training are in the form of confusion matrices which correlate the true classes of the AIS data contained in the validation dataset (true classes) and the classes predicted by the model during the validation phase (predicted classes). The optimizer performs 80 iterations as mentioned above and finds the best point in terms of minimum value of classification error. Figure 10 shows the first 30 iterations to highlight the area of the graph where it is possible to see the minimum value. At this point, the number of splits of the decision tree is 6471 and the split criterion used is “Maximum deviance reduction”. To iteration number 19, the algorithm produces a reduction step of the classification error that remains constant for the rest of the training.
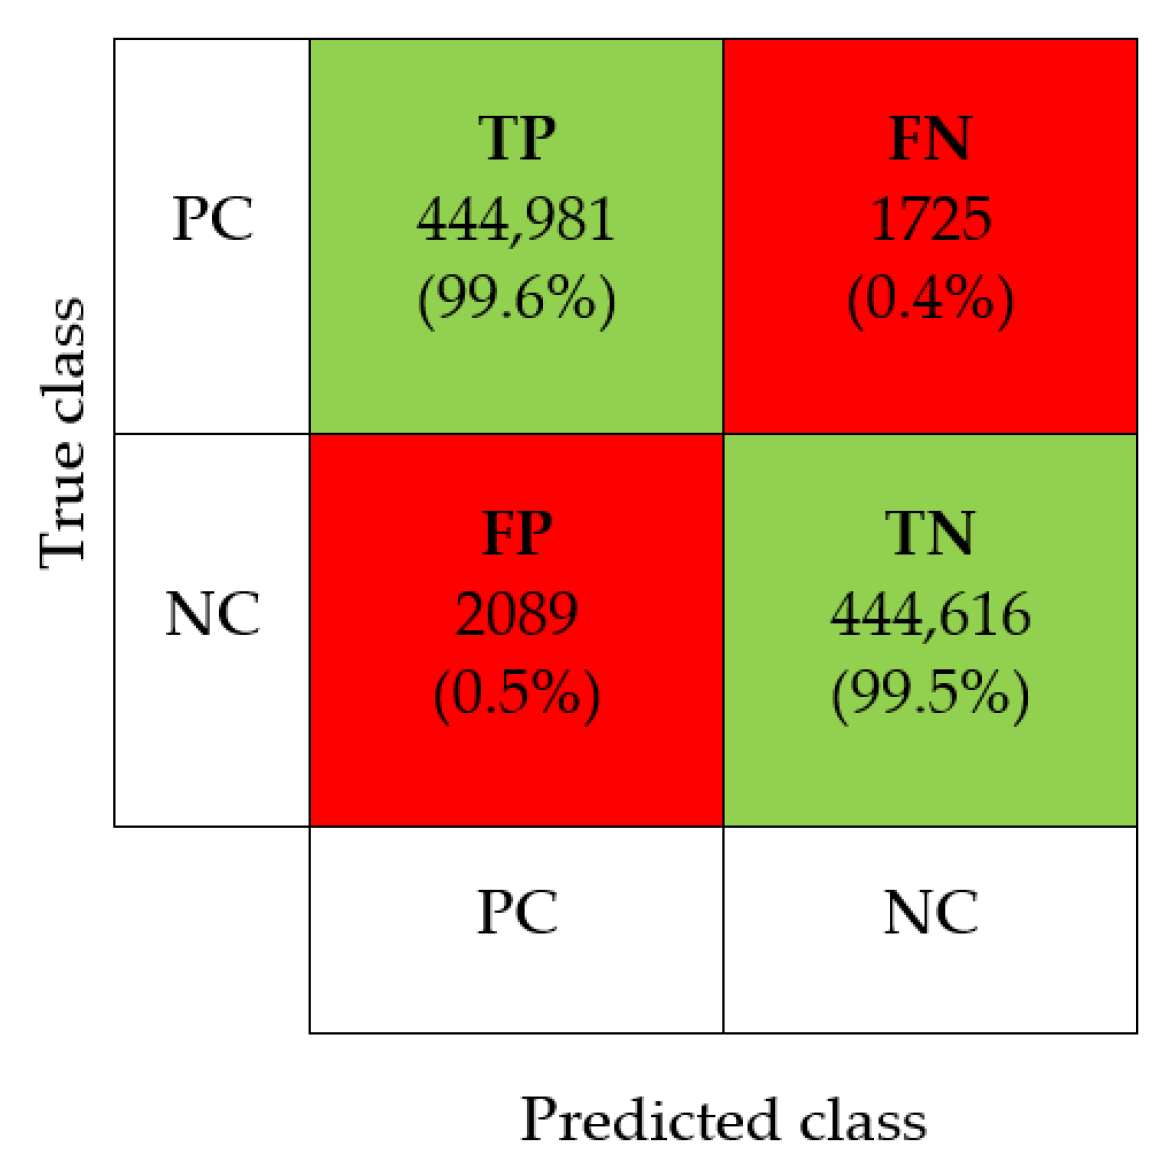
There are two confusion matrices, one for each of the two phases (validation and test). In each confusion matrix it is possible to see four types of elements: the True Positives (TP), which are AIS data correctly classified by the model belonging to the positive class; False Negatives, (FN) which are those classified as belonging to the negative class while they belonged to the positive class; False Positives (FP) which are those belonging to the negative class and incorrectly classified as belonging to the positive class; True Negatives (TN), which are those correctly classified by the model belonging to the negative class. The confusion matrices of the validation phase, expressed in absolute values and in percentage are shown in Figure 11.
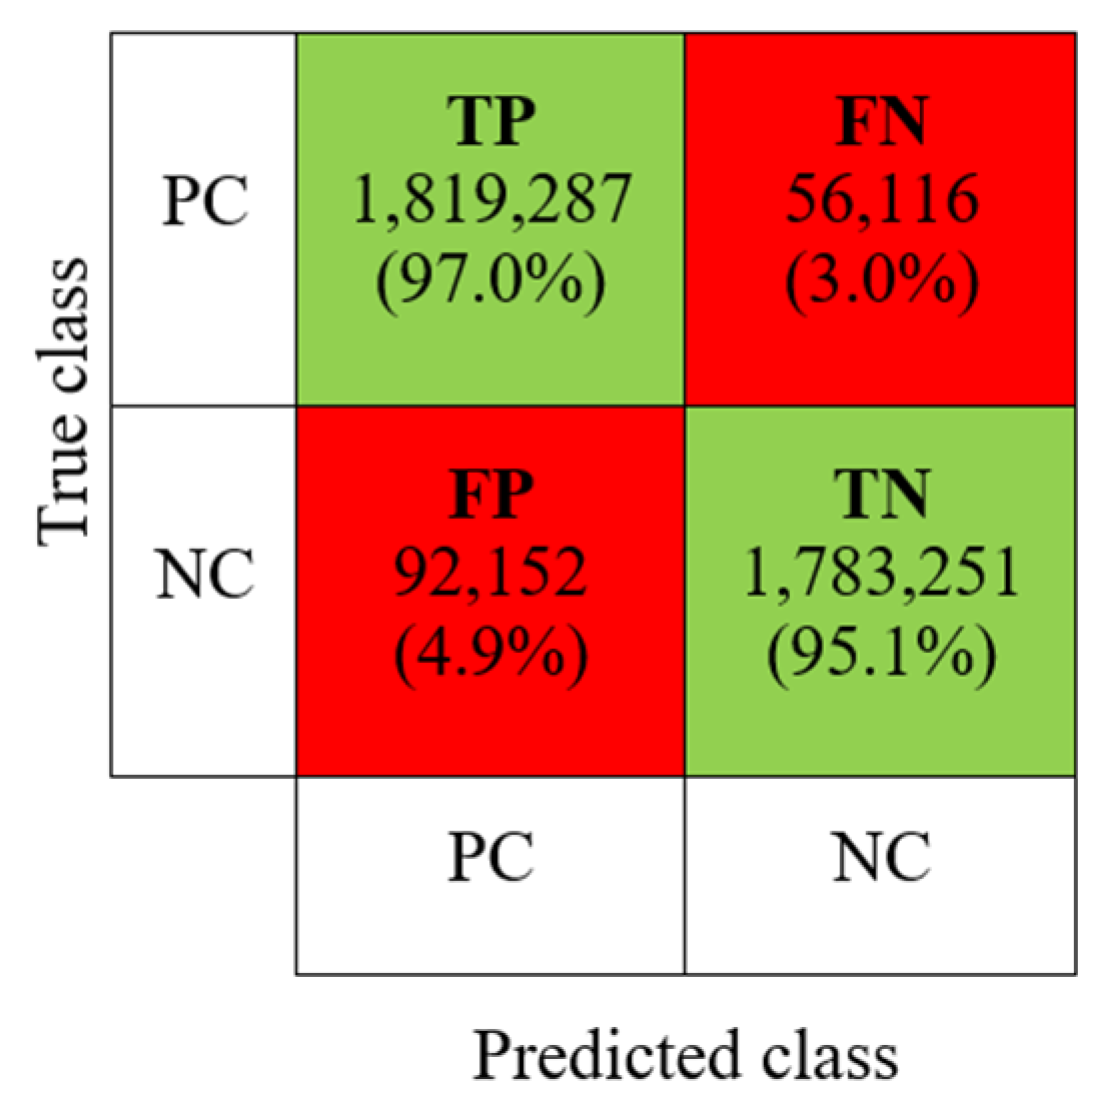
F the test phase there is also a confusion matrix, shown in Figure 12. In this case, the values were calculated from the results of the dataset test. As shown, the values in percentage are lower than the validation phase.
The performance of the model and therefore the effectiveness of the method can be described by means of some significant parameters which are called accuracy, precision, sensitivity, and specificity. Accuracy is the proportion of correct predictions over all instances. Precision is the proportion of true positives among all predicted positives. Specificity is the proportion of true negatives among all actual negatives. Sensitivity is the proportion of true positives among all actual positives. The results obtained from the classification, after both the validation and test phases, are schematized in Table 5 and Table 6, respectively.
A cross-validation was performed to verify the behavior of the level of accuracy for a number of folds equal to five extracted from the January balanced dataset. Table 7 shows the main results obtained with cross-validation.

4. Discussion

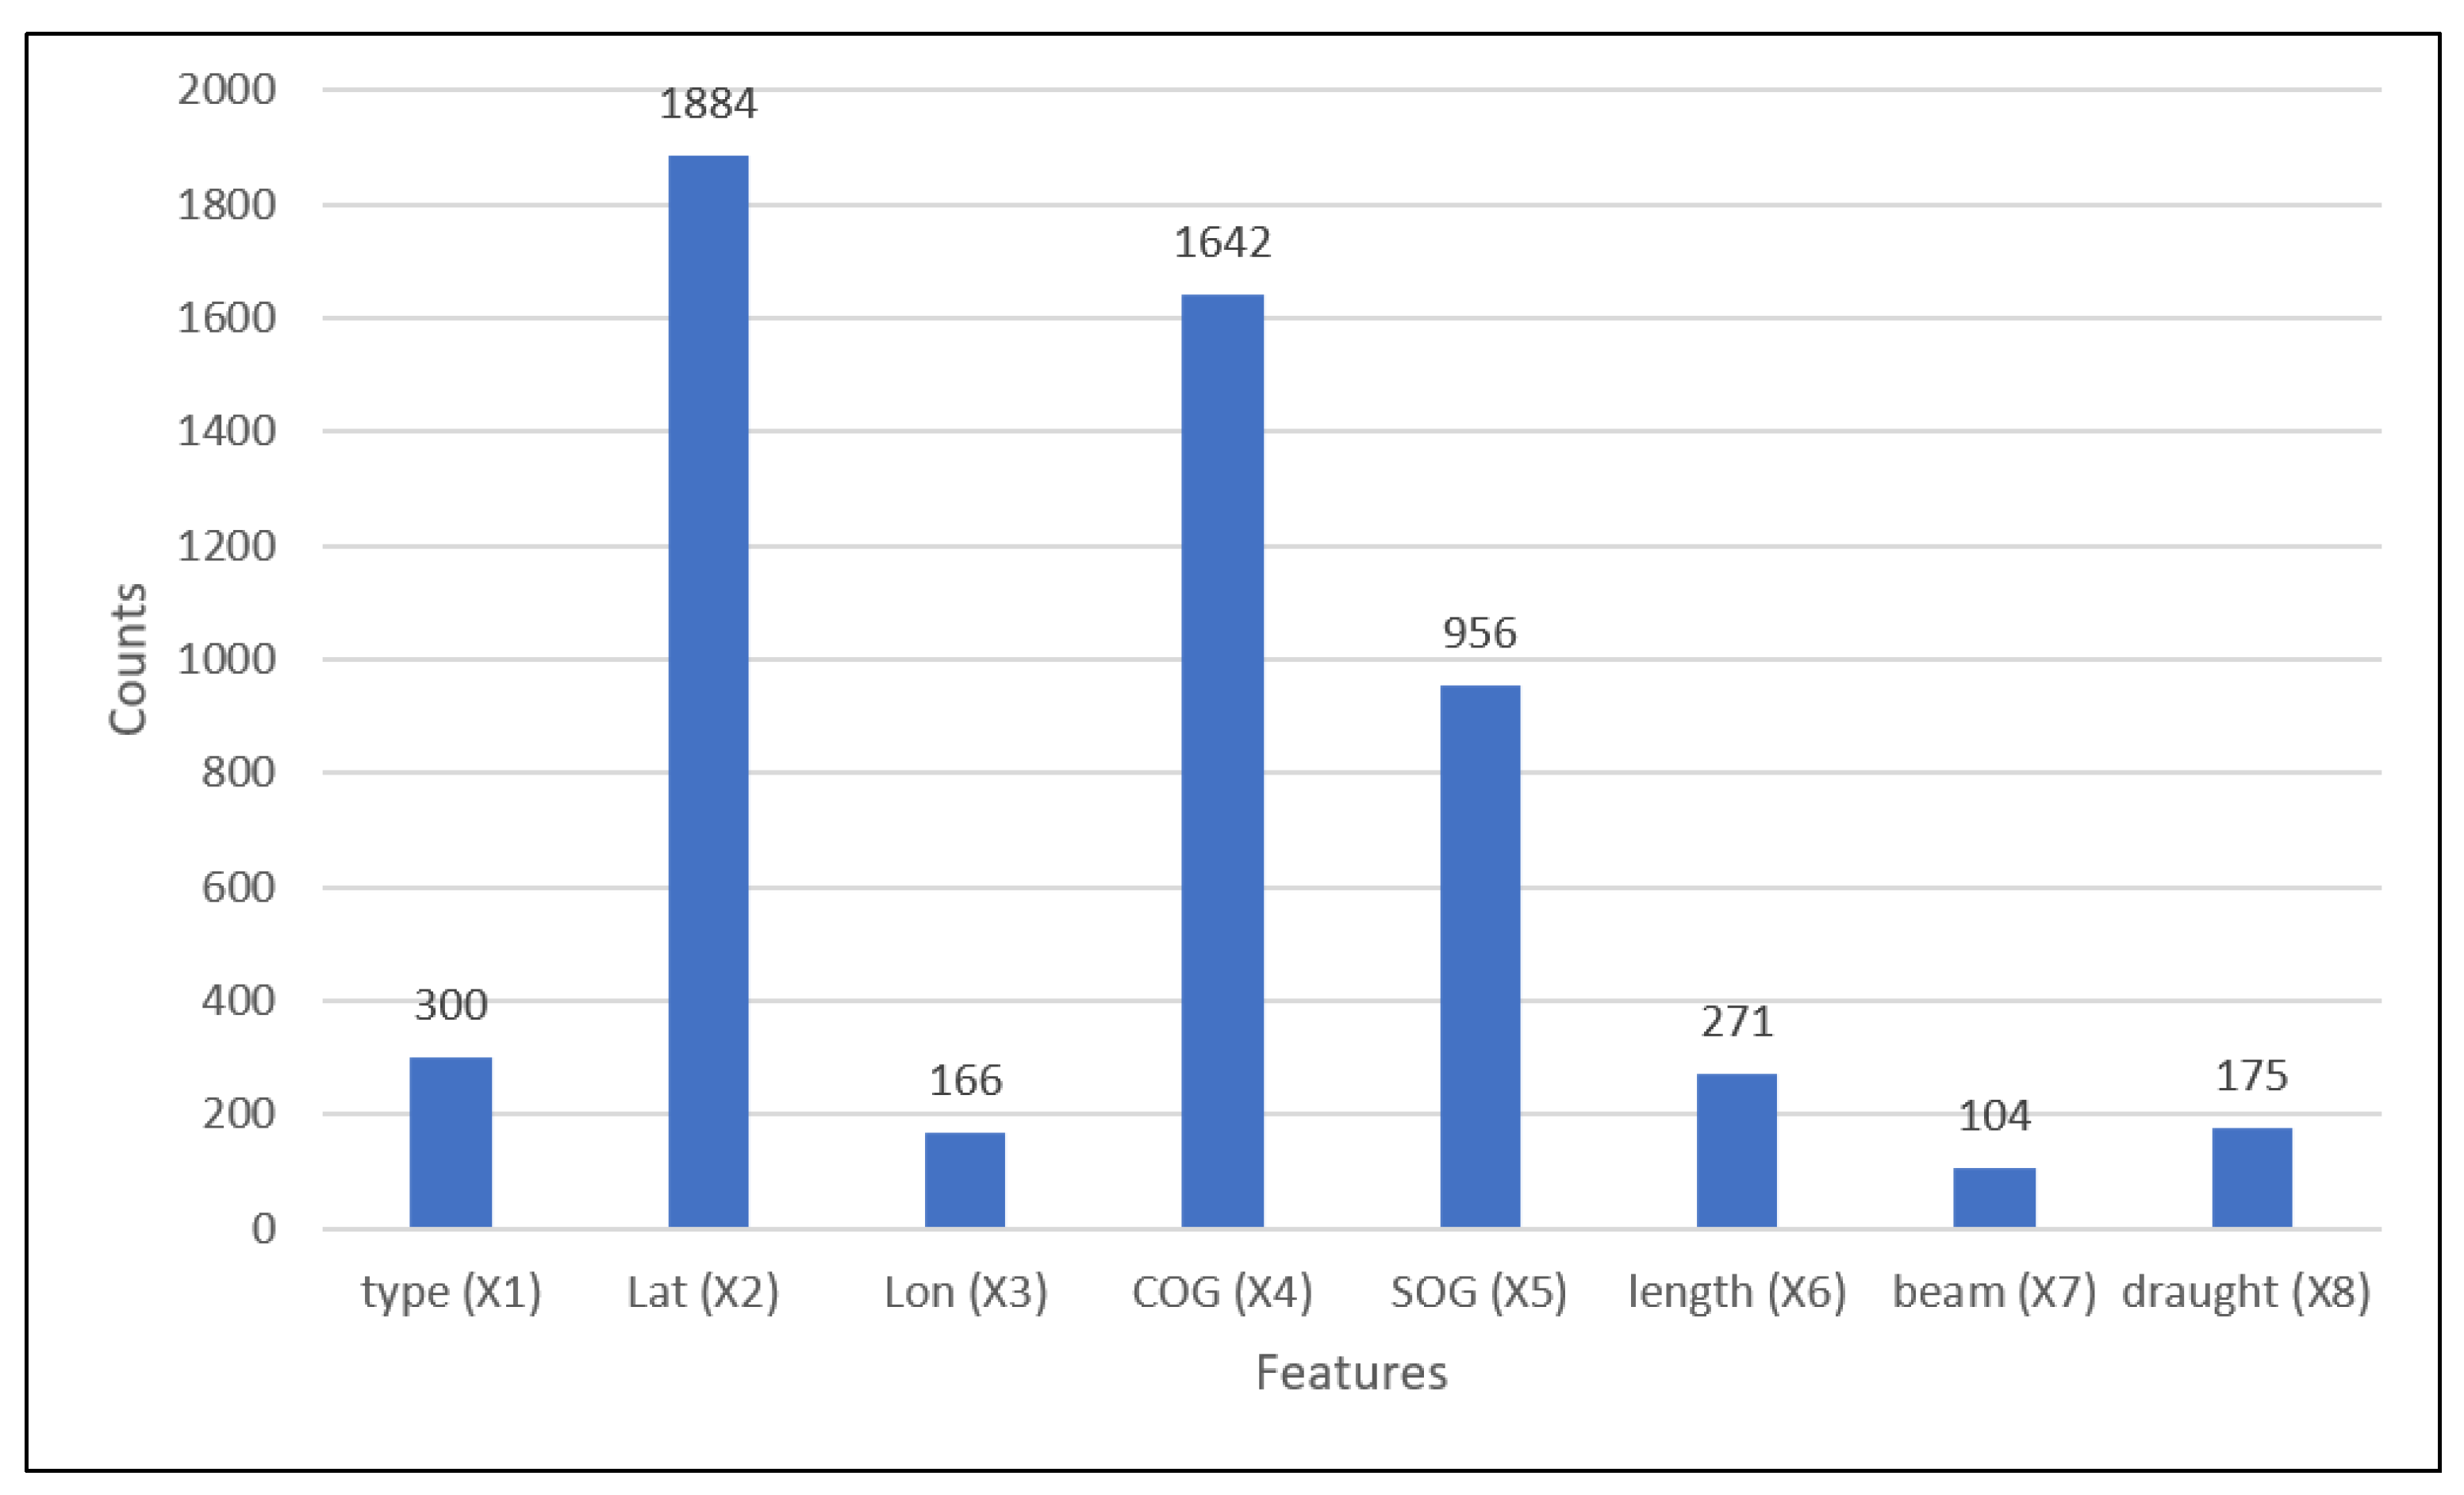
The values of the parameters shown in Table 5, Table 6 and Table 7 are generally very high. Regarding the results coming from the validation phase, it is possible to see that accuracy is 99.57%. Generally, this parameter is not totally descriptive of the performance of the trained model, but in this case, because of the presence of a large and balanced dataset, accuracy describes the model’s potential quite well. In the confusion matrix of the validation phase, the percentage of the misclassified data (sum of FPs and FNs) is around 0.4%. In this percentage, the FPs are slightly greater than the FNs (48% of FPs and 52% of FNs). It is possible to notice this condition also from the sensitivity, which is greater than the specificity. For the safety of navigation, the attendance of a higher number of FPs is an advantage. In fact, it is safer to have a false alarm than an unseen danger. This condition also exists in the results of the test data classification. In fact, despite the fact that the value of accuracy of the test phase is lower than the validation phase, sensitivity remains higher than specificity. This confirms that despite a lower value of accuracy (95.96%) the committed error (4.04%) is composed of 63% FPs and of 37% FNs; therefore there is a higher FP value than that obtained in the validation. As mentioned, a five-fold cross validation was also performed. With respect to the classic validation phase, after cross validation the model accuracy remains very high but there is a turnaround between FP and FN. The cross-validation of the decision tree proposed has results very similar to the one proposed above. The level of accuracy is 99.60% in both the models. A major advantage of the Decision Tree algorithm is that it is not a black box ML tool, but it is possible to understand the most important features used by the algorithm to build the tree and so to understand the process of prediction. As mentioned above, the number of features used for training the tree are eight. For each split inside the tree, the algorithm chose the best feature for splitting and the best value of threshold in terms of minimization of the cost function; Figure 13 shows the number of times that each feature has been selected inside the child node of the Decision Tree.
Three features over eight are the most used to create splits in the tree. Approximately 80% of the total splits involve these three features, indicating that the model primarily relies on positional and dynamic variables to distinguish navigation behaviors. These are X2, X4, and X5 that match, respectively, to Lat, COG and SOG. The features relative to the main dimensions of the ship (length and beam) and the value of draught during the navigation are the least used inside the tree. Since in the Strait of Messina a TSS is active, Lat and Lon features could be considered important for the algorithm. It can be observed that Latitude is the most frequently used feature for splits, while Longitude plays a secondary role. This could be attributed to the specific funnel-shaped morphology of the Strait, which extends predominantly along the latitude direction, making the model more sensitive to this parameter. A deeper analysis can be done by looking at the top 20 depths of the tree. Table 8 shows the number of features used in this interval. The most used features are Lat and Lon, followed by SOG. From this, it is possible to derive that initially the relative parameters to the position are the most used while, considering the entire tree, the use of the parameter Lon is gradually lost.
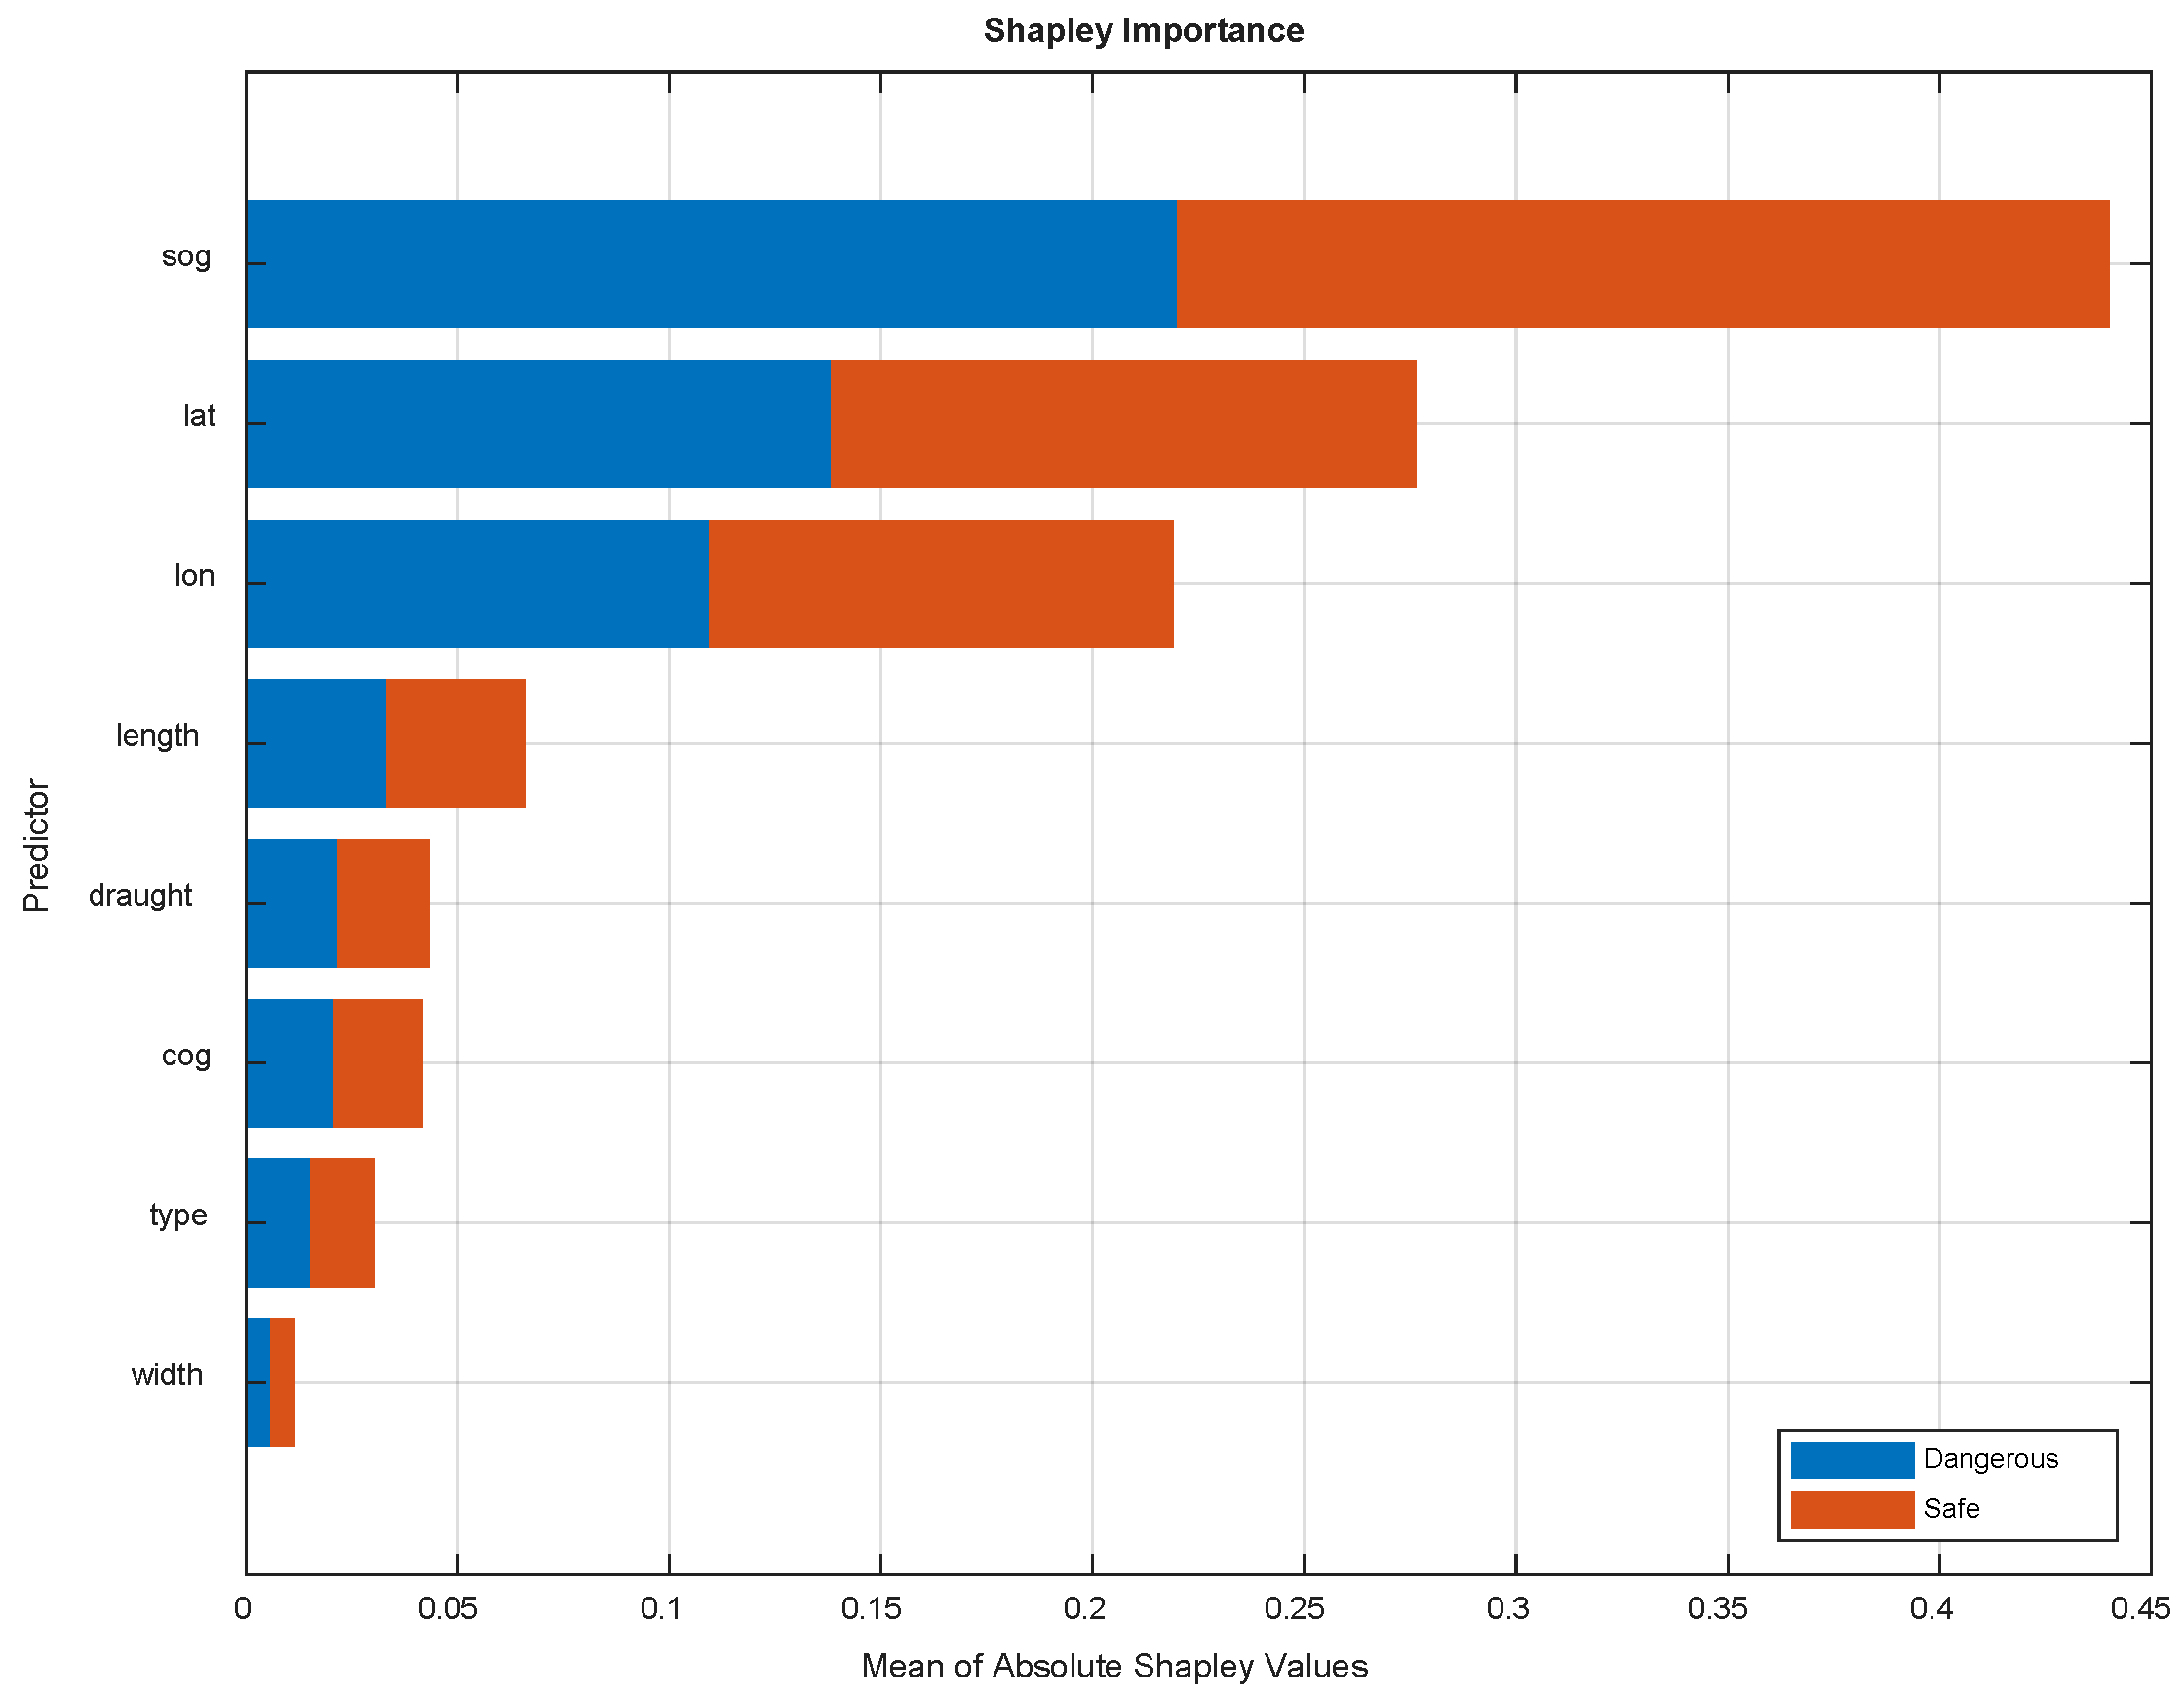
To better interpret the contribution of each predictor to the classification process, a feature importance analysis was performed using Shapley values. Figure 14 shows the mean absolute Shapley values for all predictors, distinguishing their contribution to the “Safe” and “Dangerous” classes.
The results confirm that SOG, latitude (Lat), and longitude (Lon) are the most influential features for the model’s decisions. This finding is consistent with the physical characteristics of navigation in the Strait of Messina, where variations in position and speed are critical indicators of anomalous or unsafe behaviors. Parameters related to the ship’s dimensions (length, width, draught) and type play a minor role, confirming their limited influence on short-term risk detection.
A practical application of this trained algorithm can be to assist VTS operators by detecting abnormal navigation conditions in real time, enhancing maritime safety and supporting timely decision making. This would ensure greater safety since the system is not sensitive to phenomena of a purely human nature such as fatigue and distraction. The system could classify in real time all the acquired AIS data, reporting abnormal events to the competent personnel who will assess the real gravity of the situation, taking action when necessary. In this way, the activity of the system is not intended to replace human intelligence, but to integrate it as a useful DST. Furthermore, the proposed method can be very useful where the accident statistics are very limited and consequently probabilistic methods are not very reliable, since the causation factor is difficult to estimate. In these cases, an ML approach can integrate probabilistic methods, also to assist decision makers and port authorities in the navigation planning phase. The method is meant as an additional tool for the VTS office. Further improvements can include more realistic artificial anomalies using additional data from the coast guard, enhancing the utility of the system in practical applications. The artificial group proposed in this phase can be improved with several approaches and the method can be refined to more realistic situations. The method must be a starting point for improving the dataset available in terms of dangerous situations during the year.

5. Conclusions

The purpose of the work outlined in this article is to develop an ML method based on decision trees that exploits AIS data in order to increase safety in navigation. To do this, a case study was addressed on the ship transits in the Strait of Messina, Italy. The proposed algorithm has been trained to detect dangerous anomalies (e.g., abnormal SOG or COG) in ships’ transit, classifying generic AIS data (after feature extraction) into two classes (Normal and Anomalous, called NC and PC, respectively). In order to avoid the overfit of the data, the training phase is conducted with a hyperparameter tuned by a mean Bayesian optimizer. Thanks to the use of ML algorithms and in particular the Decision Tree method some important findings can be presumed:
  • Decision tree is a tool that can be used for detection of anomalies in the Strait of Messina,
  • The most used equation of cost loss function used by the algorithm is the Entropy one,
  • The accuracy of the trained model in validation and test phase are 99.53% and 95.9%,
  • The most used features for building the tree have been: Latitude, Cog, and Sog
  • The parameters relative to the dimension of the ship and draught are little used during the building of the tree.
  • Up to a depth of 20, the Longitude parameter has been used intensively but with the increase in the depth of the tree this feature was used less, probably for the particular shape of the channel of the Strait of Messina,
  • The algorithm can be a starting point for introducing the use of Machine Learning as instrument for VTS operators.
  • The system can be used to integrate the human experience as a Decision Support Tool (DST).
Moreover, the trained decision tree model can be integrated into real-time VTS operations, offering operators a DST to detect anomalous navigation conditions as they occur. This practical application can enhance situational awareness and support timely interventions, contributing to safer and more efficient maritime traffic management in the Strait of Messina.
The method proposed in the paper has some limitations that need to be improved with further studies. The main ones are:
  • The AIS data provided by the Port Authority have low number of instances in the group of anomalies.
  • Artificial anomalies have been added in order to balance the dataset.
  • The artificial anomalies can be improved with more realistic situations of risk with the help of the port authority.
  • The results of the decision tree can be improved with an ensemble method like Random Forest algorithm.

Author Contributions

Conceptualization, F.C., F.S. (Felice Sfravara) and E.B.; methodology, F.C., F.S. (Felice Sfravara) and E.B.; software, E.B.; validation, E.B. and F.S. (Felice Sfravara); formal analysis, F.C. and E.B.; investigation, F.C., F.S. (Felice Sfravara) and E.B.; resources, E.B.; data curation, E.B. and M.C.; writing—original draft preparation, E.B. and F.S. (Felice Sfravara); writing—review and editing, F.S. (Felice Sfravara); visualization, E.B., M.R. and F.S. (Fabio Salmeri); supervision, F.C.; project administration, F.C. All authors have read and agreed to the published version of the manuscript.

Funding

This research received no external funding.

Data Availability Statement

Data are available upon request.

Acknowledgments

This study was partially performed within the “Community monitoring, control and information system: towards a common maritime zone” project supported by the University of Messina in partnership with the University of Oslo and University of Gent. The authors gratefully acknowledge the support of the Vessel Traffic Management and Information System (VTMIS) of Messina (Italy) and, in particular, of C.F. Michele Landi for sharing and providing useful data and any other information necessary for the presented study.

Conflicts of Interest

The authors declare no conflicts of interest.

Abbreviations

The following abbreviations are used in this manuscript:
AIArtificial Intelligence
ANNArtificial Neural Network
AISAutomatic Identification System
CNNConvolutional Neural Network
COGCourse Over Ground
DSTDecision Support Tool
DLDeep Learning
FNFalse Negative
FPFalse Positive
HSCHigh-Speed Craft
IALAInternational Association of Lighthouse Authorities
IWRAPInternational Association of Lighthouse Authorities Waterways Risk Assessment Program
IMOInternational Maritime Organization
MLMachine Learning
MMSIMaritime Mobile Service Identities
NCNegative Class
PCPositive Class
RNNRecurrent Neural Network
SMIGLShip Movement Image Generation and Labelling
SOGSpeed Over Ground
TSSTraffic Separation Scheme
TNTrue Negative
TPTrue Positive
VTSVessel Traffic Service

References

  1. UNCTAD. Review of Maritime Transport 2022; UNCTAD: Geneva, Switzerland, 2022; ISBN 9789211130737. [Google Scholar]
  2. Rodrigue, J.-P. The Geography of Transport Systems, 5th ed.; Routledge: Oxfordshire, UK; New York, NY, USA, 2020; ISBN 9780429346323. [Google Scholar]
  3. Yu, J.Y.; Sghaier, M.O.; Grabowiecka, Z. Deep Learning Approaches for AIS Data Association in the Context of Maritime Domain Awareness. In Proceedings of the 2020 23rd International Conference on Information Fusion, FUSION 2020, Rustenburg, South Africa, 6–9 July 2020. [Google Scholar] [CrossRef]
  4. HUMAN ERROR AND MARITIME SAFETY. Available online: https://maredu.hcg.gr/modules/document/file.php/MAK265/Dissertations%20in%20English/Human%20Error%20And%20Maritime%20Safety.pdf (accessed on 1 October 2025).
  5. Macduff, T. The Probability of Vessel Collisions. Ocean Ind. 1974, 9, 144–148. [Google Scholar]
  6. Dominguez-Péry, C.; Tassabehji, R.; Corset, F.; Chreim, Z. A Holistic View of Maritime Navigation Accidents and Risk Indicators: Examining IMO Reports from 2011 to 2021. J. Shipp. Trade 2023, 8, 11. [Google Scholar] [CrossRef]
  7. Xiao, F.; Ma, Y. Artificial Forces for Virtual Autonomous Ships with Encountering Situations in Restricted Waters. Marit. Policy Manag. 2020, 47, 687–702. [Google Scholar] [CrossRef]
  8. Zhang, T.; Yin, J.; Wang, X.; Min, J. Prediction of Container Port Congestion Status and Its Impact on Ship’s Time in Port Based on AIS Data. Marit. Policy Manag. 2024, 51, 669–697. [Google Scholar] [CrossRef]
  9. Munim, Z.H.; Dushenko, M.; Jimenez, V.J.; Shakil, M.H.; Imset, M. Big Data and Artificial Intelligence in the Maritime Industry: A Bibliometric Review and Future Research Directions. Marit. Policy Manag. 2020, 47, 577–597. [Google Scholar] [CrossRef]
  10. Robards, M.; Silber, G.; Adams, J.; Arroyo, J.; Lorenzini, D.; Schwehr, K.; Amos, J. Conservation Science and Policy Applications of the Marine Vessel Automatic Identification System (AIS)—A Review. Bull. Mar. Sci. 2016, 92, 75–103. [Google Scholar] [CrossRef]
  11. Berking, B. Potential and Benefits of AIS to Ships and Maritime Administrations. WMU J. Marit. Aff. 2003, 2, 61–78. [Google Scholar] [CrossRef]
  12. Bhurtyal, S.; Bui, H.; Hernandez, S.; Eksioglu, S.; Asborno, M.; Mitchell, K.N.; Kress, M. Prediction of Waterborne Freight Activity with Automatic Identification System Using Machine Learning. Comput. Ind. Eng. 2025, 200, 110757. [Google Scholar] [CrossRef]
  13. Somalvico, M. L’Intelligenza Artificiale; Rusconi Editore: Milano, Italy, 1987. [Google Scholar]
  14. Obradović, I.; Miličević, M.; Žubrinić, K. Machine Learning Approaches to Maritime Anomaly Detection. Naše More Znan. Časopis Pomor. 2014, 61, 96–101. [Google Scholar]
  15. Knapp, S.; van de Velden, M. Exploration of Machine Learning Methods for Maritime Risk Predictions. Marit. Policy Manag. 2023, 51, 1443–1473. [Google Scholar] [CrossRef]
  16. Xu, S.; Hu, H. Development of a Maritime Safety Management Database Using Relational Database Approach. Int. J. Shipp. Transp. Logist. 2019, 11, 334. [Google Scholar] [CrossRef]
  17. Singh, S.K.; Heymann, F. Machine Learning-Assisted Anomaly Detection in Maritime Navigation Using AIS Data. In Proceedings of the 2020 IEEE/ION Position, Location and Navigation Symposium (PLANS), Portland, Oregon, 20–23 April 2020; IEEE: Piscataway, NJ, USA, 2020; pp. 832–838. [Google Scholar]
  18. Jia, H.; Prakash, V.; Smith, T. Estimating Vessel Payloads in Bulk Shipping Using AIS Data. Int. J. Shipp. Transp. Logist. 2019, 11, 25. [Google Scholar] [CrossRef]
  19. Vanneschi, L.; Castelli, M.; Re, A. Prediction of Ships’ Position by Analysing AIS Data: An Artificial Intelligence Approach. Int. J. Web Eng. Technol. 2017, 12, 253. [Google Scholar] [CrossRef]
  20. Smith, M.; Reece, S.; Roberts, S.; Rezek, I. Online Maritime Abnormality Detection Using Gaussian Processes and Extreme Value Theory. In Proceedings of the 2012 IEEE 12th International Conference on Data Mining, Brussels, Belgium, 10–13 December 2012; IEEE: Piscataway, NJ, USA, 2012; pp. 645–654. [Google Scholar]
  21. Ristic, B.; Scala, B.L.; Morelande, M.; Gordon, N. Statistical Analysis of Motion Patterns in AIS Data: Anomaly Detection and Motion Prediction. In Proceedings of the 2008 11th International Conference on Information Fusion, Cologne, Germany, 30 June–3 July 2008. [Google Scholar]
  22. Lane, R.O.; Nevell, D.A.; Hayward, S.D.; Beaney, T.W. Maritime Anomaly Detection and Threat Assessment. In Proceedings of the 2010 13th International Conference on Information Fusion, Edinburgh, UK, 26–29 July 2010; IEEE: Piscataway, NJ, USA, 2010; pp. 1–8. [Google Scholar]
  23. Özlem, Ş.; Altan, Y.C.; Otay, E.N.; Or, İ. Grounding Probability in Narrow Waterways. J. Navig. 2020, 73, 267–281. [Google Scholar] [CrossRef]
  24. Yan, R.; Wang, S. Study of Data-Driven Methods for Vessel Anomaly Detection Based on AIS Data. In Smart Transportation Systems 2019; Springer: Singapore, 2019; pp. 29–37. [Google Scholar]
  25. Ginoulhac, R.; Barbaresco, F.; Schneider, J.-Y.; Pannier, J.-M.; Savary, S. Coastal Radar Target Recognition Based On Kinematic Data (AIS) With Machine Learning. In Proceedings of the 2019 International Radar Conference (RADAR), Toulon, France, 23–27 September 2019; IEEE: Piscataway, NJ, USA, 2019; pp. 1–5. [Google Scholar]
  26. Zhang, C.; Bin, J.; Wang, W.; Peng, X.; Wang, R.; Halldearn, R.; Liu, Z. AIS Data Driven General Vessel Destination Prediction: A Random Forest Based Approach. Transp. Res. Part C Emerg. Technol. 2020, 118, 102729. [Google Scholar] [CrossRef]
  27. Zhang, M.; Kujala, P.; Hirdaris, S. A Machine Learning Method for the Evaluation of Ship Grounding Risk in Real Operational Conditions. Reliab. Eng. Syst. Saf. 2022, 226, 108697. [Google Scholar] [CrossRef]
  28. Tritsarolis, A.; Chondrodima, E.; Pelekis, N.; Theodoridis, Y. Vessel Collision Risk Assessment Using AIS Data: A Machine Learning Approach. In Proceedings of the 2022 23rd IEEE International Conference on Mobile Data Management (MDM), Paphos, Cyprus, 6–9 June 2022; IEEE: Piscataway, NJ, USA, 2022; pp. 425–430. [Google Scholar]
  29. Tritsarolis, A.; Kontoulis, Y.; Theodoridis, Y. The Piraeus AIS Dataset for Large-Scale Maritime Data Analytics. Data Brief 2022, 40, 107782. [Google Scholar] [CrossRef]
  30. Rawson, A.; Brito, M.; Sabeur, Z.; Tran-Thanh, L. A Machine Learning Approach for Monitoring Ship Safety in Extreme Weather Events. Saf. Sci. 2021, 141, 105336. [Google Scholar] [CrossRef]
  31. Xie, G.G.; Blauwkamp, D.; Nguyen, T.D. Toward a Deep Learning Approach to Behavior-Based AIS Traffic Anomaly Detection. In Proceedings of the Dynamic and Novel Advances in Machine Learning and Intelligent Cyber Security (DYNAMICS) Workshop 2018, San Juan, PR, USA, 3–4 December 2018. [Google Scholar] [CrossRef]
  32. Yang, C.-H.; Lin, G.-C.; Wu, C.-H.; Liu, Y.-H.; Wang, Y.-C.; Chen, K.-C. Deep Learning for Vessel Trajectory Prediction Using Clustered AIS Data. Mathematics 2022, 10, 2936. [Google Scholar] [CrossRef]
  33. Nguyen, D.; Vadaine, R.; Hajduch, G.; Garello, R.; Fablet, R. GeoTrackNet—A Maritime Anomaly Detector Using Probabilistic Neural Network Representation of AIS Tracks and A Contrario Detection. IEEE Trans. Intell. Transp. Syst. 2022, 23, 5655–5667. [Google Scholar] [CrossRef]
  34. Chen, X.; Liu, Y.; Achuthan, K.; Zhang, X. A Ship Movement Classification Based on Automatic Identification System (AIS) Data Using Convolutional Neural Network. Ocean Eng. 2020, 218, 108182. [Google Scholar] [CrossRef]
  35. Murray, B.; Perera, L.P. An AIS-Based Deep Learning Framework for Regional Ship Behavior Prediction. Reliab. Eng. Syst. Saf. 2021, 215, 107819. [Google Scholar] [CrossRef]
  36. de Vries, G.K.D.; van Someren, M. Machine Learning for Vessel Trajectories Using Compression, Alignments and Domain Knowledge. Expert Syst. Appl. 2012, 39, 13426–13439. [Google Scholar] [CrossRef]
  37. Dobrkovic, A.; Iacob, M.-E.; van Hillegersberg, J. Maritime Pattern Extraction and Route Reconstruction from Incomplete AIS Data. Int. J. Data Sci. Anal. 2018, 5, 111–136. [Google Scholar] [CrossRef]
  38. Zhang, M.; Conti, F.; Le Sourne, H.; Vassalos, D.; Kujala, P.; Lindroth, D.; Hirdaris, S. A Method for the Direct Assessment of Ship Collision Damage and Flooding Risk in Real Conditions. Ocean Eng. 2021, 237, 109605. [Google Scholar] [CrossRef]
  39. Rong, H.; Teixeira, A.P.; Guedes Soares, C. Ship Collision Avoidance Behaviour Recognition and Analysis Based on AIS Data. Ocean Eng. 2022, 245, 110479. [Google Scholar] [CrossRef]
  40. Durczak, W.; Filina-Dawidowicz, L. A Review of Vessel Traffic Services Systems Operating in Poland in Terms of Their Compliance with International Legislation. Appl. Sci. 2025, 15, 797. [Google Scholar] [CrossRef]
  41. Wan, C.; Yan, X.; Zhang, D.; Yang, Z. Analysis of Risk Factors Influencing the Safety of Maritime Container Supply Chains. Int. J. Shipp. Transp. Logist. 2019, 11, 476. [Google Scholar] [CrossRef]
  42. Kowalska, K.; Peel, L. Maritime Anomaly Detection Using Gaussian Process Active Learning. In Proceedings of the 2012 15th International Conference on Information Fusion, Singapore, 9–12 July 2012. [Google Scholar]
  43. Kraus, P.; Mohrdieck, C.; Schwenker, F. Ship Classification Based on Trajectory Data with Machine-Learning Methods. In Proceedings of the 2018 19th International Radar Symposium (IRS), Bonn, Germany, 20–22 June 2018; IEEE: Piscataway, NJ, USA, 2018; pp. 1–10. [Google Scholar]
  44. Mantecon, T.; Casals, D.; Navarro-Corcuera, J.J.; del-Blanco, C.R.; Jaureguizar, F. Deep Learning to Enhance Maritime Situation Awareness. In Proceedings of the 2019 20th International Radar Symposium (IRS), Ulm, Germany, 26–28 June 2019; IEEE: Piscataway, NJ, USA, 2019; pp. 1–8. [Google Scholar]
  45. Liang, Q.; Tvete, H.A.; Brinks, H.W. Prediction of Vessel Propulsion Power Using Machine Learning on AIS Data, Ship Performance Measurements and Weather Data. J. Phys. Conf. Ser. 2019, 1357, 012038. [Google Scholar] [CrossRef]
  46. Cucinotta, F.; Guglielmino, E.; Sfravara, F. Frequency of Ship Collisions in the Strait of Messina through Regulatory and Environmental Constraints Assessment. J. Navig. 2017, 70, 1002–1022. [Google Scholar] [CrossRef]
  47. Fuji, Y.; Yamanouchi, H.; Mizuki, N. Some Factors Affecting the Frequency of Accidents in Marine Traffic. J. Navig. 1974, 27, 239–247. [Google Scholar]
  48. Bokau, J.R.K.; Camliyurt, G.; Priadi, A.A.; Park, Y.; Kim, D. Enhancing Safety of Navigation: Redesigning Precautionary Areas into Roundabouts in Marine Traffic Separation Schemes. Appl. Sci. 2024, 14, 11588. [Google Scholar] [CrossRef]
  49. Cunningham, P.; Cord, M.; Delany, S.J. Supervised Learning. In Machine Learning Techniques for Multimedia; Springer: Berlin/Heidelberg, Germany, 2008; pp. 21–49. [Google Scholar]
Figure 1. Ports and harbors in the Strait of Messina.
Applsci 15 11674 g001
Figure 2. Traffic Separation Scheme–Strait of Messina.
Applsci 15 11674 g002
Figure 3. Limit of VTS system.
Applsci 15 11674 g003
Figure 4. Density of traffic in the Strait of Messina.
Applsci 15 11674 g004
Figure 5. Schematization of train and validation datasets.
Applsci 15 11674 g005
Figure 6. Typical structure of Decision tree.
Applsci 15 11674 g006
Figure 7. Decision boundaries.
Applsci 15 11674 g007
Figure 8. Minimum classification error plot.
Applsci 15 11674 g008
Figure 9. Decision tree with a maximum number of split limited.
Applsci 15 11674 g009
Figure 10. Minimum classification error plot for the training on the January balanced dataset.
Applsci 15 11674 g010
Figure 11. Confusion matrix from validation phase with 25% of January balanced dataset.
Applsci 15 11674 g011
Figure 12. Confusion matrix from test phase with dataset March balanced.
Applsci 15 11674 g012
Figure 13. Histogram of the number of Features used by the algorithm in each split.
Applsci 15 11674 g013
Figure 14. Feature importance histogram.
Applsci 15 11674 g014
Table 1. Comparison between AIS data information used in this work and others.
WorksPositionTimeRouteSpeedTypeSizeStatus
[20]XX
[21] X
[22]XXX X
[42]X XX
[25]XXXXX
[43]XXXX
[26]XX
[17]XXXX
[34]XXXX X
[35]XXXX
[44] XX
[45]XX X X
[36]XXXX
[37]X
This workX XXXXX
Table 2. Number of collisions in the Strait of Messina between the 1950s and 2000s.
YearEvent Number
1950s4
1960s11
1970s17
1980s7
1990s3
2000s2
Table 3. Available information contained in AIS data and their description (Resolution A.1106(29) 2015).
Type InformationData Type
StaticMMSI numberNumber [Integer]
StaticCall sign and nameText [Character]
StaticIMO Number Number [Integer]
Static Length and Beam Number [Float]
StaticType of Ship Categorical Number [Integer]
(in according to AIS Specifications)
Static Location of Electronic Position Fixing
System (EPFS) antenna
Number [Float]
DynamicShip position LatitudeNumber [Float]
DynamicShip position Longitude Number [Float]
DynamicPosition Time Stamp in UTCNumber [DateTime]
DynamicCourse over ground (COG)Number [Float]
DynamicSpeed over ground (SOG)Number [Float]
DynamicHeading Number [Integer]
DynamicNavigational StatusCategorical data [Integer]
(in according to AIS Specifications)
DynamicRate of turn (ROT)Number [Integer]
Voyage-relatedShip’s draught Number [Float]
Voyage-relatedHazardous CargoCategorical data [Integer]
(in according to AIS Specifications)
Voyage-relatedDestination and ETA (Estimated Time of Arrival)Text in both cases [Character]
Voyage-relatedRoute plan
Safety-relatedFree from short text messagesText [Character]
Table 4. Utilized dataset and number of AIS data contained.
DatasetNo. AIS Data
January1,786,822
January balanced3,573,644
Train (75% of January balanced)2,680,233
Validation (25% of January balanced)893,411
March1,875,403
Test ≡ March balanced3,750,806
Table 5. Main parameters for ML assessment (Validation).
TPFNFPTNAccuracyPrecisionSensitivitySpecificityF1-Score
444,98117252089444,61699.57%99.53%99.61%99.53%99.57%
Table 6. Main parameters for ML assessment (Test).
TPFNFPTNAccuracyPrecisionSensitivitySpecificityF1-Score
1,819,28756,11692,1521,783,25195.96%95.18%97.01%95.06%96.09%
Table 7. Cross validation results.
k-FoldNo. Instances
(Train–Validation)
TPFNFPTNACC
[%]
PRE
[%]
SEN
[%]
SPE
[%]
F1-Score
[%]
12,858,916–714,728355,89717731467355,59199.5599.5999.5099.5999.54
22,858,915–714,729355,93316851431355,68099.5699.6099.5399.6099.56
32,858,915–714,729355,82916071535355,75899.5699.5799.5599.5799.56
42,858,915–714,729356,00718801358355,48499.5599.6299.4799.6299.54
52,858,915–714,729356,04617461319355,61899.5799.6399.5199.6399.57
tot14,294,576–3,573,6441,779,712869171101,778,13199.5699.6099.5199.6099.55
Table 8. Features used and number of splits related to them at the top 20 tree splits.
FeatureType (X1)Lat (X2)Lon (X3)COG (X4)SOG (X5)Length (X6)Beam (X7)Draught (X8)
No. splits06903101
Disclaimer/Publisher’s Note: The statements, opinions and data contained in all publications are solely those of the individual author(s) and contributor(s) and not of MDPI and/or the editor(s). MDPI and/or the editor(s) disclaim responsibility for any injury to people or property resulting from any ideas, methods, instructions or products referred to in the content.