Abstract
More than 60% of earth excavation operations have been accomplished by various excavators. However, complex working loads always cause the fracture failure of excavator sticks because of insufficient strength. For prolonging the service life of excavator stick, a structural optimization design method based on the improved mayfly optimization algorithm (TTL-MA) is proposed to improve the stiffness of excavator stick. Firstly, by using the central composite design (CCD) method, 161 sets of simulation samples are obtained with eight selected structural design parameters of excavator stick. Then, relying on the simulation samples, an agent model between the excavator stick’s structural design parameters and the structural quality objectives, deformation, first-order minimum intrinsic frequency, and stress is constructed by using a Backpropagation neural network (BPNN). Finally, to further enhance the optimization search capability of the Mayfly Algorithm (MA), three improvement strategies were incorporated: Tent chaotic mapping for mayfly population initialization, adaptive t-distribution perturbation for velocity updating, and Lévy flight strategy for enhanced position updating. The results show that under the three constraints of the maximum equivalent von Mises stress σmax ≤ 150 MPa, maximum deformation δmax ≤ 2.5 mm, and the first-order minimum intrinsic frequency Hmin ≥ 55 Hz, the optimized excavator stick reduces the mass and maximum stress by 7.9% and 11.9%, respectively. The improved mayfly optimization algorithm has strong optimization ability for the optimization design of excavator stick structure, which can provide a reference for similar complex engineering machinery structure optimization problems.
1. Introduction
As large-scale complex mechanical systems, excavators play a crucial role in engineering construction. Currently, various types of excavators have been widely deployed across multiple domains, including industrial and civil construction, transportation infrastructure, water conservancy, power engineering, farmland rehabilitation, mining operations, and modern military engineering projects. Industry statistics demonstrate that excavators undertake approximately 60% of global earthmoving operations [1].
As the core execution part of the excavators, the structural performance of the excavator stick directly affects the operational reliability and operational stability of the whole machine. However, in the traditional excavator sticks design process, designers often need to carry out a variety of design assumptions and simplification processes, which leads to the following problems in the design results [2,3]: firstly, the structural safety margin is too high, resulting in the waste of materials and the increase in the weight of the whole machine; secondly, the form of the metal structure does not match with the actual torque distribution; and thirdly, it may lead to the safety accidents of the structural failure due to the insufficient structural strength or stiffness. Li Chenyu et al. conducted structural optimization of the loader working mechanism based on finite element technology and a topological methodology, achieving a 4.68% reduction in the mass of the optimized working device [4]. However, topological methodology often involves complex manufacturing processes and are therefore predominantly applicable during the conceptual design phase of products. The structural optimization of an excavator stick constitutes a multidimensional, multi-input-multi-output (MIMO) problem characterized by complex nonlinearity, multiple extrema, and non-convex feasible domains. Algorithmic optimization is essential to effectively address these complexities and enhance the comprehensive performance of the stick. Zhang Wei et al. [3] employed a sequential quadratic programming algorithm to optimize the working mechanism, achieving a 3.5% reduction in mass after optimization. Zhou Lei et al. [5] utilized an adaptive simulated annealing algorithm for the optimization of the working mechanism, resulting in a 6.73% decrease in mass. Zhang He et al. [6] proposed a structural optimization design method for the excavator working mechanism based on an adaptive surrogate model and genetic algorithm iterative optimization, which achieved a weight reduction of 9.38%. Although these algorithms can be employed to solve constrained problems, they still encounter challenges including low convergence accuracy, poor computational efficiency, and local optima when handling high-dimensional constrained problems. Inspired by the flight and mating behaviors of mayflies, the MA structurally integrates the advantages of the Particle Swarm Optimization Algorithm (PSO) [7], Genetic Algorithm (GA) [8], and Firefly Algorithm (FA) [9]. This novel swarm intelligence optimization algorithm was first proposed by Konstantinos Zervoudakis in 2020 [10]. The MA demonstrates superior convergence speed and accuracy, with notable advantages including strong generality and independence from precise mathematical modeling of optimization problems. Particularly, the mayfly optimization algorithm enhanced through multi-strategy fusion exhibits significantly improved comprehensive performance. Consequently, the improved MA has found extensive applications in diverse fields such as UAV path planning [11], climate change research [12], and early diabetes detection [13].
To achieve structural optimization of the stick and obtain the optimal combination of design parameters, this study proposes an improved MA-based optimization design method for excavator stick structures, using a specific excavator stick as a case study. First, eight design parameters of the excavator stick structure were selected and simulation samples were generated using the central composite design (CCD) method. Subsequently, a BPNN was established based on the simulation samples to construct the mapping relationship between the structural design parameters and structural performance characteristics. To enhance the MA, three key improvements were integrated: (1) Tent chaotic mapping for population initialization, (2) adaptive t-distribution perturbation for velocity updating, and (3) Lévy flight strategy for position updating refinement. These modifications were implemented to significantly improve the algorithm’s global optimization and search capabilities. Finally, by integrating the TTL-MA with the BPNN structural optimization agent model, iterative optimization was performed on the excavator stick with the objective of minimizing structural mass.
2. Mechanical Properties of Excavator Stick
The excavator working device is typically composed of the following components, which are articulated together: (1) bucket, (2) rocker, (3) link, (4) stick, (5) bucket cylinder, (6) boom, (7) stick cylinder, (8) boom cylinder, and (9) swing device, as shown in Figure 1. Among these, the stick (4) and the boom (6) are the primary load-bearing components. Their main function is to extend the digging radius of the bucket, enabling it to accomplish long-range excavation tasks. Moreover, since the structural performance of the stick directly influences the overall operational reliability and stability of the excavator, it is essential to investigate its mechanical properties.
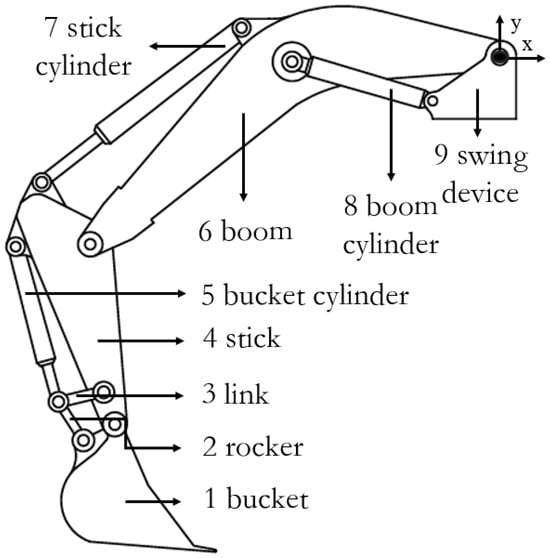
Figure 1.
Schematic of the excavator working device.
The excavator stick is a box structure welded from the upper and lower cover plates, the left- and right-side plates, and the ear plates. Additionally, the excavator stick contains auxiliary components including hydraulic cylinder pipelines, mounting brackets, lifting lugs, and fastening nuts. However, these ancillary structures have a relatively minor impact on the mechanical performance of the main boom structure and their arrangement is dispersed. Therefore, when establishing the finite element analysis model, the ancillary structures were simplified to improve computational efficiency and focus on the optimization of the main structure of the stick. Additionally, the stick is made of Q345 low alloy steel, with a yield strength of 345 MPa and a density of 7850 kg/m3. Material parameters are presented in Table 1.

Table 1.
Mechanical properties of Q345 low alloy steel.
The excavator stick was meshed using free tetrahedral elements. The maximum mesh size is 15 mm, with local refinement to a minimum mesh size of 3 mm. A total of 377,943 elements were generated, with element quality ranging from 0.23 to 0.99. The meshing results are presented in Table 2.
Table 2.
Mesh discretization results.
For the excavator stick, its spatial position at any given moment during operation is unique and determined. Therefore, hinge points A and B were fully constrained. The compound excavation working condition was selected for the analysis of the stick, which is the most hazardous condition in the excavation process [14,15]. Based on the compound working conditions, the force boundary conditions at the hinge points of the stick were applied, with FCx = 511 KN, FCy = 1405 KN, FDx = −132 KN, FDy = 279 KN, FEx = −694 KN, and FEy = −1602 KN. The calculation formulas for the forces at hinge points C, D, and E are referenced from [1]. The force results at each hinge point are presented in Table 3.
Table 3.
Force results at the hinge joints of the excavator stick.
The finite element simulation model of the excavator stick is shown in Figure 2.
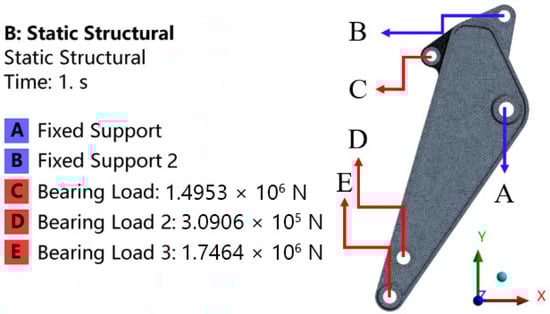
Figure 2.
Finite element simulation model of the excavator stick.
Based on Ansys Workbench 2022, a simulation analysis was conducted to evaluate the strength, stiffness, and modal characteristics of the excavator stick. As illustrated in Figure 3, under compound digging conditions, the stick exhibited a maximum equivalent von Mises stress of 163.34 MPa and a maximum deformation of 0.84 mm. The maximum equivalent von Mises stress was localized at the interface between the lug plate and upper cover plate of the excavator stick. The calculated structural safety factor of 2.15 exceeds the conventional allowable safety factor of 1.8~2 [16], thereby validating the structural integrity of the design. However, finite element analysis revealed relatively low stress distributions (0–18.15 MPa) in both the upper/lower cover plates and side plates of the stick structure. Specific regions exhibited minimal stress concentrations, corresponding to an exceptionally high safety factor of 19.01 in these low-stress zones. During operational excavation cycles, the frequency of the whole machine typically fluctuates within the range of 20 Hz to 35 Hz [17]. However, the first-order minimum frequency of the stick is 59.93 Hz, which is much higher than the frequency range of the whole machine. The results indicate that the current excavator stick structure is over-engineered with significant redundancy. There is considerable scope for structural optimization of the excavator stick, and it is necessary to conduct a lightweight design.
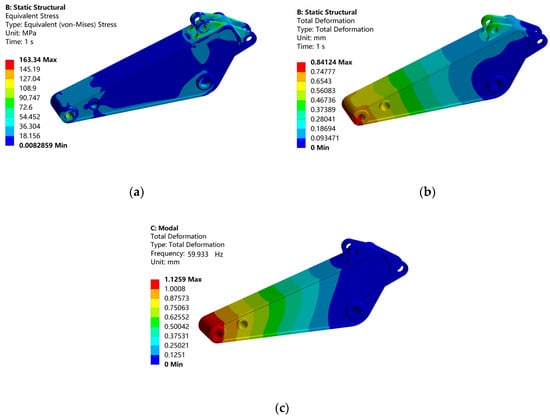
Figure 3.
Excavator stick simulation results. (a) Equivalent stress contour, (b) Deformable contour, (c) first-order minimum frequency contour.
3. BPNN Agent Model Construction
3.1. BPNN
The BPNN is a typical multi-layer feed-forward neural network that can fit complex nonlinear functions. It includes two processes: signal forward propagation and error back propagation [18]. In the training process, the weights and thresholds are first randomly initialized, and then the output is obtained by forward propagation. Finally, the error is calculated by comparing with the target value. If the error does not reach the preset minimum, the weights and thresholds are adjusted by back propagation to reduce the error. The constructed BPNN with a three-layer structure is shown in Figure 4, which has eight input layer nodes, five hidden layer nodes, and four output layer nodes.
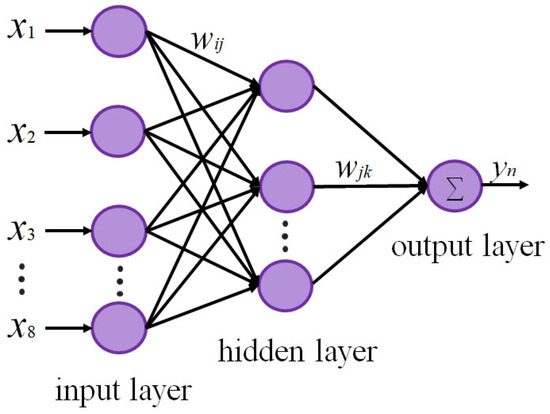
Figure 4.
BPNN structure.
The hidden layer could be expressed as
where Wij is the input layer weights; aj is the hidden layer threshold; and f1 is the hidden layer activation function, Tansig, expressed as
The output expression of the output layer is as follows:
where Wjk is the hidden t layer weights; bk is the output layer threshold; and f2 is the output layer activation function purelin, expressed as
Continuing the forward propagation, the error (loss function) Em between the target output and the actual output Yk is obtained with Equation (5):
If the error is out of bounds, back propagation is performed to correct the weights and bias of the neural network with Equations (6)–(9) [19]:
In the equation, , , , and represent the corrected weights and thresholds, respectively; denotes the learning rate of one for the BPNN.
3.2. Simulation Samples Construction
To construct a BPNN agent model, it is necessary to obtain a training sample dataset that adequately reflects the design characteristics. Central composite design (CCD) is a commonly used response surface methodology for experimental design, suitable for generating test sample points with multiple parameters and levels [20]. To achieve global optimization of the structural performance of the excavator’s boom, eight relatively important design parameters and their optimization ranges were identified [14,16,21,22]. The selection of design parameters is illustrated in Figure 5, and their values are presented in Table 4.
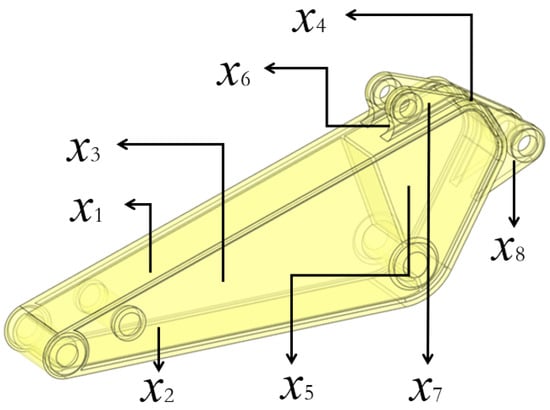
Figure 5.
Excavator stick design parameters selection.
Table 4.
Excavator stick design parameters range.
The CCD experimental design method was adopted to generate 161 sets of the sample, and finite element simulations were conducted under the same boundary conditions to create a dataset. The dataset was randomly divided into 141 sets for the training set and 20 sets for the test set, which were used for neural network training and validation. The results of the sample sets are presented in Table 5.
Table 5.
Results of multifactorial experimental design of excavator stick.
3.3. Verification of Surrogate Model Accuracy and Error Analysis
After the BPNN was trained on 141 sets of test sample datasets on the structural design parameters and structural performance (mass, deformation, first-order frequency, and stress) of the bucket bar, the mapping relationships between the structural design parameters and the structural performance were constructed in the inner layer of the neural network structure. In order to objectively evaluate the merits of the mapping performance of the neural network model, the neural network prediction results of the 20 sets of sample test sets were evaluated using the mean absolute percentage error (MAPE) and the goodness-of-fit R2.
The mean absolute percentage error (MAPE) reduces the effect of individual anomalies on the absolute error to a certain extent by normalizing the error at each point. A smaller MAPE indicates better model performance:
The goodness-of-fit R2 measures the ability of the model to explain the variability of the dependent variable. It represents the proportion of the squared correlation between the model’s predicted values and the actual observed values, with a range of [0, 1]. The closer the value of R2 is to one, the better the model fits the data:
where N is the total sample size; is the predicted value at group k; and is the actual value at group k.
The test-set prediction results are shown in Figure 6 and Table 6. The mass: R2 = 0.99 and MAPE = 0.15%; the deformation: R2 = 0.99, MAPE = 0.05%; the first-order frequency R2 = 0.99, MAPE = 0.08%; the stress R2 = 0.98, MAPE = 0.08%. The results show that the mapping accuracy of the BPNN agent model is high. The predicted results of the sample test set are all well fitted to the true values.
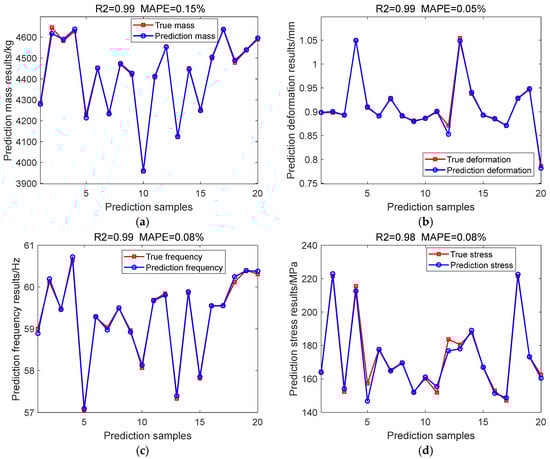
Figure 6.
Evaluation of test sets prediction results. (a) Prediction mass results (b) Prediction deformation results (c) Prediction frequency results (d) Prediction stress results.
Table 6.
Predicted performance results.
Furthermore, the BPNN demonstrates high computational efficiency in data prediction. The prediction of 20 datasets requires 0.0069 s in total, with an average time of 0.000343 s per dataset. In contrast, individual stiffness–strength simulations and modal simulations require 48.28 s and 91.25 s, respectively. These results are summarized in Table 7. Therefore, the trained neural network model can be embedded into the fitness function of the optimization algorithm to replace frequent finite element analysis (FEA) calls. Additionally, the network can establish structural constraints, thereby facilitating the iterative search for an optimal design using a minimum mass optimization strategy.
Table 7.
Predicted time results.
4. Improved Mayfly Optimization Algorithm
4.1. Mayfly Optimization Algorithm
Mayflies are small-bodied insects that inhabit aquatic environments. Adults often fly near the water surface and die shortly after completing aerial mating. The mayfly optimization algorithm (MA) consists of two heterosexual mayfly populations of males and females. Optimal offspring is obtained by mating the most heterosexual individuals. Similarly, a suboptimal offspring is obtained by mating the second most heterosexual individuals. The law of survival of the fittest leads to the gradual elimination of poorly adapted individuals. Let the individual flight positions in d-dimensional space be , the individual flight velocities be , and the mayfly flight direction be the result of the interaction between the individual and the group experience. Moreover, the mayfly’s flight direction results from the individual–collective interactions, with their flight trajectories dynamically adjusted toward both the personal historical best position (pbest) and the global historical best position (gbest).
For individual male mayflies, their spatial positions are influenced by the surrounding individuals and adjusted by combining their own flight experience with the following formula for updating their velocities and positions:
where represents the position of male mayfly i at iterations t; denotes the velocity of male mayfly i at iterations t + 1; and and are denoted as the position and velocity of male mayfly i in dimension j at the t-th iterations, respectively. and are the attraction coefficients of group movement; is the visibility factor; is the distance from the current mayfly to pbest; and is the distance from the current mayfly to gbest; where g denotes the inertia weight; and represents the dot product.
Among them, the optimal male mayfly individual’s velocity is updated with the following formula:
where d is the dance coefficient and r is a random number in [−1, 1].
Female mayflies are not naturally gregarious, but when sexually stimulated by males, they approach and copulate with them. The velocity and position of each female mayfly evolve based on the following equations:
where denotes the position of female mayfly i at the tth iterations; denotes the velocity of female mayfly i at the t + 1st iterations; and denote the position of female mayfly i in the j dimension at the tth iterations and the velocity, respectively; is the distance between the current opposite-sex mayfly i; fl denotes the number of random wanderings; denotes the fitness function; and are the attraction coefficients of group movement.
Mayflies mate under the rule of survival of the fittest. That is, the best male is paired with the best female, the second-best male is paired with the second-best female, and so on, crossing over to produce two offspring:
where male denotes paternal generation, female denotes maternal generation, and L is a random number in [−1, 1].
The design parameter ranges of the stick structure defined the search boundaries for mayfly individuals, with population positions and velocities initialized accordingly. Utilizing mayfly mating and offspring updating mechanisms, the algorithm converged to the minimum fitness value, producing both the optimal stick mass solution and its associated parameter combination. However, during the optimization process of the stick structure, the MA still encounters common challenges including slow convergence rate, insufficient search accuracy, and susceptibility to local optima. To enhance the optimization efficiency for excavator stick structures, an improved mayfly optimization algorithm incorporating hybrid strategies is proposed.
4.2. Population Initialization Based on Tent Chaotic Mapping
The MA seeks optimal solutions by simulating the flight and mating behaviors of mayflies, which implies that the initial distribution of mayfly positions and velocities is critically important. However, in conventional MA implementation, the population is typically initialized through random generation. This approach often results in an uneven population distribution across the search space, consequently compromising the algorithm’s search efficiency and convergence rate. The random population’s initialization can be mathematically expressed as
where xij is the initialized position of the randomly generated mayfly population; Rand(0,1) is the random distribution number; ub is the j dimensional upper boundary variable; and lb is the j dimensional lower boundary variable.
To address this limitation, Tent chaotic mapping is introduced to enhance the population initialization process in the MA. Leveraging its excellent ergodicity and randomness, the Tent chaotic map fosters population diversity and uniform distribution within the search space. This approach prevents initial clustering in local areas, reducing the risk of local optima entrapment. The improved diversity also facilitates escaping from local optima and accelerates convergence towards the global optimum, while enabling more precise exploitation of the solution region in later stages. Owing to these benefits, the Tent chaotic map is widely adopted for performance enhancement [23,24,25]. The mathematical formulation of the Tent chaotic map is given by:
where is the iteratively generated chaotic sequence; is the system parameter, which takes the value 0.499; and is the initial value of the system and is not equal to the system parameter .
The formula of MA population initialization position fused with Tent chaotic mapping is as follows:
where xij is the initialized position of the population generated after Tent chaotic mapping.
4.3. Velocity Update Based on Adaptive t-distribution Perturbation
The t-distribution, also known as Student’s t-distribution, is a classical standard statistical distribution. It has found extensive applications in enhancing the performance of optimization algorithms and is frequently employed to perturb position or velocity updates in algorithms [26,27]. During the MA optimization process, mayfly individuals tend to cluster around known high-quality solutions for local exploration, which frequently induces premature convergence to local optima. To enhance the MA’s global search capabilities, an adaptive t-distribution algorithm is incorporated into the velocity update formula to perturb mayfly movements. The probability density function of the adaptive t-distribution is formulated as [28]:
where n is the degrees-of-freedom factors that dynamically adjusts with iterations t; Γ( ) denotes the gamma function; and z represents a random variable.
The velocity update methods of mayfly, incorporating the adaptive t-distribution strategy are as follows:
where trnd() denotes an adaptive t-distributed random number with degrees-of-freedom factors to the iterations ; the implementation of trnd() depends on the distribution characteristics defined by P(z), ensuring the generated random numbers follow the t-distribution specified by P(z); Maxt represents the maximum iterations, while t indicates the current iterations.
For the MA, the t-distribution exhibits heavy-tailed characteristics similar to the Cauchy distribution during initial iterations, which effectively enhances the algorithm’s global exploration capability. As the iterations, t, increase, the t-distribution’s properties progressively transition between Cauchy and Gaussian distributions, enabling the MA to achieve an optimal balance between convergence rate and population diversity. When the iterations enter later stages with larger degrees-of-freedom factors, the t-distribution asymptotically approaches a standard Gaussian distribution. At this phase, the MA prioritizes local intensive searches, thereby ensuring solution precision and convergence stability.
4.4. Location Update Based on Lévy Flights
The Lévy flight is a distinctive random walk strategy characterized by long step lengths and long-distance jumps. Meanwhile, the selection of step lengths and directions also exhibit randomness. This enables it to randomly traverse to new positions far from the current point during the iteration process, thereby enhancing the exploration of the global space and helping the algorithm avoid becoming trapped in local optima. The Lévy flight formula [29] is as follows:
where is the default variable, taken as 1.5; Γ( ) is the gamma function; dim denotes the dimension; u and are random numbers sampled from the standard normal distribution; and Randn( ) is a random matrix generator for standard normally distributed variates.
In summary, to prevent the MA from becoming trapped in local optima during the optimization process, the Lévy distribution strategy coefficient is multiplied by the current global historical best position (gbest) at the t + 1 iterations. By leveraging the characteristics of long step lengths and long-distance jumps, this approach perturbs the mayfly to escape the current optimal position, thereby improving search efficiency. The position update expression for the male mayfly after incorporating the Lévy flight strategy is as follows:
where is the position of male mayfly, i, updated after the t + 1st iterations; is the speed of male mayfly i updated after the t + 1st iterations; Rand(0,1) is the random distribution function; t is the number of iterations; and Maxt is the maximum number of iterations.
4.5. Improved Mayfly Optimization Algorithm (TTL-MA) Iteration Flow
Based on the aforementioned improvements to the MA, the optimization workflow of the proposed enhanced algorithm, termed TTL-MA, is illustrated in Figure 7. The specific procedural steps are detailed as follows:
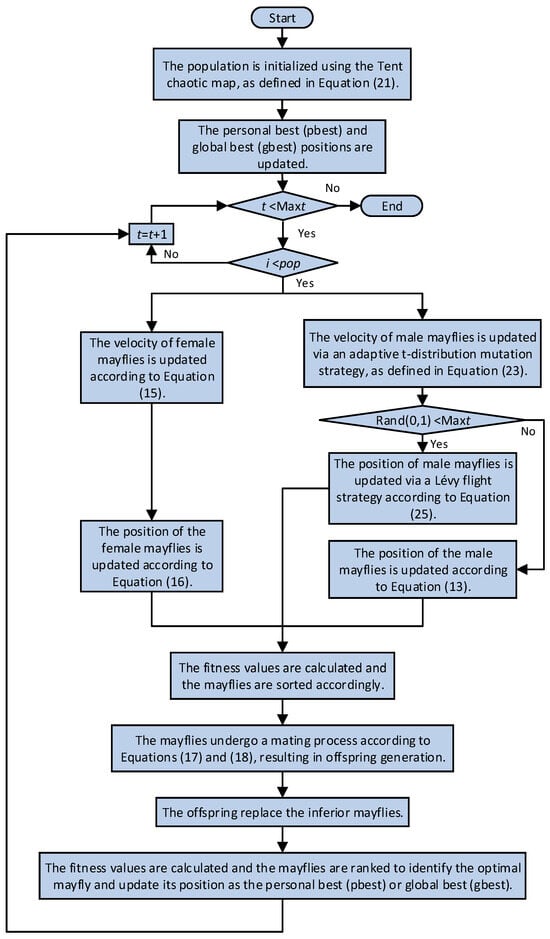
Figure 7.
The workflow of the TTL-MA.
Step 1: Initialize the mayfly population’s positions and velocities using the Tent chaotic mapping according to Equation (21).
Step 2: Calculate fitness values, rank them, and determine the individual historical best position (pbest) and global historical best position (gbest).
Step 3: Update the velocities of female mayflies based on the standard Equation (15), followed by updating their positions using Equation (16).
Step 4: Update the velocities of male mayflies via the adaptive t-distribution strategy in Equation (23). If condition is satisfied, trigger the Lévy flight strategy (Equation (25)) to update their positions; otherwise, apply the standard position update.
Step 5: Calculate fitness values, generate offspring mayflies through mating according to Equations (17) and (18).
Step 6: Randomly assign offspring to male and female groups, replacing the inferior mayflies.
Step 7: Calculate fitness values, recalculate fitness values and update pbest and gbest.
Step 8: If condition is satisfied, output the optimal mayfly’s position and fitness value; otherwise, repeat Steps 3–8.
4.6. Comparative Performance Analysis of an Improved Mayfly Optimization Algorithm
4.6.1. Algorithm Environment and Parameter Settings
To validate the performance of the improved mayfly optimization algorithm (TTL-MA), we conducted comparative analyses in MATLAB 2023b against the original Mayfly Algorithm (MA), Salp Swarm Algorithm (SSA), and Particle Swarm Optimization (PSO). For fair comparison, uniform experimental parameters were set as follows: population size (pop) = 50, dimension (dim) as specified by test functions, maximum iterations (t) = 300, with 30 independent trial runs. The primary parameter configuration for the algorithm is provided in Table 8. The simulation employed six CEC2005 benchmark functions: F1–F2, F5–F6, F8, F10 [29].
Table 8.
Parameter settings of the algorithm.
4.6.2. Comparative Analysis of Convergence Curve Performance
The comparative performance of optimization algorithms was evaluated through convergence curve analysis, quantifying both convergence rate and solution accuracy. Figure 8 presents the averaged convergence characteristics from 30 independent runs, demonstrating that the proposed TTL-MA consistently achieved significantly faster convergence and higher precision in optimal fitness value localization compared to the baseline MA, PSO, and SSA across all six test functions, thereby validating the algorithmic enhancements.
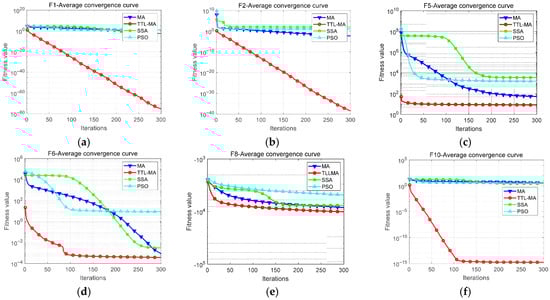
Figure 8.
Convergence curve comparison. (a) F1 Average convergence curve (b) F2 Average convergence curve (c) F5 Average convergence curve (d) F6 Average convergence curve (e) F8 Average convergence curve (f) F10 Average convergence curve.
4.6.3. Comparative Analysis of Convergence Accuracy
The convergence accuracy results are presented in Table 9, where “Best” denotes the optimal fitness value, “Worst” represents the poorest fitness value, “Mean” indicates the average fitness value, and “Std” stands for the standard deviation of fitness values. From the perspective of Best, the TTL-MA achieved the first rank in four test functions, while it ranked second and third only in functions F5 and F6, respectively, when compared to the other three algorithms. Regarding Worst (poorest fitness), Mean (average fitness), and Std (fitness standard deviation) metrics, the TTL-MA consistently secured the top position across all test functions. Overall, the TTL-MA achieved first place in 22 out of 24 evaluation criteria (six functions × four metrics). These results demonstrate that the enhanced TTL-MA possesses an excellent optimization search capability, confirming the effectiveness of the proposed improvements.
Table 9.
Algorithm convergence accuracy results.
5. Application of Improved Mayfly Optimization Algorithm in Stick Structure Optimization
After integrating the BPNN agent model into the fitness function of the TTL-MA, the agent model establishes the nonlinear relationship between stick design parameters and structural performance, thereby constructing structural constraints. The optimization workflow is illustrated in Figure 9.
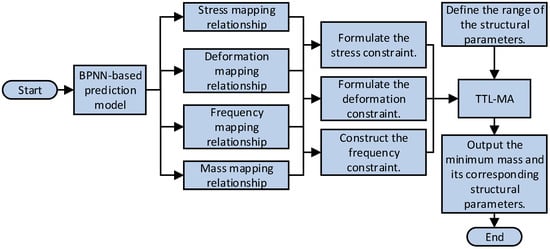
Figure 9.
Structural optimization workflow.
During the structural optimization design of the stick, three critical requirements must be satisfied: strength, stiffness, and first-order natural frequency compliance with design specifications. In terms of strength, the minimum requirement is that the maximum stress of the optimized stick should not exceed the material’s allowable stress (172.5 MPa). Given that the maximum equivalent stress of the original stick was 163.34 MPa, a constraint of σmax ≤ 150 MPa was imposed to ensure a sufficient safety margin while allowing reasonable flexibility for lightweight design. In terms of stiffness, lightweight design typically results in greater structural deformation. Given that the maximum deformation of the original stick was only 0.84 mm, substantial room for optimization remains. To provide greater flexibility for weight reduction, the maximum deformation was limited to δmax ≤ 2.5 mm. Regarding dynamic characteristics, since excavation operations are prone to induce mechanical vibrations, the first-order minimum frequency of the stick must be sufficiently separated from the main excitation frequency range of hydraulic excavators (20–35 Hz) to avoid resonance risks. The pre-optimization stick exhibited a first-order minimum frequency of 59.93 Hz, demonstrating satisfactory dynamic stability. To ensure the optimized structure effectively avoids the excitation frequency range while maintaining feasible weight reduction, the first-order minimum frequency was constrained to Hmin ≥ 55 Hz. Additionally, the design parameters are denoted as x1, x2,... x8. The mathematical model is presented below:
In summary, the TTL-MA was employed for the optimal design of the excavator stick structure. Under structural constraints, the TTL-MA demonstrates a broader search space than the conventional MA during early iterations, effectively preventing convergence to local optima. During later iterations, the TTL-MA exhibits faster convergence and higher precision in identifying the optimal parameter combination for stick structure design, yielding the minimal structural mass. Figure 10 presents the optimization iterations curve for the excavator stick’s structural optimization.
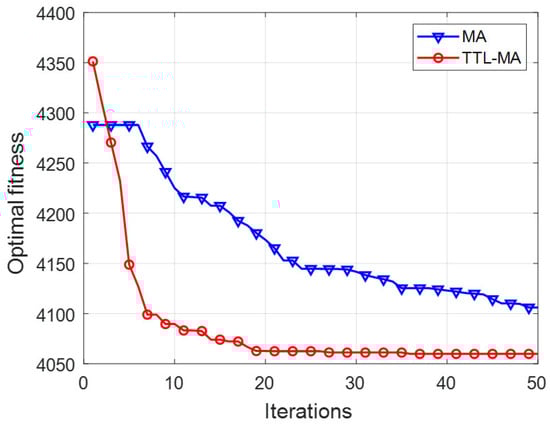
Figure 10.
Iterative results of excavator stick mass seeking design iterations.
The optimization results of the stick design parameters are presented in Table 10. The results demonstrate the following: the optimized stick mass is 4088.2 kg, representing a 7.9% reduction compared to the initial mass of 4440.2 kg and the maximum equivalent stress of the optimized stick is 143.9 MPa, showing an 11.9% decrease from the initial value of 163.34 MPa. Figure 11 illustrates the equivalent stress contour of the optimized stick structure. The discrepancy between the actual mass of the excavator stick (4088.2 kg) and the algorithm-optimized mass (4064.51 kg) is primarily attributed to minor errors in the structural mass agent model, combined with the rounding of the stick’s design parameters to integer values for mechanical manufacturability.
Table 10.
Optimal design parameters.
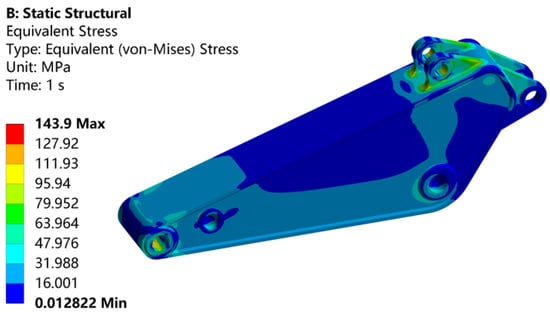
Figure 11.
Optimized excavator stick equivalent stress contour.
6. Conclusions
To achieve structural optimization of the excavator stick and obtain the optimal combination of design parameters, this study proposes an improved MA-based optimization method for an excavator stick’s structural design. The main conclusions are as follows:
(1) For the MA, three key enhancements were implemented: First, a Tent chaotic mapping mechanism was introduced during population initialization to improve population diversity and search space ergodicity. Second, an adaptive t-distribution was incorporated to perturb velocity updates, enhancing the global exploration capability in early iterations and the local exploitation ability in later stages. Finally, the Lévy flight mechanism was integrated to modify position updates, enabling long-distance jumps that significantly improve global space exploration and local optimum avoidance. The improved TTL-MA demonstrated superior performance. Overall, the TTL-MA achieved first place in 22 out of 24 evaluation criteria (six functions × four metrics). These improvements establish a robust algorithmic foundation for stick structure optimization.
(2) Structural optimization design of the excavator stick was conducted based on the TTL-MA and BPNN structural optimization prediction model. The optimized stick demonstrates a mass reduction to 4088.2 kg (7.9% decrease) and a maximum equivalent stress reduction to 143.9 MPa (11.9% decrease). These results validate the feasibility of the proposed performance optimization methodology and provide valuable references for analogous designs.
Author Contributions
J.T., H.Y., S.X., and S.Z.: conducted the numerical simulation and wrote the manuscript. T.Z.: assisted the data verification and analysis. G.H.: supervised the study. All authors reviewed the manuscript. All authors have read and agreed to the published version of the manuscript.
Funding
The current study is sponsored by the Open Foundation of the Key Laboratory of Intelligent Manufacturing of Construction Machinery, IMCM2023KF04; supported by the Scientific Research and Innovation Team Program of Sichuan University of Science & Engineering, SUSE652A004; and supported by The Innovation Fund of Postgraduate, Sichuan University of Science & Engineering, Y2024027.
Institutional Review Board Statement
Not applicable.
Informed Consent Statement
Not applicable.
Data Availability Statement
The data presented in this study are available on request from the corresponding author.
Conflicts of Interest
The authors declare no conflicts of interest.
References
- Ma, Z. Research on Fatigue Life of Single Bucket Hydraulic Excavator Working Device. Master’s Thesis, Taiyuan University of Science and Technology, Taiyuan, China, 2017. [Google Scholar]
- Qin, Z.; Mo, X.; Wu, Y. Finite Element Analysis and Structure Optimization of Hydraulic Excavator Working Device Based on ANSYS Workbench. Coal Mine Mach. 2024, 43, 120–123. [Google Scholar]
- Zhang, W.; Song, X.; Shi, M.; Huo, J. The Lightweight Design of the Boom of Mechanical Excavator Based on Surrogate Model Technology. Mach. Des. Manuf. 2019, 4, 1–4. [Google Scholar]
- Li, C. Lightweight Design of Working Device for Loader. Master’s Thesis, Chang’an University, Xi’an, China, 2018. [Google Scholar]
- Zhou, L.; Wang, Q. Lightweight Design of Working Device of a Medium Hydraulic Excavator. Constr. Mach. Equip. 2022, 12, 96–100. [Google Scholar]
- Zhang, H.; Ge, X.; Li, Y.; Shao, X. Lightweight design of hydraulic excavator based on adaptive approximation mode. Comput. Integr. Manuf. Syst. 2023, 29, 4051–4062. [Google Scholar]
- Jain, M.; Saihjpal, V.; Singh, N.; Singh, S.B. An overview of variants and advancements of PSO algorithm. Appl. Sci. 2022, 12, 8392. [Google Scholar] [CrossRef]
- Kumar, M.; Husian, M.; Upreti, N.; Gupta, D. Genetic algorithm: Review and application. Int. J. Inf. Technol. Knowl. Manag. 2010, 2, 451–454. [Google Scholar] [CrossRef]
- Nekouie, N.; Yaghoobi, M. A new method in multimodal optimization based on firefly algorithm. Artif. Intell. Rev. 2016, 46, 267–287. [Google Scholar] [CrossRef]
- Zervoudakis, K.; Tsafarakis, S. A mayfly optimization algorithm. Comput. Ind. Eng. 2020, 145, 106559. [Google Scholar] [CrossRef]
- Wang, X.; Pan, J.-S.; Yang, Q.; Kong, L.; Snášel, V.; Chu, S.-C. Modified mayfly algorithm for UAV path planning. Drones 2022, 6, 134. [Google Scholar] [CrossRef]
- Amudha, M.; Ramachandran, M.; Sivaji, C.; Gayathri, R. A Study on Climate Change with Mayfly Algorithm Optimization. Recent Trends Manag. Commer. 2022, 2, 23–28. [Google Scholar]
- Patil, R.; Tamane, S.; Adhar, S. A modified mayfly-SVM approach for early detection of type 2 diabetes mellitus. Int. J. Electr. Comput. Eng. 2022, 12, 524–533. [Google Scholar] [CrossRef]
- Wang, Z.; Wang, Z.; Zhang, S. Structural optimization design of hydraulic excavator arm. Chin. J. Constr. Mach. 2022, 20, 75–80. [Google Scholar]
- Liu, G. Structural Analysis and Optimal Design of the Work Unit of a Large Hydraulic Excavator. Master’s Thesis, China University of Mining and Technology, Xuzhou, China, 2023. [Google Scholar]
- Chen, X.; Liu, Q.; Zhang, M. Multi-objective Optimization Design and Verification of Boom of Medium Hydraulic Excavator. Constr. Mach. Equip. 2024, 4, 127–130. [Google Scholar]
- Zheng, X.; Chen, Y.; Chen, Y.; Cong, S.; Ding, W. Performance Analysis and Topology Optimization for Hydraulic Excavator Working Device. J. Binzhou Univ. 2019, 35, 82–85. [Google Scholar]
- Chen, G.; Luo, Y.; Huang, B.; Liu, C.; Xiong, Z. Uncalibrated Visual Servo Based on BP Neural Network and Fuzzy Control for Robotic Application. Sci. Technol. Eng. 2023, 23, 11282–11291. [Google Scholar]
- Qiu, G.; Yin, L.; Liu, C.; Mei, P.; Wen, H. Meteorological visibility prediction based on GA-PSO-BP neural network. Sci. Technol. Eng. 2024, 24, 6164–6171. [Google Scholar]
- Li, Y.; Hou, Z. Multi-step compound optimization design of vertical machining center gantry frame. Mod. Manuf. Eng. 2024, 11, 108–114, 123. [Google Scholar]
- Liu, X.; Wan, Y.; Zhou, Y.; Liang, Y.; Jia, J. Finite Element Analysis on Boom Structure of Large Excavator Working Device. Mech. Res. Appl. 2022, 35, 15–17. [Google Scholar] [CrossRef]
- Xiang, Q.; Zhang, H.; Hu, X.; Chen, W. Research Method for Lightweight Design on Arm of Hydraulic Excavator Based on ANSYS and Neural Network. Mach. Tool Hydraul. 2015, 43, 136–140. [Google Scholar]
- Yan, A.; Yu, X. Parameter Optimization of a Stochastic Configuration Network Based on the Chaotic Feedback Sooty Tern Optimization Algorithm. J. Beijing Univ. Technol. 2023, 49, 746–757. [Google Scholar]
- Jiang, F.; Han, X.; Yue, P.; Chen, Y. Dragonfly algorithm based on chaotic mapping and mixed mutation. J. Heilongjiang Univ. Sci. Technol. 2025, 35, 103–109. [Google Scholar]
- Cheng, Y.; Li, S. Snake optimization algorithm based on chaotic reverse and Lévy flight. Comput. Eng. Des. 2024, 45, 2658–2668. [Google Scholar]
- Chang, Y.; Wang, Y. Virtual machine scheduling optimization method based on improved bald eagle search algorithm. Comput. Eng. Des. 2024, 45, 3631–3638. [Google Scholar]
- Fu, B.; Kang, Y.; Li, C.; Deng, J.; Zhao, X. Optimal scheduling of wind-energy storage integrated power system based on t-distributed weed algorithm. Eng. J. Wuhan Univ. 2024, 57, 1505–1512. [Google Scholar]
- Zhang, L.; Jia, H.; Zhang, S.; Zhao, M.; Zhao, N.; Huang, W. Research on Squirrel Optimization Algorithm Integrating Adaptive t Distribution and iterationsom Walk Strategy. Comput. Digit. Eng. 2024, 52, 2343–2347, 2410. [Google Scholar]
- Chen, K.; Wei, S. Intelligent Optimization Algorithm and MATLAB Programming Practice; Tsinghua University Press: Beijing, China, 2023. [Google Scholar]


Disclaimer/Publisher’s Note: The statements, opinions and data contained in all publications are solely those of the individual author(s) and contributor(s) and not of MDPI and/or the editor(s). MDPI and/or the editor(s) disclaim responsibility for any injury to people or property resulting from any ideas, methods, instructions or products referred to in the content. |
© 2025 by the authors. Licensee MDPI, Basel, Switzerland. This article is an open access article distributed under the terms and conditions of the Creative Commons Attribution (CC BY) license (https://creativecommons.org/licenses/by/4.0/).