Abstract
This article investigates the use of visual cues, such as colour coding, to enhance educational materials and optimise students’ learning. The aim of the study was to examine how colour coding (CC) of selected components of a task influenced students’ cognitive engagement (CE) when solving algorithmic problems. We present experimental results from studies using eye-tracking techniques, which provide fine-grained behavioural indicators serving as proxy insights into learners’ cognitive processes. The findings reveal that the distribution of visual attention—measured through fixation time percentage, fixation count in areas of interest (AOIs), and the sequence in which task components were viewed—differed significantly between colour-coded and black-and-white task formats. Furthermore, analysis of two key eye-tracking indicators—fixation duration total (FDT) and average fixation duration (FDA)—suggests an increased level of cognitive engagement in students who had difficulty understanding the presented concepts while solving the colour-coded tasks. These results indicate that colour coding may help sustain students’ attention and engagement, especially when they face challenges in interpreting educational materials or engaging in complex problem-solving tasks.
1. Introduction
This study examines whether colour-based signalling in algorithmic tasks guides visual attention and relates to cognitive engagement during problem solving. We combine a controlled task design with eye tracking to characterise process-level indicators of attention allocation and effort.
1.1. Visual Guidelines in Instructional Design
The development of multimedia and modern digital technologies has led to the widespread enhancement of text-based communication—once dominant in human interaction—with visual and graphic forms of presenting information. Visual elements are also present in educational resources in many different forms. Therefore, one of the important issues in effective instructional design is the search for appropriate methods of visual communication in the learning process.
The learning environment should be designed with the natural mechanisms of information selection in mind, directing attention to key elements and minimising search-related effort. According to the cognitive theory of multimedia learning, the cognitive load of the didactic materials can be reduced due to the integration of two information channels, which are visual and verbal [1], and to two forms of visual information: text and graphics [2]. However, it should be noted that improperly presenting data simultaneously in both visual and text-based forms can impose excessive cognitive load on the visual information processing channel [3].
Typographic choices (e.g., font, boldface, colour) are a common form of signalling in instructional design. Early investigations confirm that educational text-based materials, featuring graphics or animations in which additional guidelines are provided, help convey the content of the issue presented [4,5]. Cues, which should be designed according to the signalling principle, show which elements of the description are important to the learner, facilitating the process of searching for specific information and making decisions [5].
Colour is considered a key factor when designing educational materials. This element structures information in an effective way and thus decreases the effort connected to searching for essential information, which has an impact on the speed and sequence of its reading [6,7,8].
Recent studies highlight that colour coding, as a form of signalling, significantly enhances visual search efficiency and learning outcomes, facilitates information integration, and reduces cognitive load, particularly in multimedia and digital learning environments [9,10,11,12].
1.2. Cognitive Engagement and Eye Tracking
In relation to the learning process, engagement is defined as investing resources and efforts of students (learners) in understanding and remembering the educational material processed and consists of three key components: behavioural, cognitive, and emotional engagement [13,14,15]. Cognitive engagement denotes the level of mental investment in learning, which is indicated by willingness to exert effort to understand complex ideas and master difficult tasks [14,15,16]. According to [17], eye movements, as overt (physical) activity, represent the behavioural expression of students’ cognitive engagement during learning. However, it should be noted that, although eye movements provide observable correlates of cognitive engagement, they do not constitute a direct measure of latent cognitive states. Also, according to [18], “the definition of engagement as the quantity and quality of mental resources directed at an object of thought strongly implies that eye tracking is primarily a measurement of the cognitive component of engagement.”
The most essential eye-tracking indicators based on which conclusions regarding cognitive processes are drawn are fixations and saccades. A fixation is defined as a period during which the eye remains relatively stable with the aim of focussing (fixing) the gaze on a given object of interest [19]. Many studies analyse the duration and the number of fixations, which are considered to be indicators of one’s cognitive effort. It is acknowledged that longer periods of fixation suggest greater difficulty in the processing of the information being absorbed, meaning a greater level of cognitive engagement [20,21]. Numerous fixations on an area imply a greater interest in this object [22].
In turn, an analysis of the saccade movement (step shift between the points where the fixations occur) enables researchers to track the decision-making processes [23].
Beyond fixations and saccades, pupillometry and microsaccade analysis have emerged as sensitive indicators of cognitive load and attentional shifts, providing deeper insights into learners’ mental effort [24,25].
Grounded in signalling theory and cognitive load perspectives, we conceptualise colour coding as a design cue that guides overt attention towards task-relevant correspondences, thereby reducing extraneous visual search and supporting integration across components [4,5,7,26,27,28], while keeping cognitive load within manageable limits [1,16]. In algorithmic flowchart problems, colour links can prioritise diagnostic elements and stabilise attentional transitions between them, which is observable as shifts in fixation-time percentages, fixation counts, and AOI-entry sequences [9,10,11,12,29,30,31]. Under this account, gaze metrics are behavioural proxies of processing focus and effort; longer total fixation duration among students reporting incomprehension is interpreted as attentional persistence rather than direct access to latent cognitive states [13,14,15,16,17,18]. The framework also implies boundary conditions: benefits should be most likely when search demands are high and prior knowledge is low, and may attenuate when materials already afford efficient search or when cue salience misguides attention [26,31].
Our contribution is threefold. First, we examine colour-coded materials in the domain of adolescent algorithmic problem solving, extending signalling results beyond typical text–diagram contexts [4,5,7,26,29,30,31]. Second, alongside standard time- and count-based eye-tracking indices, we analyse AOI-entry sequences to characterise the ordering of attentional selection during task processing [9,10,11,12,29,30,31]. Third, we explore format differences conditional on self-reported comprehension as an exploratory grouping that informs potential boundary conditions rather than asserting a definitive moderator [13,14,15,16,17,18]. The spatial layout of materials was kept constant across conditions, varying only colour/bold cues to isolate the signalling component [27,28].
1.3. Related Work
In contrast to prior colour-coding studies focusing on text–diagram integration and animations, we target algorithmic flowchart problems with adolescents and include an analysis of AOI-entry sequences to capture attentional ordering [4,5,7,26,29,30,31].
The eye-tracking technique has been used in research on cognitive processes in educational contexts for several years [32,33]. This method has also been widely used in research on multimedia learning. According to [26], the effects of multimedia learning principles have been the most frequently studied by researchers. With regard to the signalling principle, it has been found to positively influence students’ attention. In particular, some studies have shown that including cues such as colour coding and labelling is crucial, as such signalling enhances students’ visual search efficiency and improves their learning performance [26].
In one of the first studies in this area using eye tracking, researchers investigated differences in the learning process when students’ attention was directed using arrows and changes in the colour intensity of key problem information. Manipulating colour directed the attention of the learners more effectively to the most important elements of the animation, and in this case, the study group achieved a higher level of understanding of the content [29].
The results of an experiment conducted by [30] confirmed the effectiveness of the same colour codes in the basic components of the text and graphics. This procedure helped to integrate the appropriate information in the text and the illustrations, which resulted in a better level of understanding and recall of the material.
Studies also suggest that instructional strategies—including colour coding—can support the learning process and enhance its effectiveness [31], especially in the case of students with a lower level of knowledge or skills. It needs to be stressed at the same time that even though research proves that our visual attention is affected by the way the encountered stimuli (learning content) are presented [34,35], the relationship between the process of information processing and learning effectiveness is not that clear. For example, in a study conducted by [36], it was found that attention cueing yielded similar performance and helped reduce the learners’ mental effort but did not optimise conceptual understanding of content.
Recent research findings also indicate that it is important to consider the complexity of the relationship between the use of colour coding, learning effectiveness, and cognitive load. For example, findings from [10] show that colour-based design resulted in better learning outcomes, smaller pupil diameters, and shorter fixation durations, which indicated lower cognitive load. A study by [37], which examined the impact of colour cues in video lectures on learning effectiveness, found that appropriate use of colour improved retention and transfer test scores, while the absence or overuse of colour increased cognitive load. Conversely, the study by [38] suggests that colour coding can support learning, but its effectiveness depends on the context of use. Specifically, the use of colour in test tasks that did not include colour during the learning phase led to the poorest results in both retention and transfer tests.
As shown by the analysis above, the eye-tracking technique has been frequently used in research on the effectiveness of directing attention with visual cues, including colour-coding, in experiments focusing primarily on cognitive load and learning outcomes.
In the case of cognitive engagement (CE), most early research relied exclusively on self-report methods [39]. Although these methods are useful, they have limitations, as discussed in more detail by [39] and are therefore increasingly being complemented by objective and technological measurement methods (multimodal approaches), which include eye tracking. As noted in the review paper by [40], eye tracking is a non-invasive method that yields rich behavioural data, especially when monitoring indicators such as fixation times, pupil size, gaze trajectories, or areas of interest (AOI). Eye tracking thus represents a valuable and comprehensive tool in a multimodal approach to studying cognitive engagement.
Beyond K–12 algorithmic tasks, digitally mediated platforms—including educational robotics—are used to cultivate problem-solving strategies and industry-aligned competencies in engineering programmes [41]. Task-based problem solving in digitally enriched settings is commonly framed within social-constructivist and enquiry-based pedagogies, which emphasise knowledge construction through guided exploration and collaboration [42,43]. In this vein, our task design leverages external visual cues (colour-based signalling) as scaffolds that guide exploration during problem solving; we do not draw conclusions about learning outcomes beyond process-level inferences.
With this in mind, the present study is based on the assumption that eye movement data can serve as a behavioural indicator and a proxy for investigating cognitive engagement (CE) during learning and problem solving. Furthermore, empirical investigations into the relationship between colour coding and cognitive engagement, particularly those employing eye tracking, remain relatively scarce.
2. Methods
This section describes the participants, materials, and eye-tracking apparatus; details the task and procedure; defines the areas of interest (AOIs) and dependent measures; and outlines the statistical approach used to address RQ1–RQ4. Wherever applicable, we report acquisition parameters, fixation-detection settings, calibration quality, and data-exclusion criteria to ensure transparency.
2.1. Research Questions and Hypotheses
The aim of the study is to determine whether the use of guidelines by colour coding some parts of the content of the task to direct the attention of students to factually significant and interrelated elements affects (1) the subjects’ visual attention distribution (VAD) and (2) the level of cognitive engagement (CE) while solving a problem in two versions: colour-coded (CC) and conventional, black-and-white (BW).
The values of particular eye-tracking parameters have been selected as indicators of both VAD and CE. In the present analysis, particular attention is paid to eye-tracking data related to visual attention allocation in areas of interest (AOIs), which serve as visual cues for students. It is also important to investigate whether there are any interactions between CC and engagement in the task solving process among students who had trouble understanding the presented concepts.
The current study aimed to answer four research questions:
(RQ1): Are there differences in the sequence of analysing the AOIs in the CC task versus the BW task?
(RQ2): Are there differences in the subjects’ visual attention distribution ((a) fixation time (FT) and (b) fixation count (FC)) in the AOIs depending on the task format (CC task versus BW task)?
(RQ3): Are there differences in the number of return saccades to key AOIs while solving the CC task and the BW task?
(RQ4): Do the CEs differ between the groups of participants who understood the content of the task and those who admitted that they did not understand the content of the task during solving the CC task versus the BW task?
To address the research questions, we hypothesised the following:
H1:
Colour acts as an attractor so the sequence of analysing particular areas will be different in the colour-coded (CC) and the black-and-white (BW) task formats.
H2a:
The fixation time (FT) distribution across AOIs will be different in each of the two task formats, and in particular, the FT for answer areas (AOI_ANA and AOI_ANB) will be shorter while analysing the CC task format.
H2b:
The fixation count (FC) distribution across AOIs will be different in each of the two task formats; the population of the colour-coded group will perform a lower number of fixations particularly in answer areas (AOI_ANA and AOI_ANB).
H3:
In the case of the CC task format, subjects will return less often to answer areas (AOI_ANA and AOI_ANB) and to the conditional blocks (AOI_CBa and AOI_CBb) corresponding to them.
H4:
We predict that an increased CE will be observed in the case of the BW task, regardless of whether the participants have understood the concept of the task.
2.2. Participants
Fifty-two third-grade junior high school students, including 25 girls and 27 boys who were 16 years old, participated in the experiment. Measurement data from seven participants were excluded due to technical issues, specifically a tracking ratio below 90% or a calibration deviation exceeding 1.0°, leaving forty-five (45) subjects for further analysis. A between-subjects design was employed to avoid carry-over or practice effects. Twenty-two (22) students were randomly assigned to the colour-coded version of the task (CC group), and twenty-three (23) to the black-and-white version (BW group).
The eyesight of all the subjects was normal or corrected to normal. All the students had previously worked on solving algorithmic problems in school, which was confirmed by a diagnostic survey conducted before the examination.
2.3. Research Materials
The algorithmic task solved by the participants is shown in Figure 1. The task was designed in such a way that its content corresponded to the junior high school syllabus.
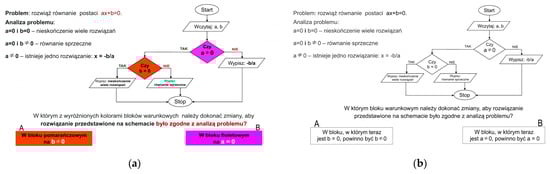
Figure 1.
Research tasks: (a) colour-coded format; (b) black-and-white format.
Two versions of the task were prepared to manipulate format: the CC version implemented colour-based signalling (colour and boldface) as guidelines, whereas the BW version was presented without these guidelines (i.e., the black-and-white version), with all other layout aspects kept identical across the two formats. The task required a presentation of the solution of a linear equation in the ax + b = 0 form with the flowchart. The instructions included an analysis of the problem. The solution required verification of the correctness of the conditions written in the indicated blocks. The students selected one of two answers. The pieces of information corresponding with one another were included in the answer blocks, and in the flowchart, they were indicated with the same colour (see Figure 1).
The visual scenes used in the tasks were static but followed the signalling principle recommended in the design of animations and other multimedia materials [27,28]. These guidelines were intended to direct participants’ cognitive processes, not provide them with new information [4].
2.4. Procedure
Each participant completed the test individually. During the examination, all students were tested under similar ambient conditions, including consistent room temperature and minimal background noise. The eye-tracking experiment began with the introductory instruction, followed by calibration and other activities to ensure correct performance of the measurements. During the test, the tasks—completed without paper—were presented on successive slides, and participants’ oculomotor activity was recorded throughout the process. The task-solving time was not limited; each student worked at their own pace. Students submitted their responses via mouse click and reported them verbally. Before the experiment, students received instructions from the research team. After completing the task, they discussed the procedure with the researchers during a short debriefing. Furthermore, before the experiment, the students completed the survey questionnaire, where they evaluated their level of interest in information technology as a school subject. In the final survey, students were also asked whether they understood each task or selected their answers randomly.
2.5. Eye-Tracking Apparatus
An eye tracker from SensoMotoric Instruments, Teltow, Germany (iViewX™ Hi-Rate 500/1250), recording data at a temporal resolution of 500 Hz, was used in the investigation (see Figure 2). The system included a head-stabilizing interface that minimized head movement without restricting the participant’s field of vision. Stimuli were presented on a 23-inch LCD monitor with a full HD resolution of 1920 × 1080 pixels. Before each test, a 9-point calibration with validation was performed. Environmental conditions were kept consistent across all participants. The experiment was conducted using the SMI Experiment Suite™ 360 software. The experimental design was created in SMI Experiment Center™ 3.4, data recording was carried out with SMI iView X™, and results were processed using SMI BeGaze™ 2.4.
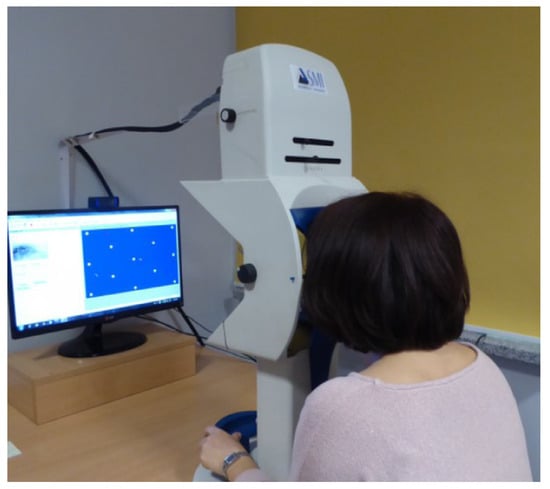
Figure 2.
Eye-tracking apparatus.
2.6. Experiment Design
The independent variables were as follows: (1) task format (colour-coded vs. black-and-white), with participants randomly assigned to one of the two versions; (2) answer comprehension, based on students’ declarations in the post-experiment survey regarding whether they understood the task or selected their answer at random; (3) area of interest (AOI), a within-subjects factor with six levels corresponding to colour-coded task components.
The main dependent variables were cognitive engagement (CE) and manner of task solving, operationalised through visual attention distribution (VAD). Both were measured using eye movement characteristics. To measure cognitive engagement (CE), we analysed two metrics: Fixation Duration Total (FDT, ms)—the total duration of all fixations within a trial; Fixation Duration Average (FDA, ms)—the total duration of all fixations divided by the number of fixations in a trial. We selected FDT to index sustained attentional persistence across the trial and FDA to reflect per-fixation processing time. Prior work links longer fixations to increased processing difficulty/effort in reading and scene viewing [20,21]; see also [18,19]. Accordingly, we treat FDT and FDA as process-level behavioural proxies of processing effort.
Information on participants’ visual activity within the AOIs was obtained using SMI BeGaze™ 2.4 software. The areas corresponding only to the elements that had been colour-coded were analysed and interpreted: AOI_FLQ—formula describing a linear equation; AOI_CBa—conditional block for coefficient a; AOI_CBb—conditional block for coefficient b; AOI_IFT—singled-out text of the instruction for the task; AOI_ANA and AOI_ANB—answer areas.
The following AOIs’ eye-tracking parameters were used to analyse VAD: fixation time (FT) (%)—the sum of the fixation times (ms) on the AOI divided by the total time of a trial; a sequence (SQ)—an order of gaze hits into the AOIs based on the entry time (ms)–time to first fixation into the AOI; fixation count (FC)–the number of fixations inside the AOI; glance count (GC)–the number of glances towards the AOI if saccades came from outside.
To address the research questions RQ1—RQ3, a two-factor analysis of variance (ANOVA) was conducted with one within-subject independent variable (six areas: AOI_FLQ vs. AOI_CBa vs. AOI_CBb vs. AOI_IFT vs. AOI_ANA vs. AOI_ANB) and one between-subjects variable (two task formats: colour-coded vs. black-and-white).
To address the research question RQ4, the collected data were analysed using a model with two between-subjects factors: experimental condition (two task formats: colour-coded vs. black-and-white) and task comprehension (two levels: comprehension vs. incomprehension).
3. Results
Results are organised by research question. We first examine entry-order sequences across AOIs (RQ1), followed by attention-distribution metrics—fixation time percentage and fixation count (RQ2)—then glance counts (RQ3), and finally fixation-duration indices (FDT, FDA) in relation to self-reported comprehension (RQ4). For each research question, we report the planned factors/contrasts, tests with degrees of freedom, test statistics and p-values, and provide a brief interpretation.
3.1. (RQ1): Are There Differences in the Sequence of Analysing the AOIs in the CC Task Versus BW Task?
The sequence parameter is directly related to the time elapsing until the first fixation in a particular area (known as the entry time). Analysis of variance showed that the task format did not significantly differentiate the sequence values (F(1, 240) = 2.84, p = 0.093). However, significant differences in the dependent variable were observed between the individual AOIs (F(5, 240) = 41.03, p < 0.001). A significant interaction effect between AOI and task format was also found (F(5, 240) = 2.34, p = 0.042). The analysis revealed that the sequence in which students viewed the task elements differed significantly between the colour-coded (CC) and black-and-white (BW) materials. The position of the AOI_CBa area differed significantly between the two task versions (t-test: t = 3.13, p = 0.003, df = 40). Participants in the BW group (M = 9.62) fixated first on the superior (upper) conditional block (AOI_CBa), whereas students in the CC group (M = 13.00) first glanced at this area after viewing the lower conditional block (AOI_CBb), located further to the left and marked in orange, and then looked at the corresponding answer block with the same colour.
3.2. (RQ2): Are There Differences in the Subjects’ Visual Attention Distribution ((a) Fixation Time (FT) and (b) Fixation Count (FC)) in the AOIs Depending on the Task Format (CC Task Versus BW Task)?
An analysis of variance within the two-factor model mentioned above was conducted to examine differences in fixation time. We found that participants devoted slightly less attention to analysing the key elements of the task in the case of the colour-coded (CC) format (M = 4.97%) compared with the black-and-white (BW) format (M = 5.32%), and this difference was not significant (F(1, 240) = 0.85, p = 0.356). As expected, there was a significant difference in fixation duration across the individual AOI areas (F(5, 240) = 22.27, p < 0.001). In addition, a significant interaction effect between AOI area and task format was found (F(5, 240) = 3.64, p = 0.003). This result indicates that the distribution of time allocated by participants to the analysis of the specific areas differed significantly between the colour-coded and black-and-white materials. Thus, the participants’ allocation of attention across the various areas depended on the task format.
Two answer areas, AOI_ANA and AOI_ANB, which influenced the analysed effect, are particularly noteworthy. Within these areas, unlike in the other cases, students devoted considerably more attention to analysing the answer blocks in the black-and-white task (for AOI_ANA, M = 7.93%; for AOI_ANB, M = 7.39%) compared with the colour-coded version (for AOI_ANA, M = 4.58%; for AOI_ANB, M = 5.79%). A t-test (t = –3.156, p = 0.003, df = 40) performed for the AOI_ANA area indicated that this difference was significant.
The analysis of variance conducted for the dependent variable—fixation count—showed that participants made fewer fixations on average within the areas of the key task elements in the colour-coded (CC) format (M = 16.97) than in the black-and-white (BW) format (M = 22.04), and this difference was significant (F(1, 240) = 6.89, p = 0.009). There was also a significant difference in fixation count across AOIs (F(5, 240) = 15.69, p < 0.001). Moreover, a significant interaction effect between AOI area and task format was found (F(5, 240) = 2.39, p = 0.039). These results indicate that the fixation count within specific areas depended significantly on the material format. This effect is also illustrated in Figure 3.
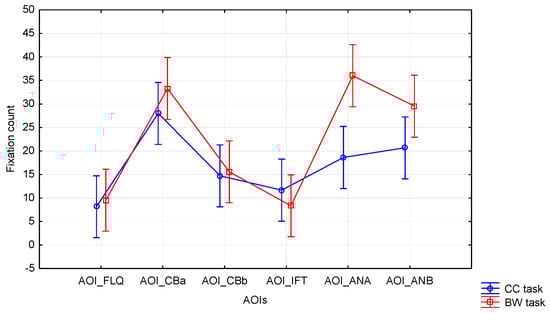
Figure 3.
Fixation count (FC), the interaction between task format and AOIs.
The results show that in both answer areas (AOI_ANA and AOI_ANB), students made significantly fewer fixations in the colour-coded task (for AOI_ANA, M = 18.62; for AOI_ANB, M = 20.67) compared with its conventional version (for AOI_ANA, M = 36.00; for AOI_ANB, M = 29.52). The observed differences were significant (for AOI_ANA: t = –3.41, p = 0.002, df = 40; for AOI_ANB: t = –2.14, p = 0.039, df = 40).
3.3. (RQ3): Are There Differences in the Number of Return Saccades to Key AOIs While Solving the CC Task and the BW Task?
An analysis of variance using the same two-factor model was conducted for the dependent variable glance count (GC). We found that the GC associated with the key elements of the task was only slightly lower in the colour-coded format (M = 8.4) compared with the black-and-white format (M = 8.5), and this difference was not significant (F(1, 240) = 0.023, p = 0.881). Strong and significant differences were found between the values of this parameter across the individual AOI areas (F(5, 240) = 15.43, p < 0.001). The highest number of returns (re-glances) was made by participants towards the areas of the conditional blocks (AOI_CBa and AOI_CBb), which contained the essential content needed to provide the answer.
No significant interaction effect was found between AOI area and task format (F(5, 240) = 0.65, p = 0.660). The use of colour coding did not significantly affect the number of saccades related to the re-analysis of specific areas between the two task versions.
The only area for which a significant effect was observed (t = 2.30, p = 0.027, df = 40; CC M = 6.14, BW M = 4.05) was the instruction text fragment highlighted by colour and boldface font (AOI_IFT). The use of this highlighting achieved the expected outcome: participants in the colour-coded group paid greater attention to this fragment, as they made a significantly higher number of return saccades to this area.
3.4. (RQ4): Does Cognitive Engagement (CE) Differ Between Participants with and Without Task Comprehension in the CC and BW Tasks?
Based on participants’ responses to the survey questions, they were divided into two separate groups: those who understood the task concepts (comprehension group, CG) and those who reported that the task was incomprehensible and that they had selected a random answer (incomprehension group, ICG).
An analysis of variance conducted for the dependent variable total fixation duration (FDT) showed that participants devoted less attention to analysing the colour-coded (CC) task format (M = 76,200 ms) compared with the black-and-white (BW) format (M = 89,765 ms). However, this difference was not significant (F(1, 41) = 0.26, p = 0.608), and the difference in FDT between groups was also not statistically significant (F(1, 41) = 0.85, p = 0.360) between the ICG (M = 75,373 ms) and the CG (M = 88,804 ms). Nonetheless, mean values suggested that participants in the CG group spent more time viewing the task overall.
A statistically significant interaction effect between task format and task comprehension (F(1, 41) = 5.37, p = 0.026) indicated that FDT depended on both variables. In the CG group, a shorter FDT was observed for the CC task (M = 66,854 ms) compared with the BW task (M = 104,900 ms), suggesting that participants took longer to analyse the task in its conventional version. In contrast, participants in the ICG group showed a longer FDT in the CC task (M = 85,546 ms) than in the BW task (M = 61,387 ms).
The average fixation duration (FDA) was longer for participants completing the CC task (M = 254 ms) than for those working with the conventional material (M = 247 ms), although the effect of task format was not significant (F(1, 41) = 1.07, p = 0.307). There was no difference in average fixation duration between the ICG (M = 251 ms) and CG (M = 250 ms) groups (F(1, 41) = 0.00, p = 0.990). The interaction between task format and comprehension was also not significant (F(1, 41) = 1.41, p = 0.230). In the CG group, FDA values for both tasks were similar (CC task M = 249 ms; BW task M = 251 ms), whereas in the ICG group, this difference was larger (CC task M = 258 ms; BW task M = 241 ms), although it was not significant in the t-test (t = 1.80, p = 0.089, df = 17).
To enhance clarity, a consolidated summary of the inferential tests addressing RQ1–RQ4 is presented in Table A1.
4. Discussion
The objective of this study was to examine how the use of colour coding of the structuring elements or keywords in the content of a task influences cognitive engagement and the manner of problem-solving.
In support of the first hypothesis (H1), the obtained results indicate that the sequence in which the students viewed the task elements was significantly different in the case of the colour-coded and the black-and-white material—the subjects in the colour-coded group directed their gaze first towards the areas marked in orange. The findings confirm that colour acts as an attractor: it attracted attention and determined the sequence in which the elements of the visual scene were considered. Our results therefore confirm reports from other studies, suggesting that visual enhancements such as colour coding or boldfaced text are among the instructions that trigger an automatic orientation reaction [23,27]. Similarly, a recent study by [44] demonstrated that both static and dynamic highlighting can effectively guide attention in multimedia interfaces.
The distribution of the subjects’ attention, measured by fixation time percentage (FT) and number of fixations (FC) across particular areas, varied depending on the task format. A definitely shorter fixation time and a lower number of fixations were observed in the colour-coded group for answer areas (AOI_ANA and AOI_ANB), which were designed in such a way that the colour of these areas corresponded to particular conditional blocks (AOI_CBa and AOI_CBb) in the flowchart. The use of colour improved the information channel, i.e., the text presented in these AOIs could be shorter because colour also guided subjects’ attention. This result supports the second hypothesis (H2). The shorter fixation times and fewer fixations observed in the response areas among participants in the colour group are consistent with the findings of [29,30], who demonstrated that colour coding facilitates the integration of textual and graphical information, leading to improved comprehension of the material. Shorter fixation times in the colour-coded group were also reported by [10].
We hypothesised that, in the colour-coded group, the subjects would make fewer return saccades. Specifically, we expected them to visit the answer areas (AOI_ANA and AOI_ANB) and the related condition blocks (AOI_CBa and AOI_CBb) less frequently, as it was easier for them to locate the corresponding pieces of information (H3). This hypothesis, nevertheless, was not confirmed.
However, this observation is interesting and may point to the more complex nature of attention processes. It has been noted in the literature [45,46] that regressive saccades are not solely indicative of difficulties in locating information but can also reflect deeper processing and verification of data. This suggests that learners in the colour-coded group, despite easier access to information, may have engaged more extensively in quality control of their responses. Students often made regressions to previously viewed items to verify the accuracy of their responses, reflecting active cognitive engagement.
We predicted that increased cognitive engagement (CE) would be observed in the case of the BW task, regardless of whether the participants had understood the concept of the task (H4). However, it turned out that, in the case of the colour-coded task, among those who admitted that they had not understood the content of the task and had selected the answer at random, both a longer total fixation duration (FDT) and a longer average fixation duration (FDA) were observed. The students in this group, despite the fact that they did not understand the task content, were more engaged in its analysis, whereas in the case of the black-and-white task, the students abandoned their attempts to solve the problem earlier. The obtained results suggest that the use of colour made the students who had problems with task interpretation analyse it more willingly. Therefore, it appears that a more visually attractive form of communication acted as a motivational factor and enhanced students’ cognitive engagement in the problem-solving process. The findings of higher cognitive engagement among participants in the colour group who did not understand the task are broadly consistent with the study by [47], which demonstrated that emotionally charged text features (including the use of colour) led to longer fixations and more in-depth analysis. This was interpreted as increased cognitive engagement, even though performance on comprehension tests differed. Similarly, Ref. [48] observed that participants exposed to an emotionally positive interface design—featuring warm colours and anthropomorphic frames—allocated more attention and cognitive effort to key content. This effect was evident in eye-tracking data, despite no measurable increase in participants’ self-reported emotional states. This suggests that visually engaging materials can encourage deeper cognitive processing even without enhancing subjective emotional responses.
This study has constraints that bound the generalisability of its conclusions.
First, the sample size was modest, which warrants caution and positions the present findings as preliminary.
Second, the materials comprised a single, static flowchart task in one domain; effects may differ for dynamic or multi-step tasks and for other representations and subject areas.
Third, our inferences are process-level, derived from gaze-based proxies of cognitive engagement rather than learning outcomes. Consequently, we do not adjudicate whether the increased total fixation duration observed among students who reported incomprehension reflects a futile struggle or a productive struggle. Addressing this question requires coupling eye-tracking with outcome measures.
Fourth, the effects observed here reflect a composite cue (colour and bold), rather than the isolated contribution of each feature. Future studies should examine these factors independently using a factorial design. In addition, the analyses were restricted to functionally defined AOIs, excluding unhighlighted regions. Future studies should incorporate these regions as control conditions to provide a more comprehensive assessment.
Fifth, as the grouping in the current study relied on post-task self-reports, the measure of comprehension remains subjective. Future research would benefit from employing objective, pre-defined measures of comprehension (e.g., accuracy, response time, transfer) to strengthen validity.
Sixth, given the exploratory nature of the study and the relatively small sample size, corrections for multiple comparisons were not applied. Consequently, the findings should be interpreted with caution, as they may include chance effects. Future research with larger samples and confirmatory designs should verify the robustness of these results using appropriate statistical adjustments.
Taking into account the discussed limitations of this study, future work should employ larger samples across cohorts and contexts and incorporate a broader repertoire of tasks (e.g., dynamic and interactive materials, alternative representational formats), ideally alongside performance, retention, and transfer measures, to test the scope and durability of the observed effects.
5. Conclusions
The findings presented in this article contribute to the growing body of research on the impact of colour coding in educational materials. In particular, by incorporating eye-tracking techniques, this study provides objective and fine-grained behavioural insights into how learners allocate visual attention when interacting with colour-enhanced learning content. Consistent with this, we interpret eye-tracking metrics as behavioural proxies of attentional allocation and processing effort rather than direct measures of latent cognitive states. With the increasing availability of data from techniques such as eye tracking, there is a growing opportunity to shift the focus toward the automated detection of cognitive engagement in technology-rich learning environments, enabling the examination of its temporal dynamics [49,50,51]. This is particularly relevant in light of the expansion of online education and adaptive learning systems.
Future research should examine the long-term effects of colour coding on learning outcomes and knowledge retention. It would also be valuable to explore how individual differences—such as prior knowledge or learning strategies—interact with visual cues in multimedia materials. Moreover, integrating eye-tracking data with other behavioural or physiological measures could provide a more comprehensive understanding of cognitive engagement during visually enhanced learning.
Author Contributions
Conceptualization, M.A. and A.S.; methodology, M.A. and A.S.; formal analysis, A.S. and W.B.; investigation, M.A. and A.S.; writing—original draft preparation, M.A.; writing—review and editing, M.A., A.S. and W.B.; visualization, M.A., A.S. and W.B.; supervision, A.S. All authors have read and agreed to the published version of the manuscript.
Funding
This research received no external funding.
Institutional Review Board Statement
The study was conducted in accordance with the Declaration of Helsinki and was approved by the Bioethical Committee at the Regional Medical Chamber in Kraków (approval code: 67/KBL/OIL/2014, date of approval: 4 July 2014).
Informed Consent Statement
Verbal informed consent was obtained from all participants. The entire procedure took only a short period of time and did not involve any invasive or potentially harmful activities. All personal information was kept strictly confidential.
Data Availability Statement
The raw data supporting the conclusions of this article will be made available by the authors on request.
Conflicts of Interest
The authors declare no conflicts of interest.
Abbreviations
The following abbreviations are used in this manuscript:
| CC | Colour coding |
| BW | Black-and-white |
| CE | Cognitive engagement |
| VAD | Visual attention distribution |
| CG | Comprehension group |
| ICG | Incomprehension group |
| RQ | Research question |
| AOI | Area of interest; in this manuscript we use abbreviations for several AOIs |
| FDT | Fixation duration total |
| FDA | Fixation duration average |
| FT | Fixation time |
| FC | Fixation count |
| SQ | Sequence |
| GC | Glance count |
Appendix A

Table A1.
Summary of inferential statistics by research question.
Table A1.
Summary of inferential statistics by research question.
| RQ | Dependent Measure | Factors/Contrast | Test (df) | Test Statistic | p | Brief Interpretation |
|---|---|---|---|---|---|---|
| RQ1 | Sequence (SQ) | Format (CC vs. BW) | ANOVA F(1, 240) | 2.84 | 0.093 | No main effect of format. |
| AOI (6 levels) | ANOVA F(5, 240) | 41.03 | <0.001 | Strong AOI effect. | ||
| AOI × Format | ANOVA F(5, 240) | 2.34 | 0.042 | Entry order differs by format. | ||
| Post hoc (AOI_CBa) | t(df = 40) | 3.13 | 0.003 | AOI_CBa order differs by format. | ||
| RQ2 | Fixation Time (FT, %) | Format | ANOVA F(1, 240) | 0.85 | 0.356 | No main effect of format. |
| AOI | ANOVA F(5, 240) | 22.27 | <0.001 | Strong AOI effect. | ||
| AOI × Format | ANOVA F(5, 240) | 3.64 | 0.003 | FT distribution depends on format. | ||
| Post hoc (AOI_ANA) | t(df = 40) | −3.156 | 0.003 | FT in AOI_ANA lower in CC than BW. | ||
| Fixation Count (FC) | Format | ANOVA F(1, 240) | 6.89 | 0.009 | Fewer fixations overall in CC. | |
| AOI | ANOVA F(5, 240) | 15.69 | <0.001 | Strong AOI effect. | ||
| AOI × Format | ANOVA F(5, 240) | 2.39 | 0.039 | FC depends on format × AOI. | ||
| Post hoc (AOI_ANA) | t(df = 40) | −3.41 | 0.002 | FC in AOI_ANA lower in CC than BW. | ||
| Post hoc (AOI_ANB) | t(df = 40) | −2.14 | 0.039 | FC in AOI_ANB lower in CC than BW. | ||
| RQ3 | Glance Count (GC) | Format | ANOVA F(1, 240) | 0.023 | 0.881 | No main effect of format. |
| AOI | ANOVA F(5, 240) | 15.43 | <0.001 | Strong AOI effect. | ||
| AOI × Format | ANOVA F(5, 240) | 0.65 | 0.660 | No interaction. | ||
| Post hoc (AOI_IFT) | t(df = 40) | 2.30 | 0.027 | More returns to IFT in CC. | ||
| RQ4 | FDT (ms) | Format | ANOVA F(1,41) | 0.26 | 0.608 | No main effect of format. |
| Comprehension (CG vs. ICG) | ANOVA F(1,41) | 0.85 | 0.360 | No main effect of group. | ||
| Format × Comprehension | ANOVA F(1,41) | 5.37 | 0.026 | Significant interaction (pattern differs by group). | ||
| FDA (ms) | Format | ANOVA F(1,41) | 1.07 | 0.307 | No main effect of format. | |
| Comprehension | ANOVA F(1,41) | 0.00 | 0.990 | No main effect of group. | ||
| Format × Comprehension | ANOVA F(1,41) | 1.41 | 0.230 | No interaction. | ||
| Post hoc (ICG, CC vs. BW) | t(df = 17) | 1.80 | 0.089 | Trend: FDA higher in CC (ns). |
References
- Mayer, R.E.; Moreno, R. Nine ways to reduce cognitive load in multimedia learning. Educ. Psychol. 2003, 38, 43–52. [Google Scholar] [CrossRef]
- Folker, S.; Sichelschmidt, L.; Ritter, H. Processing and integrating multimodal material—The influence of color-coding. In Proceedings of the 27th Annual Conference of the Cognitive Science Society; Bara, B.G., Barsalou, L., Bucciarelli, M., Eds.; Erlbaum: Mahwah, NJ, USA, 2005; pp. 690–695. [Google Scholar]
- Saeverot, H.; Torgersen, G.E. Individual differences in visual and verbal channel capacity and learning outcome from film and text. Creat. Educ. 2016, 7, 2845–2867. [Google Scholar] [CrossRef]
- De Koning, B.B.; Tabbers, H.K.; Rikers, R.M.J.P.; Paas, F. Attention cueing as a means to enhance learning from an animation. Appl. Cogn. Psychol. 2007, 21, 731–746. [Google Scholar] [CrossRef]
- Mautone, P.D.; Mayer, R.E. Signaling as a cognitive guide in multimedia learning. J. Educ. Psychol. 2001, 93, 377–389. [Google Scholar] [CrossRef]
- Berthold, K.; Renkl, A. Instructional aids to support a conceptual understanding of multiple representations. J. Educ. Psychol. 2009, 101, 70–87. [Google Scholar] [CrossRef]
- Jamet, E.; Gavota, M.; Quaireau, C. Attention guiding in multimedia learning. Learn. Instr. 2008, 18, 135–145. [Google Scholar] [CrossRef]
- Kalyuga, S.; Chandler, P.; Sweller, J. Managing split-attention and redundancy in multimedia instruction. Appl. Cogn. Psychol. 1999, 13, 351–371. [Google Scholar] [CrossRef]
- Atkinson, R.K.; Mayer, R.E.; Merrill, M.M. A meta-analysis of how signaling affects learning with media. Educ. Res. Rev. 2018, 23, 1–24. [Google Scholar] [CrossRef]
- Liu, Y.; Ma, W.; Guo, X.; Lin, X.; Wu, C.; Zhu, T. Impacts of color coding on programming learning in multimedia learning: Moving toward a multimodal methodology. Front. Psychol. 2021, 12, 773328. [Google Scholar] [CrossRef]
- Beege, M.; Nebel, S.; Schneider, S.; Rey, G.D. The effect of signaling in dependence on the extraneous cognitive load in learning environments. Cogn. Process. 2021, 22, 209–225. [Google Scholar] [CrossRef]
- Rodemer, M.; Lindner, M.A.; Eckhard, J.; Graulich, N.; Bernholt, S. Dynamic signals in instructional videos support students to navigate through complex representations: An eye-tracking study. Appl. Cogn. Psychol. 2022, 36, 852–863. [Google Scholar] [CrossRef]
- Azevedo, R. Defining and measuring engagement and learning in science: Conceptual, theoretical, methodological, and analytical issues. Educ. Psychol. 2015, 50, 84–94. [Google Scholar] [CrossRef]
- Fredricks, J.A.; McColskey, W. The measurement of student engagement: A comparative analysis of various methods and student self-report instruments. In Handbook of Research on Student Engagement; Christenson, S., Reschly, A.L., Wylie, C., Eds.; Springer: New York, NY, USA, 2012; pp. 763–782. [Google Scholar]
- Sinatra, G.M.; Heddy, B.C.; Lombardi, D. The challenges of defining and measuring student engagement in science. Educ. Psychol. 2015, 50, 1–13. [Google Scholar] [CrossRef]
- Boekaerts, M. Engagement as an inherent aspect of the learning process. Learn. Instr. 2016, 43, 76–83. [Google Scholar] [CrossRef]
- Clark, R.C.; Mayer, R.E. E-Learning and the Science of Instruction: Proven Guidelines for Consumers and Designers of Multimedia Learning; Wiley: Hoboken, NJ, USA, 2016. [Google Scholar]
- Miller, B.W. Using reading times and eye-movements to measure cognitive engagement. Educ. Psychol. 2015, 50, 31–42. [Google Scholar] [CrossRef]
- Duchowski, A. Eye Tracking Methodology: Theory and Practice; Springer: London, UK, 2007. [Google Scholar] [CrossRef]
- Just, M.A.; Carpenter, P.A. Eye fixations and cognitive processes. Cogn. Psychol. 1976, 8, 441–480. [Google Scholar] [CrossRef]
- Rayner, K. Eye movement in reading and information processing: 20 years of research. Psychol. Bull. 1998, 124, 372–422. [Google Scholar] [CrossRef] [PubMed]
- Poole, A.; Ball, L.J. Eye tracking in human–computer interaction and usability research: Current status and future prospects. In Encyclopedia of Human Computer Interaction; Ghaoui, C., Ed.; Idea Group: Hershey, PA, USA, 2006; pp. 211–219. [Google Scholar]
- Ober, J.; Dylak, J.; Gryncewicz, W.; Przedpelska-Ober, E. Sakkadometria—Nowe możliwości oceny stanu czynnościowego ośrodkowego układu nerwowego. Nauka 2009, 4, 109–135. [Google Scholar]
- Krejtz, K.; Żurawska, J.; Duchowski, A.T.; Wichary, S. Pupillary and microsaccadic responses to cognitive effort and emotional arousal during complex decision making. J. Eye Mov. Res. 2020, 13, 1–15. [Google Scholar] [CrossRef]
- Bauer, R.; Jost, L.; Gunther, B.; Jansen, P. Pupillometry as a measure of cognitive load in mental rotation tasks with abstract and embodied figures. Psychol. Res. 2021, 86, 1382–1396. [Google Scholar] [CrossRef]
- Alemdag, E.; Cagiltay, K. A systematic review of eye tracking research on multimedia learning. Comput. Educ. 2018, 125, 413–428. [Google Scholar] [CrossRef]
- Krejtz, K.; Krejtz, I.; Szarkowska, A.; Kopacz, A. Multimedia w edukacji. Potencjał audiodeskrypcji w kierowaniu uwagą wzrokową ucznia. Przekładaniec 2014, 28, 80–92. [Google Scholar]
- Mayer, R.E. Unique contributions of eye-tracking research to the study of learning with graphics. Learn. Instr. 2010, 20, 167–171. [Google Scholar] [CrossRef]
- Boucheix, J.-M.; Lowe, R.K. An eye-tracking comparison of external pointing cues and internal continuous cues in learning with complex animations. Learn. Instr. 2010, 20, 123–135. [Google Scholar] [CrossRef]
- Ozcelik, E.; Karakus, T.; Kursun, E.; Cagiltay, K. An eye-tracking study of how color coding affects multimedia learning. Comput. Educ. 2009, 53, 445–453. [Google Scholar] [CrossRef]
- Luo, H.; Koszalka, T.; Zuo, M. Investigating the effects of visual cues in multimedia instruction using eye tracking. In Blended Learning: Aligning Theory with Practices. ICBL 2016; Lecture Notes in Computer Science; Cheung, S., Kwok, L., Shang, J., Wang, A., Kwan, R., Eds.; Springer: Cham, Switzerland, 2016; Volume 9757, pp. 63–72. [Google Scholar] [CrossRef]
- Liu, X.; Cui, Y. Eye tracking technology for examining cognitive processes in education: A systematic review. Comput. Educ. 2025, 229, 105263. [Google Scholar] [CrossRef]
- Lai, M.L.; Tsai, M.J.; Yang, F.Y.; Hsu, C.Y.; Liu, T.C.; Lee, S.W.; Lee, M.H.; Chiou, G.L.; Liang, J.C.; Tsai, C.C. A review using eye-tracking technology in exploring learning from 2000 to 2012. Educ. Res. Rev. 2013, 10, 90–115. [Google Scholar] [CrossRef]
- Kriz, S.; Hegarty, M. Top-down and bottom-up influences on learning from animations. Int. J. Hum.–Comput. Stud. 2007, 65, 911–930. [Google Scholar] [CrossRef]
- Scheiter, K.; Eitel, A. Signals foster multimedia learning by supporting integration of highlighted text and diagram elements. Learn. Instr. 2015, 36, 11–26. [Google Scholar] [CrossRef]
- Yang, H.-Y. The effects of attention cueing on visualizers’ multimedia learning. Educ. Technol. Soc. 2016, 19, 249–262. [Google Scholar]
- She, L.; Wang, Z.; Tao, X.; Lai, L. The impact of color cues on the learning performance in video lectures. Behav. Sci. 2024, 14, 560. [Google Scholar] [CrossRef]
- Skulmowski, A.; Xu, K.M. Understanding Cognitive Load in Digital and Online Learning: A New Perspective on Extraneous Cognitive Load. Educ. Psychol. Rev. 2021, 34, 171–196. [Google Scholar] [CrossRef]
- Greene, B.A. Measuring cognitive engagement with self-report scales: Reflections from over 20 years of research. Educ. Psychol. 2015, 50, 14–30. [Google Scholar] [CrossRef]
- Li, S. Measuring cognitive engagement: An overview of measurement instruments and techniques. Int. J. Psychol. Educ. Stud. 2021, 8, 88–98. [Google Scholar] [CrossRef]
- Phokoye, S.P.; Epizitone, A.; Nkomo, N.; Mthalane, P.P.; Moyane, S.P.; Khumalo, M.M.; Luthuli, M.; Zondi, N.P. Exploring the Adoption of Robotics in Teaching and Learning in Higher Education Institutions. Informatics 2024, 11, 91. [Google Scholar] [CrossRef]
- Khalid, A.; Kazim, T.; Vasquez Diaz, K.R.; Iqbal, J. Breaking Barriers in Higher Education: Implementation of Cost-Effective Social Constructivism in Engineering Education. Int. J. Mech. Eng. Educ. 2025, 53, 211–235. [Google Scholar] [CrossRef]
- Walker, A.; Vasquez Diaz, K.R.; McKie, D.; Iqbal, J. Enquiry-Based Learning Pedagogy—Design, Development and Delivery of a Reproducible Robotics Framework. In Proceedings of the Ninth International Congress on Information and Communication Technology (ICICT 2024); Yang, X.-S., Sherratt, S., Dey, N., Joshi, A., Eds.; Lecture Notes in Networks and Systems; Springer: Singapore, 2024; Volume 1000, pp. 363–374. [Google Scholar] [CrossRef]
- Das, D.; Wu, S.; Škrjanec, I.; Feit, A.M. Shifting Focus with HCEye: Exploring the Dynamics of Visual Highlighting and Cognitive Load on User Attention and Saliency Prediction. arXiv 2024, arXiv:2404.14232. [Google Scholar] [CrossRef]
- Holmqvist, K.; Nyström, M.; Andersson, R.; Dewhurst, R.; Jarodzka, H.; Van de Weijer, J. Eye Tracking: A Comprehensive Guide to Methods and Measures; Oxford University Press: Oxford, UK, 2011. [Google Scholar]
- Jarodzka, H.; Scheiter, K.; Gerjets, P.; Van Gog, T. In the eyes of the beholder: How experts and novices interpret dynamic stimuli. Learn. Instr. 2010, 20, 146–154. [Google Scholar] [CrossRef]
- Stark, L.; Brünken, R.; Park, B. Emotional text design in multimedia learning: A mixed-methods study using eye tracking. Comput. Educ. 2018, 120, 185–196. [Google Scholar] [CrossRef]
- Peng, X.; Xu, Q.; Chen, Y.; Zhou, C.; Ge, Y.; Li, N. An Eye-Tracking Study: Positive emotional interface facilitates learning outcomes in multimedia learning? Int. J. Educ. Technol. High. Educ. 2021, 18, 40. [Google Scholar] [CrossRef]
- D’Mello, S.; Dieterle, E.; Duckworth, A. Advanced, analytic, automated (AAA) measurement of engagement during learning. Educ. Psychol. 2017, 52, 104–123. [Google Scholar] [CrossRef]
- Li, S.; Lajoie, S.P.; Zheng, J.; Wu, H.; Cheng, H. Automated detection of cognitive engagement to inform the art of staying engaged in problem-solving. Comput. Educ. 2021, 163, 104114. [Google Scholar] [CrossRef]
- Qi, Y.; Zhuang, L.; Chen, H.; Han, X.; Liang, A. Evaluation of Students’ Learning Engagement in Online Classes Based on Multimodal Vision Perspective. Electronics 2024, 13, 149. [Google Scholar] [CrossRef]


Disclaimer/Publisher’s Note: The statements, opinions and data contained in all publications are solely those of the individual author(s) and contributor(s) and not of MDPI and/or the editor(s). MDPI and/or the editor(s) disclaim responsibility for any injury to people or property resulting from any ideas, methods, instructions or products referred to in the content. |
© 2025 by the authors. Licensee MDPI, Basel, Switzerland. This article is an open access article distributed under the terms and conditions of the Creative Commons Attribution (CC BY) license (https://creativecommons.org/licenses/by/4.0/).