You are currently viewing a new version of our website. To view the old version click .
Applied Sciences
  • Article
  • Open Access

27 October 2025

Dielectric Barrier Discharge as a Source of Microplasma for TiO2 Submicron Particle Deposition

and
Institute of Fluid Flow Machinery, Polish Academy of Sciences, Fiszera 14, 80-231 Gdansk, Poland
*
Author to whom correspondence should be addressed.
This article belongs to the Section Materials Science and Engineering

Abstract

Dielectric barrier discharge (DBD) was used as a source of low-temperature plasma generated in a mixture of air and argon at atmospheric pressure for the deposition of a TiO2 layer from a precursor on a brass or glass substrate. The DBD was generated between two plane-parallel electrodes covered with a dielectric barrier and supplied with an AC high voltage at a frequency of 5 kHz. In this paper, a TiO2 layer was deposited from vaporised titanium tetraisopropoxide (TTIP), as a precursor, conveyed via argon as a carrier gas in air. The deposited layer was then annealed at a temperature of 450 °C for a time of 2 h. The results of laboratory investigations show that DBD plasma generated in a mixture of air and argon at atmospheric pressure with a precursor can be a useful tool to produce an anatase TiO2 thin porous layer. The physical properties of the obtained layers were characterised by scanning electron microscopy, energy-dispersive spectroscopy, and Raman spectroscopy. Layer morphology was different depending on the substrate used: in the case of the brass substrate, the layer was built from particles with an average size larger than that of the layer built on the glass substrate. The effect of substrates with different electrical properties on TiO2 layer morphology deposited in DBD has not yet been investigated.

1. Introduction

Electrical discharges are used in various industrial processes, for example for surface treatment, surface sterilization, noxious compounds decomposition, particulate matter precipitation, micro- and nanostructure synthesis, plasma etching, or electric discharge machining [,]. Electrical discharges are generated between electrodes of various geometries and in different gases, at a pressure ranging from hundreds of bars to below 1 Pa. Electric discharge can be supplied with a direct high voltage, the so-called direct-current discharge (DC discharge), pulsed voltage (PD discharge), or alternating voltages of various frequencies from the mains frequency (50/60 Hz) at tens of kHz, called alternating-current discharge (AC discharge), to radio frequency (RF discharge) and microwaves (µW discharge) []. Atmospheric pressure discharges have become popular plasma sources in plasma technology because expensive vacuum systems are not required for plasma generation. Several methods have been developed to generate atmospheric pressure plasmas, such as dielectric barrier discharge (DBD), micro-discharge, micro-hollow cathode discharge, point–plane, point–point, or coaxial wire–cylinder corona discharge, inductively coupled plasma (ICP), capacitively coupled plasma (CCP), and plasma jet [].
DBD is a type of electric discharge generated by an alternating electric field, such as AC, radio frequency, or a pulsed electric field, usually in a system of two electrodes consisting of two parallel plates or two coaxial cylindrical electrodes separated by a gaseous gap and a solid dielectric barrier. The dielectric barrier limits the discharge current and prevents the transition from low-current glow discharge to spark or arc discharges of a high discharge current. The presence of a dielectric barrier also decreases the electric field in the gaseous gap because of the electric charge accumulated on the surface of the dielectric barrier, which generates an electric field opposite to that produced by the electrodes [,,].
Glass [,,], quartz [,,,,], or ceramics [,] are typical dielectric barrier materials. In a specific application of DBD used for the modification of a polymer surface, processed polymer films are used as a natural dielectric barrier [,,,]. The DBD plasma can be either filamentary [] or homogeneous (diffusive) [], depending on the discharge conditions, such as the type of gas used, the pressure of the gas, the geometric configuration of electrodes, the dielectric barrier material properties, and the frequency and amplitude of the applied voltage.
DBD is a source of non-equilibrium plasma with electrons of high kinetic energy and low-temperature ions and neutral molecules. It has found many practical applications in industry, for example for aerosol particle charging [,,], ozone generation [,,], surface cleaning, bacteria and fungi inactivation [,], thin-film deposition [,], flue gas desulphurization, volatile organic compound emission abatement [,,], water treatment [,], or material surface processing [,,].
In the investigations presented in this study, DBD was applied to the deposition of a thin porous layer of TiO2 using titanium tetraisopropoxide (TTIP, Ti(OCH(CH3)2)4) as a precursor. The precursor was decomposed in a microplasma generated between two parallel electrodes, each covered with a dielectric plate, and the obtained TiO2 nanoparticles formed in the electric discharge plasma were deposited as a porous layer onto a substrate via thermal diffusion and electric forces. This technique allows for the deposition of a layer on any type of substrate without using a vacuum system or inert gas environment.
In this paper, the thin solid layer of TiO2 synthesised in low-temperature plasma generated by DBD can be used as a catalyst for the photoconversion of CO2 to CH4 under UV solar radiation [] or for the photocatalytic decomposition of oleic acid [], for the inactivation of pathogenic bacteria [], or for the photocatalytic decomposition of oleic acid [].
Other methods of thin TiO2 film deposition from a TTIP precursor were studied by Yang and Wolden [], Aita et al. [], Gosavi et al. [], Yamauchi et al. [], Gazal et al. [], and Collette et al. []. Yang and Wolden used plasma-enhanced chemical vapour deposition (PECVD) for film deposition. These authors used a vacuum system with a furnace at a temperature up to 450 °C to synthesise the anatase phase in a capacitively coupled radio-frequency discharge. The gas pressure during TiO2 deposition was about 47 Pa. Discharge power was in the range of 5–20 W, and the time of synthesis was 5 min. The deposition rate varied from 3 to 30 nm/min. The X-ray diffraction analysis showed that the anatase layer was obtained at a temperature of 450 °C. For lower temperatures, the structure of the deposited TiO2 layer was amorphous []. Aita et al. [] deposited TiOx solid films in an inductively coupled micro-discharge at atmospheric pressure with a TTIP concentration of 8.2 × 10⁻⁵ mol/dm3 and an Ar gas flow rate of 0.8 dm3/min; however, the structure of the obtained layer was amorphous with a thickness of up to 40 µm. Gosavi et al. [] obtained TiO2 thin films from titanium ethoxide using atmospheric pressure plasma jet processing for photocatalytic decomposition of oleic acid. The TiO2 thin film was synthesised using a mixture of helium and argon as the carrier gas flowing at a flow rate of up to 5.3 L/min and 0.5 L/min for the feedstock of titanium. The thickness of the TiO2 thin film was up to 4 µm after a deposition time of 5 min. The TiO2 thin film was anatase, obtained via a one-step process without the post-annealing treatment. The discharge power was 160 W. Yamauchi et al. [] obtained a transparent TiO2 layer at low pressure in RF plasma (13.56 MHz) with a deposition rate up to 8 nm/min. Gazal et al. [] and Collette et al. [], using an atmospheric pressure plasma torch, obtained TiO2 layers. Gazal obtained amorphous and crystallised columnar structures using plasma generated by a microwave power generator (2.45 GHz). The MW power was 370 W, and the plasma torch heated the substrate up to 230 °C. The deposition rate of the TiO2 layer was up to 250 nm/min. Collette, using an RF generator (27.12 MHz) obtained an amorphous TiO2 layer with a deposition rate up to 63 nm/min.

2. Materials and Methods

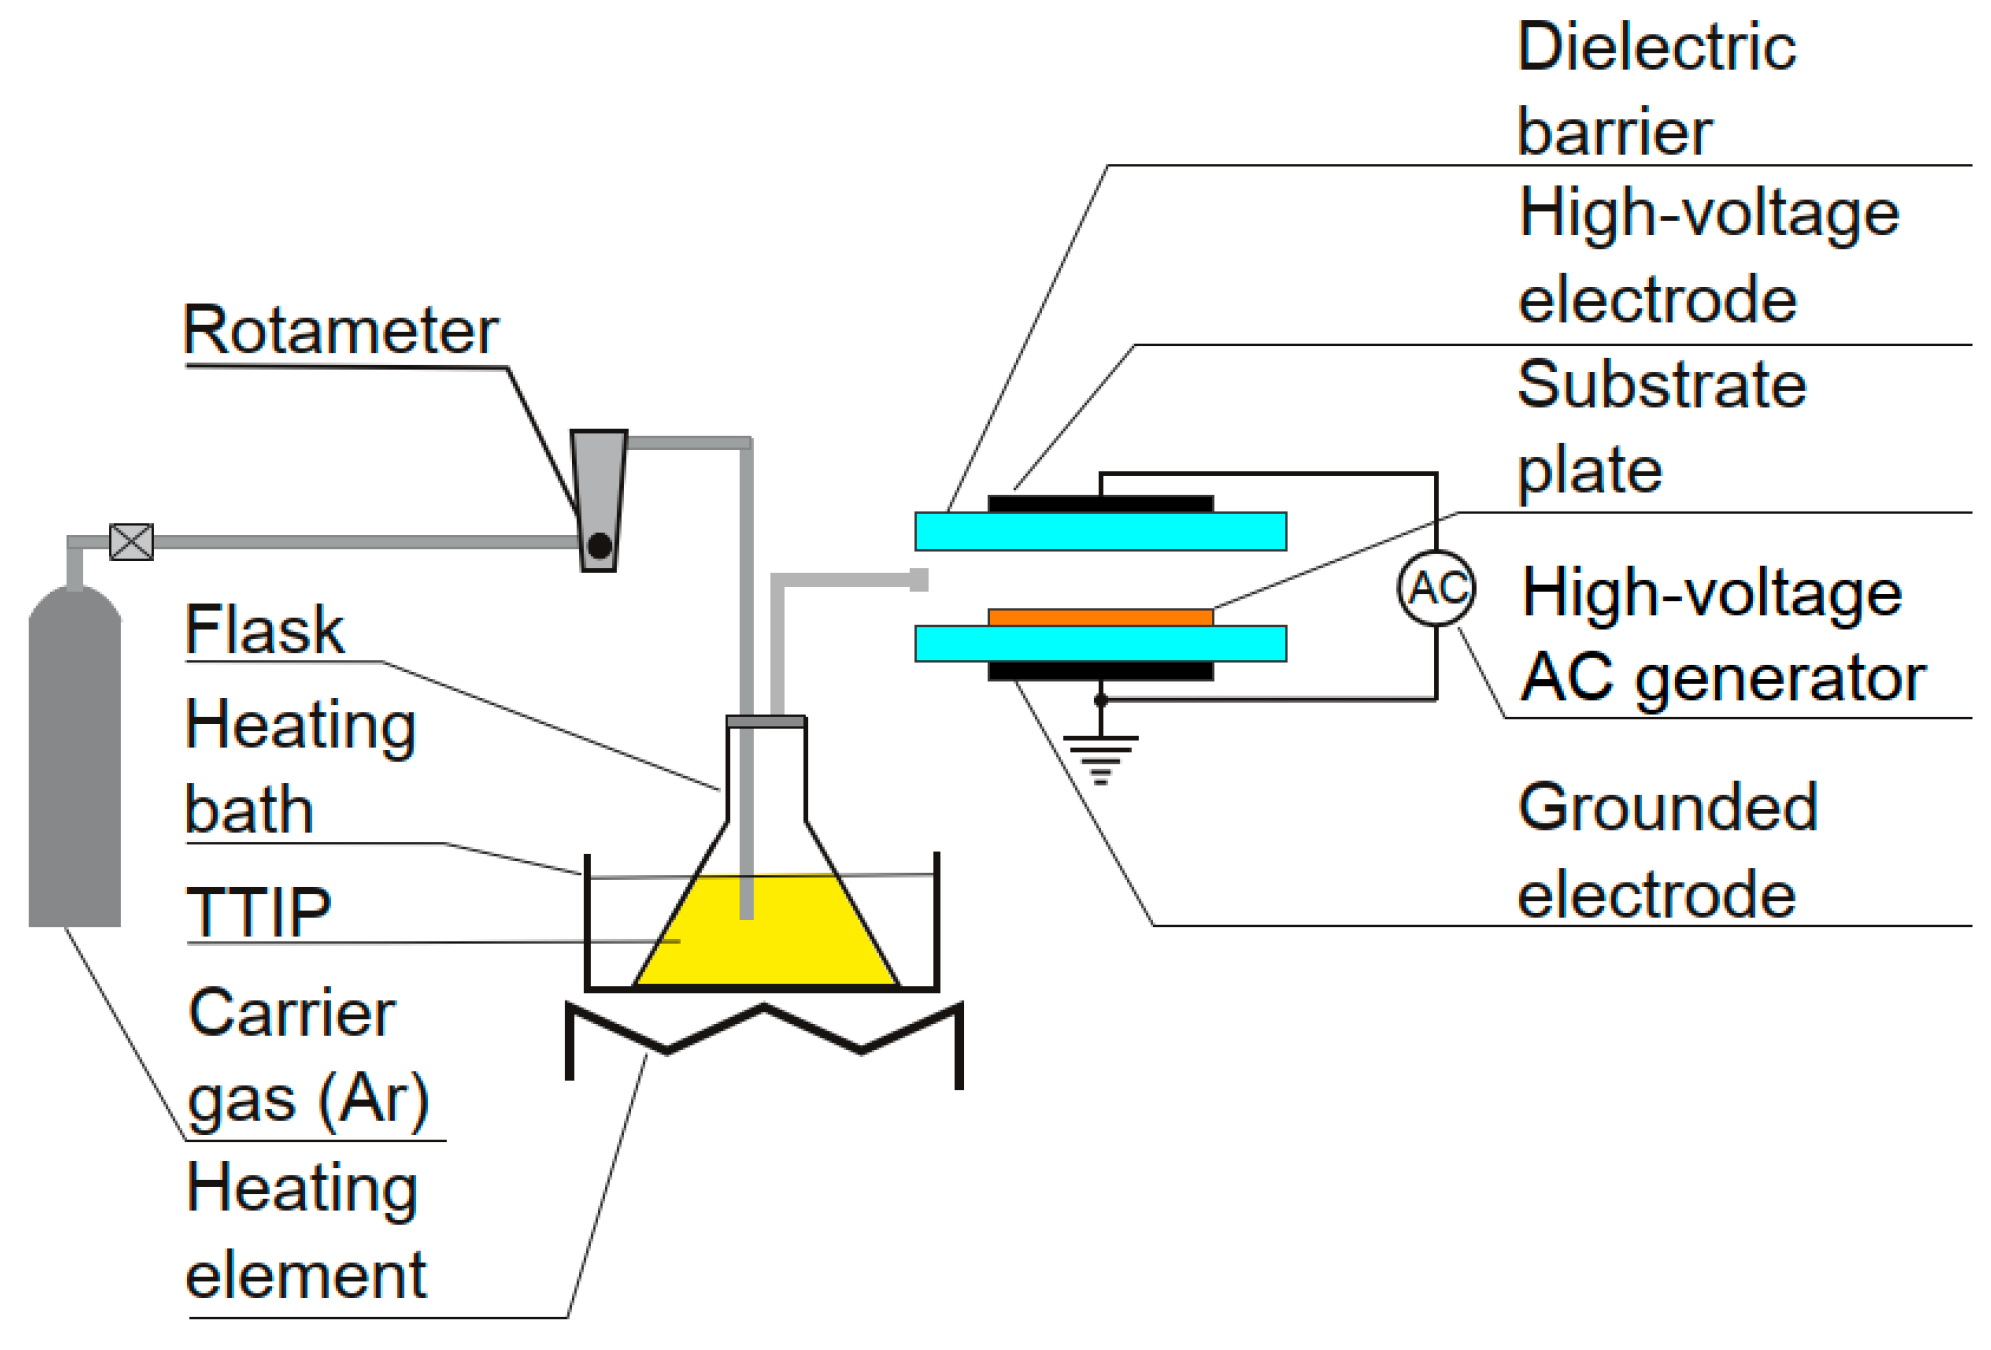
Figure 1 shows a schematic of the experimental setup. The experiments were conducted in an atmosphere of air and argon under normal pressure, with TTIP vapour as the TiO2 precursor. TTIP vapour was obtained by feeding liquid TTIP into a heated flask flushed with Ar as the carrier gas. The TTIP was heated using an MS 11 HS magnetic stirrer (Wigo, Piastów, Poland) to a temperature of 91 °C. The TTIP temperature was stabilised to within ±0.5 °C. The vapor pressure of TTIP in the flask was estimated using the following equation []:
P T T I P = 12900.22 e x p 3222 T
where PTTIP and T are the vapor pressure and temperature of liquid TTIP in Torr and Kelvin, respectively. The concentration of TTIP was estimated to be approximately 5400 ppm. The carrier gas with TTIP vapour was supplied to the DBD reactor via a silicon pipe heated at 91° C to avoid condensation of TTIP.
Figure 1. Schematic of experimental setup used for thin-layer deposition in DBD microplasma.
The argon–TTIP mixture was fed into the gap between the electrodes of the DBD reactor at a flow rate of 85 dm3/h. Argon flow stability was approximately ±5 dm3/h. The humidity of the ambient air was approximately 73%.
The DBD used for thin-layer deposition was generated between two parallel electrodes made of rectangular copper plates with dimensions of 12 × 16 mm spaced at 5.6 mm. The electrodes were supplied with a trapezoid alternating voltage at a frequency ranging from 0.5 kHz to 10 kHz and with an amplitude value of 5.2 kV, generated by a HV power generator model PM04015A (TREK, New York, NY, USA). Both electrodes were covered with Petri dishes with a thickness of about 1.9 mm, used as the dielectric barrier. The distance between these dishes was kept constant by placing between them two microscopic slides with a thickness of 1.8 mm and a size of 26 × 76 mm. The slides were located outside the electrodes’ area to prevent electric field distortion in the micro-plasma generation zone. The slides formed a channel with a width of 25 mm. The substrate for TiO2 layer deposition was placed onto the lower Petri dish. A microscopic cover glass or brass plate with a thickness of about 0.8 mm was used as a substrate for TiO2 layer deposition. The TTIP vapour was injected into a small channel formed by two microscopic glasses. The gap between the substrate and the upper glass barrier was approximately 1 mm. Using the two barriers prevented the deposition of reaction products onto the plasma-generating electrodes. Plasma synthesis of the TiO2 thin porous layer lasted for 20 min.
TTIP was supplied by Sigma-Aldrich (St. Louis, MO, USA; 97%; CAS 546-68-9). Argon (99.999 grade) was provided by Linde Gaz (Kracow, Poland).
The emission spectra of the plasma generated in the air + argon mixture and in the air + argon mixture with the addition of TTIP vapour were measured using a low-resolution portable spectrometer, Maya 2000 PRO (Ocean Optics, Orlando, FL, USA), with a grating of 300 grooves per mm. The measurement wavelength range was from 200 to 1100 nm. The integration time of the spectrum was 1 s and was averaged three times.
The morphology of the layer formed in the DBD plasma was investigated using a scanning electron microscope (EVO 40, Zeiss, Oberkochen, Germany). The elemental composition of the layer was analysed by energy-dispersive spectroscopy (EDS) using a Bruker Quantax 400 spectrometer with an SDD X-flash 5010 detector, 10 mm2, 125 eV (Bruker Corporation, Billerica, MA, USA). The crystallinity of TiO2 samples was studied using a confocal micro-Raman system (InVia, Renishaw, Wotton-under-Edge, UK) with excitation using a green argon ion laser at a wavelength of 514 nm.
The high-voltage trapezoid waveform supplying the electrodes was measured by using high-voltage probe P6015A (Tektronix, Beaverton, OR, USA). The discharge current was determined as the voltage drop across a resistor of 100 Ω connected to the ground, using the probe P6139A (Tektronix, Beaverton, OR, USA). Both signals were recorded by using the digital storage oscilloscope Tektronix TDS3032 (Tektronix, Beaverton, OR, USA). The RMS value of the supply voltage was set in the range from 2 to 10 kV, depending on the frequency, ensuring a value at which filament discharges are not generated. The discharge current was between 0.04 mA and 10 mA, and the discharge power was estimated to be in the range of 5–120 W.
After the deposition, the TiO2 layer was annealed at a temperature of 450 °C for 2 h in a Nabertherm L3/11 furnace (Nabertherm, Lilienthal, Germany).
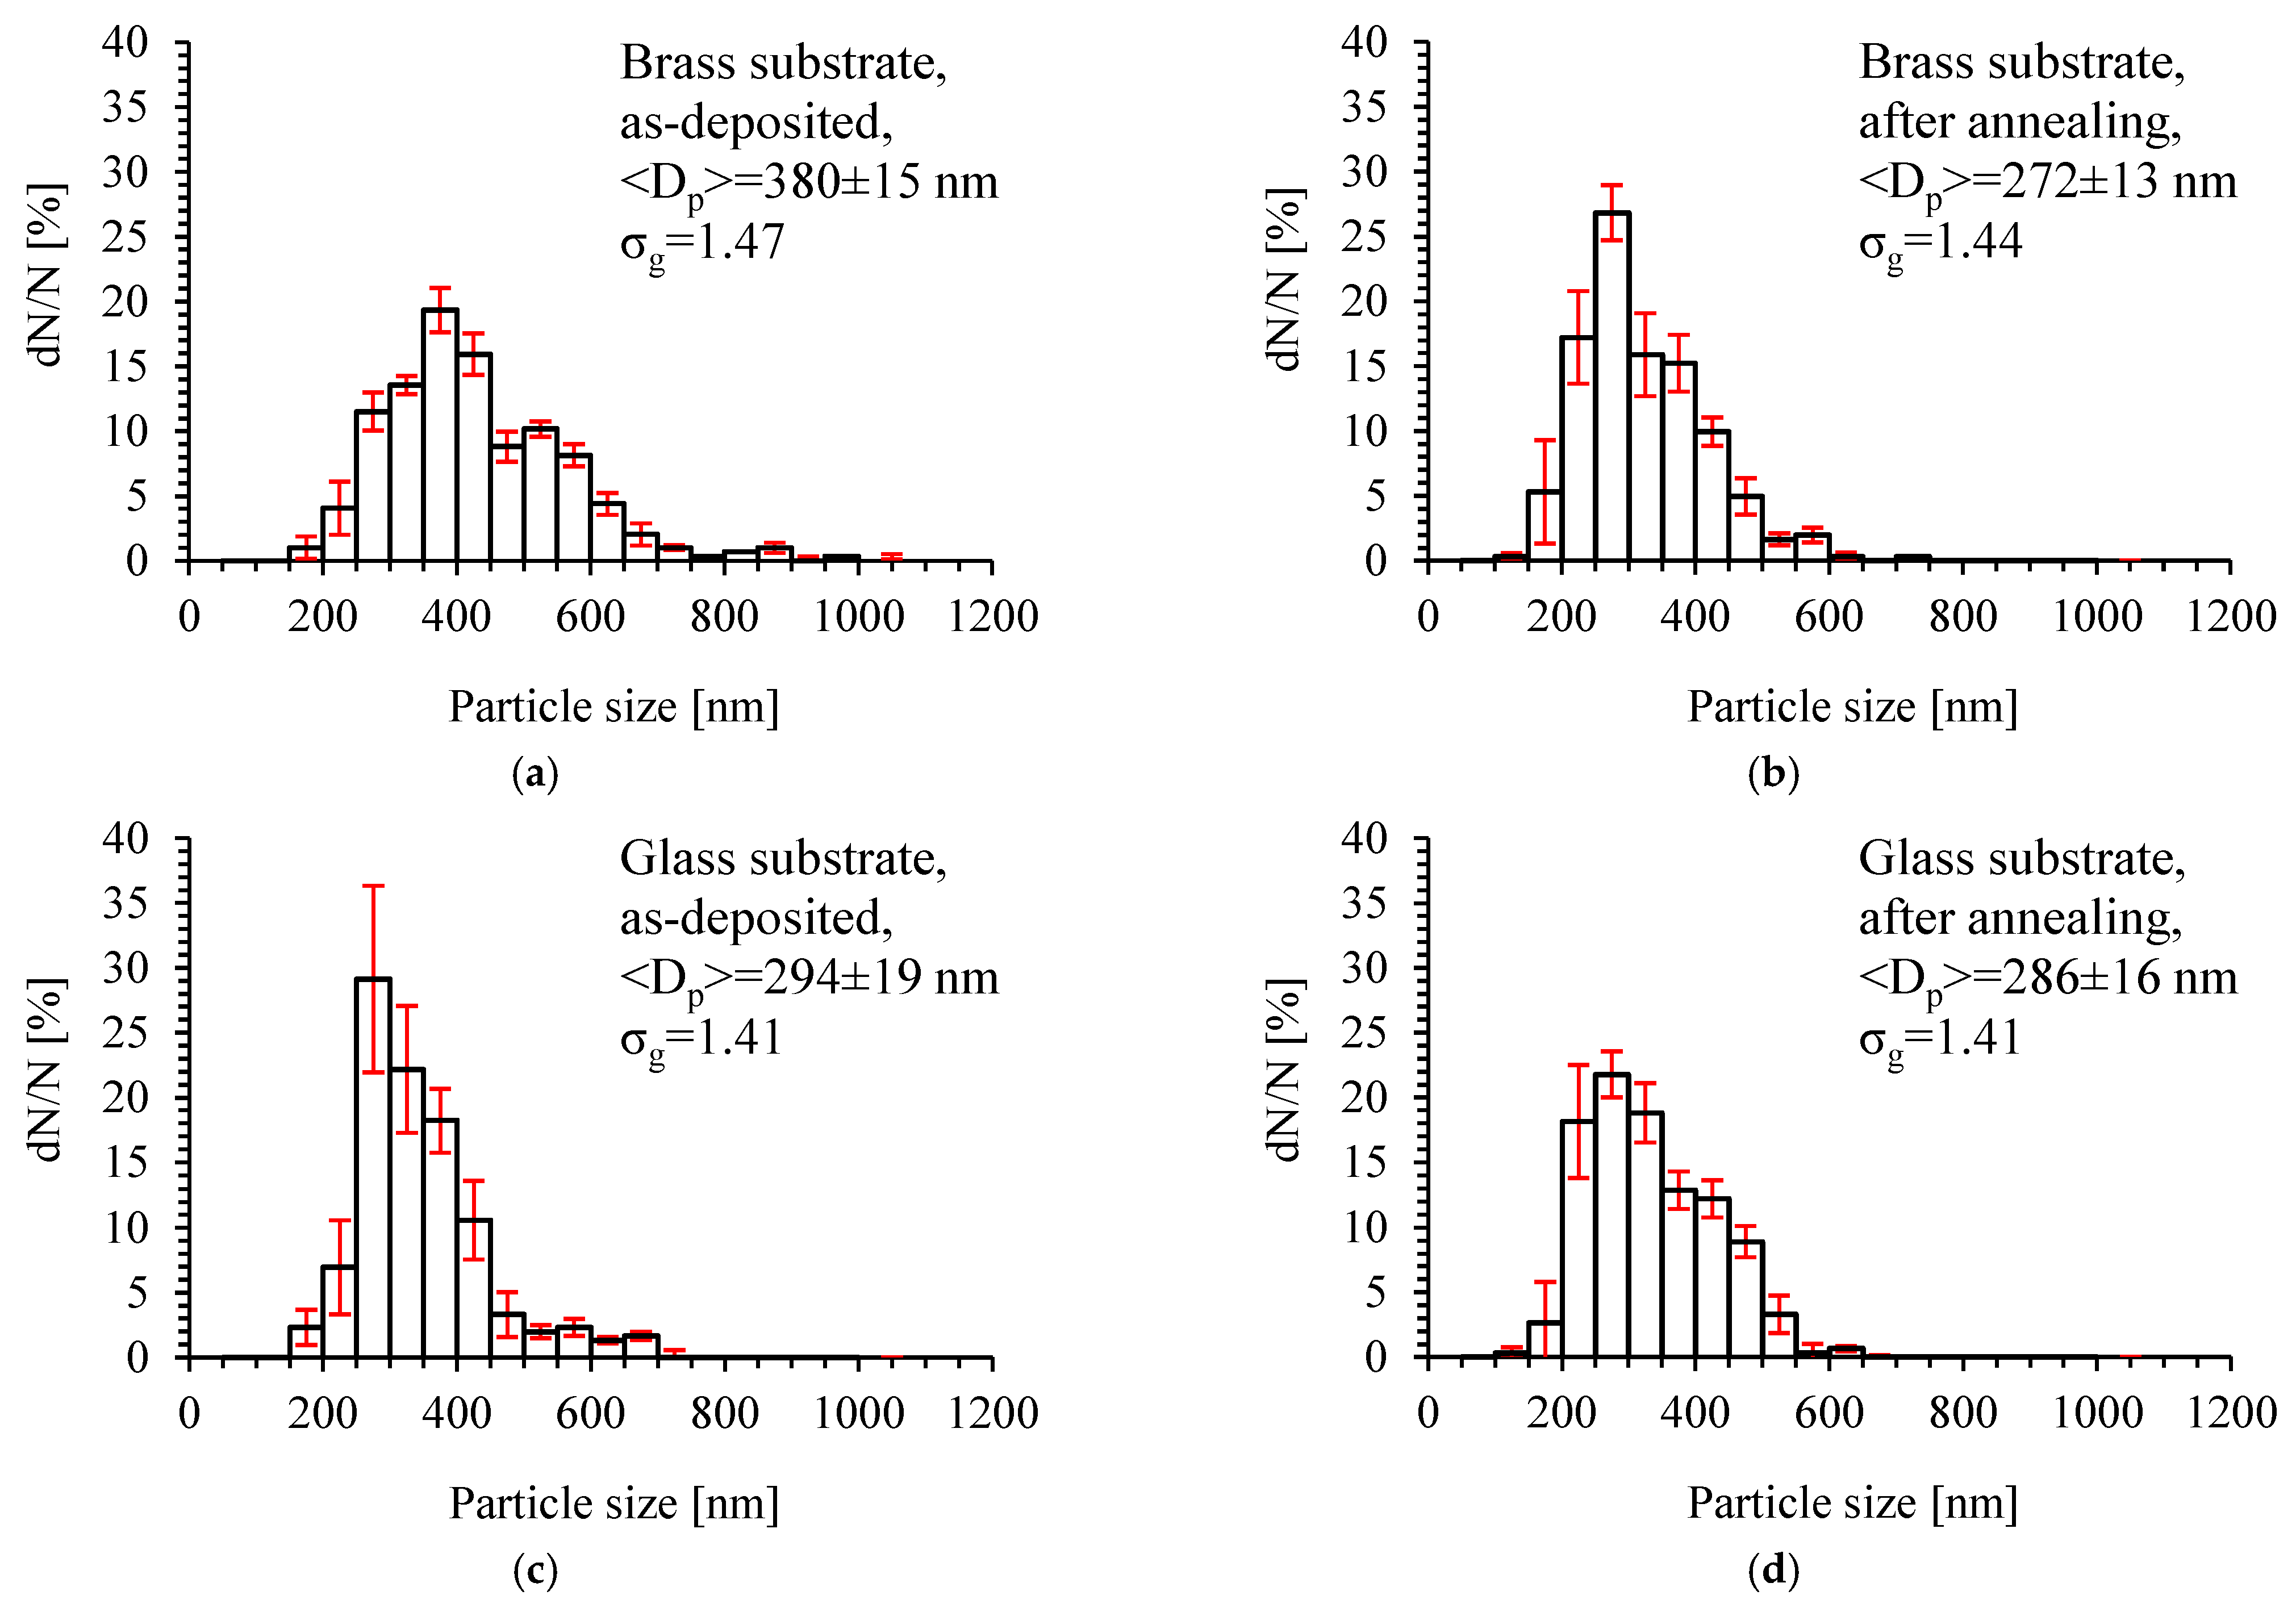
Particle size distributions were determined with ImageJ software (version 1.48; Wayne Rasband, National Institute of Health, Bethesda, MD, USA) from 10 × 15 µm2 images, performed with a magnification of 20,000× under a scanning electron microscope. The particle size distributions presented in the following are the average values obtained from three micrographs, each containing at least 300 particles. The error bar is the standard deviation from every particle size class.

3. Results and Discussion

3.1. DBD Plasma Characterization

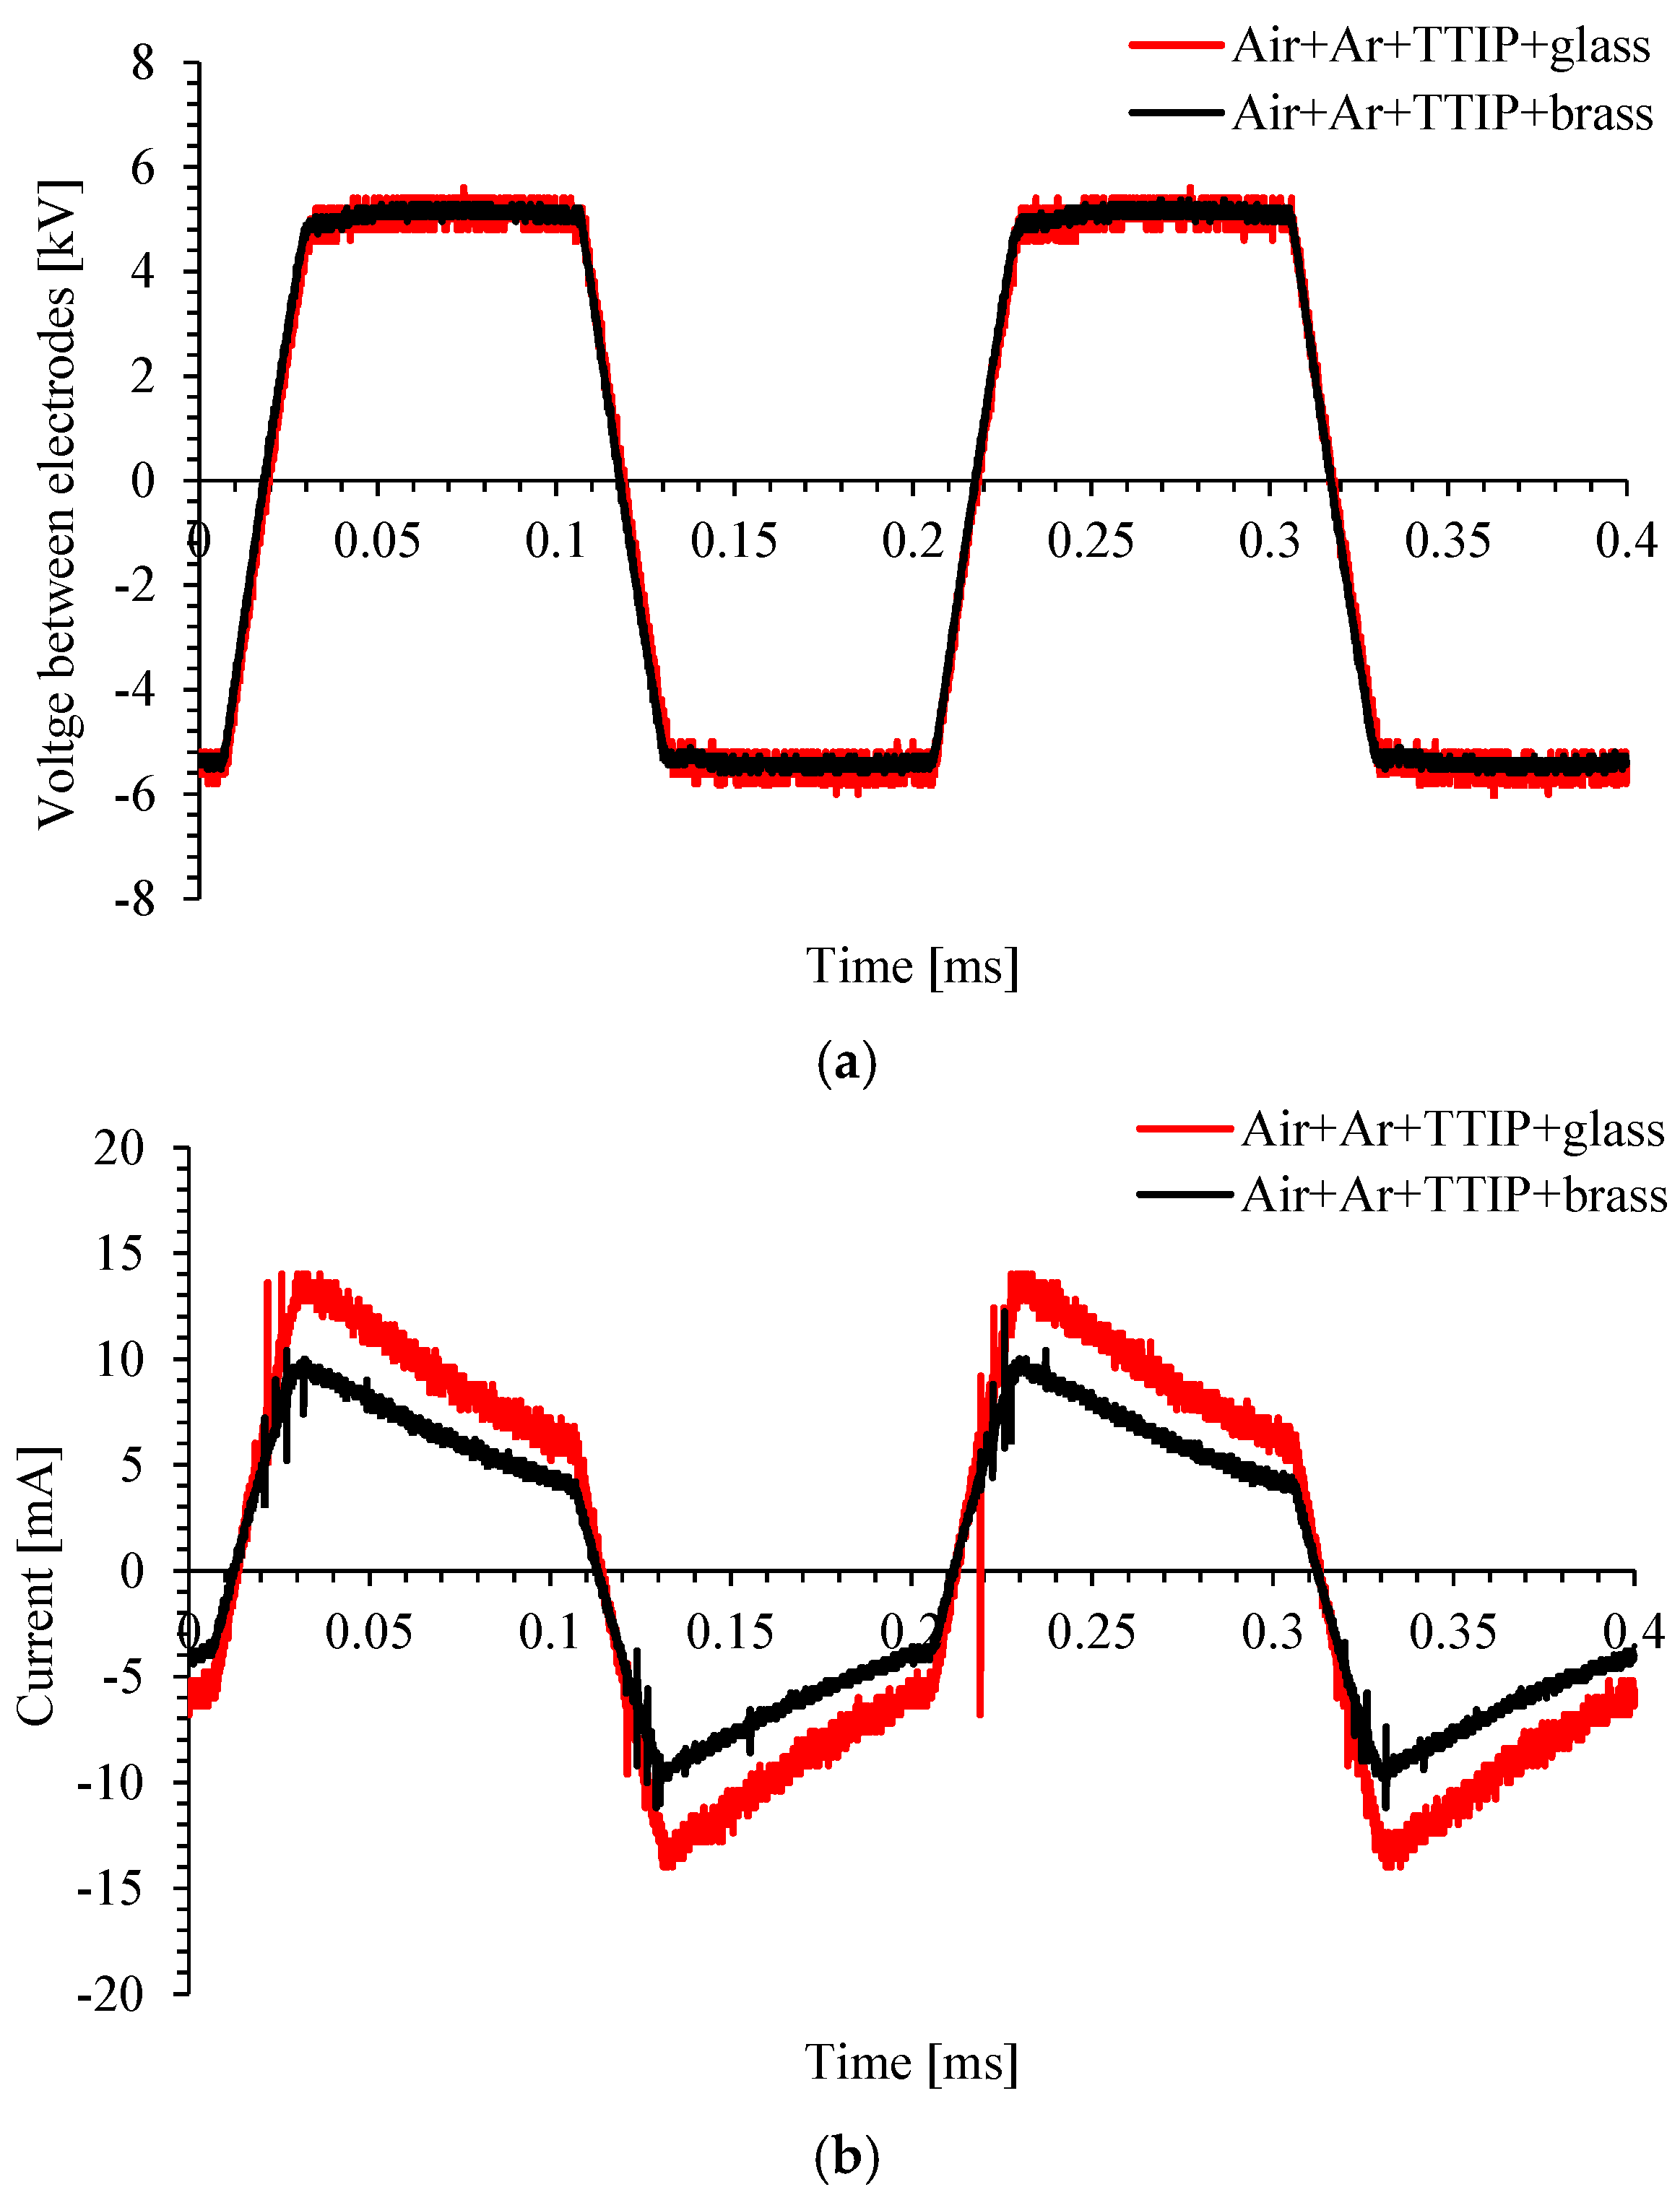
An example of the trapezoid wave voltage and the current waveforms generated by the HV power generator supplying the DBD reactor during TiO2 layer synthesis is shown in Figure 2 for two substrates: glass and brass. The voltage waveforms were similar in both substrate cases. However, the amplitude of the current waveform was higher for the glass substrate than for the brass.
Figure 2. Typical waveforms of voltage between electrodes (a) and discharge current (b) of dielectric barrier discharge in mixture of air, argon, and TTIP for two substrates: glass and brass (frequency of supply voltage 5 kHz).
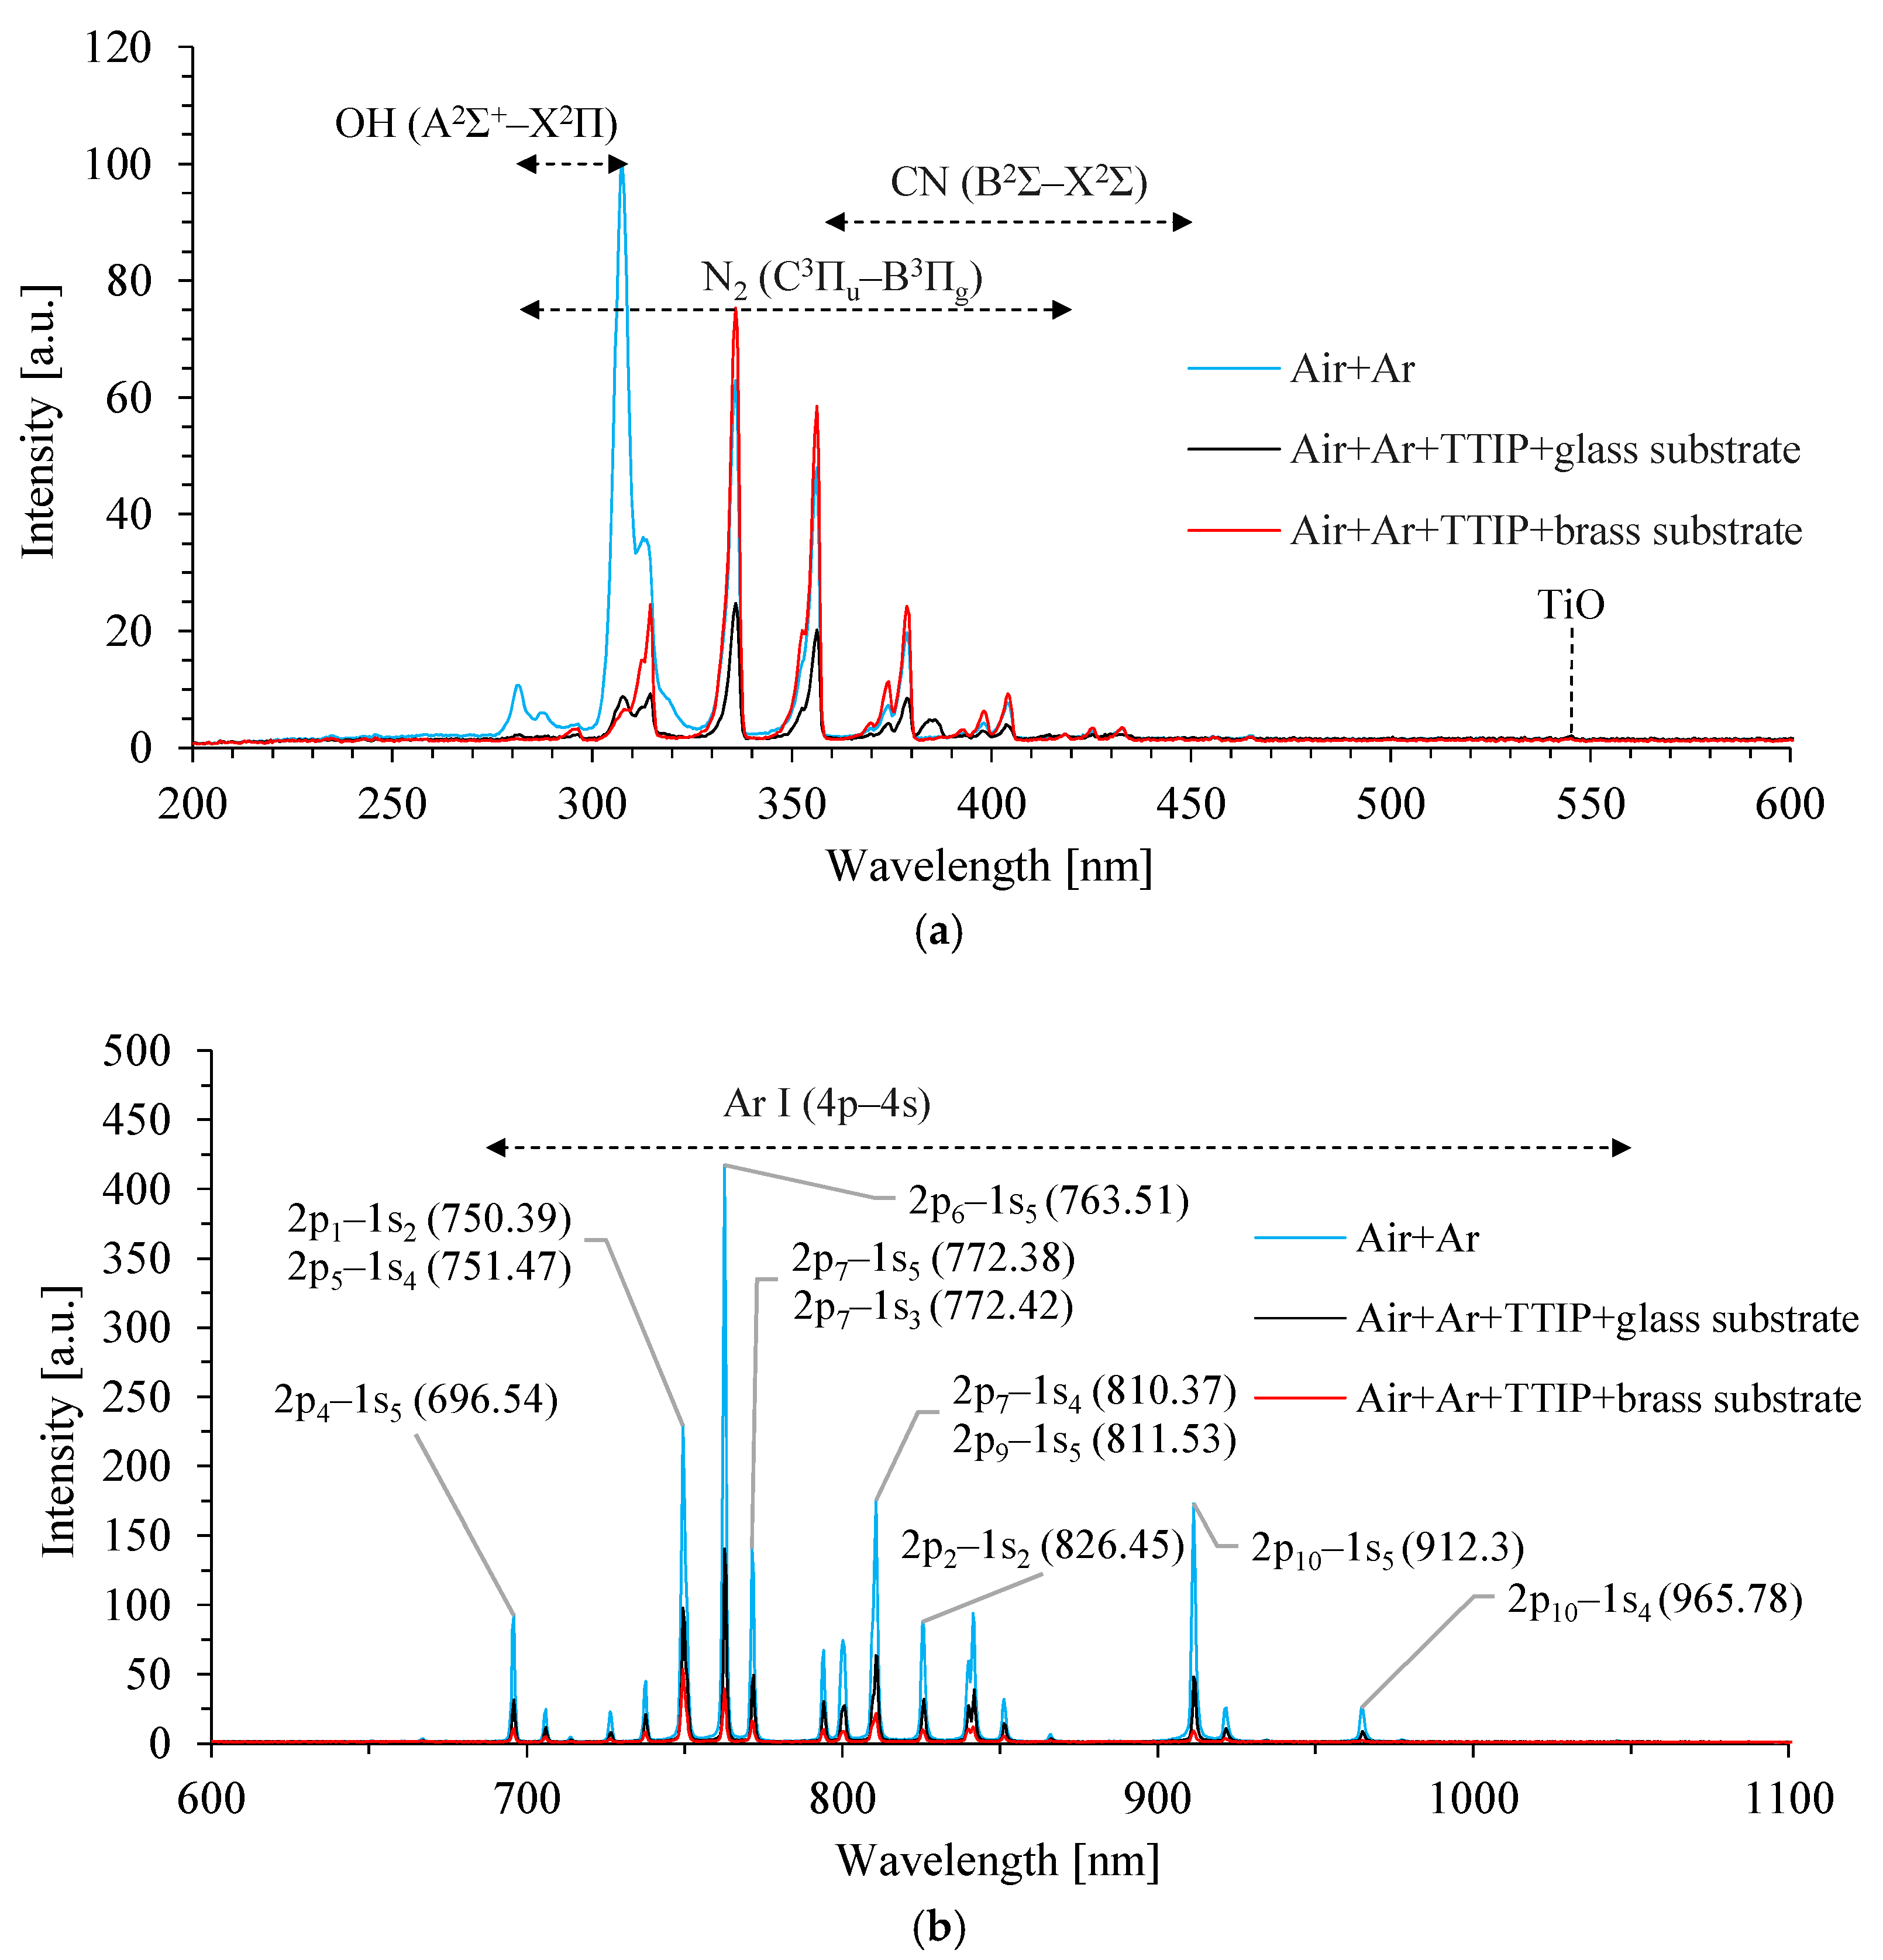
Figure 3 presents typical emission spectra measured during the electric discharge for two gas compositions: a mixture of air and argon (air + Ar), and a mixture of air and argon with TTIP. In the latter case, the spectra were measured for glass and brass substrates. The emission spectra are presented in two spectral ranges: 200–600 nm (Figure 3a) and 600–1100 nm (Figure 3b). In all cases, the emission bands between 280 and 434 nm represent the excitation of OH radicals in the 3064 Å System (A2Σ+–X2Π) (281–309 nm), produced by the dissociation of water vapour in the gaseous phase. N2 molecules generate the optical radiation in the same spectral range, known as the 2nd positive system (N2 (C3Πu-B3Πg)) [,]. The peaks in the range of 695–1040 nm correspond to the excited argon (Ar I), from 2p states (cf. Table 1). The most intense lines are indicated in Figure 3. It can be noticed that with the addition of TTIP, the amplitude of these spectral lines is suppressed because of the decreased mobility of electrons, which are responsible for the excitation and ionisation of gaseous molecules. The second effect is the decrease in electron concentration due to dissociative electron attachment to TTIP molecules []. The bands at approximately 544.83 nm and in the range from 358.39 to 450.22 nm result from the dissociation of TTIP molecules, Ti bonded with oxygen (TiO), and carbon bonded with atomic nitrogen (CN) [].
Figure 3. Emission spectra of thedielectric barrier discharge in a mixture of air + Ar and a mixture of air + Ar with TTIP in the wavelength range of 200 nm–600 nm (a), and 600 nm–1100 nm (b) for glass and brass substrates.
Table 1. Optical emission lines of argon observed in DBD plasma in mixture of air and argon with and without TTIP addition.
The molecular emission bands of CN (B2Σ+–X2Σ+) and TiO, assigned to TTIP decomposition, were observed for both substrates. No emission bands from the Swan molecular system of C2 or atomic emission peaks from atomic hydrogen [] were observed in these spectra.
The obtained emission spectra of argon resulted from the radiative recombination of excited molecules and atoms in collision with electrons.
The excitation processes in the air + Ar mixture occur due to the following electron transitions:
Excitation of nitrogen by electron collision:
N 2 X 1 Σ g + + e N 2 C 3 Π u + e
Ionisation of nitrogen by electron collision:
N 2 X 1 Σ g + + e N 2 + X 2 Σ g + + 2 e
Collision between two nitrogen metastables is also possible:
N 2 A 3 Σ u + + N 2 A 3 Σ u + N 2 B 3 Π g , C 3 Π u , C 3 Π u + e
The peaks from the excited argon atoms (Ar I) could also be present because of the excitation of argon by electron collision in a direct process or because of stepwise excitation through the metastable argon state, which is described by the following:
A r + e A r 4 s , 4 p + e
The presence of energetic electrons in the plasma can initiate dissociation by the dissociative recombination of nitrogen molecular ions []:
N 2 + X 1 Σ g + + e N + N
After dissociative recombination, the obtained molecular ion of atomic nitrogen could bond with an atomic carbon originating from the decomposed TTIP in the electrical discharge, and the excited CN species could then emit a photon via the following reactions:
C S 0 1 + N C N ( B 2 Σ )
C N B 2 Σ C N + h v
CN(B2Σ) can also be obtained from the interaction of atomic carbon with molecular nitrogen in vibrational states [].
In the absence of TTIP, no molecular bands corresponding to CN were observed. The molecular emission bands of CN (B2Σ+–X2Σ+) and TiO in the spectra obtained from the mixture of air and argon with TTIP were attributed to the decomposition of TTIP.
It is also possible to excite a nitrogen molecule or hydroxyl radical via the energy transfer during the collision of these molecules with atomic argon in the metastable state (1s5 or 1s3). The excitation energies from the ground state of N2 to the N2(C3Πu) state for v1 = 0, or the excitation of OH to the OH A2Σ+ state, are about 11.2 eV and 4.2 eV, respectively []. These values of energy are lower than that of the first metastable state of Ar (1s5).
The intensity of N2 SPS and OH bands decreased after changing from the glass to the brass substrate. The intensity of all Ar I emission lines of the discharge for the glass substrate was higher than that for the brass. For the glass substrate, the most intense emission line of Ar I was 763.51 nm, which corresponds to the de-excitation of argon from the state 2p6 to state 1s5. After this emission, the atomic argon transitions to the metastable state. Because the energies of argon in metastable states are relatively high (11.55 eV for 1s5), argon or nitrogen can be more easily excited. In the case of TTIP or water vapour, its dissociation into other products could occur after collision with argon in the metastable state. For the brass substrate, the most intense peak was the sum of emission lines at 750.39 and 751.46 nm, which corresponds to the de-excitation from 2p1 and 2p5 to resonance states 1s2 and 1s4 of Ar, respectively. The energy of radiation from these two resonance-excited states is high enough to photodissociate TTIP into ionic products []. Differences in the emission spectra could be affected by a higher average electron energy in electrical discharge using the glass substrate. The emission lines of Ar I from 2p1 to 2p4 are an effect of excitation from state 1s [].

3.2. TiO2 Layer Properties

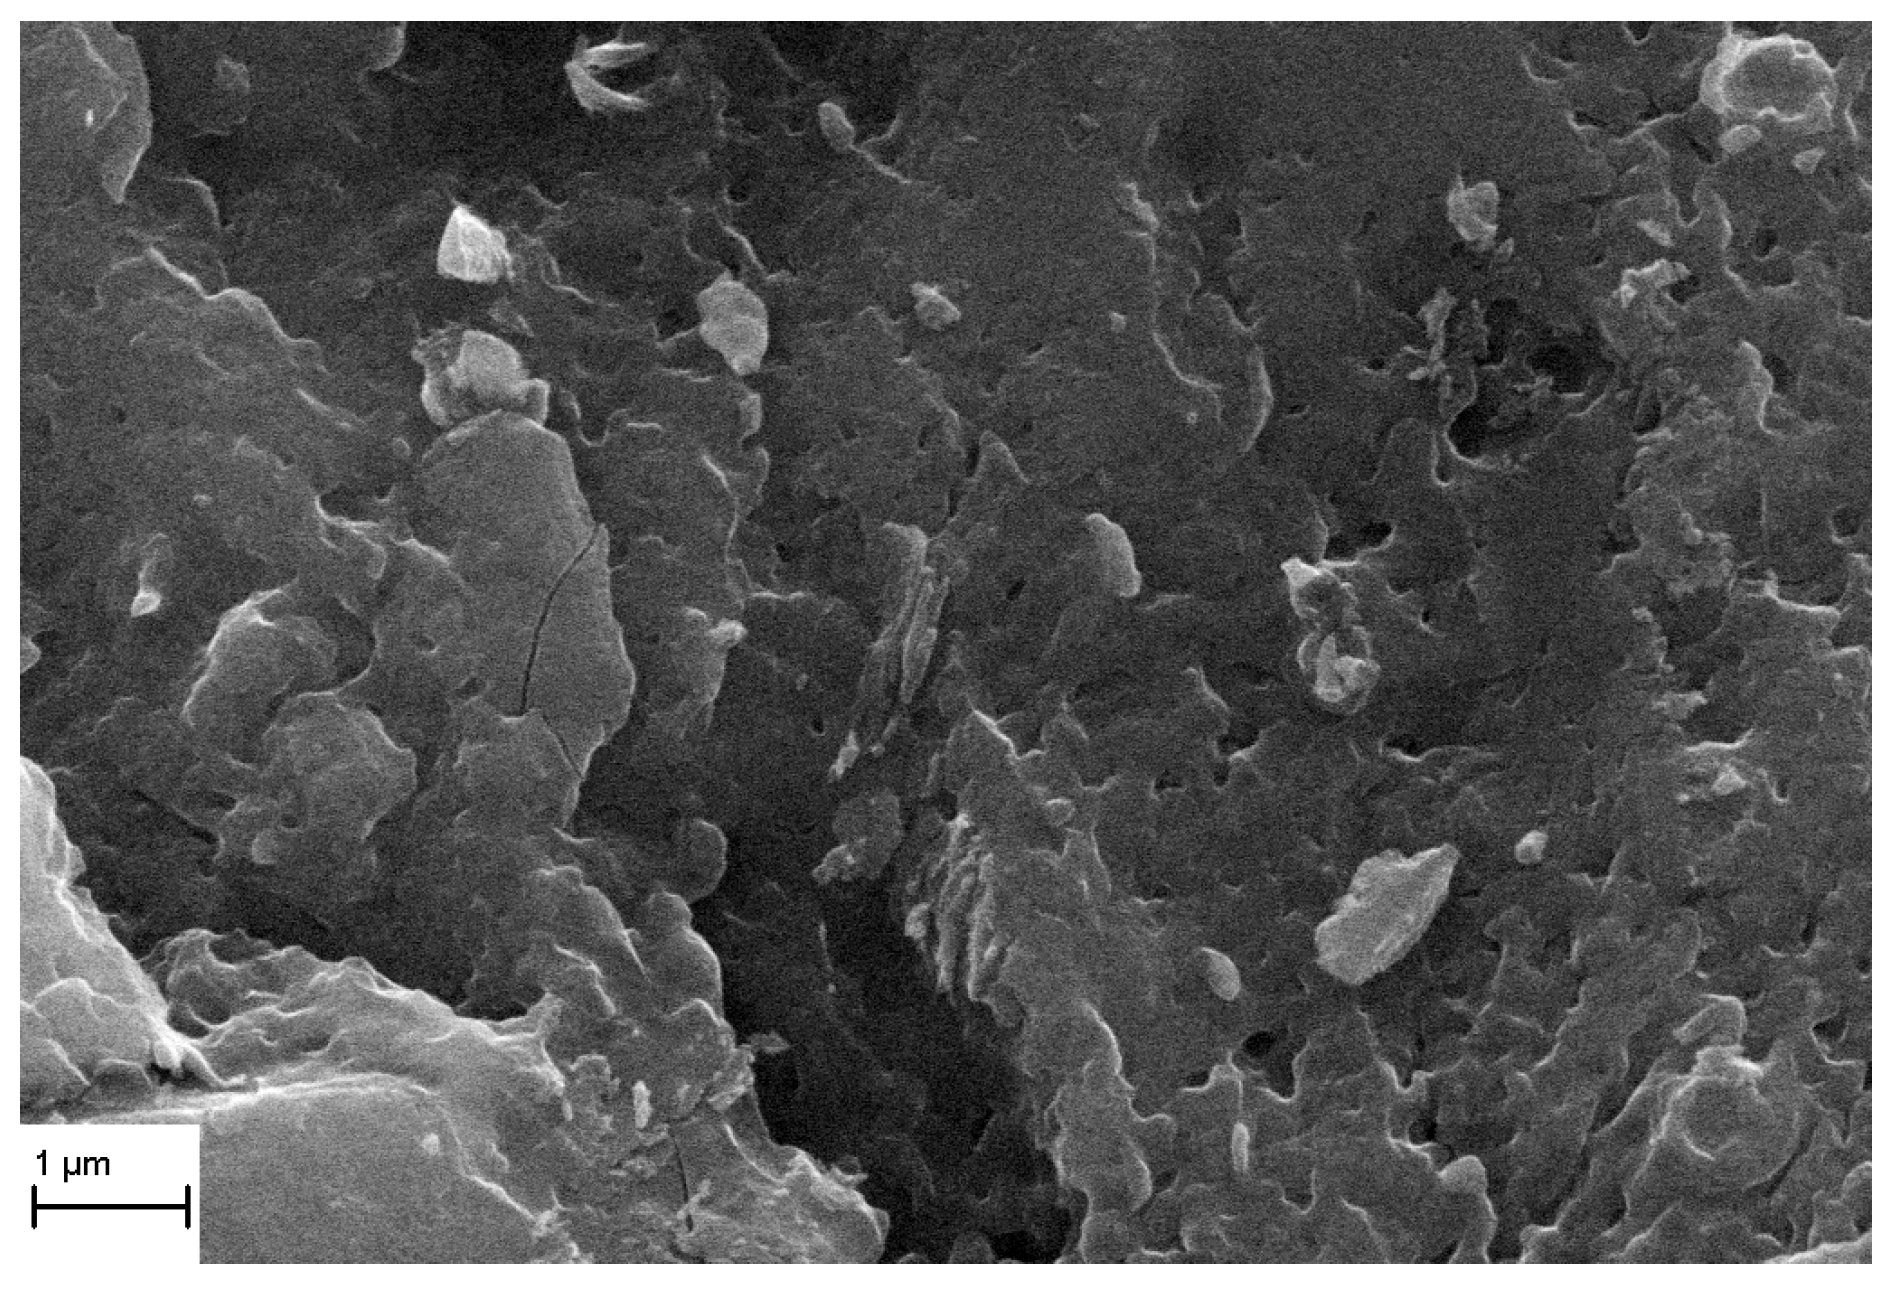
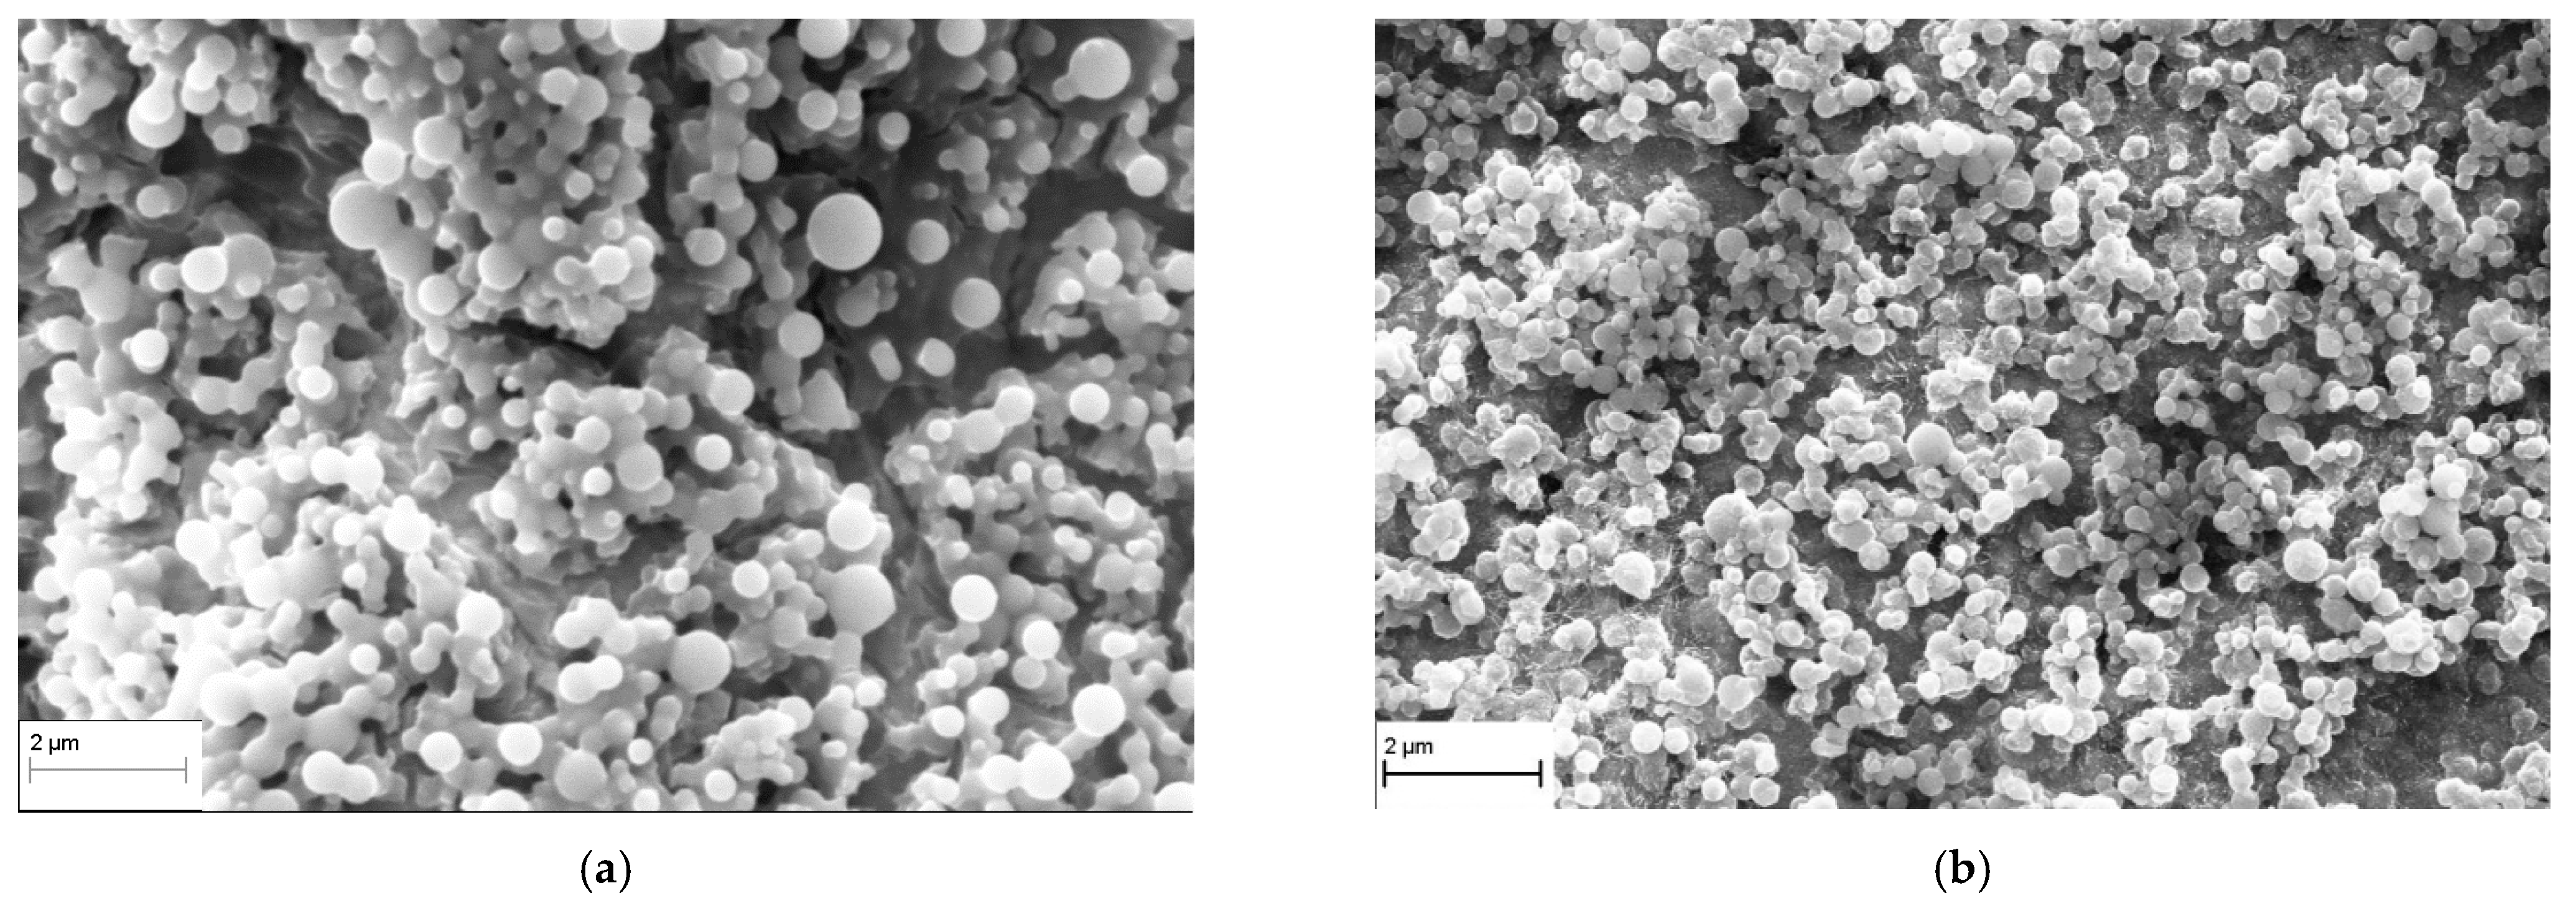
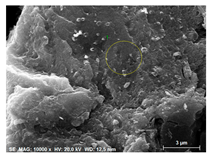
Figure 4 shows a SEM micrograph of a dry TiO2 layer obtained after pouring TTIP in the atmospheric air. Figure 5 and Figure 6 show SEM micrographs of the as-deposited and annealed thin porous layers on the glass (Figure 5) and brass (Figure 6) substrates obtained in the DBD plasma, with an average discharge power of approximately 41 W and 29 W, respectively. The layers are continuous and consist of particles that coalesce to form larger aggregates of round structures. The growth rate was up to 0.5 µm/min for both glass and brass substrates. The particles forming these aggregates are of different sizes, but their diameter is in the range of 100–900 nm (cf. Figure 5a and Figure 6a). Despite the diffuse discharge, the resulting layer is not uniform. In both cases, layer thickness is uneven. Gazal et al. [] and Collette et al. [] obtained relatively uniform TiO2 layers across the entire substrate surface in contact with the plasma column.
After annealing at a temperature of 450 °C for 2 h, the layer morphology changed, forming closely agglomerated islands (Figure 5b and Figure 6b). The size distributions of particles deposited on the glass and brass substrates, before and after annealing, are shown in Figure 7. The mean diameter of particles of the as-deposited layer was 294 nm and 380 nm for glass and brass substrates, respectively (Figure 7c,d). After annealing, the mean diameter of particles deposited on the glass substrate decreased to about 247 nm. For particles deposited on glass and brass substrates using DBD plasma, the reduction in the mean particle diameter was above 100 nm. The differences in the layer morphology obtained on different substrates in the DBD plasma can be explained by the different discharge currents for the conducting (brass) and dielectric (glass) substrates during particle deposition. In the case of the glass substrate, the discharge power was up to twice as high as in the case of the brass substrate.
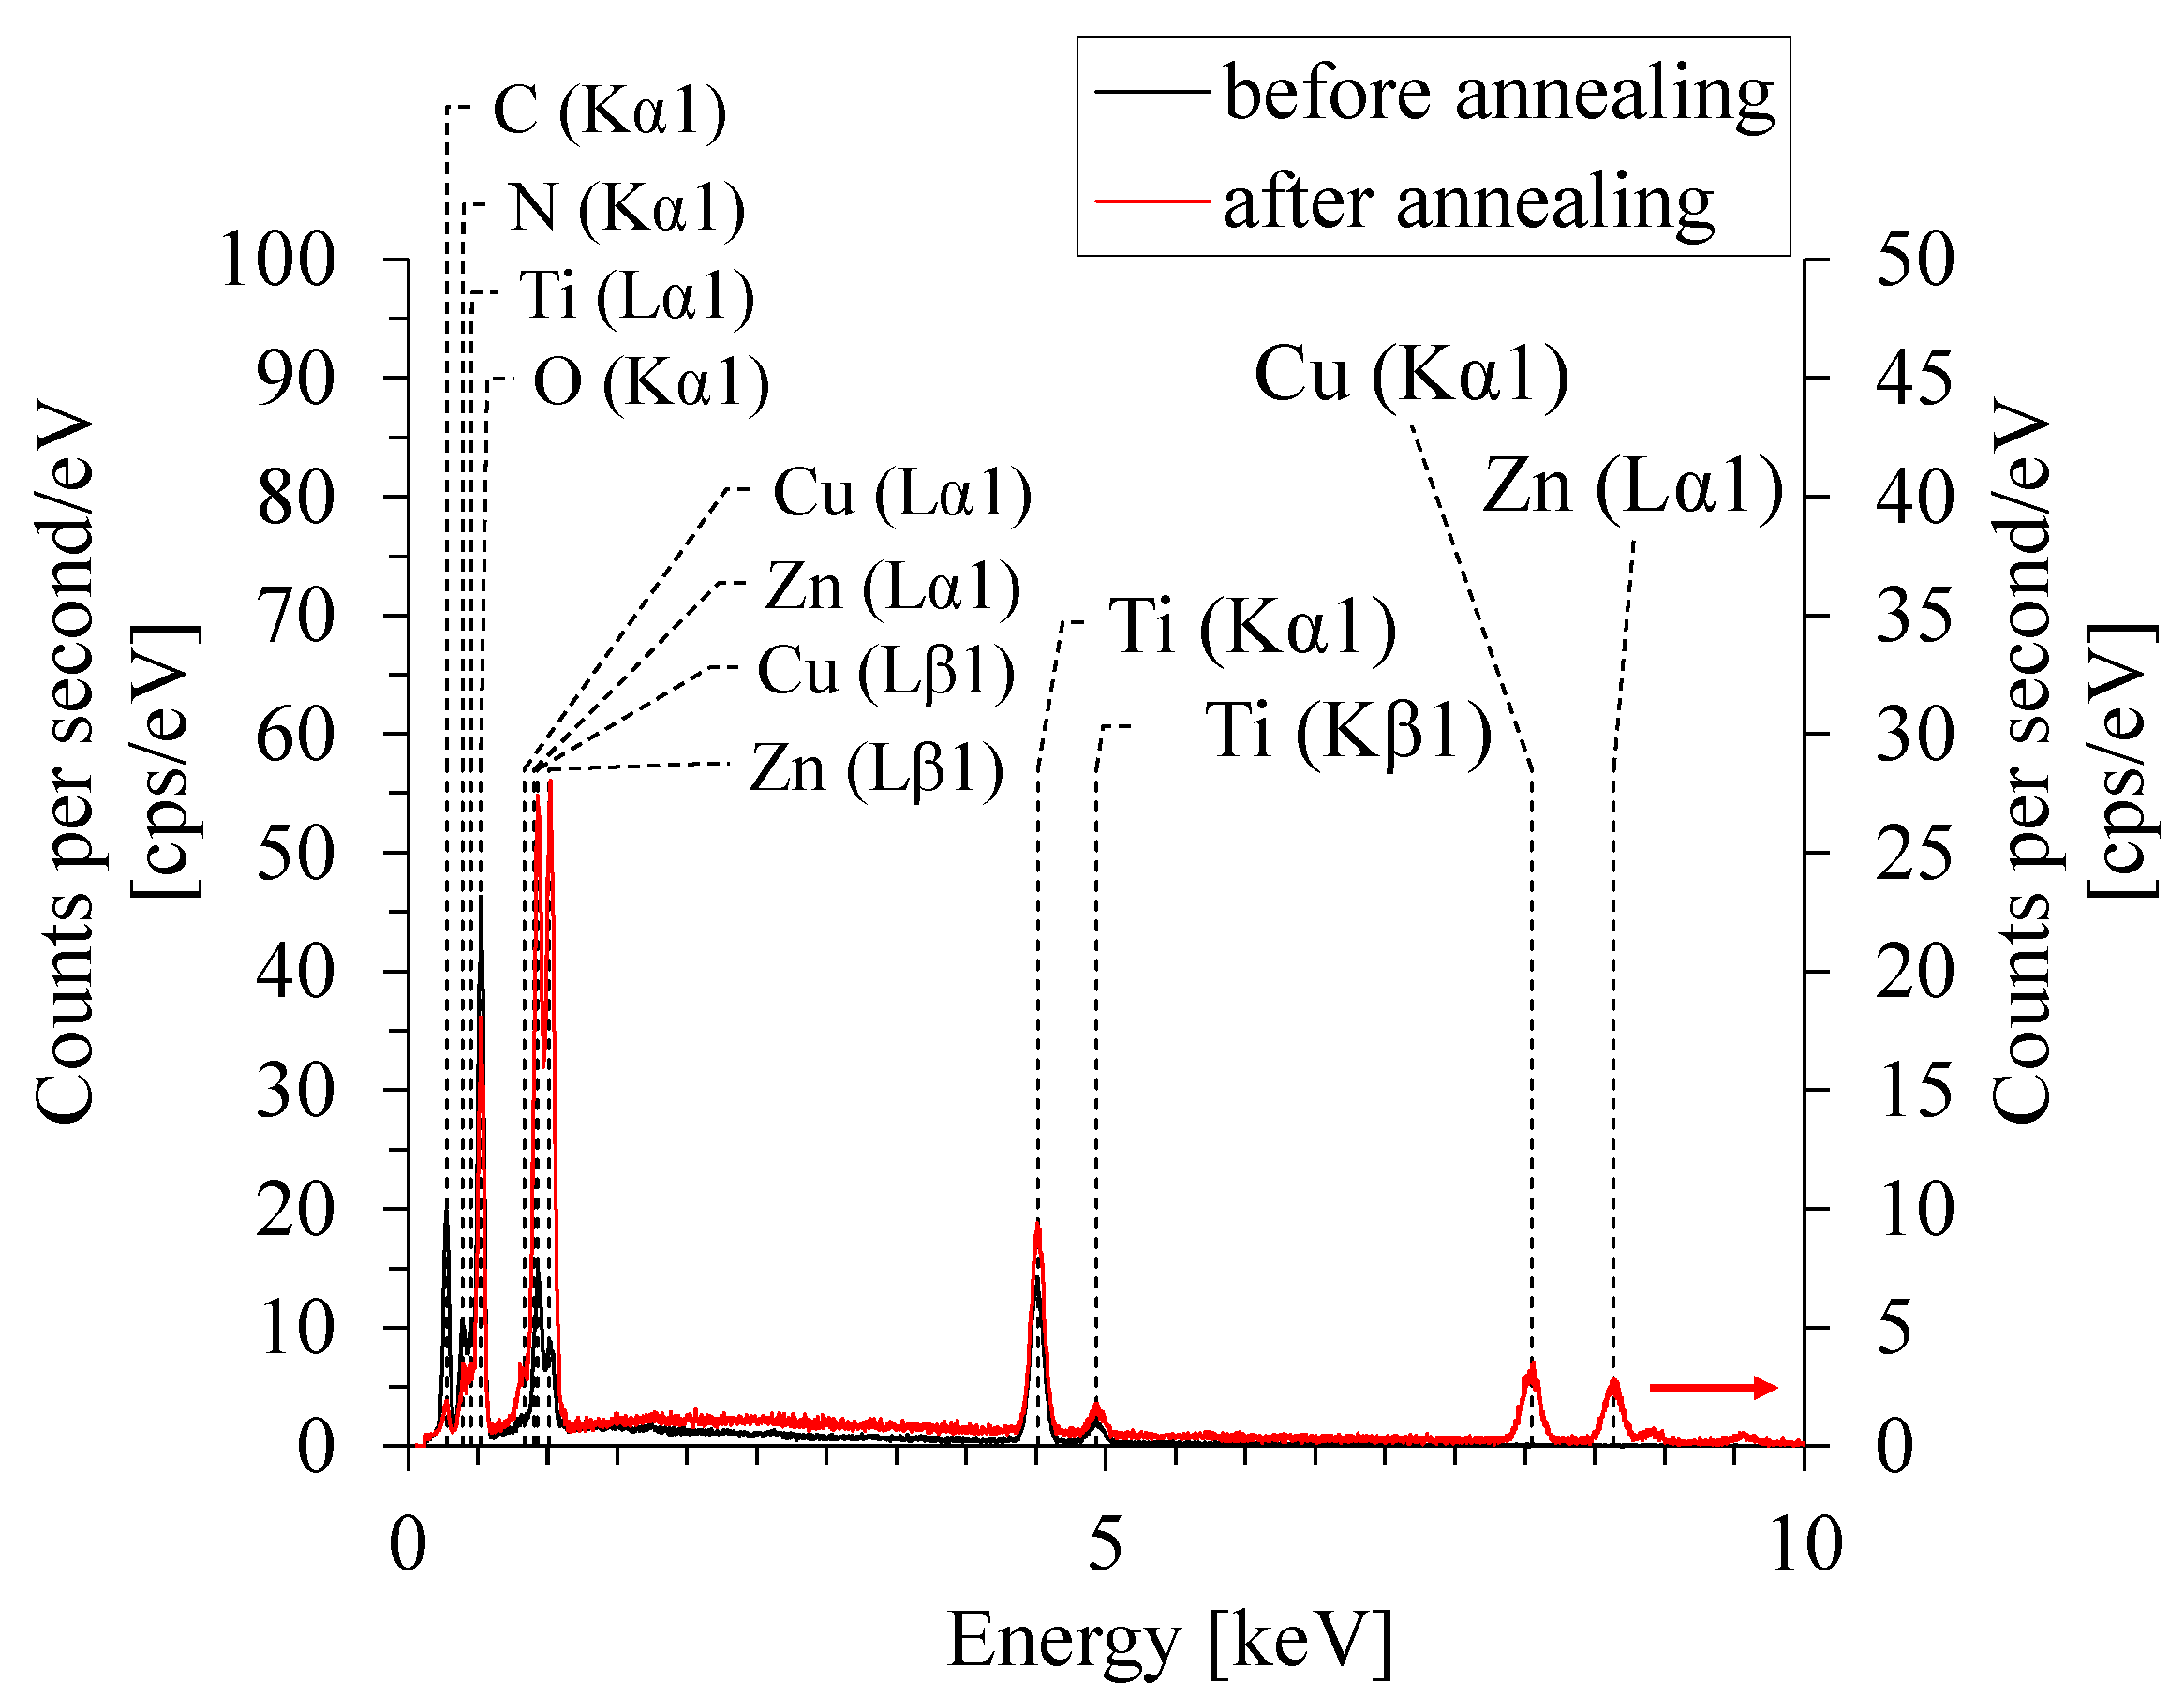
Figure 8 shows the EDS spectra of deposits on the brass substrate before and after annealing. EDS analysis of this deposit before and after annealing showed that the particles and groups of aggregated particles consist of titanium, oxygen, and carbon. Copper, zinc, and other elements are components of the brass substrates. Calcium, potassium, sodium, and other elements in the glass substrate also originate from this substrate. The deposited layers are not continuous, so the electron beam can penetrate the pores, and the EDS analysis can detect peaks originating from the substrates.
Figure 4. A SEM micrograph of the as-deposited TiO2 layer after TTIP casted in atmospheric air onto the glass substrate.
Figure 5. SEM micrographs of the as-deposited TiO2 porous layer on the glass substrate (a) synthesized in DBD plasma at a power of 41 W, and (b) the same layer after 2 h of annealing at 450 °C.
Figure 6. SEM micrographs of the as-deposited TiO2 porous layer on the brass substrate (a) synthesized in DBD at a power of 29 W, and (b) the same layer after 2 h of annealing at 450 °C.
The percentage of carbon decreased after annealing for 2 h at a temperature of 450 °C. Table 2 shows the average atomic composition of the obtained layers before and after annealing for cast TTIP onto the glass substrate and the layer deposited on the glass and brass substrates in DBD, determined by using the EDS method.
Table 2. Average atomic composition of layers of TTIP cast onto glass and deposited on glass and brass substrates using DBD plasma before and after annealing.
EDS analysis showed that the particles and their agglomerates before annealing consisted of titanium, oxygen, and carbon. After annealing, the percentage of carbon decreased. It can be noticed that besides titanium, oxygen, and carbon, elements of the deposited layer, other elements originating from the substrate material also appeared (Table 2).
Figure 7. Size distribution of particles deposited using DBD plasma on glass substrate (a) before annealing and (b) after annealing, and on brass substrate (c) before annealing and (d) after annealing.
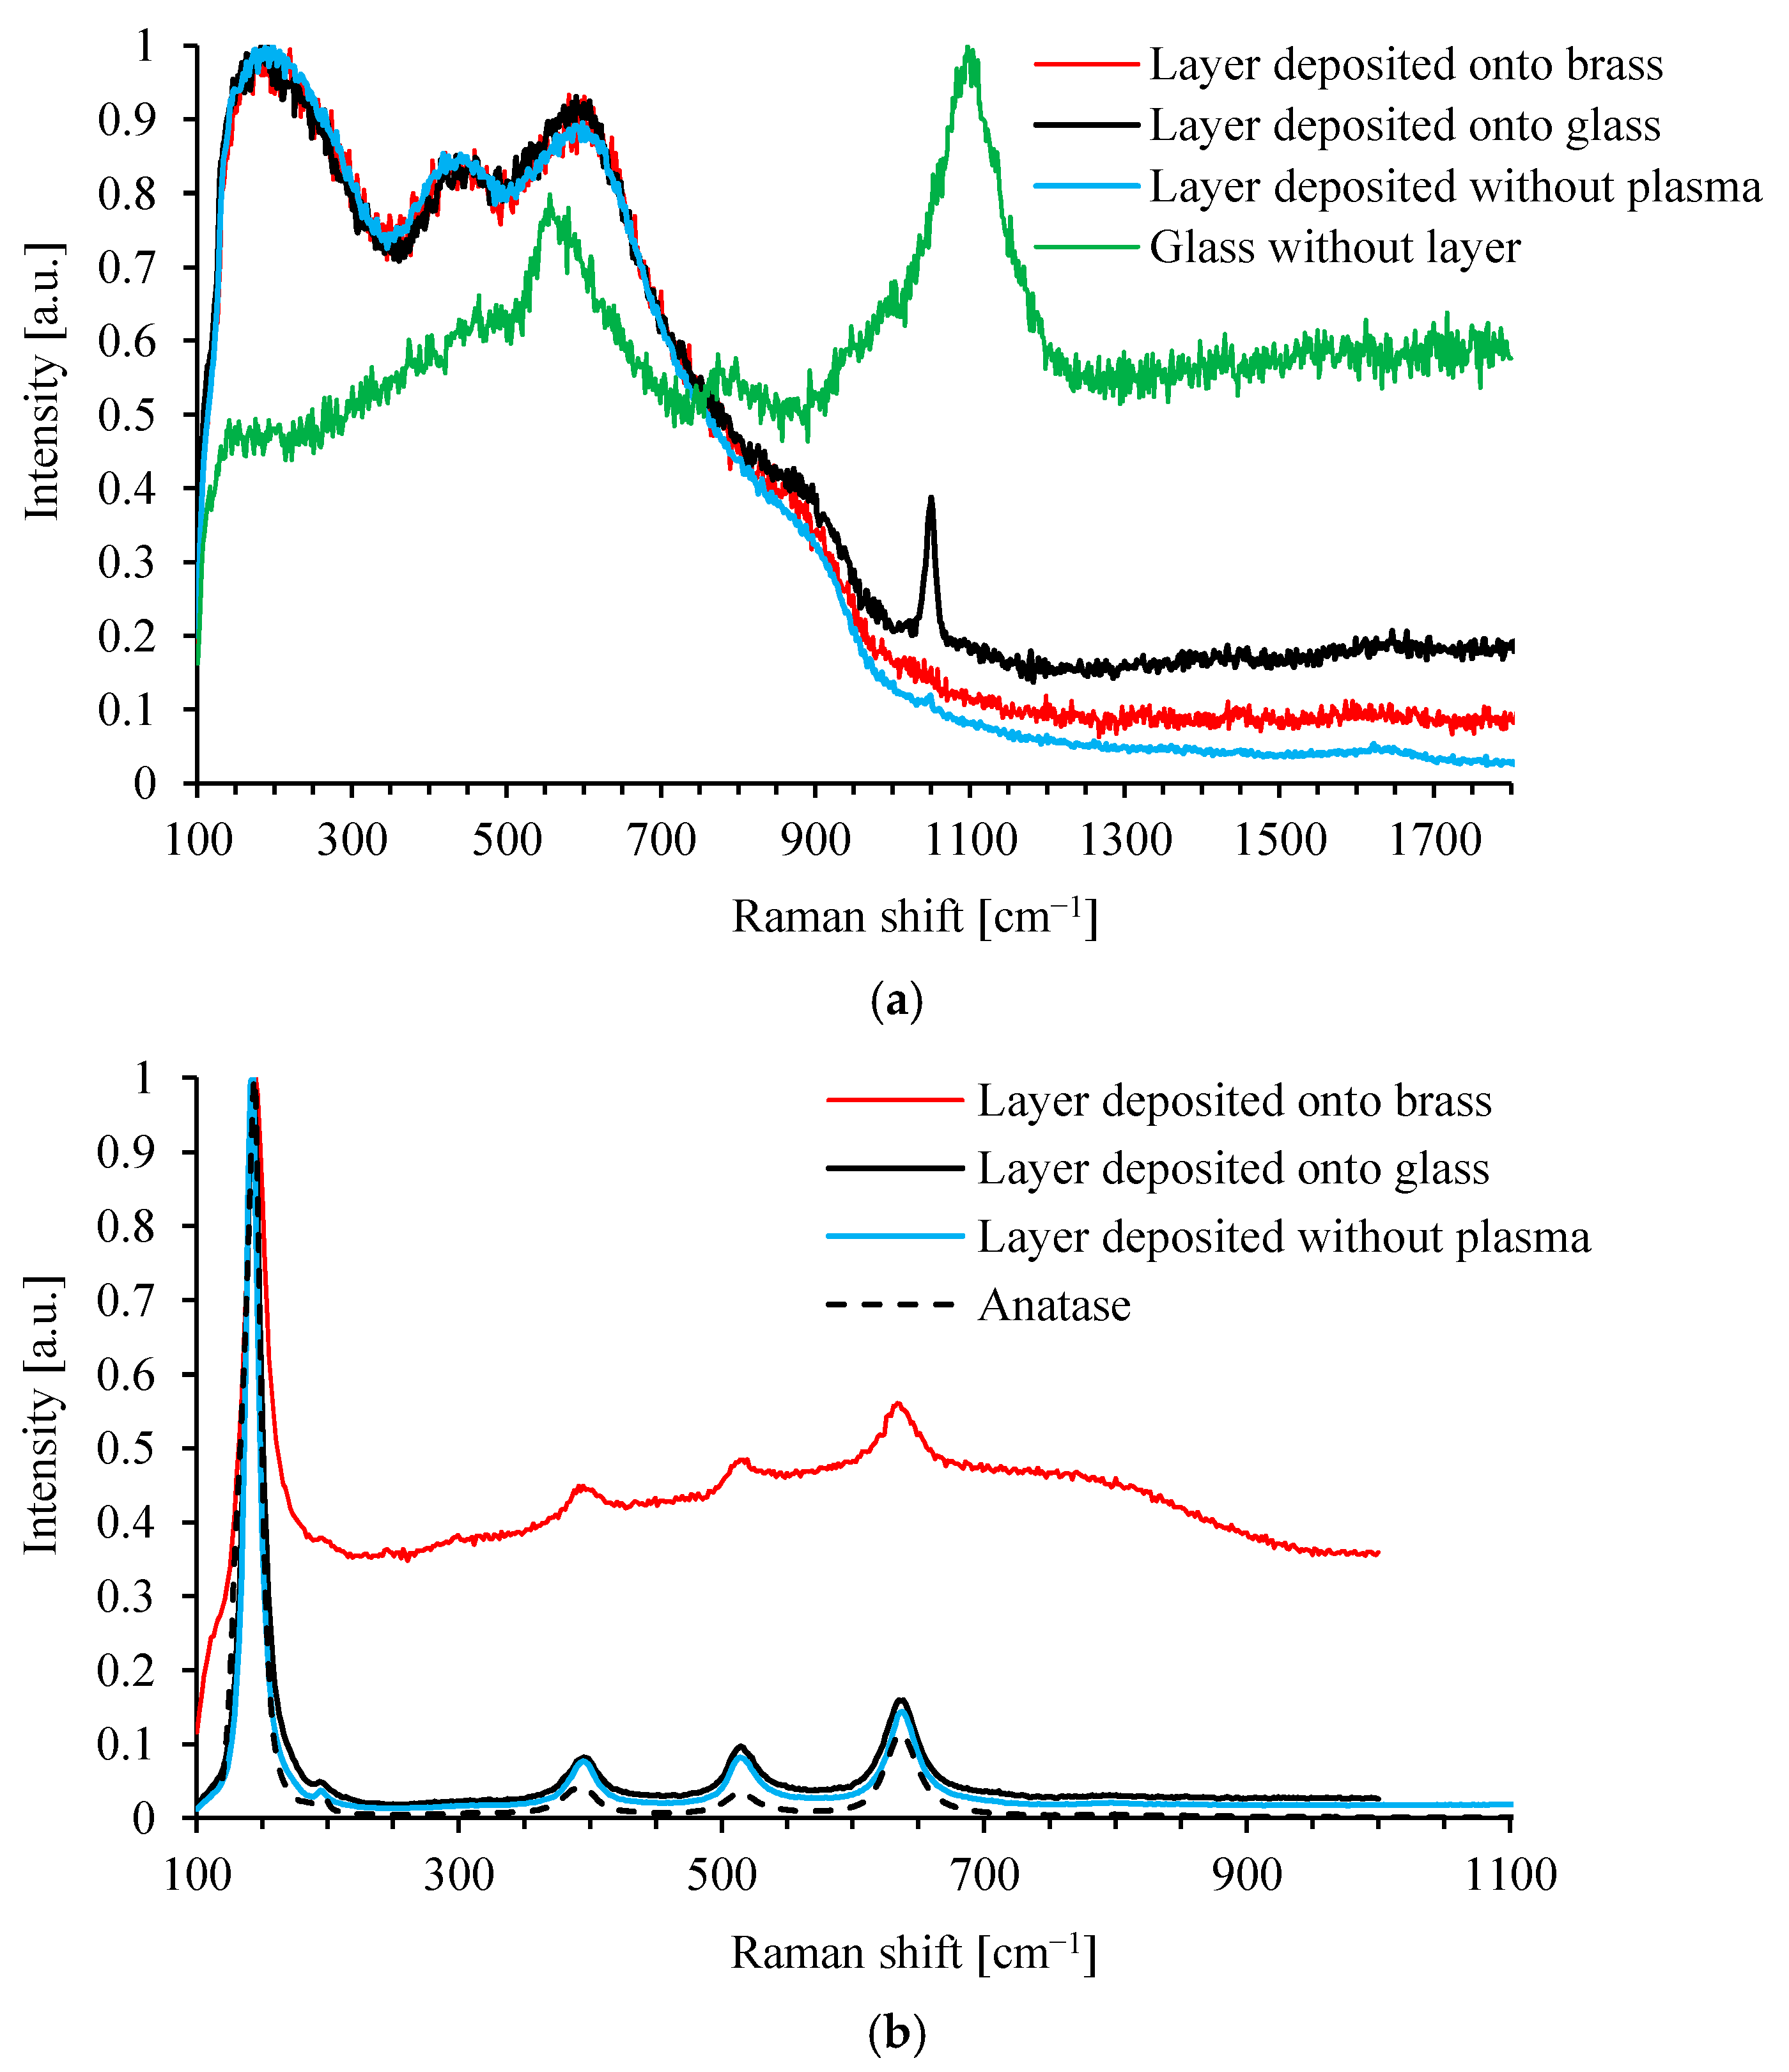
Figure 9 presents the Raman spectra of a thin, as-deposited (Figure 9a) and annealed TiO2 solid layer (Figure 9b), obtained on brass and glass substrates in DBD, and layers deposited without electrical discharge. For comparison, these plots also show the Raman spectra of a glass substrate and a commercially available anatase phase. For all cases, the Raman spectra obtained for the as-deposited layers were similar to those of amorphous TiO2 [,] and have three peaks in the range of 196–201, 423–431, and 605–609 cm−1. Also, a small peak between 790 and 830 cm−1 after deconvolution can be observed. This peak could correspond to the peak observed by Nogueira [] and Shen [] and belong to Ti(OH)4 nanoparticles.
However, after annealing at a temperature of 450 °C, the Raman spectrum of the obtained anatase structure showed peaks at 144, 394, 515, and 637 for Eg1, B1g, A1g, and Eg3, respectively. For the glass substrate, a peak at about 1050 cm−1 appeared, which could correspond to the substrate. In the case of the brass substrate after annealing, the same peaks were superimposed on the luminescence caused by an amorphous thin film synthesised during the decomposition of TTIP.
Figure 8. EDS spectra of TiO2 deposited on brass substrate before and after annealing.
Figure 9. Raman spectra of thin solid TiO2 layer deposited onto brass and glass substrates in DBD and TTIP layer without electrical discharge as deposited (a) and after annealing (b).
Various TTIP reactions under different conditions were investigated to better understand the process of synthesising TiO2 layers [,,]. The synthesis of titanium dioxide particles from TTIP in atmospheric air, which occurs after the reaction of TTIP with water vapor in the gaseous phase, was explained by Fictorie et al. [], who proposed the following reaction:
T i O C H C H 3 2 4 + 2 H 2 O T i O 2 + p r o d u c t s .
In chemical vapour deposition, the formation of TiO2 due to thermal TTIP decomposition depends on the gas temperature, and the process can be separated into two simultaneous reactions []:
T i O C H C H 3 2 4 + 2 H 2 O T i O 2 + 2 C 3 H 6 + 2 C 3 H 7 O H
T i O C H C H 3 2 4 + 2 H 2 O T i O 2 + 4 C 3 H 6 + 2 H 2 O
where reaction (10) occurs under high- and ultra-high-vacuum conditions with temperatures ranging from 550 to 650 K, while reaction (11) takes place at atmospheric pressure and temperatures between 650 and 800 K.
Fang et al. [] showed that TTIP could decompose into titanium hydroxide (Ti(OH)4) rather than TiO2 as the most stable intermediate byproduct of TTIP hydrolysis. The decomposition reaction of TTIP to (Ti(OH)4) is as follows:
T i O C H C H 3 2 4 + 4 H 2 O T i ( O H ) 4 + 4 C 3 H 7 O H
Burger et al. [] proposed a detailed theoretical mechanism of the synthesis of Ti(OH)4 and C3H6 as the final stable products of the thermal decomposition of TTIP at a temperature in the range of 1200–1500 K.
In a non-equilibrium system, such as electric discharge, it is possible to dissociate TTIP into other products via low-energy electron attachment or dissociation ionisation []. To obtain TiO2 after TTIP decomposition in electrical discharge at atmospheric pressure, calcination or annealing is required. The products of annealing of particles or layers of Ti(OH)4 are water vapor and TiO2 of the anatase crystalline structure [,,]:
T i O H 4 a n n e a l i n g T i O 2 + 2 H 2 O
In the case of amorphous TiO2, te annealing also transforms the amorphous phase into the anatase phase.
Therefore, the amorphous TiO2 structure obtained in the DBD plasma changed to anatase after annealing at a temperature of 450 °C for two hours. Some tests were also conducted to obtain the anatase structure directly after layer deposition in the prolonged DBD plasma generated in air with no TTIP feeding; however, the results were unsatisfactory, and no conversion of the amorphous layer to anatase was observed. The gas temperature obtained in the DBD plasma was too low to transform amorphous TiO2 into the anatase phase.

4. Conclusions

DBD plasma has been successfully applied to the deposition of TiO2 thin porous layers using titanium tetraisopropoxide (TTIP) as a precursor. The deposits were produced on a metal or dielectric substrate and annealed at a temperature of 450 °C. The average discharge power during the deposition of nanoparticles in air, argon, and a TTIP mixture was approximately 29 and 41 W for the glass and metal substrates, respectively. SEM analysis of the morphology of the layers indicated that the type of substrate (metal or dielectric) influenced the morphology of the as-deposited layer of TiO2. The porous layer was composed of individual, nearly spherical particles with sizes ranging from 200 to 600 nm. These particles were evenly distributed onto the dielectric substrate (glass), but they formed agglomerates when the substrate was conducting (brass). In both cases, the layers were non-uniform and of uneven thickness.
After annealing at a temperature of 450 °C, both layers were similar in morphology, independent of the substrate properties, forming similar agglomerates. Their crystalline structure changed from amorphous to anatase after annealing. The formation of the anatase structure of TiO2 deposits with subsequent DBD plasma treatment directly after deposition failed. This means that the annealing process is required to convert the DBD-deposited TiO2 layer to the anatase phase. This study proves that a low-power non-thermal plasma can be applied to the formation of TiO2 porous layers from a precursor on a dielectric or metal substrate, and its properties can be adjusted through thermal processing.

Author Contributions

Conceptualization, A.T.S. and A.J.; methodology, A.T.S. and A.J.; validation, A.T.S.; formal analysis, A.T.S.; investigation, A.T.S.; data curation, A.T.S. and A.J.; writing—original draft preparation, A.T.S. and A.J.; writing—review and editing, A.T.S. and A.J.; visualization, A.T.S. and A.J.; supervision, A.J.; project administration, A.T.S. All authors have read and agreed to the published version of the manuscript.

Funding

This paper was internally supported by the Institute of Fluid Flow Machinery, Polish Academy of Sciences, within the project No. O1/T3/Z4.

Institutional Review Board Statement

Not applicable.

Data Availability Statement

Data are available upon request.

Acknowledgments

The authors wish to thank Anna Białous for her technical help in performing the Raman measurements.

Conflicts of Interest

The authors declare no conflicts of interest.

Abbreviations

The following abbreviations are used in this manuscript:
DBDDielectric Barrier Discharge
EDSEnergy-Dispersive Spectroscopy
TTIPTitanium Tetraisopropoxide
MWMicrowave
RFRadio Frequency

References

  1. Adamovich, I.; Agarwal, S.; Ahedo, E.; Alves, L.L.; Baalrud, S.; Babaeva, N.; Bogaerts, A.; Bourdon, A.; Bruggeman, P.J.; Canal, C.; et al. The 2022 Plasma Roadmap: Low Temperature Plasma Science and Technology. J. Phys. D Appl. Phys. 2022, 55, 373001. [Google Scholar] [CrossRef]
  2. Adamovich, I.; Baalrud, S.D.; Bogaerts, A.; Bruggeman, P.J.; Cappelli, M.; Colombo, V.; Czarnetzki, U.; Ebert, U.; Eden, J.G.; Favia, P.; et al. The 2017 Plasma Roadmap: Low Temperature Plasma Science and Technology. J. Phys. D Appl. Phys. 2017, 50, 323001. [Google Scholar] [CrossRef]
  3. Vandenbroucke, A.M.; Morent, R.; De Geyter, N.; Leys, C. Non-Thermal Plasmas for Non-Catalytic and Catalytic VOC Abatement. J. Hazard. Mater. 2011, 195, 30–54. [Google Scholar] [CrossRef]
  4. Fridman, A.; Gutsol, A.; Cho, Y.I. Non-Thermal Atmospheric Pressure Plasma. In Advances in Heat Transfer; Elsevier: Amsterdam, The Netherlands, 2007; Volume 40, pp. 1–142. ISBN 978-0-12-373923-0. [Google Scholar]
  5. Chirokov, A.; Gutsol, A.; Fridman, A. Atmospheric Pressure Plasma of Dielectric Barrier Discharges. Pure Appl. Chem. 2005, 77, 487–495. [Google Scholar] [CrossRef]
  6. Meyer, C.; Franzke, J.; Gurevich, E.L. Experimental Estimation of the Surface Charge Density in Micro Dielectric Barrier Discharges. J. Phys. D Appl. Phys. 2012, 45, 355205. [Google Scholar] [CrossRef]
  7. Sato, S.; Takahashi, M.; Ohnishi, N. Enhanced Electrohydrodynamic Force Generation in a Two-Stroke Cycle Dielectric-Barrier-Discharge Plasma Actuator. Appl. Phys. Lett. 2017, 110, 194101. [Google Scholar] [CrossRef]
  8. Ayan, H.; Fridman, G.; Gutsol, A.F.; Vasilets, V.N.; Fridman, A.; Friedman, G. Nanosecond-Pulsed Uniform Dielectric-Barrier Discharge. IEEE Trans. Plasma Sci. 2008, 36, 504–508. [Google Scholar] [CrossRef]
  9. Tao, S.; Kaihua, L.; Cheng, Z.; Ping, Y.; Shichang, Z.; Ruzheng, P. Experimental Study on Repetitive Unipolar Nanosecond-Pulse Dielectric Barrier Discharge in Air at Atmospheric Pressure. J. Phys. D Appl. Phys. 2008, 41, 215203. [Google Scholar] [CrossRef]
  10. Yehia, A. Characteristics of the Dielectric Barrier Corona Discharges. AIP Adv. 2019, 9, 045214. [Google Scholar] [CrossRef]
  11. Pal, U.N.; Sharma, A.K.; Soni, J.S.; Kr, S.; Khatun, H.; Kumar, M.; Meena, B.L.; Tyagi, M.S.; Lee, B.-J.; Iberler, M.; et al. Electrical Modelling Approach for Discharge Analysis of a Coaxial DBD Tube Filled with Argon. J. Phys. D Appl. Phys. 2009, 42, 045213. [Google Scholar] [CrossRef]
  12. Rahimpour, M.; Taghvaei, H.; Rahimpour, M.R. Degradation of Crystal Violet in Water Solution Using Post Discharge DBD Plasma Treatment: Factorial Design Experiment and Modeling. Chemosphere 2019, 232, 213–223. [Google Scholar] [CrossRef]
  13. Sun, Q.; Yu, B.; Liu, C. Characterization of ZnO Nanotube Fabricated by the Plasma Decomposition of Zn(OH)2 Via Dielectric Barrier Discharge. Plasma Chem. Plasma Process. 2012, 32, 201–209. [Google Scholar] [CrossRef]
  14. Yu, S.J.; Chang, M.B. Oxidative Conversion of PFC via Plasma Processing with Dielectric Barrier Discharges. Plasma Chem. Plasma Process. 2001, 21, 311–327. [Google Scholar] [CrossRef]
  15. Tański, M.; Kocik, M.; Mizeraczyk, J. Liquid Pumping by Miniature Electrohydrodynamic Pump Driven by DC Voltage. In Proceedings of the 2011 IEEE International Conference on Dielectric Liquids, Trondheim, Norway, 26–30 June 2011; IEEE: Piscataway, NJ, USA, 2011; pp. 1–3. [Google Scholar]
  16. Baroch, P.; Saito, N.; Takai, O. Special Type of Plasma Dielectric Barrier Discharge Reactor for Direct Ozonization of Water and Degradation of Organic Pollution. J. Phys. D Appl. Phys. 2008, 41, 085207. [Google Scholar] [CrossRef]
  17. Hama Aziz, K.H.; Miessner, H.; Mahyar, A.; Mueller, S.; Kalass, D.; Moeller, D.; Omer, K.M. Removal of Dichloroacetic Acid from Aqueous Solution Using Non-Thermal Plasma Generated by Dielectric Barrier Discharge and Nano-Pulse Corona Discharge. Sep. Purif. Technol. 2019, 216, 51–57. [Google Scholar] [CrossRef]
  18. Leon-Garzon, A.R.; Dotelli, G.; Tommasini, M.; Bianchi, C.L.; Pirola, C.; Villa, A.; Lucotti, A.; Sacchi, B.; Barbieri, L. Experimental Characterization of Polymer Surfaces Subject to Corona Discharges in Controlled Atmospheres. Polymers 2019, 11, 1646. [Google Scholar] [CrossRef] [PubMed]
  19. Nejman, A.; Kamińska, I.; Cieślak, M. Influence of Corona Discharge on the Surface and Thermal Properties of Aramid Fabrics. Plasma Process. Polym. 2019, 16, 1800194. [Google Scholar] [CrossRef]
  20. Žigon, J.; Petrič, M.; Dahle, S. Dielectric Barrier Discharge (DBD) Plasma Pretreatment of Lignocellulosic Materials in Air at Atmospheric Pressure for Their Improved Wettability: A Literature Review. Holzforschung 2018, 72, 979–991. [Google Scholar] [CrossRef]
  21. Krupa, A.; Sobczyk, A.T.; Jaworek, A. Surface Properties of Plasma-Modified Poly (Vinylidene Fluoride) and Poly (Vinyl Chloride) Nanofibres. Fibres Text. East. Eur. 2014, 22, 35–39. [Google Scholar]
  22. Rajasekaran, P.; Mertmann, P.; Bibinov, N.; Wandke, D.; Viöl, W.; Awakowicz, P. Filamentary and Homogeneous Modes of Dielectric Barrier Discharge (DBD) in Air: Investigation through Plasma Characterization and Simulation of Surface Irradiation. Plasma Process. Polym. 2010, 7, 665–675. [Google Scholar] [CrossRef]
  23. Fang, Z.; Lin, J.; Xie, X.; Qiu, Y.; Kuffel, E. Experimental Study on the Transition of the Discharge Modes in Air Dielectric Barrier Discharge. J. Phys. D Appl. Phys. 2009, 42, 085203. [Google Scholar] [CrossRef]
  24. Tański, M.; Reza, A.; Przytuła, D.; Garasz, K. Ozone Generation by Surface Dielectric Barrier Discharge. Appl. Sci. 2023, 13, 7001. [Google Scholar] [CrossRef]
  25. Gouri, R.; Zouzou, N.; Tilmatine, A.; Moreau, E.; Dascalescu, L. Collection Efficiency of Submicrometre Particles Using Single and Double DBD in a Wire-to-Square Tube ESP. J. Phys. D: Appl. Phys. 2011, 44, 495201. [Google Scholar] [CrossRef]
  26. Nadjem, A.; Kachi, M.; Bekkara, F.; Medles, K.; Zeghloul, T.; Dascalescu, L. Triboelectrification of Granular Insulating Materials as Affected by Dielectric Barrier Discharge (DBD) Treatment. J. Electrostat. 2017, 86, 18–23. [Google Scholar] [CrossRef]
  27. Jodzis, S.; Patkowski, W. Macrokinetic Study on Ozone Boundary Concentration. Effect of Temperature. J. Electrostat. 2017, 85, 43–51. [Google Scholar] [CrossRef]
  28. Ono, R.; Oda, T. Ozone Production Process in Pulsed Positive Dielectric Barrier Discharge. J. Phys. D Appl. Phys. 2007, 40, 176–182. [Google Scholar] [CrossRef]
  29. Williamson, J.M.; Trump, D.D.; Bletzinger, P.; Ganguly, B.N. Comparison of High-Voltage Ac and Pulsed Operation of a Surface Dielectric Barrier Discharge. J. Phys. D Appl. Phys. 2006, 39, 4400–4406. [Google Scholar] [CrossRef]
  30. Avramidis, G.; Stüwe, B.; Wascher, R.; Bellmann, M.; Wieneke, S.; Von Tiedemann, A.; Viöl, W. Fungicidal Effects of an Atmospheric Pressure Gas Discharge and Degradation Mechanisms. Surf. Coat. Technol. 2010, 205, S405–S408. [Google Scholar] [CrossRef]
  31. Usta, Y.H.; Çukur, E.; Yıldırım, Ç.; Ercan, U.K. Design of a Portable, Battery-Powered Non-Thermal Atmospheric Plasma Device and Characterization of Its Antibacterial Efficacies. J. Electrostat. 2019, 99, 1–8. [Google Scholar] [CrossRef]
  32. Kim, M.C.; Klages, C.-P. One-Step Process to Deposit a Soft Super-Hydrophobic Film by Filamentary Dielectric Barrier Discharge-Assisted CVD Using HMCTSO as a Precursor. Surf. Coat. Technol. 2009, 204, 428–432. [Google Scholar] [CrossRef]
  33. Martens, U.; Thejaswini, H.C.; Majumdar, A.; Hippler, R. Deposition of Amorphous Hydrogenated Carbon Nitride Films with a Dielectric Barrier Discharge. Plasma Process. Polym. 2012, 9, 647–651. [Google Scholar] [CrossRef]
  34. Abdelaziz, A.A.; Ishijima, T.; Seto, T. Humidity Effects on Surface Dielectric Barrier Discharge for Gaseous Naphthalene Decomposition. Phys. Phys. Phys. of Plasmas 2018, 25, 043512. [Google Scholar] [CrossRef]
  35. Ye, Z.L.; Shen, Y.; Xi, R.Z.; Hou, H.Q. Destruction of Benzene in an Air Stream by the Outer Combined Plasma Photolysis Method. J. Phys. D Appl. Phys. 2008, 41, 025201. [Google Scholar] [CrossRef]
  36. Mok, Y.S.; Jo, J.-O. Degradation of Organic Contaminant by Using Dielectric Barrier Discharge Reactor Immersed in Wastewater. IEEE Trans. Plasma Sci. 2006, 34, 2624–2629. [Google Scholar] [CrossRef]
  37. Shibata, T.; Nishiyama, H. Water Treatment by Dielectric Barrier Discharge Tube with Vapor Flow. Int. J. Plasma Environ. Sci. Technol. 2017, 11, 112–117. [Google Scholar]
  38. Massines, F.; Gouda, G.; Gherardi, N.; Duran, M.; Croquesel, E. The Role of Dielectric Barrier Discharge Atmosphere and Physics on Polypropylene Surface Treatment. Plasma Process. Polym. 2001, 6, 35–49. [Google Scholar] [CrossRef]
  39. Zaleska, A.; Hanel, A.; Nischk, M. Photocatalytic Air Purification. Recent Pat. Eng. 2010, 4, 200–216. [Google Scholar] [CrossRef]
  40. Dodoo-Arhin, D.; Buabeng, F.P.; Mwabora, J.M.; Amaniampong, P.N.; Agbe, H.; Nyankson, E.; Obada, D.O.; Asiedu, N.Y. The Effect of Titanium Dioxide Synthesis Technique and Its Photocatalytic Degradation of Organic Dye Pollutants. Heliyon 2018, 4, e00681. [Google Scholar] [CrossRef]
  41. Haque, F.; Blanchard, A.; Laipply, B.; Dong, X. Visible-Light-Activated TiO2-Based Photocatalysts for the Inactivation of Pathogenic Bacteria. Catalysts 2024, 14, 855. [Google Scholar] [CrossRef]
  42. Gosavi, S.; Tabei, R.; Roy, N.; Latthe, S.S.; Hunge, Y.M.; Suzuki, N.; Kondo, T.; Yuasa, M.; Teshima, K.; Fujishima, A.; et al. Low Temperature Deposition of TiO2 Thin Films through Atmospheric Pressure Plasma Jet Processing. Catalysts 2021, 11, 91. [Google Scholar] [CrossRef]
  43. Yang, W.; Wolden, C.A. Plasma-Enhanced Chemical Vapor Deposition of TiO2 Thin Films for Dielectric Applications. Thin Solid Films 2006, 515, 1708–1713. [Google Scholar] [CrossRef]
  44. Aita, T.; Ogawa, K.; Saito, Y.; Sumiyoshi, Y.; Higuchi, T.; Sato, S. Microstructures of SiO2 and TiOX Films Deposited by Atmospheric Pressure Inductively Coupled Micro-Plasma Jet. Surf. Coat. Technol. 2010, 205, 861–866. [Google Scholar] [CrossRef]
  45. Yamauchi, S.; Suzuki, H.; Akutsu, R. Plasma-Assisted Chemical Vapor Deposition of Titanium Oxide Layer at Room-Temperature. J. Cryst. Process Technol. 2014, 4, 20–26. [Google Scholar] [CrossRef]
  46. Gazal, Y.; Chazelas, C.; Dublanche-Tixier, C.; Tristant, P. Contribution of Optical Emission Spectroscopy Measurements to the Understanding of TiO2 Growth by Chemical Vapor Deposition Using an Atmospheric-Pressure Plasma Torch. J. Appl. Phys. 2017, 121, 123301. [Google Scholar] [CrossRef]
  47. Collette, S.; Hubert, J.; Batan, A.; Baert, K.; Raes, M.; Vandendael, I.; Daniel, A.; Archambeau, C.; Terryn, H.; Reniers, F. Photocatalytic TiO2 Thin Films Synthesized by the Post-Discharge of an RF Atmospheric Plasma Torch. Surf. Coat. Technol. 2016, 289, 172–178. [Google Scholar] [CrossRef]
  48. Pearse, R.W.B.; Gaydon, A.G. The Identification of Molecular Spectra, 4th ed.; Chapman and Hall: London, NY, USA, 1976; ISBN 0-470-15164-1. [Google Scholar]
  49. Czech, T.; Sobczyk, A.T.; Jaworek, A. Light Emission Spectra of Molecules in Negative and Positive Back Discharges in Nitrogen with Carbon Dioxide Mixture at Atmospheric Pressure. Eur. Phys. J. D 2015, 69, 223. [Google Scholar] [CrossRef]
  50. Boffard, J.B.; Piech, G.A.; Gehrke, M.F.; Anderson, L.W.; Lin, C.C. Measurement of Electron-Impact Excitation Cross Sections out of Metastable Levels of Argon and Comparison with Ground-State Excitation. Phys. Rev. A 1999, 59, 2749–2763. [Google Scholar] [CrossRef]
  51. Sobczyk, A.T.; Jaworek, A. Carbon Microstructures Synthesis in Low Temperature Plasma Generated by Microdischarges. Appl. Sci. 2021, 11, 5845. [Google Scholar] [CrossRef]
  52. Rincón, R.; Muñoz, J.; Sáez, M.; Calzada, M.D. Spectroscopic Characterization of Atmospheric Pressure Argon Plasmas Sustained with the Torche à Injection Axiale Sur Guide d’Ondes. Spectrochim. Acta Part B At. Spectrosc. 2013, 81, 26–35. [Google Scholar] [CrossRef]
  53. Kułakowska-Pawlak, B.; Żyrnicki, W. Characterization of a d.c. Titanium Tetraisopropoxide/Plasma Using Emission Spectroscopy. Thin Solid Films 1995, 266, 8–13. [Google Scholar] [CrossRef]
  54. Jamróz, P.; Żyrnicki, W.; Pohl, P. The Effect of a Miniature Argon Flow Rate on the Spectral Characteristics of a Direct Current Atmospheric Pressure Glow Micro-Discharge between an Argon Microjet and a Small Sized Flowing Liquid Cathode. Spectrochim. Acta Part B At. Spectrosc. 2012, 73, 26–34. [Google Scholar] [CrossRef]
  55. Ershov, K.S.; Kochubei, S.A.; Kiselev, V.G.; Baklanov, A.V. Decomposition Pathways of Titanium Isopropoxide Ti(Oi Pr)4: New Insights from UV-Photodissociation Experiments and Quantum Chemical Calculations. J. Phys. Chem. A 2018, 122, 1064–1070. [Google Scholar] [CrossRef] [PubMed]
  56. Zhang, Y.-H.; Chan, C.K.; Porter, J.F.; Guo, W. Micro-Raman Spectroscopic Characterization of Nanosized TiO2 Powders Prepared by Vapor Hydrolysis. J. Mater. Res. 1998, 13, 2602–2609. [Google Scholar] [CrossRef]
  57. Di, L.-B.; Li, X.-S.; Shi, C.; Xu, Y.; Zhao, D.-Z.; Zhu, A.-M. Atmospheric-Pressure Plasma CVD of TiO2 Photocatalytic Films Using Surface Dielectric Barrier Discharge. J. Phys. D Appl. Phys. 2009, 42, 032001. [Google Scholar] [CrossRef]
  58. Nogueira, A.E.; Ribeiro, L.S.; Gorup, L.F.; Silva, G.T.S.T.; Silva, F.F.B.; Ribeiro, C.; Camargo, E.R. New Approach of the Oxidant Peroxo Method (OPM) Route to Obtain Ti(OH)4 Nanoparticles with High Photocatalytic Activity under Visible Radiation. Int. J. Photoenergy 2018, 2018, 6098302. [Google Scholar] [CrossRef]
  59. Shen, M.; Wang, M.; Wang, Q.; Tian, J.; Zhang, L.; Wang, L.; Shi, J. A Ti-OH Bond Breaking Route for Creating Oxygen Vacancy in Titania towards Efficient CO2 Photoreduction. Chem. Eng. J. 2021, 425, 131513. [Google Scholar] [CrossRef]
  60. Fictorie, C.P.; Evans, J.F.; Gladfelter, W.L. Kinetic and Mechanistic Study of the Chemical Vapor Deposition of Titanium Dioxide Thin Films Using Tetrakis-(Isopropoxo)-Titanium(IV). J. Vac. Sci. Technol. A Vac. Surf. Film. 1994, 12, 1108–1113. [Google Scholar] [CrossRef]
  61. Fang, J.; Wang, Y.; Kangasluoma, J.; Attoui, M.; Junninen, H.; Kulmala, M.; Petäjä, T.; Biswas, P. Cluster Formation Mechanisms of Titanium Dioxide during Combustion Synthesis: Observation with an APi-TOF. Aerosol Sci. Technol. 2017, 51, 1071–1081. [Google Scholar] [CrossRef]
  62. Buerger, P.; Nurkowski, D.; Akroyd, J.; Kraft, M. A Kinetic Mechanism for the Thermal Decomposition of Titanium Tetraisopropoxide. Proc. Combust. Inst. 2017, 36, 1019–1027. [Google Scholar] [CrossRef]
  63. Bjarnason, E.H.; Ómarsson, B.; Engmann, S.; Ómarsson, F.H.; Ingólfsson, O. Dissociative Electron Attachment to Titatinum Tetrachloride and Titanium Tetraisopropoxide. Eur. Phys. J. D 2014, 68, 121. [Google Scholar] [CrossRef]
  64. Baszczuk, A.; Jasiorski, M.; Winnicki, M. Low-Temperature Transformation of Amorphous Sol–Gel TiO2 Powder to Anatase During Cold Spray Deposition. J. Therm. Spray Technol. 2018, 27, 1551–1562. [Google Scholar] [CrossRef]
Disclaimer/Publisher’s Note: The statements, opinions and data contained in all publications are solely those of the individual author(s) and contributor(s) and not of MDPI and/or the editor(s). MDPI and/or the editor(s) disclaim responsibility for any injury to people or property resulting from any ideas, methods, instructions or products referred to in the content.

Article Metrics

Citations

Article Access Statistics

Multiple requests from the same IP address are counted as one view.